
Recognition of Fine-Grained Walking Patterns Using a Smartwatch with Deep Attentive Neural Networks


Abstract
:1. Introduction
- We defined a set of fine-grained walking styles that appear every day and proposed a wearable system that can recognize these predefined patterns in a supervised fashion.
- We conducted an experiment to validate the feasibility of an intelligent wearable system with feature-based machine learning and recent deep learning algorithms, including attention-based deep neural networks.
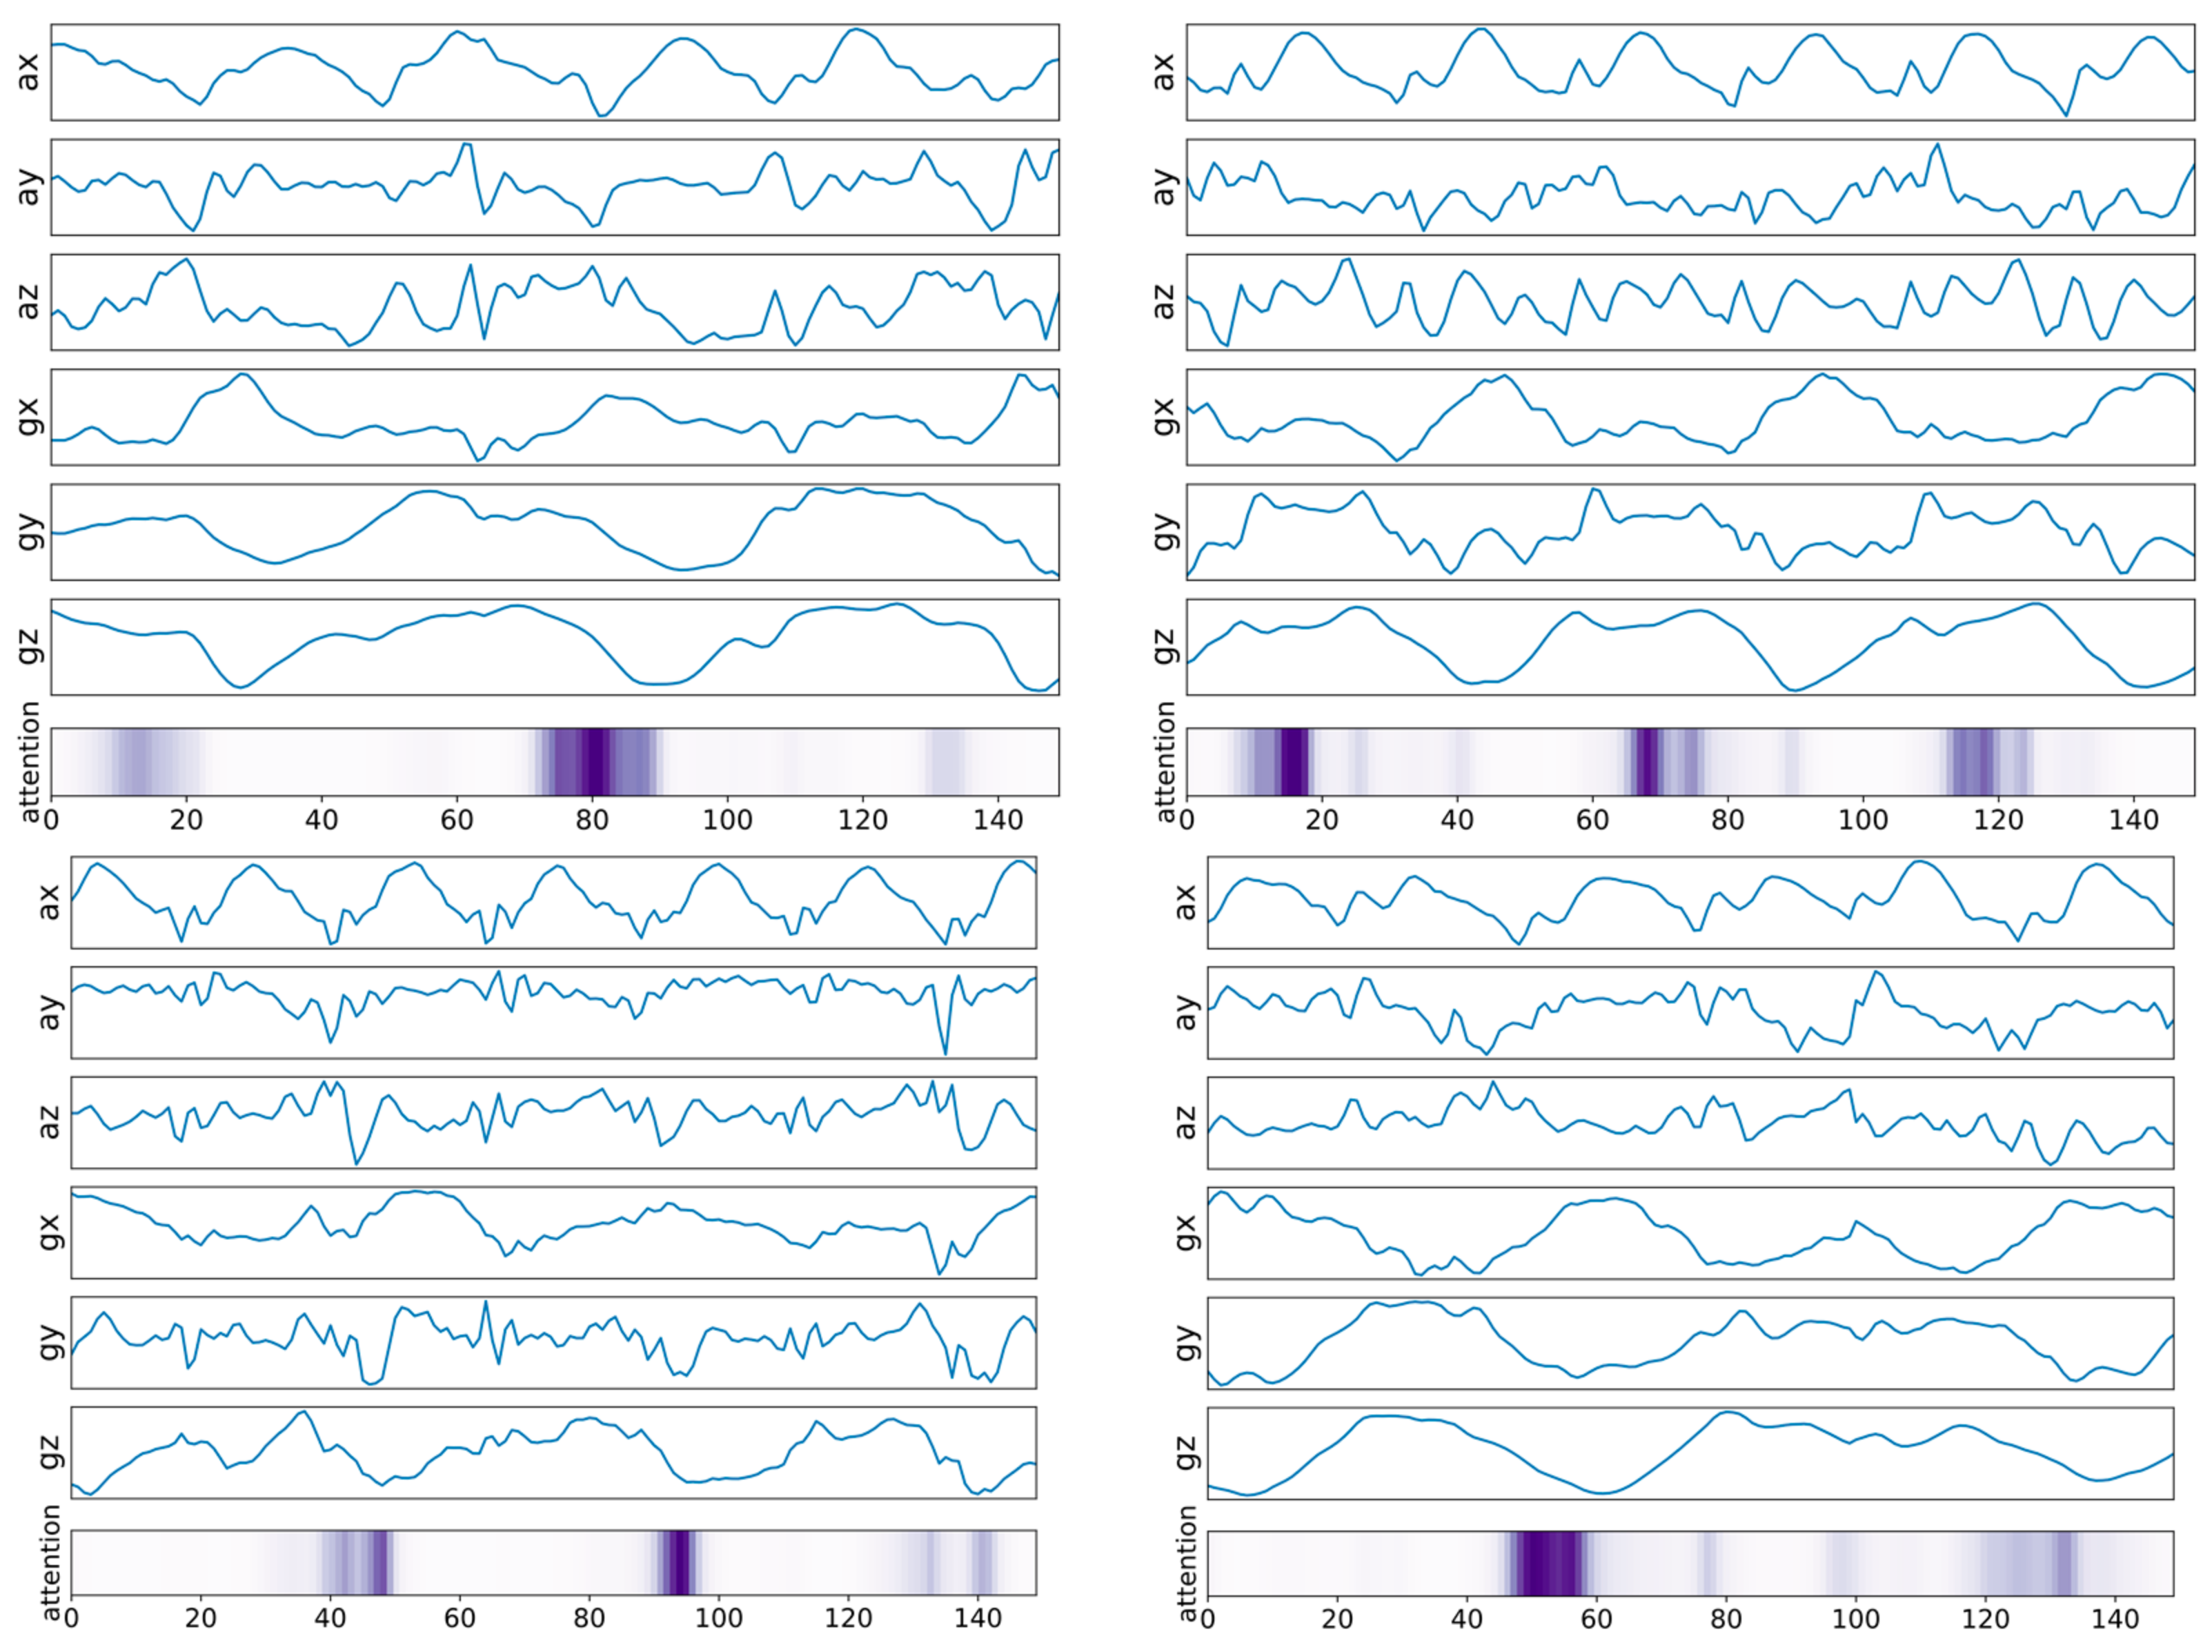
- We visualized and analyzed the parameters in the attention layer, which indicate the extent to which the classification result would depend on input signals from different time steps.
2. Related Work
2.1. Fine-Grained Recognition of Walking Activity
2.2. Smartwatch-Based Activity Recognition
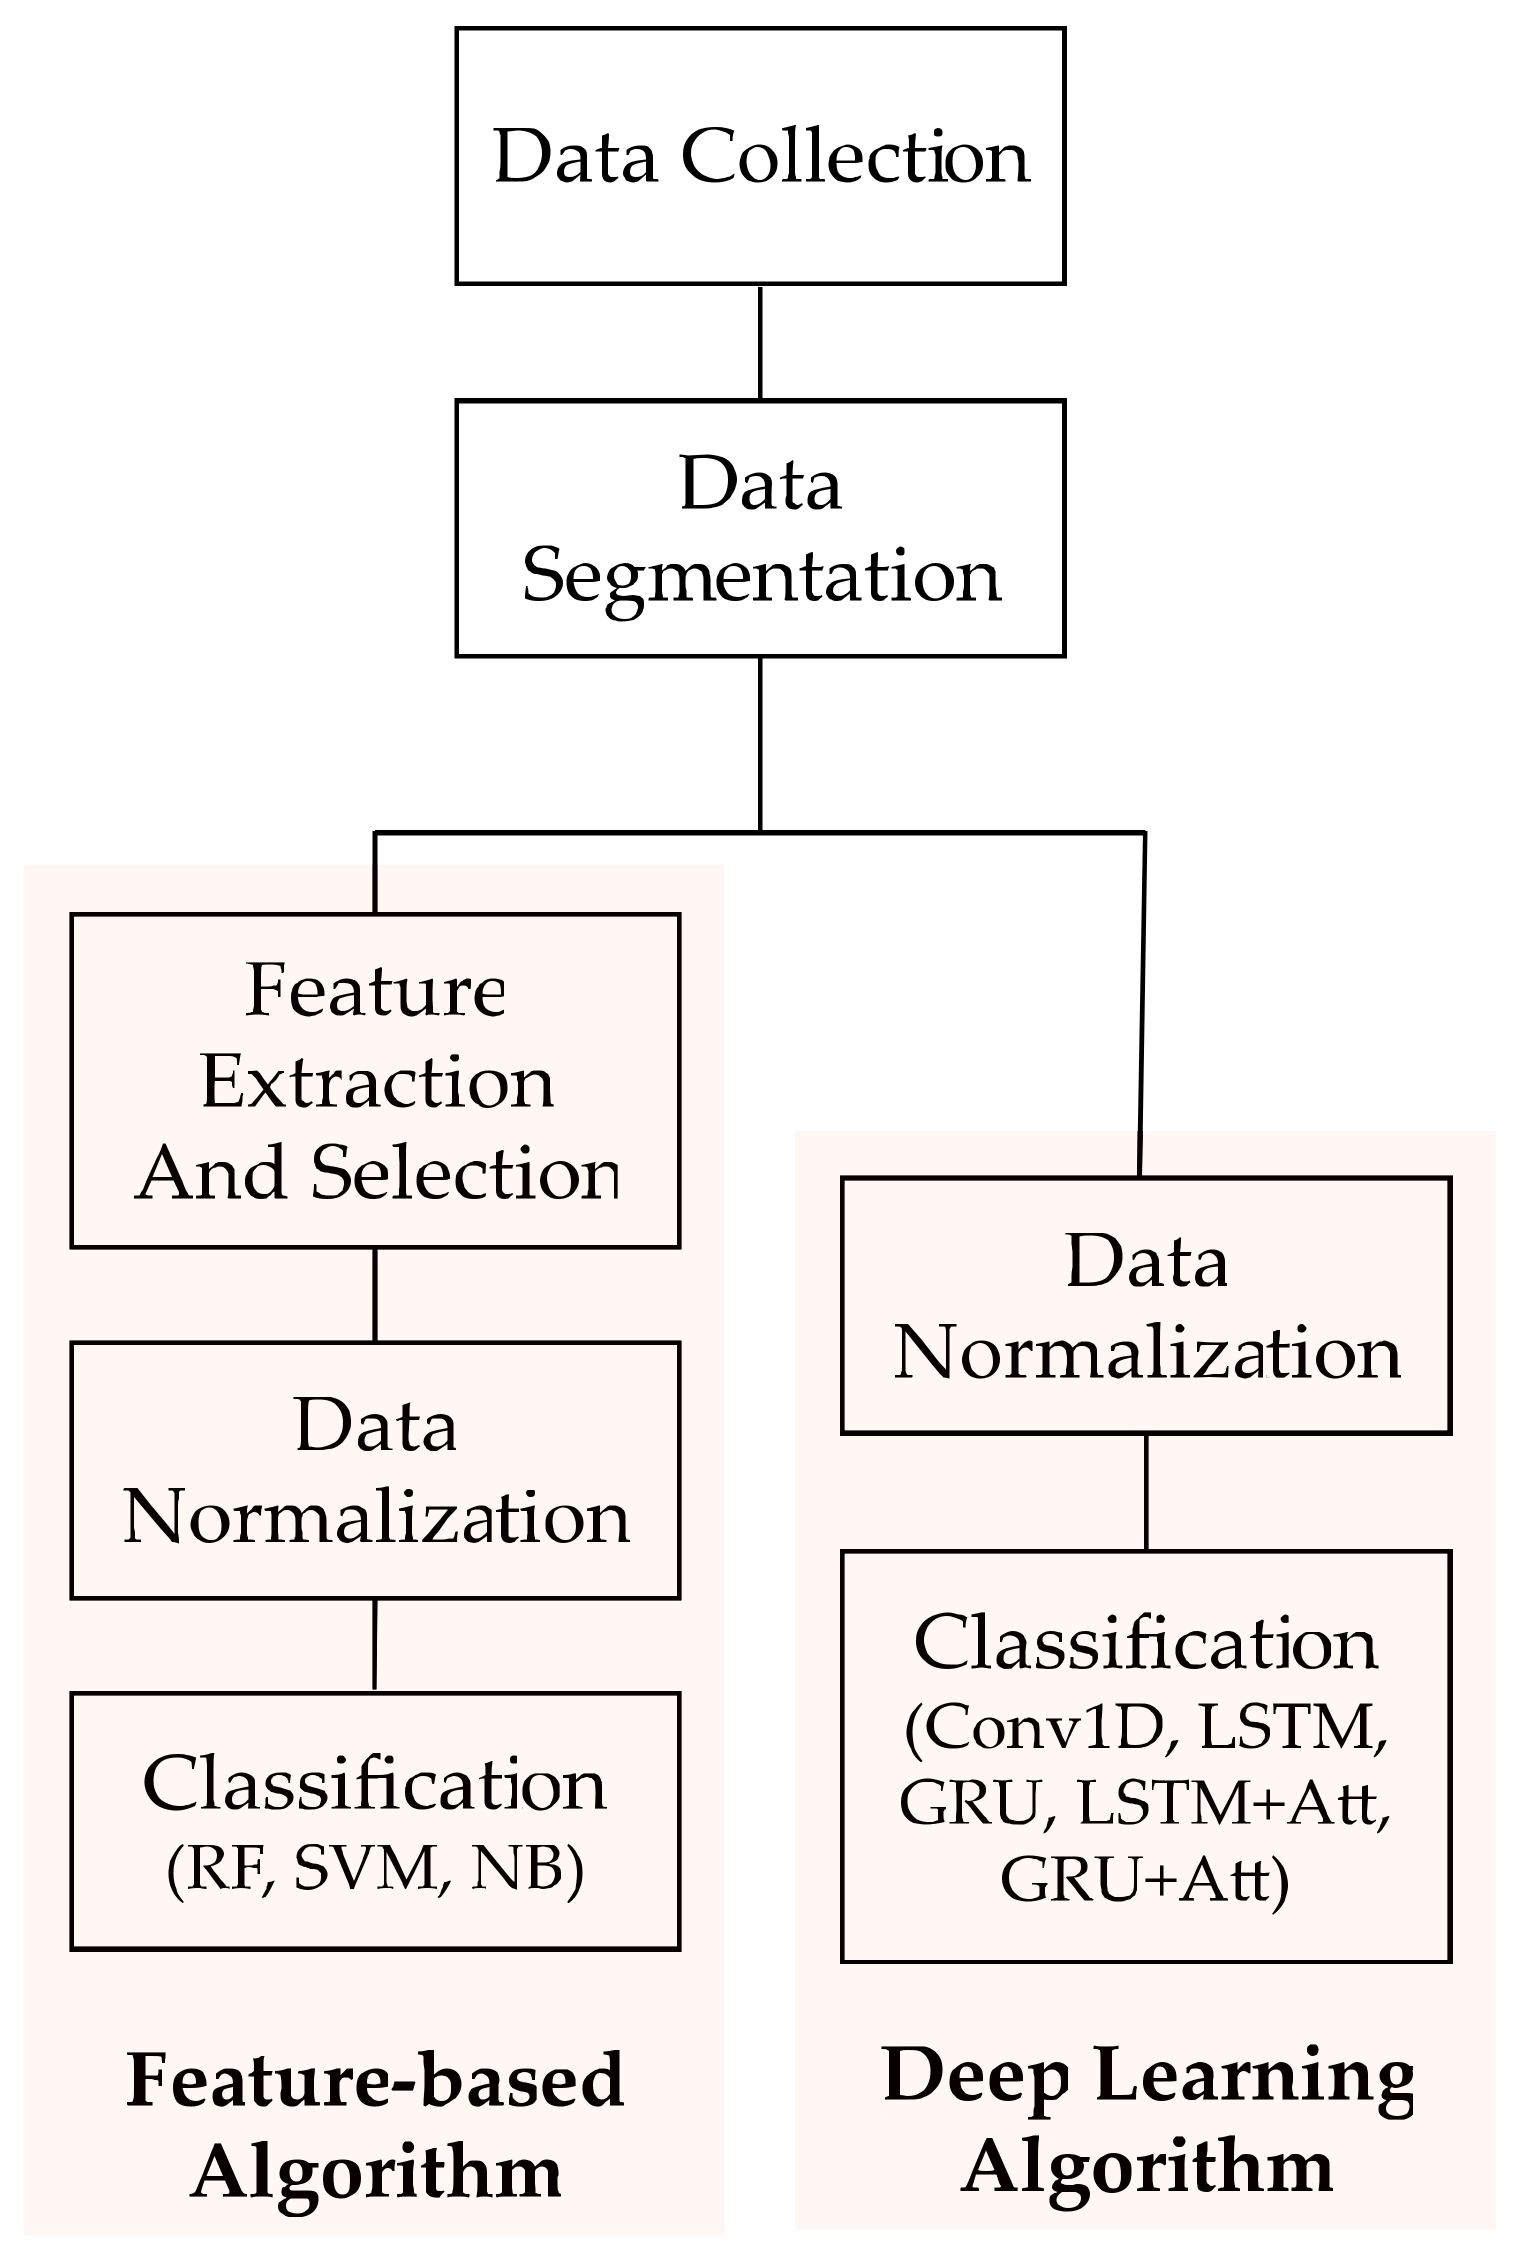
3. Experiment
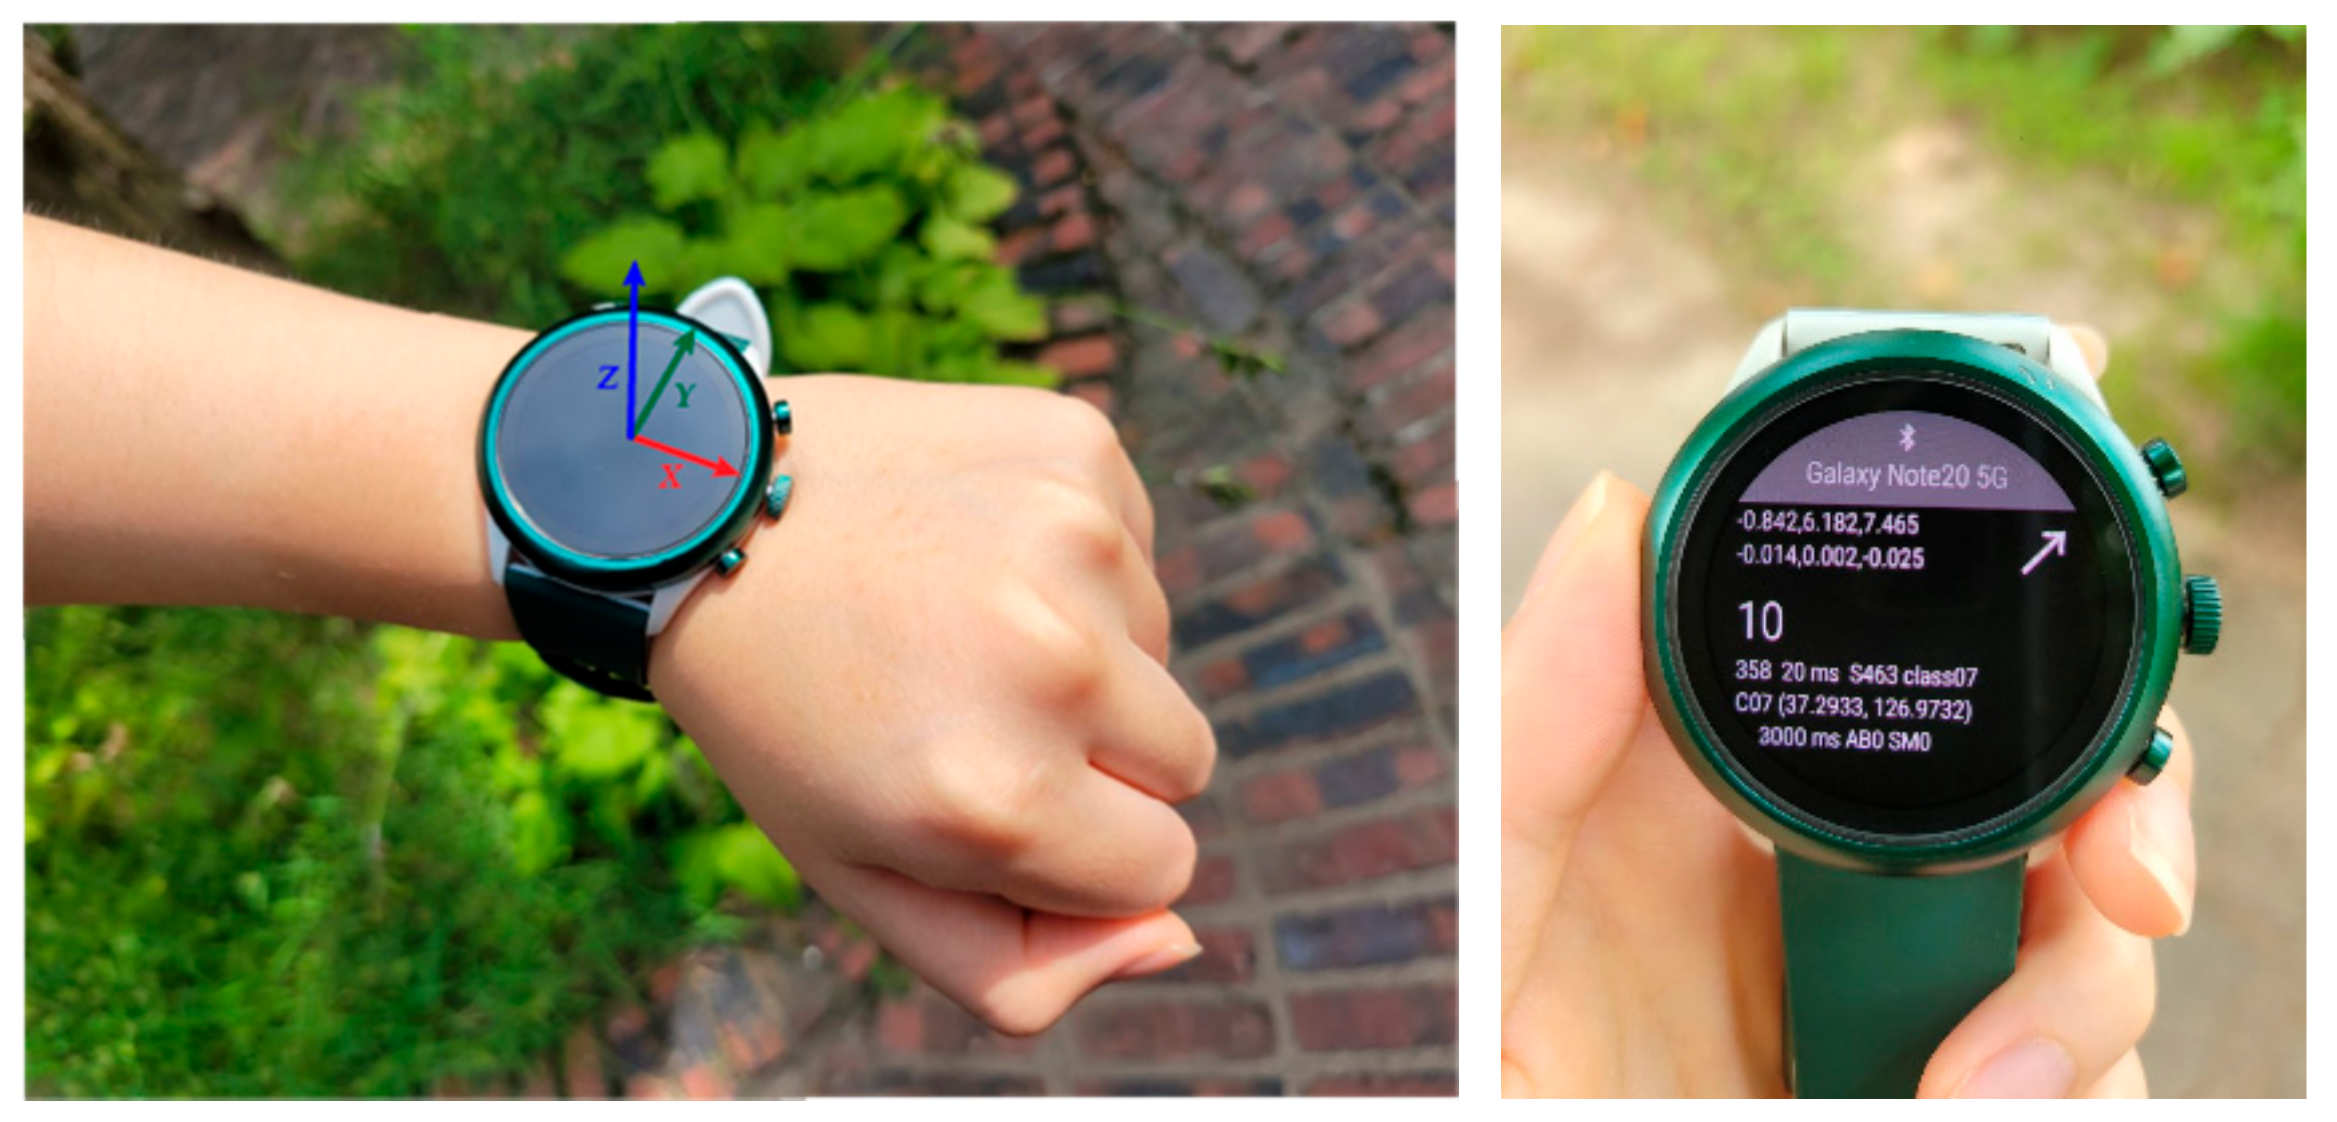
3.1. Equipment
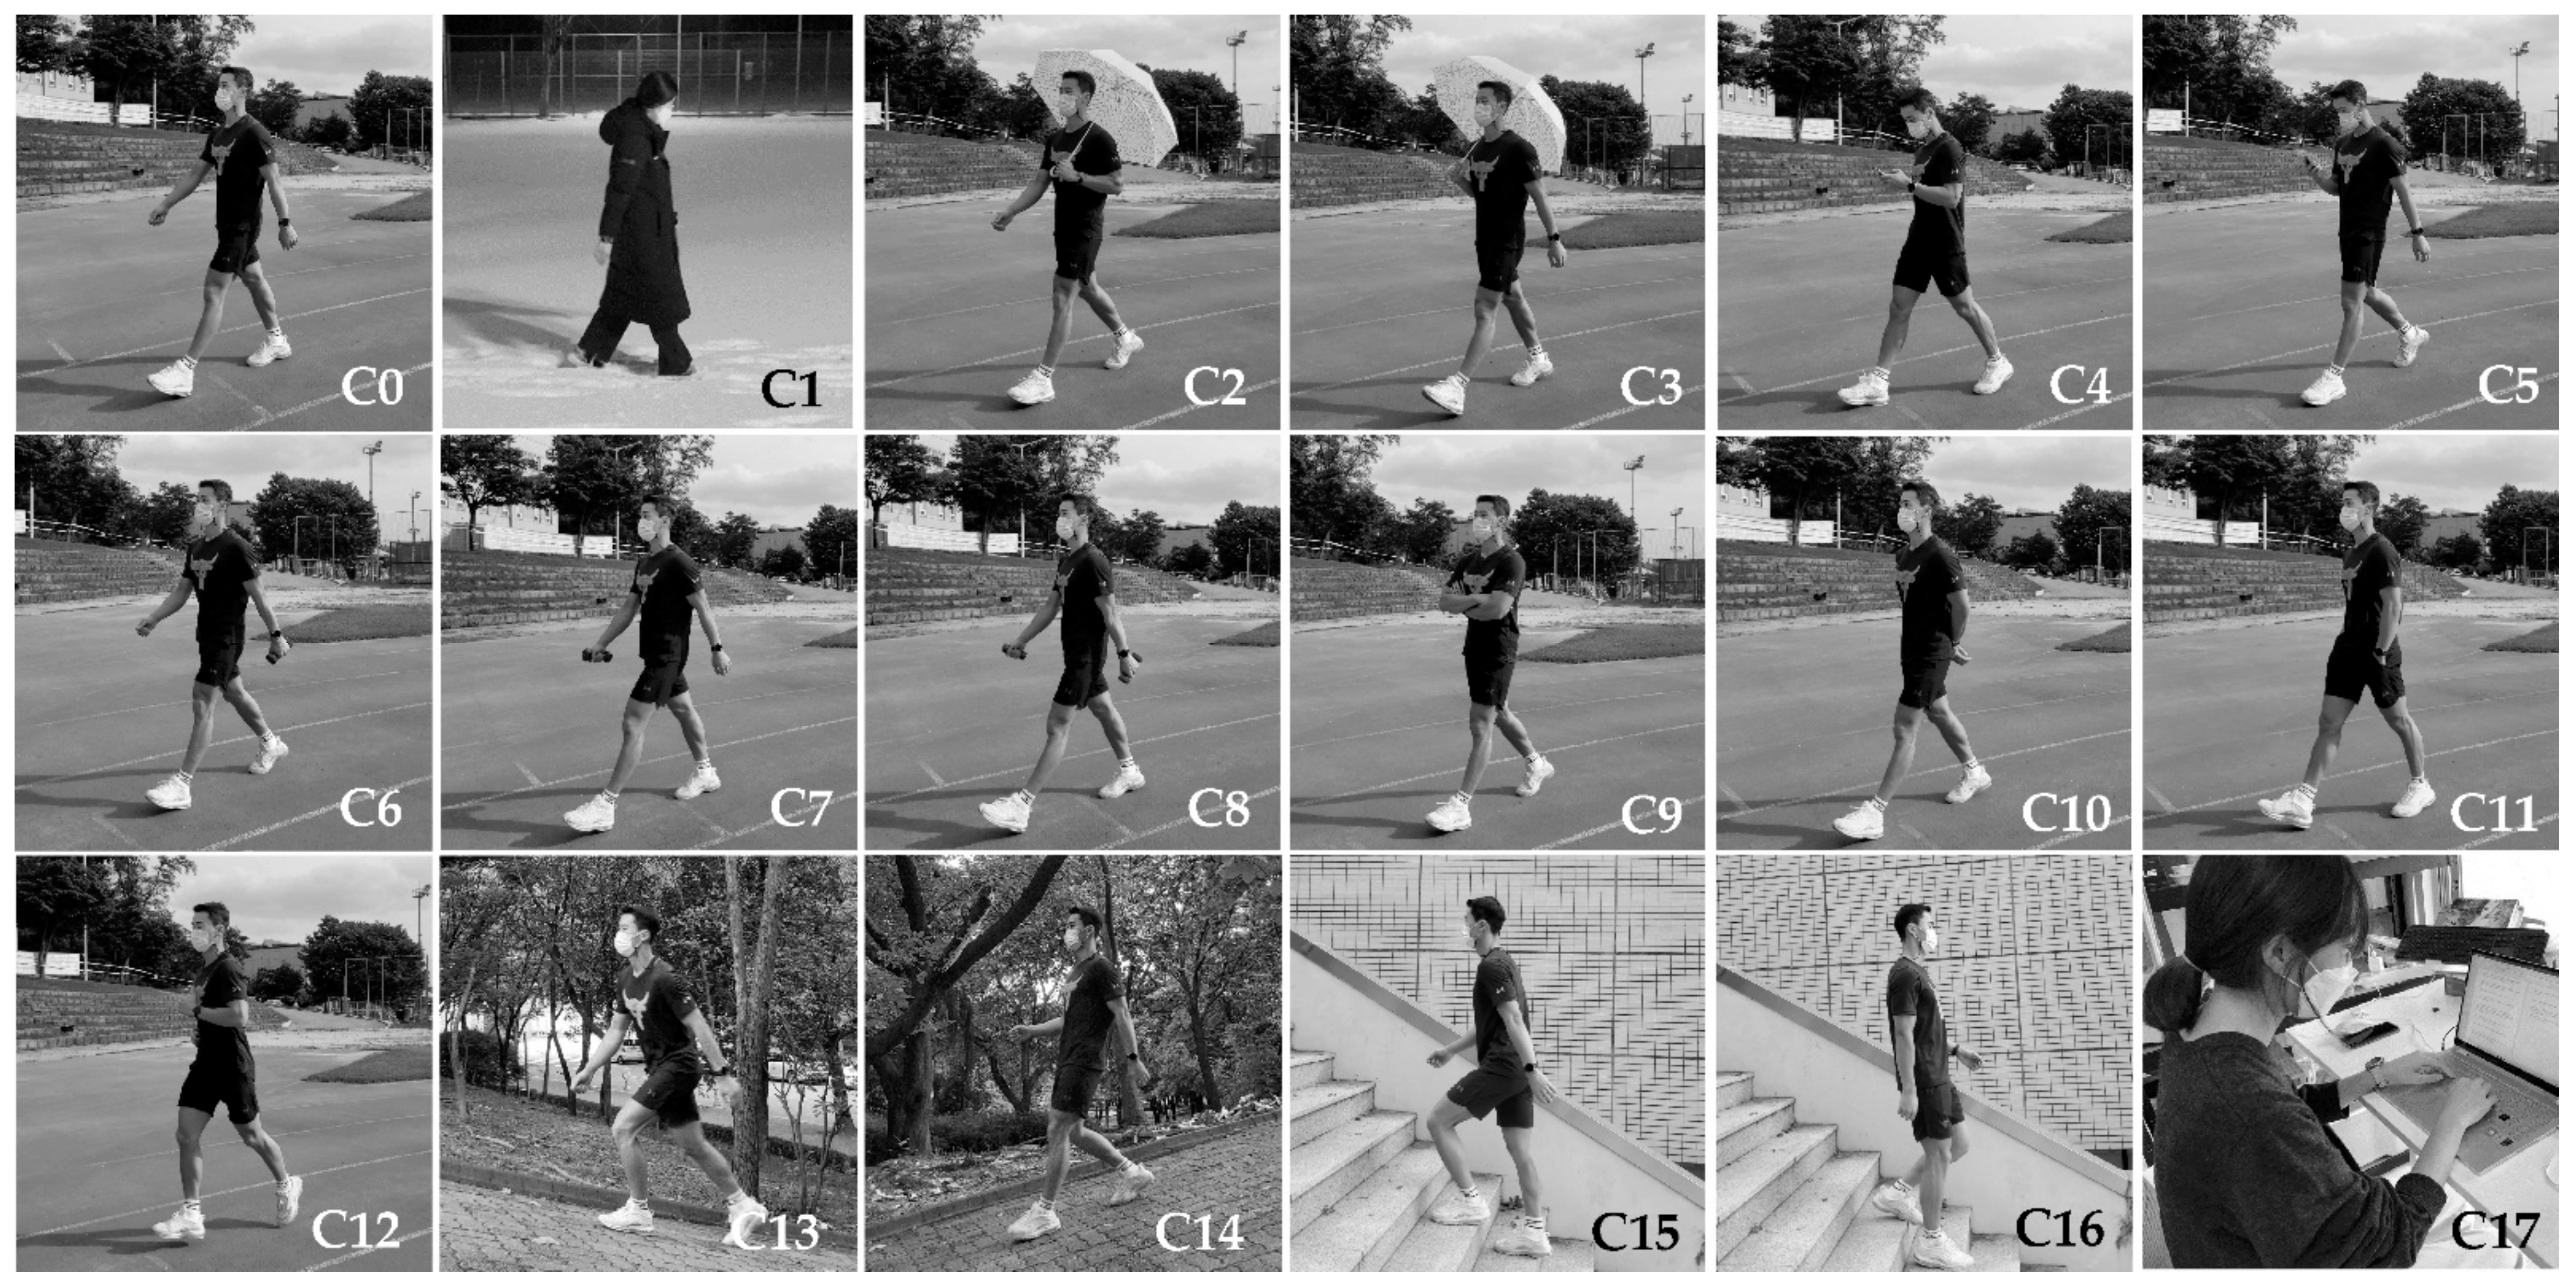
3.2. Activity Definition
3.3. Proposed Method
3.3.1. Problem Definition
3.3.2. Data Collection
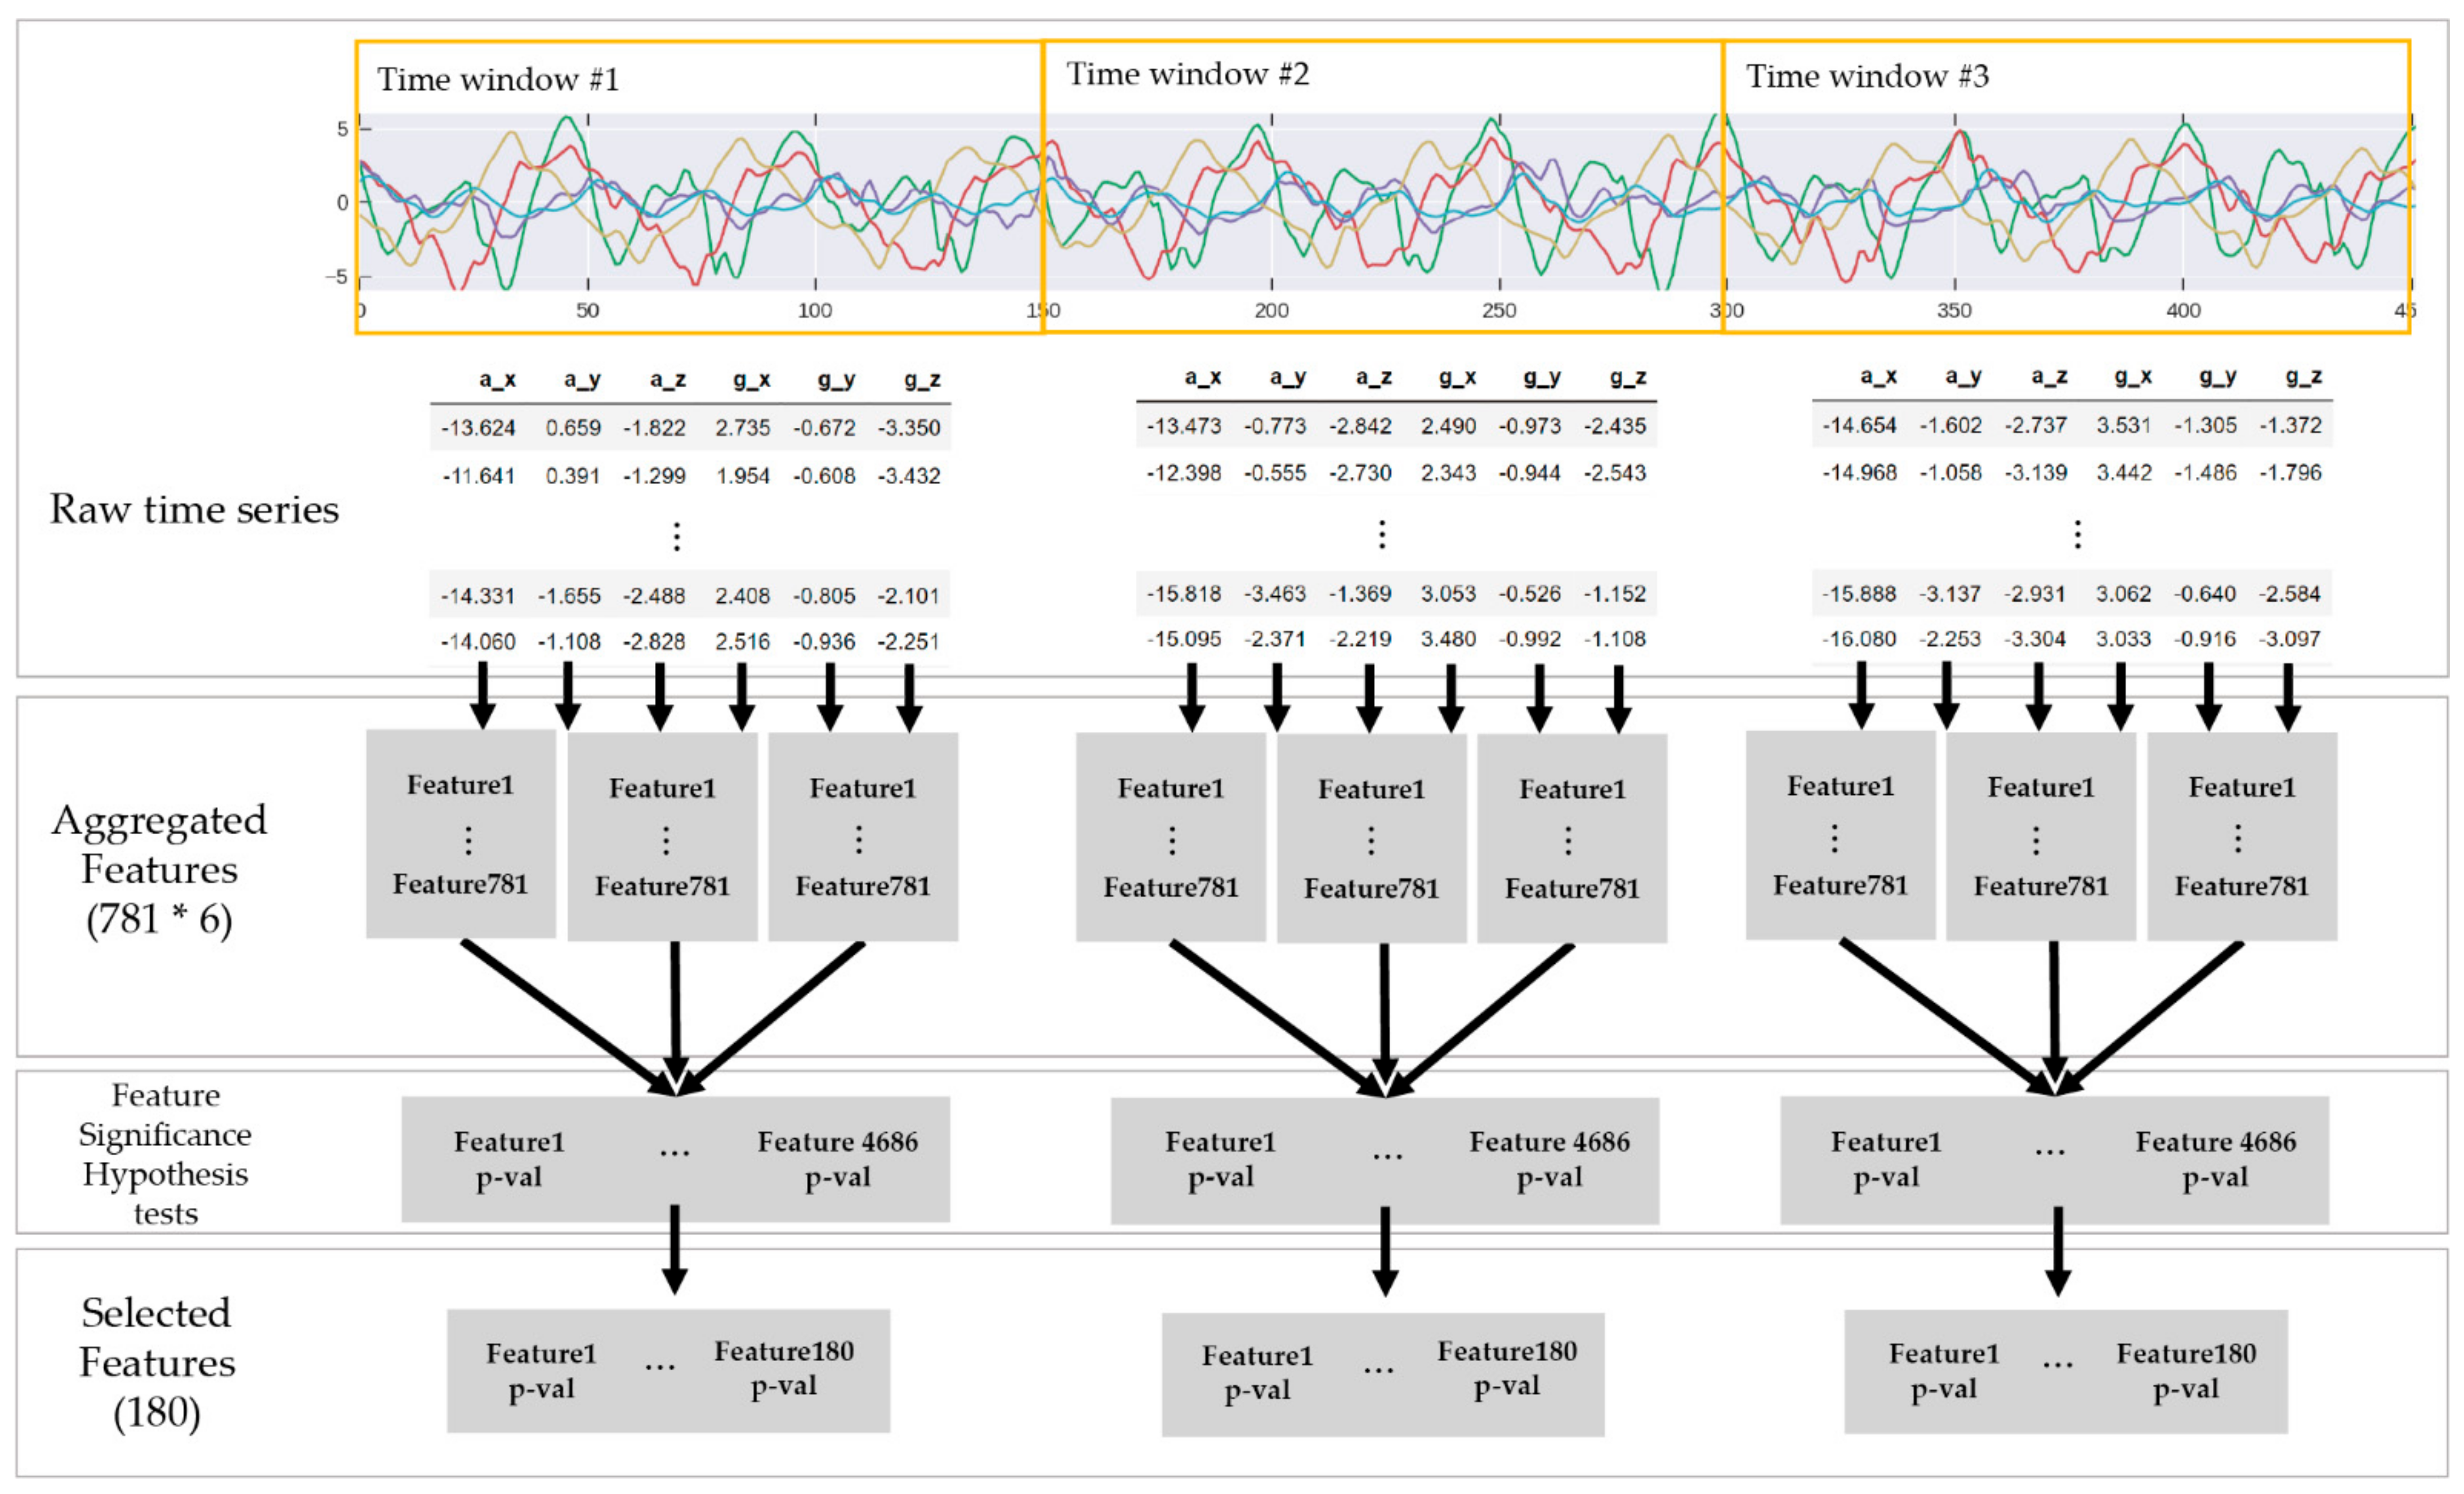
3.3.3. Data Segmentation
3.3.4. Feature-Based Machine Learning
3.3.5. Deep Learning Algorithm
Conv1D
LSTM
GRU
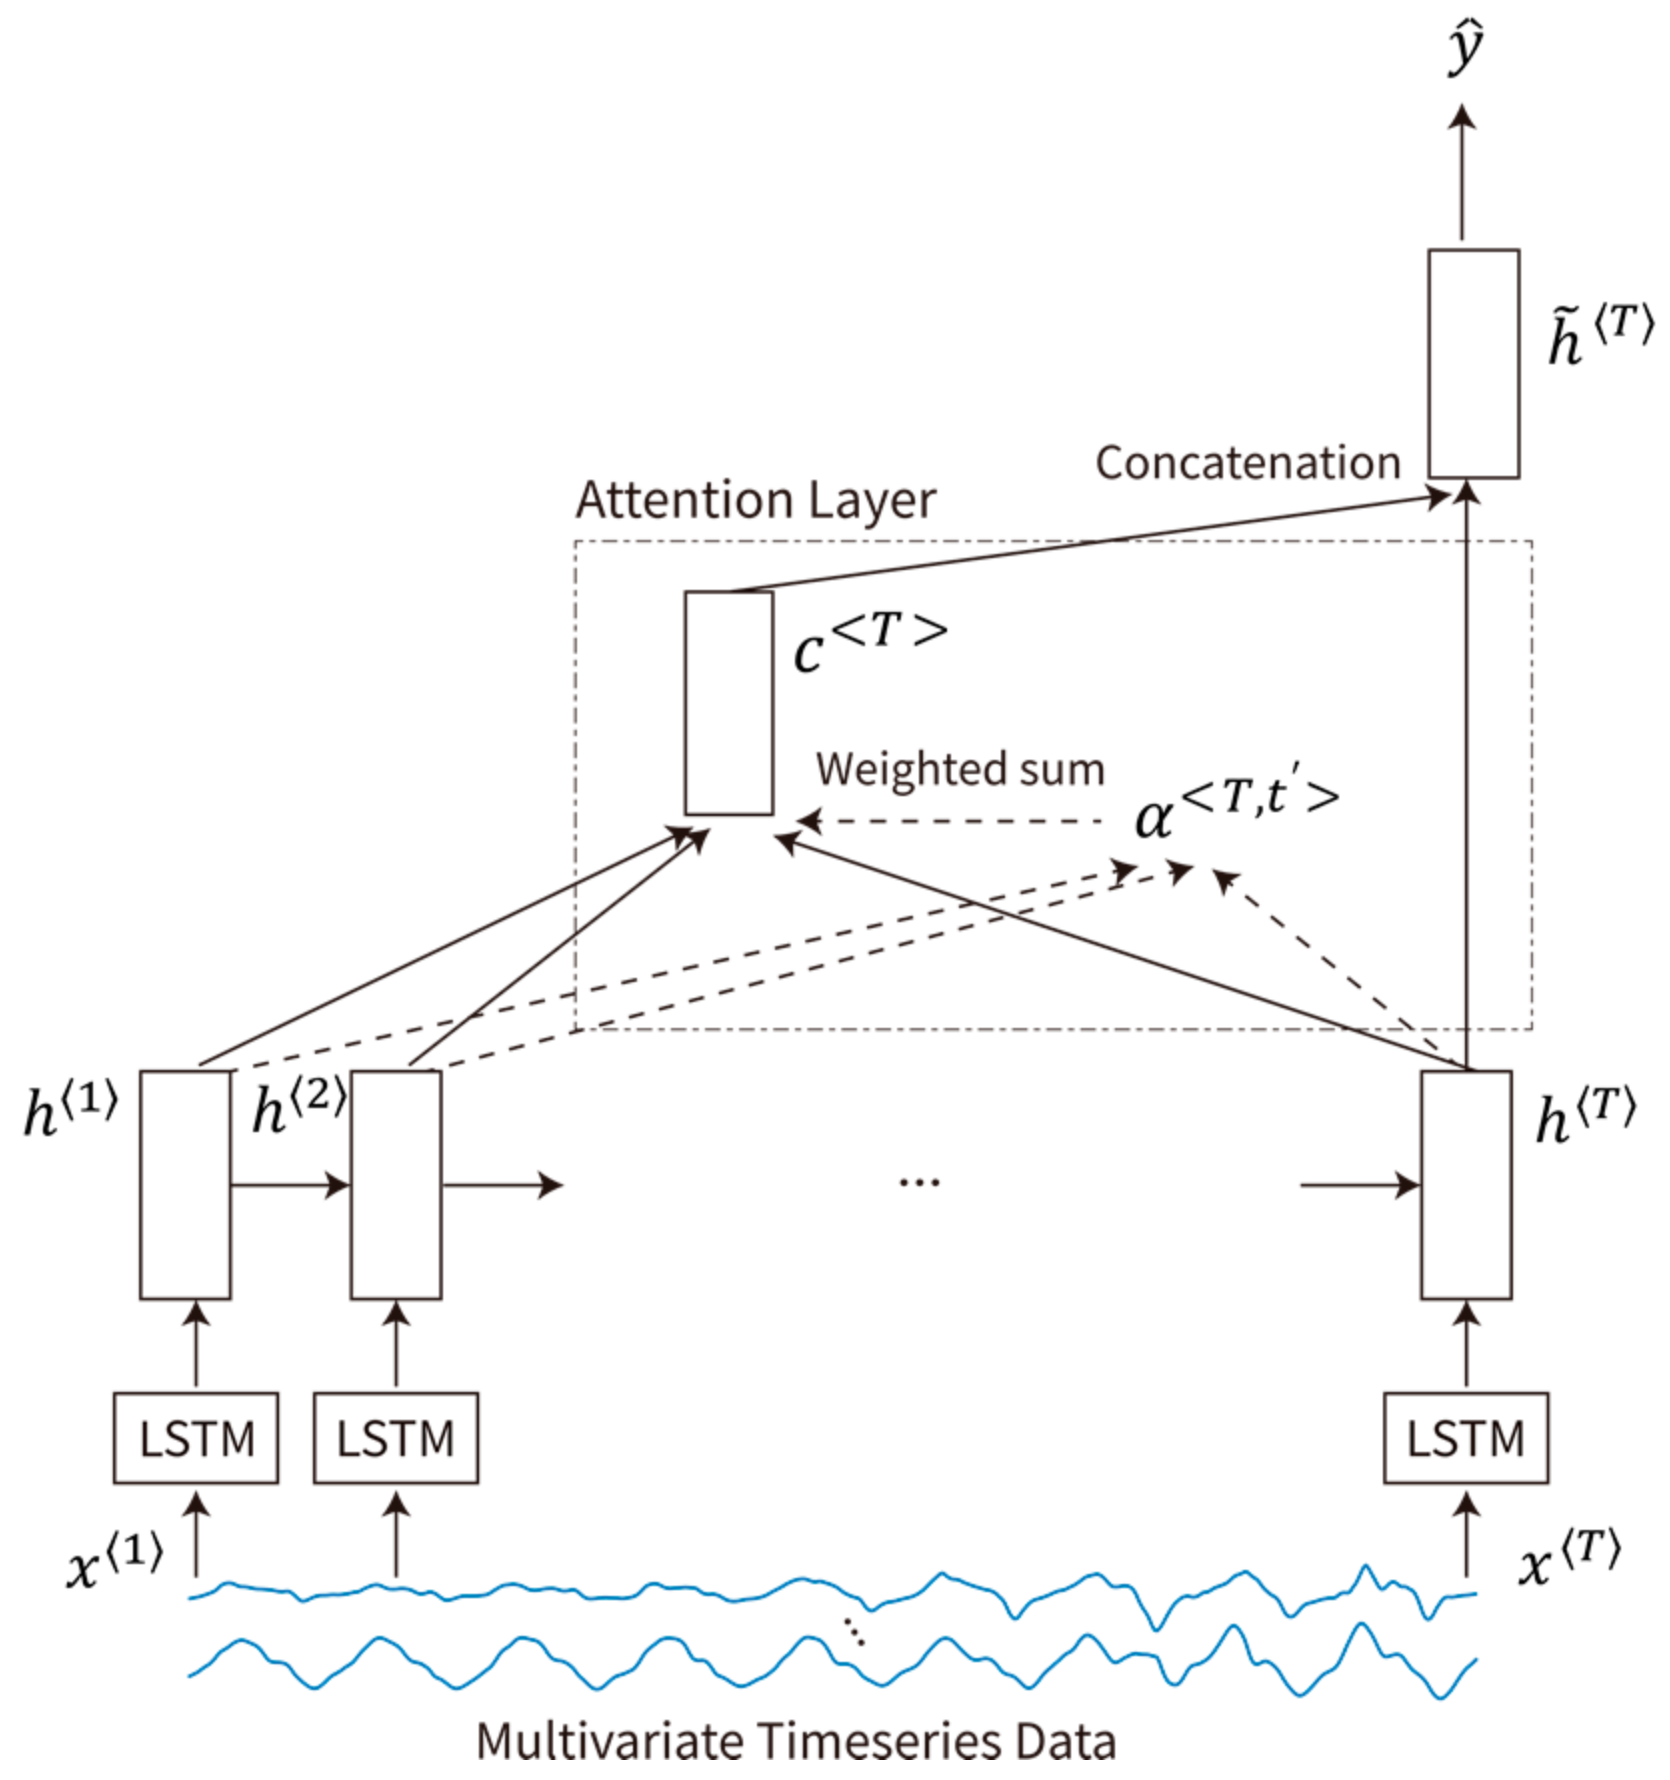
GRU and LSTM with Attention Mechanism
4. Results
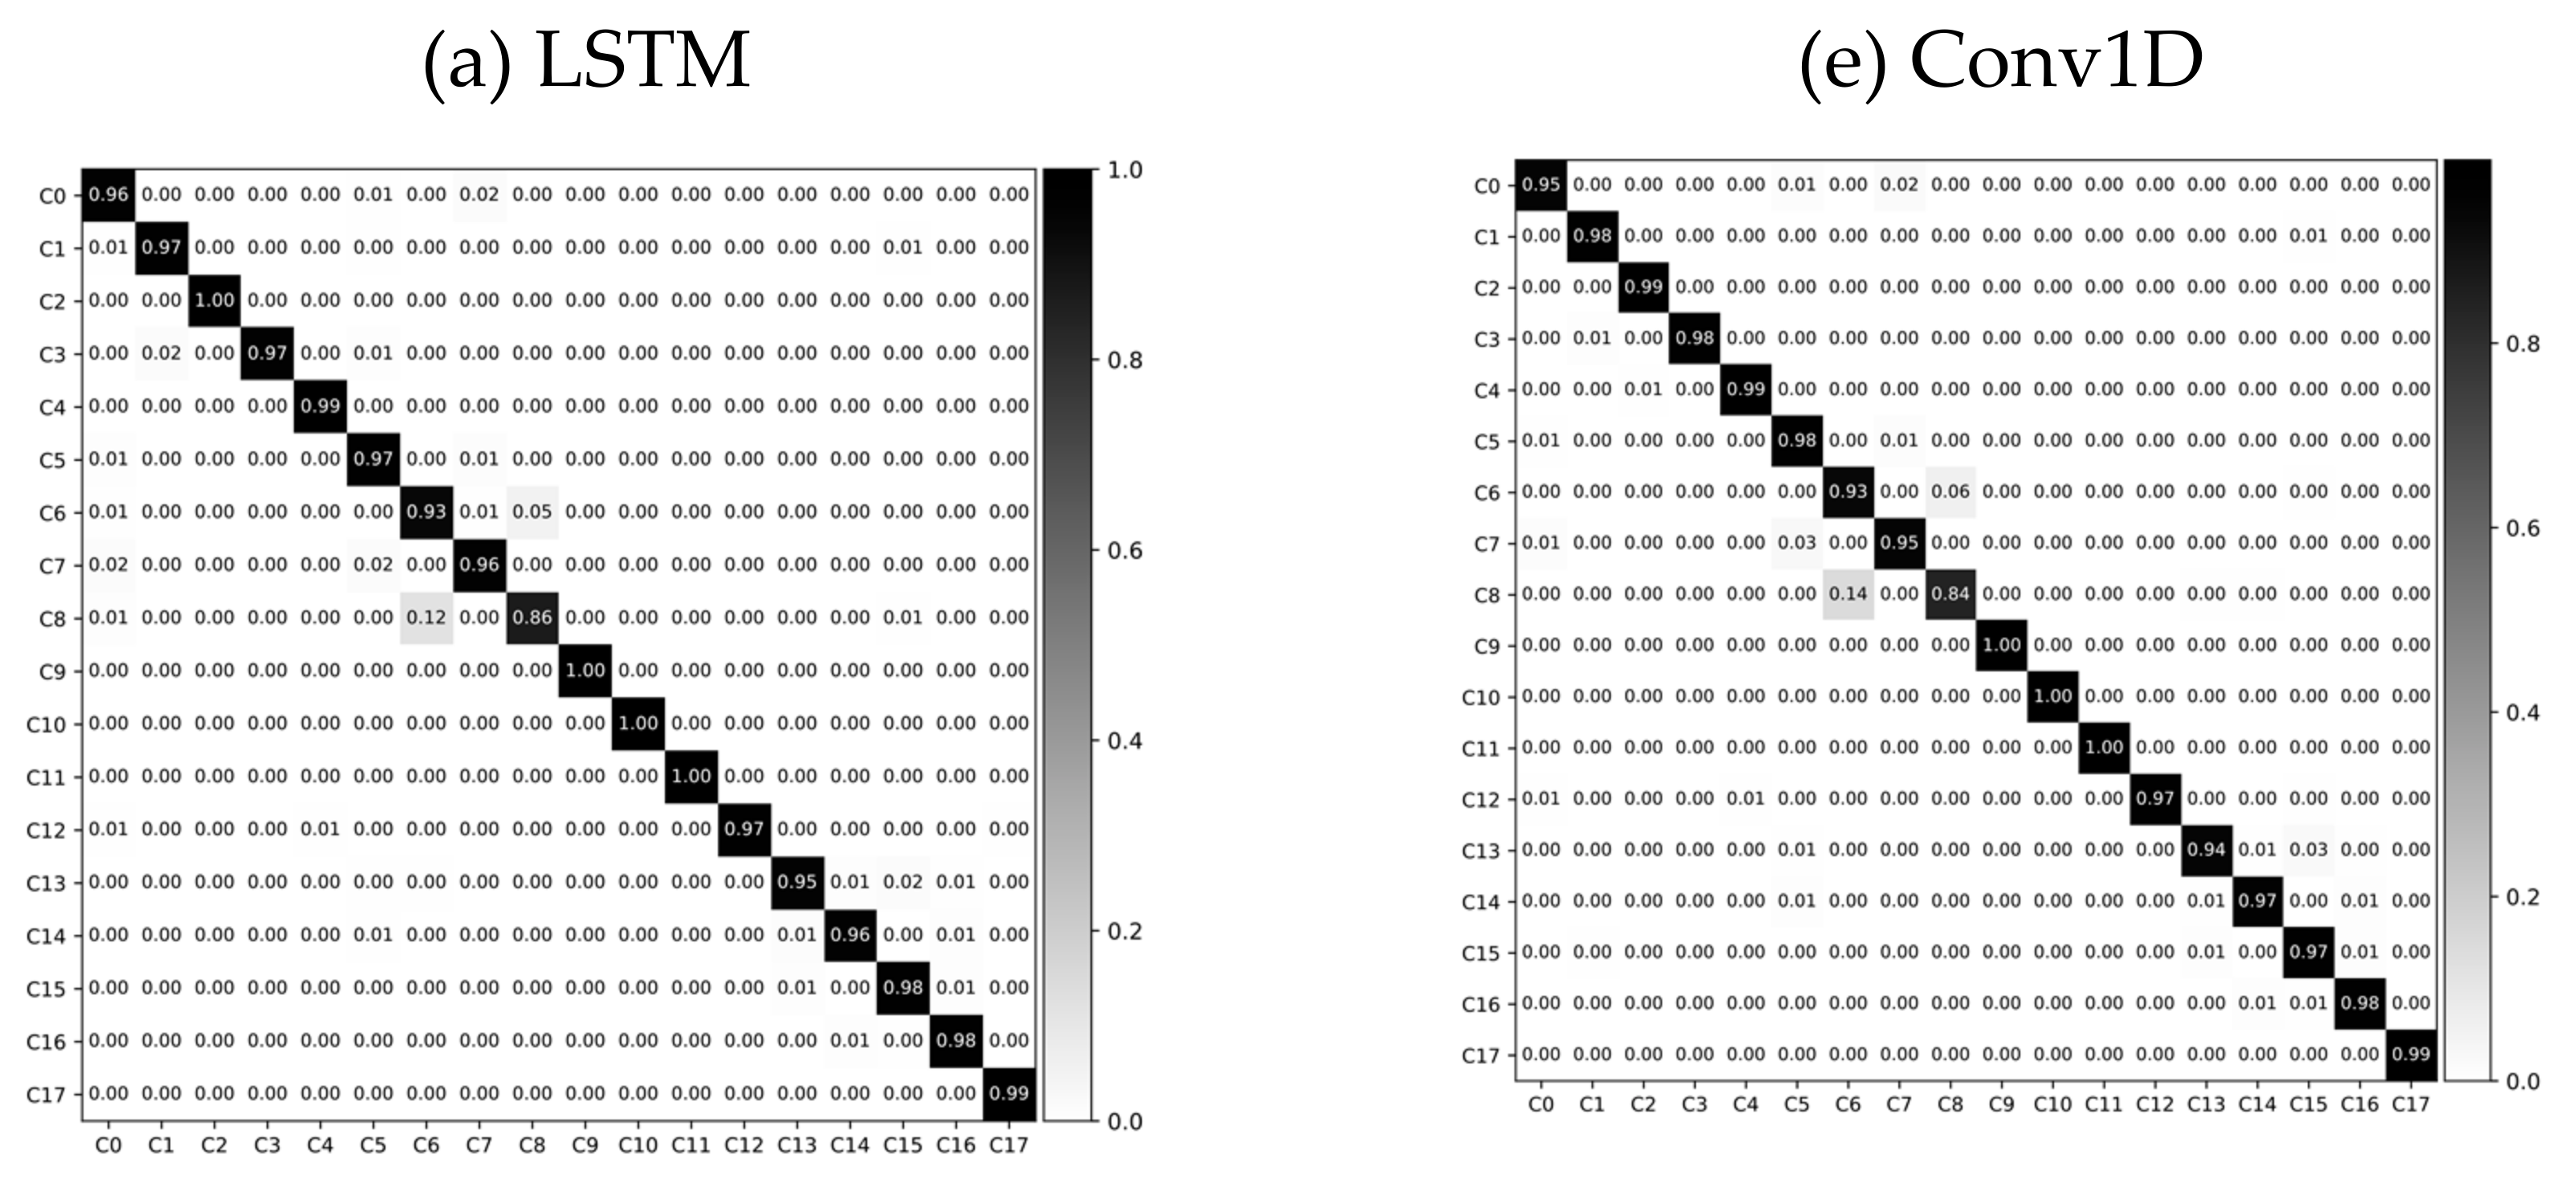
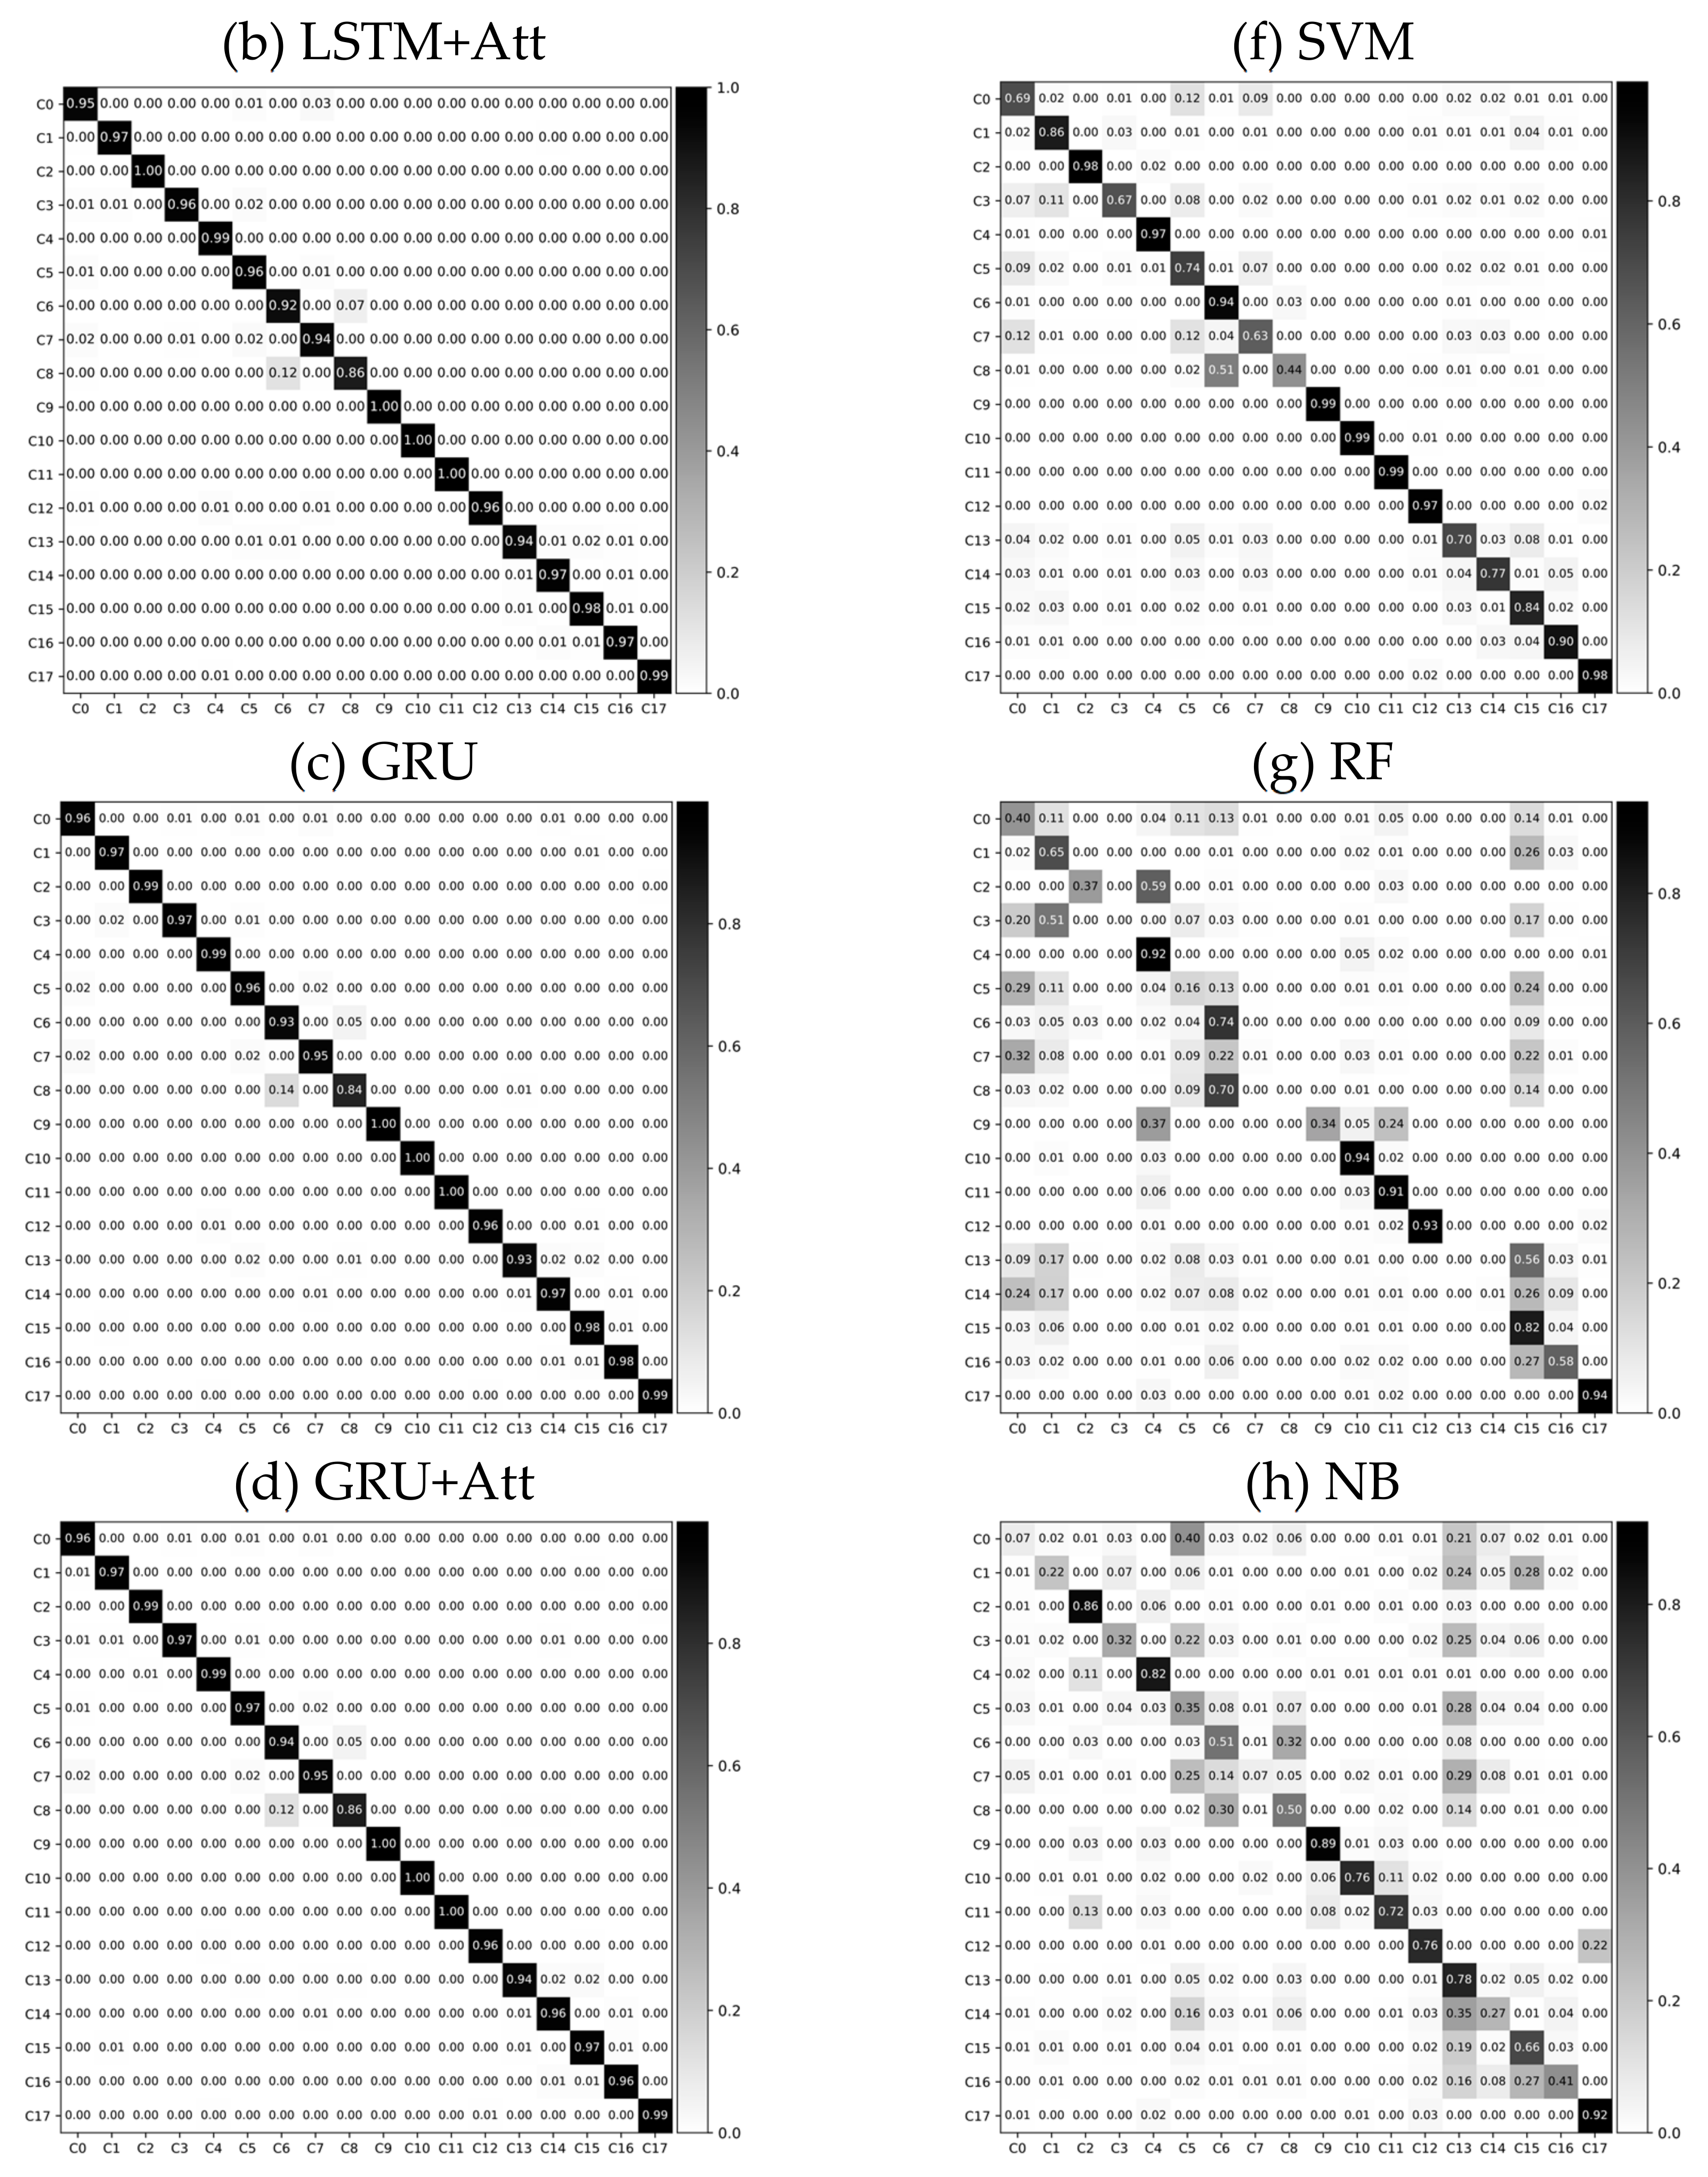
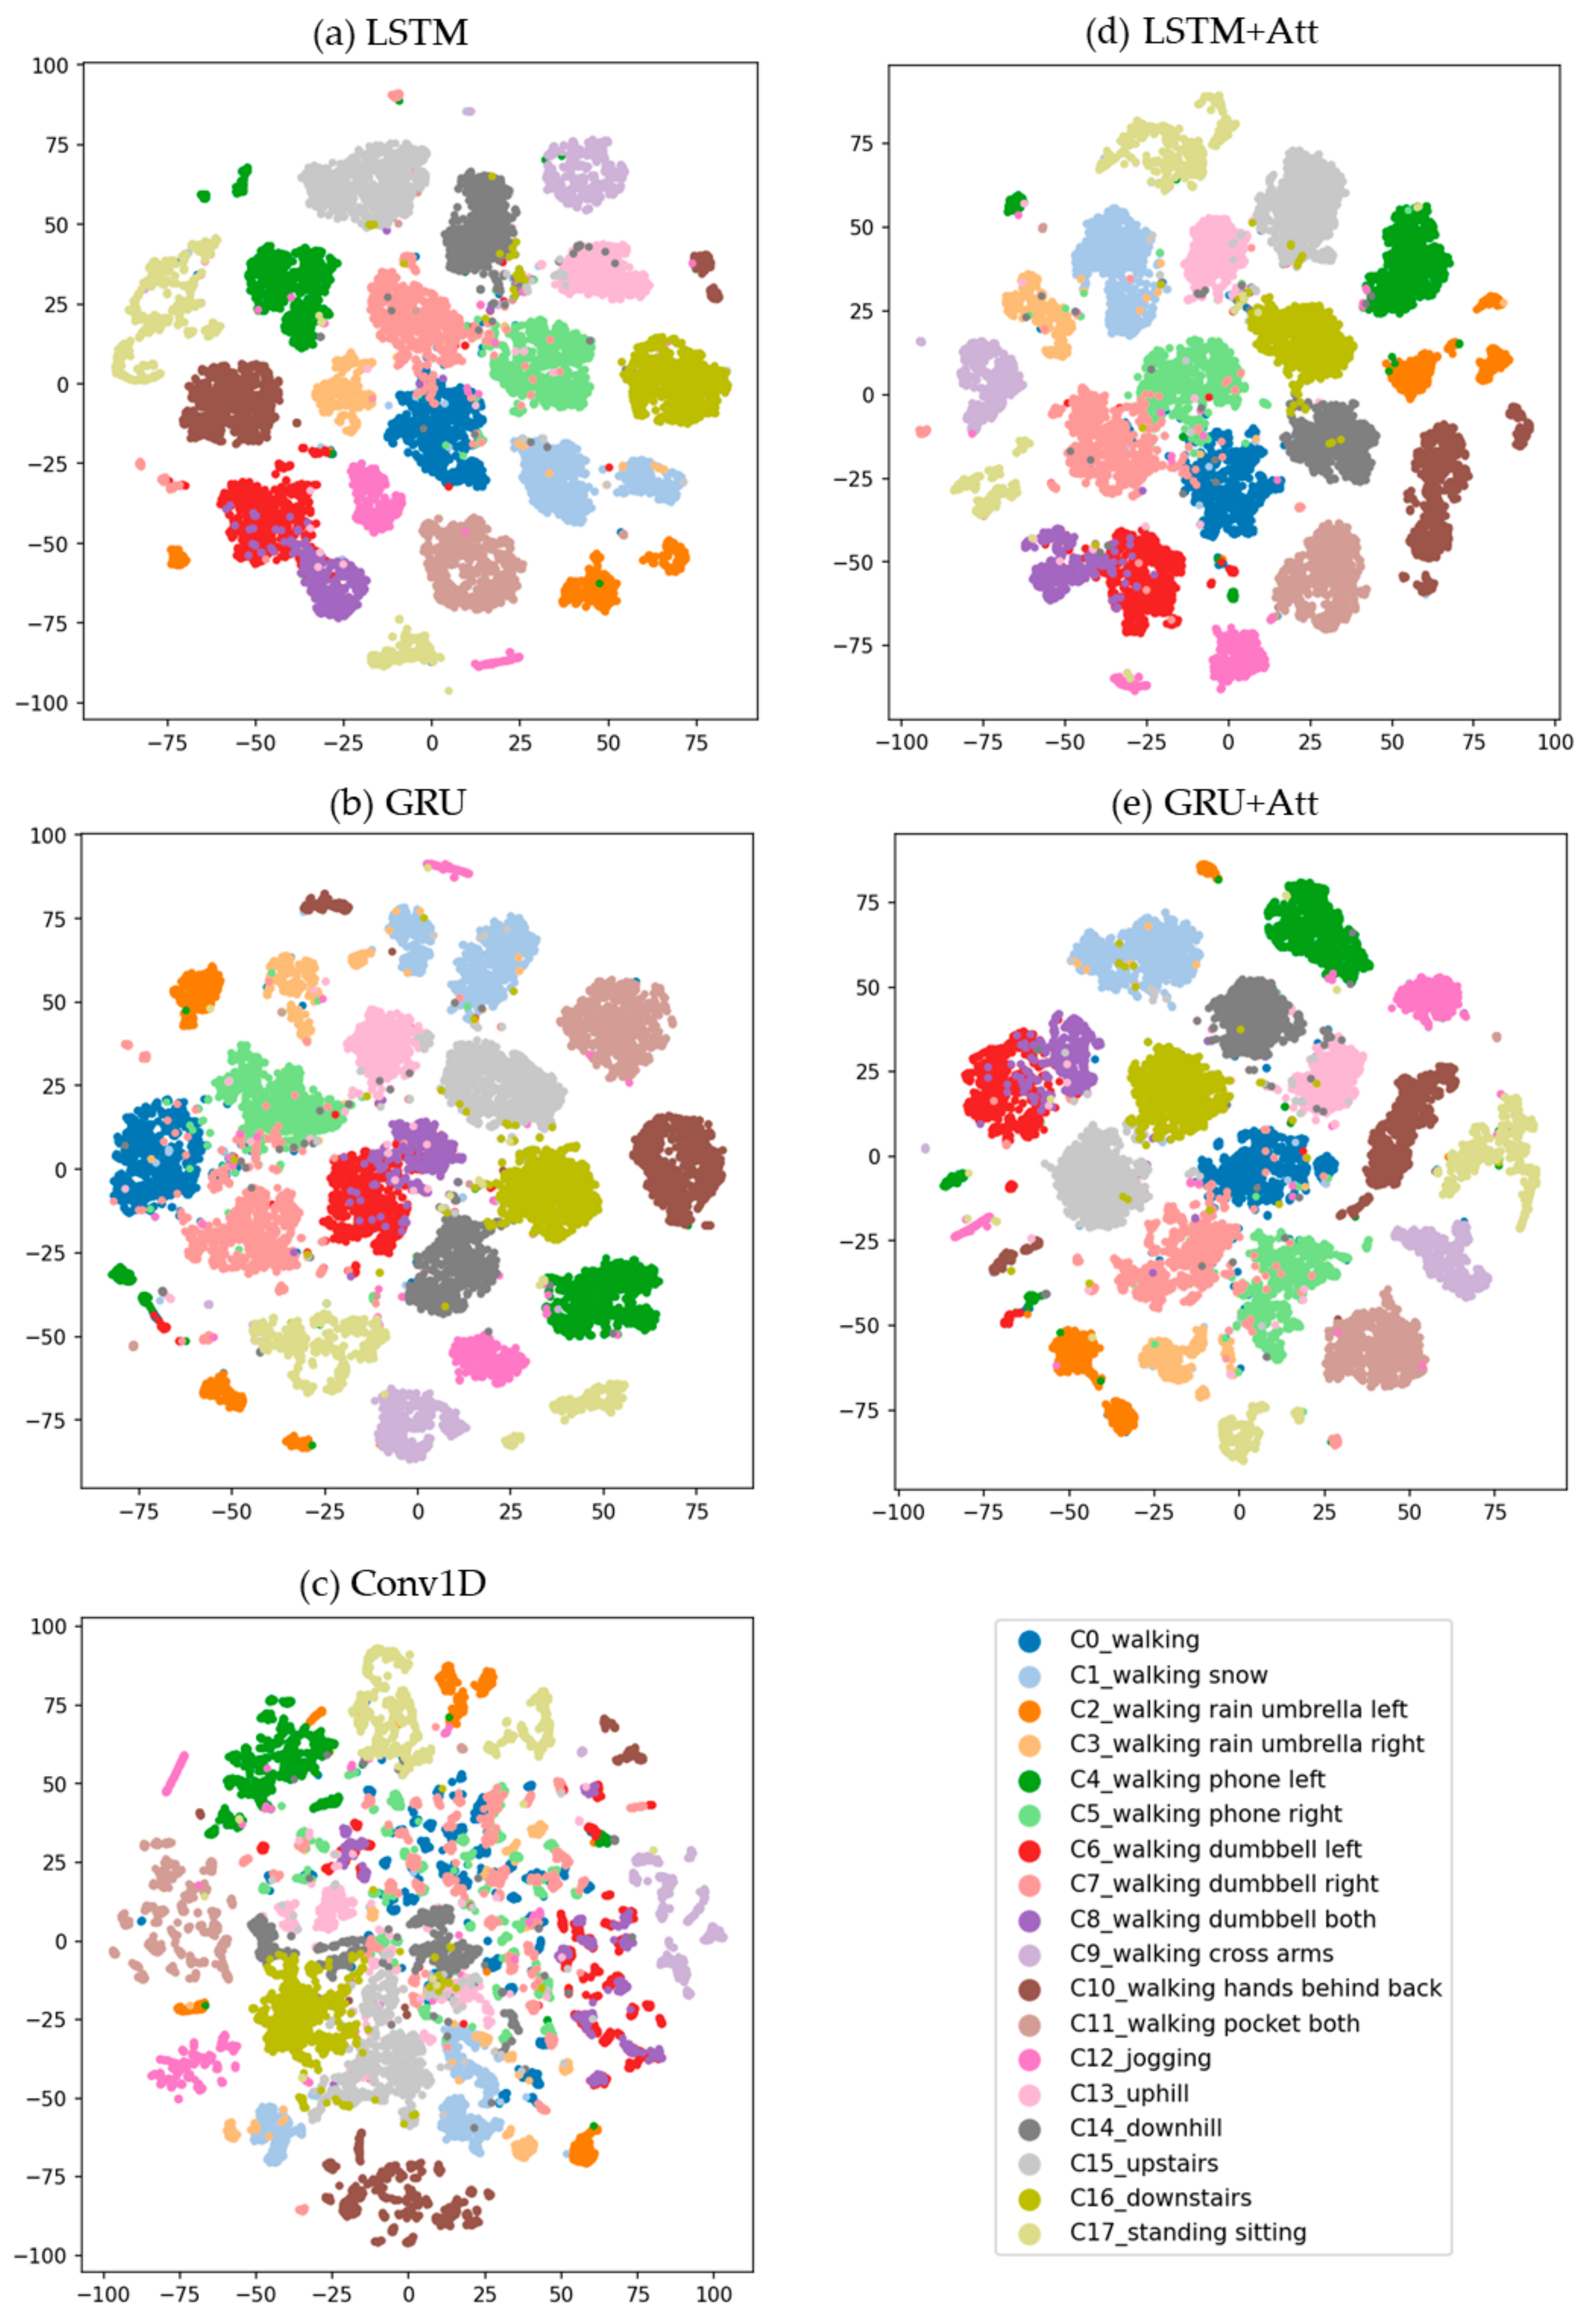
4.1. Classification Results
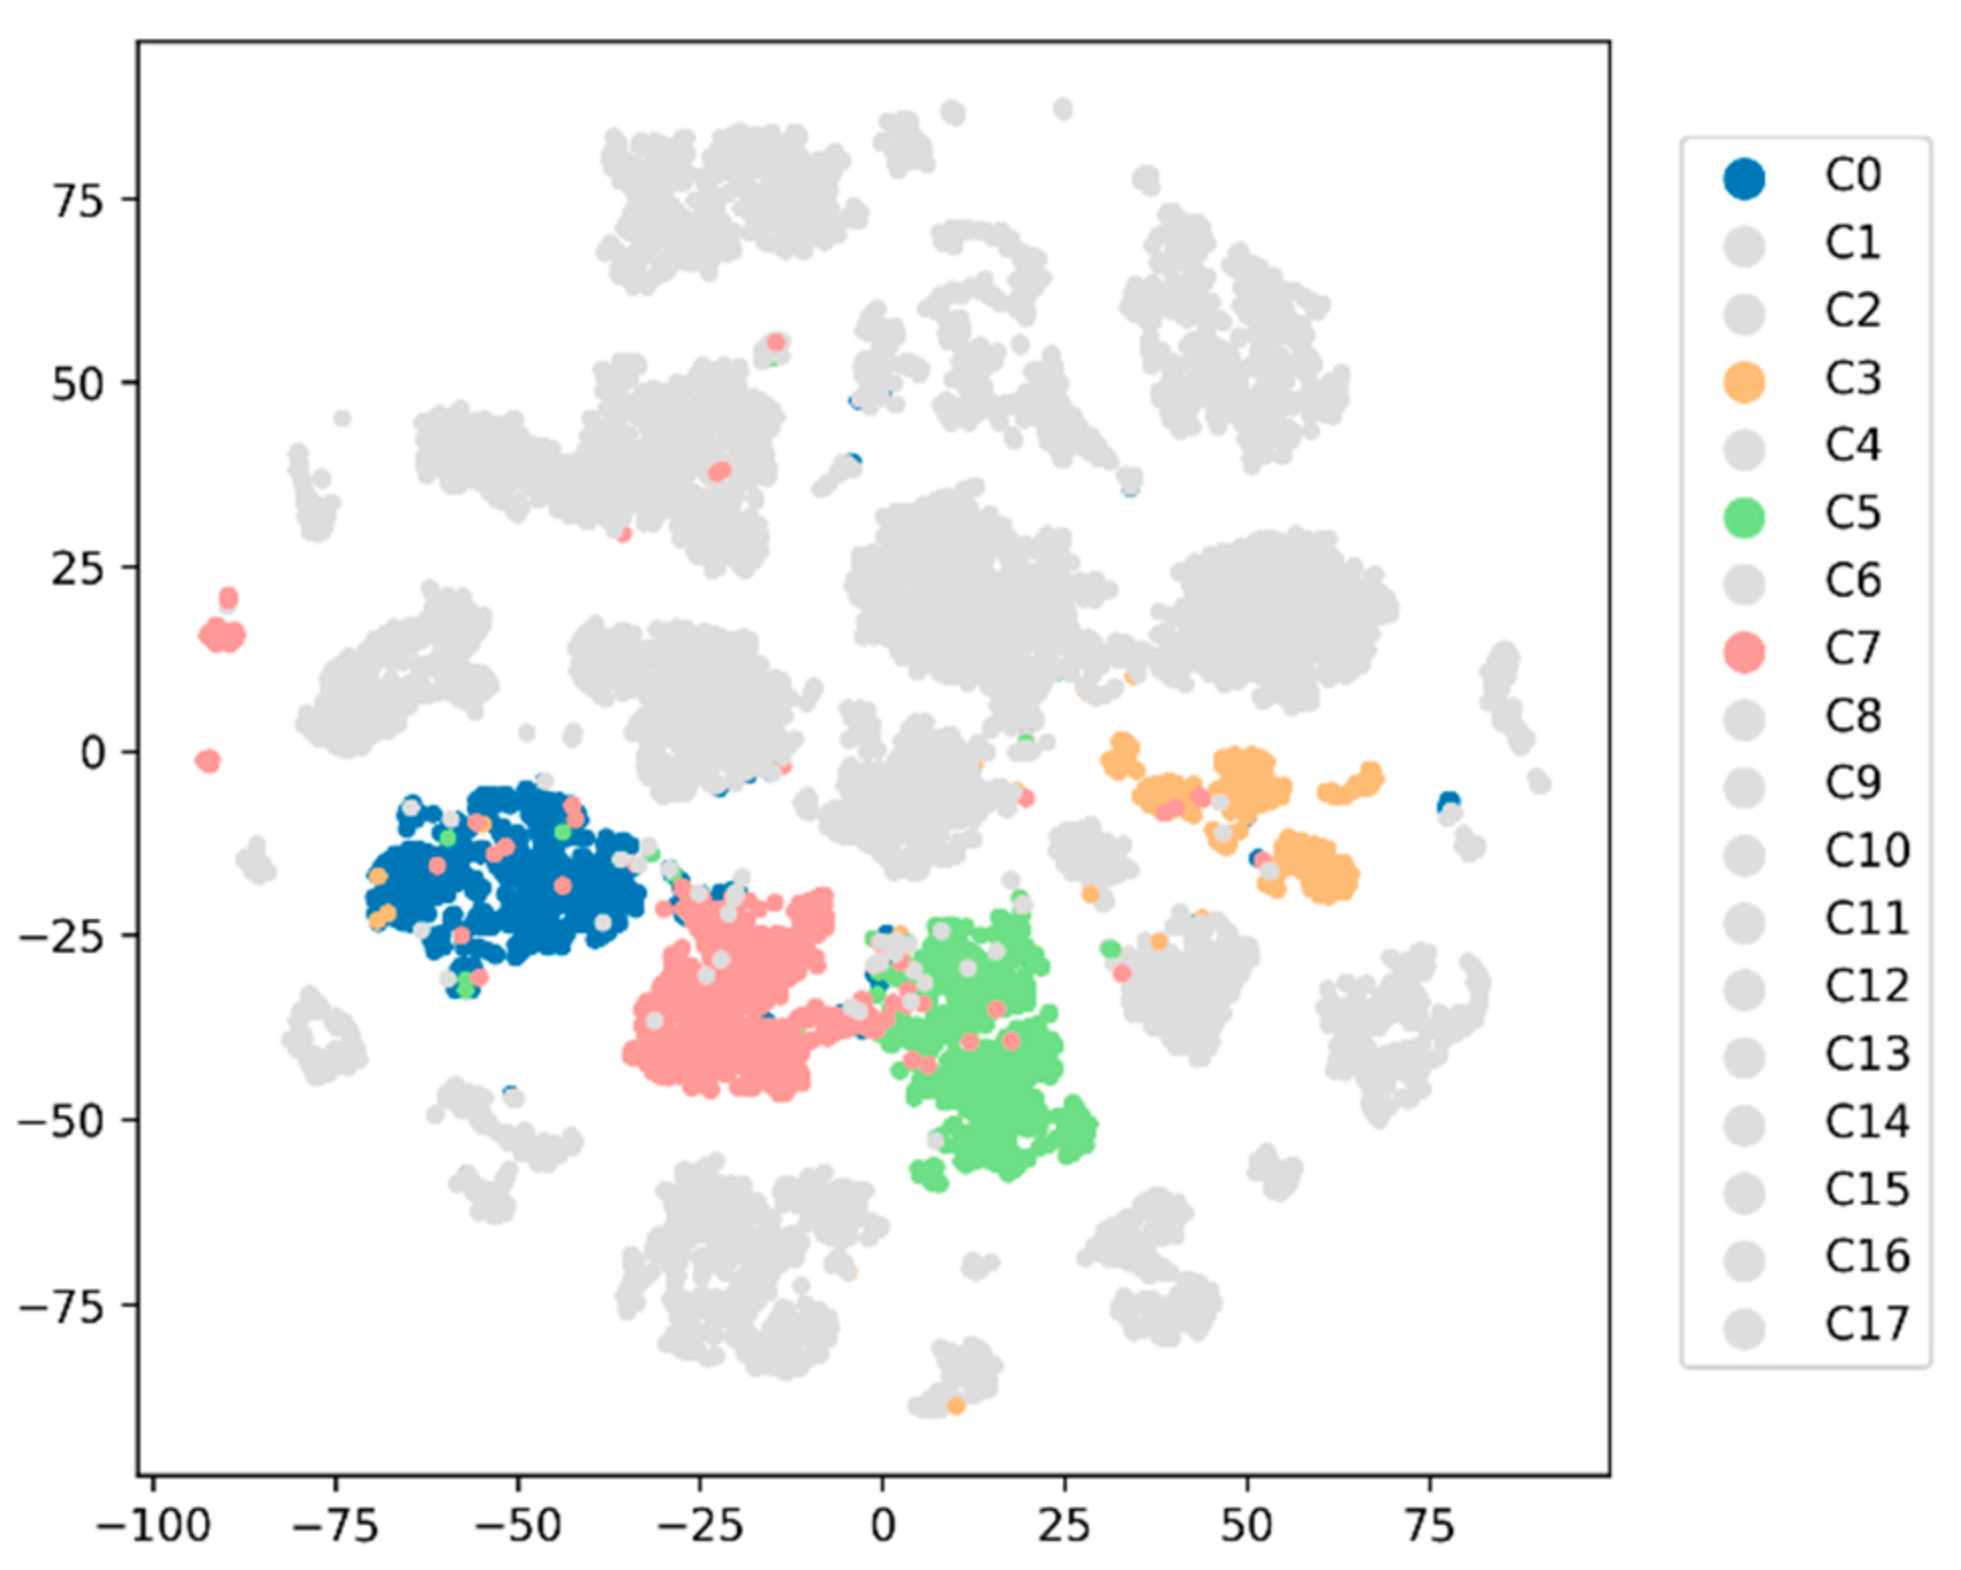
4.2. Blind Test
5. Discussion
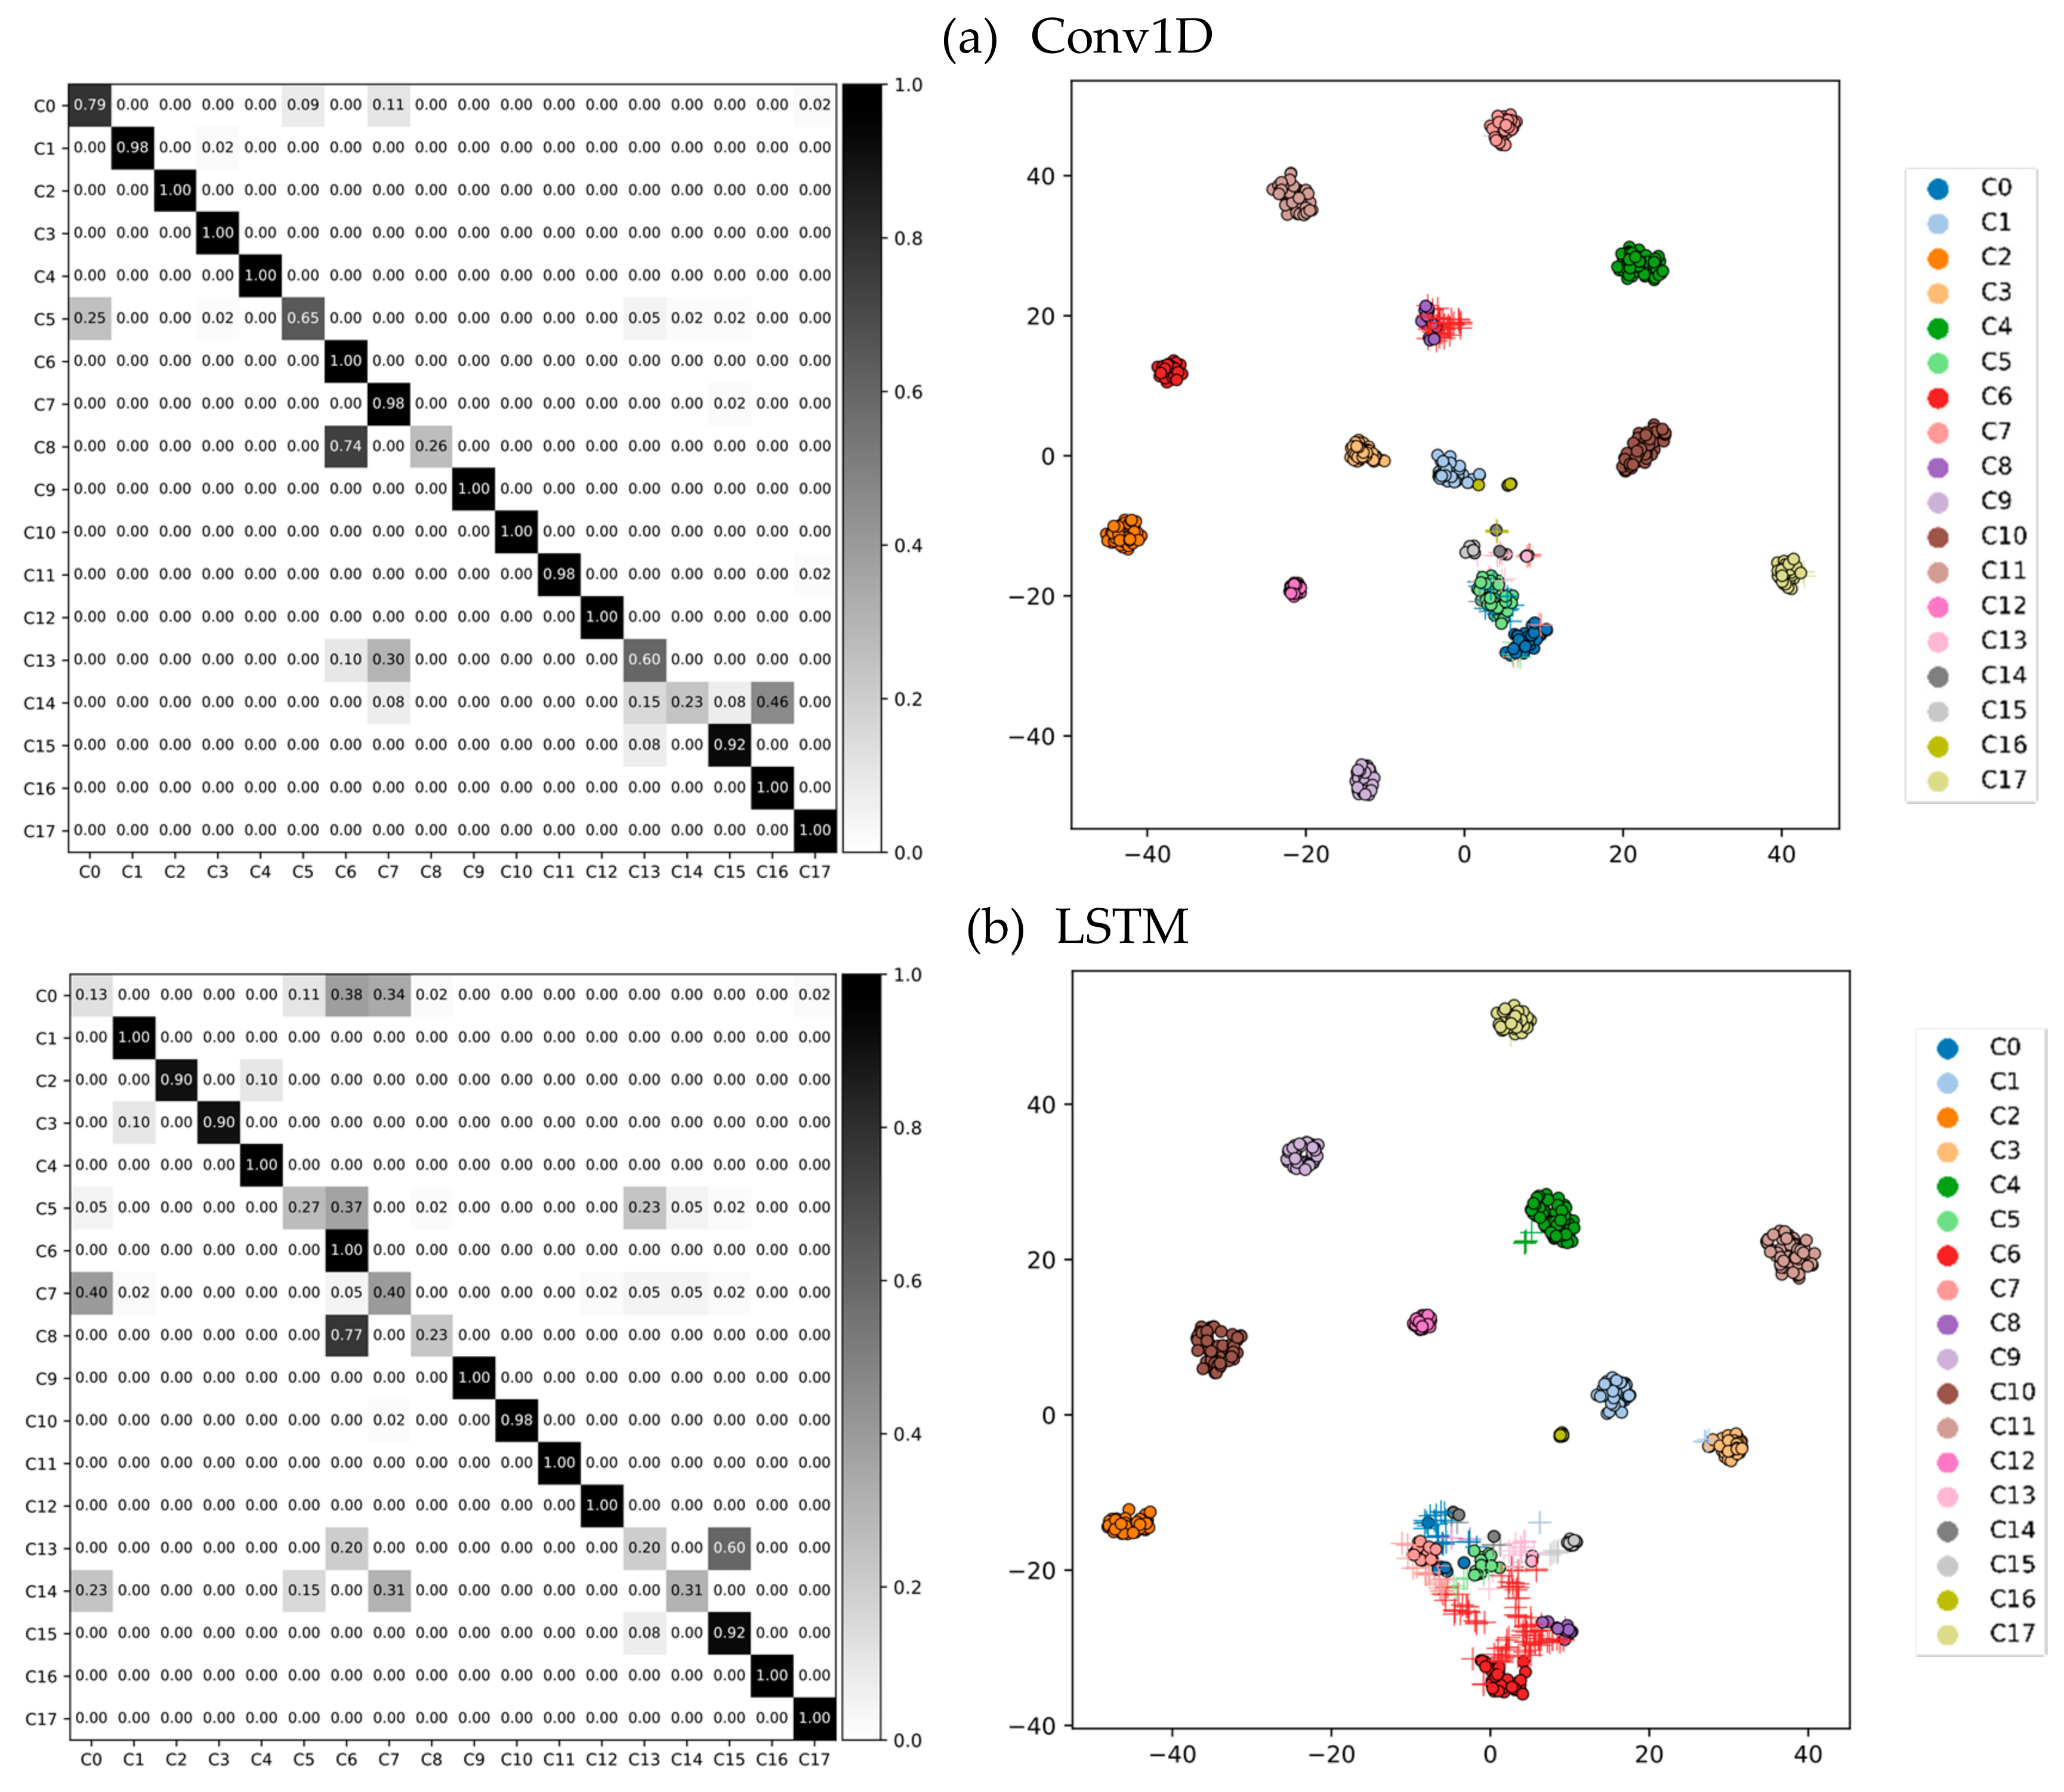
5.1. Classification Performance
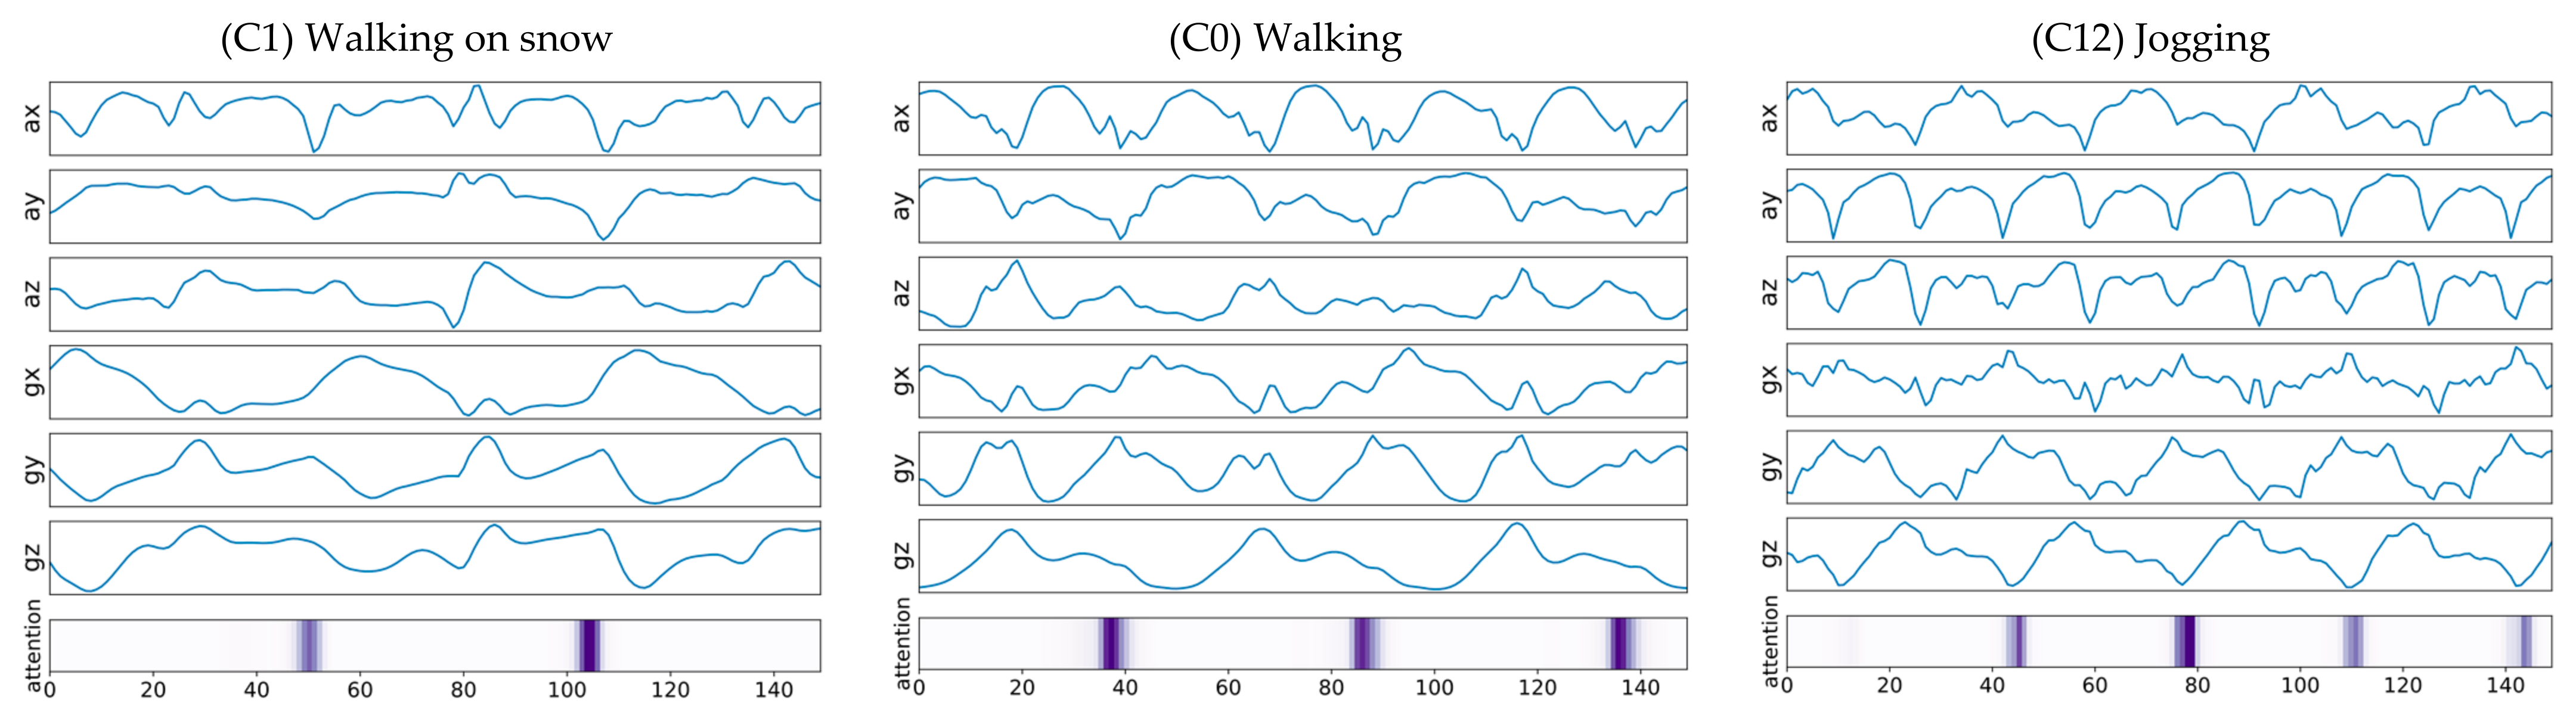
5.2. Attention Mechanism
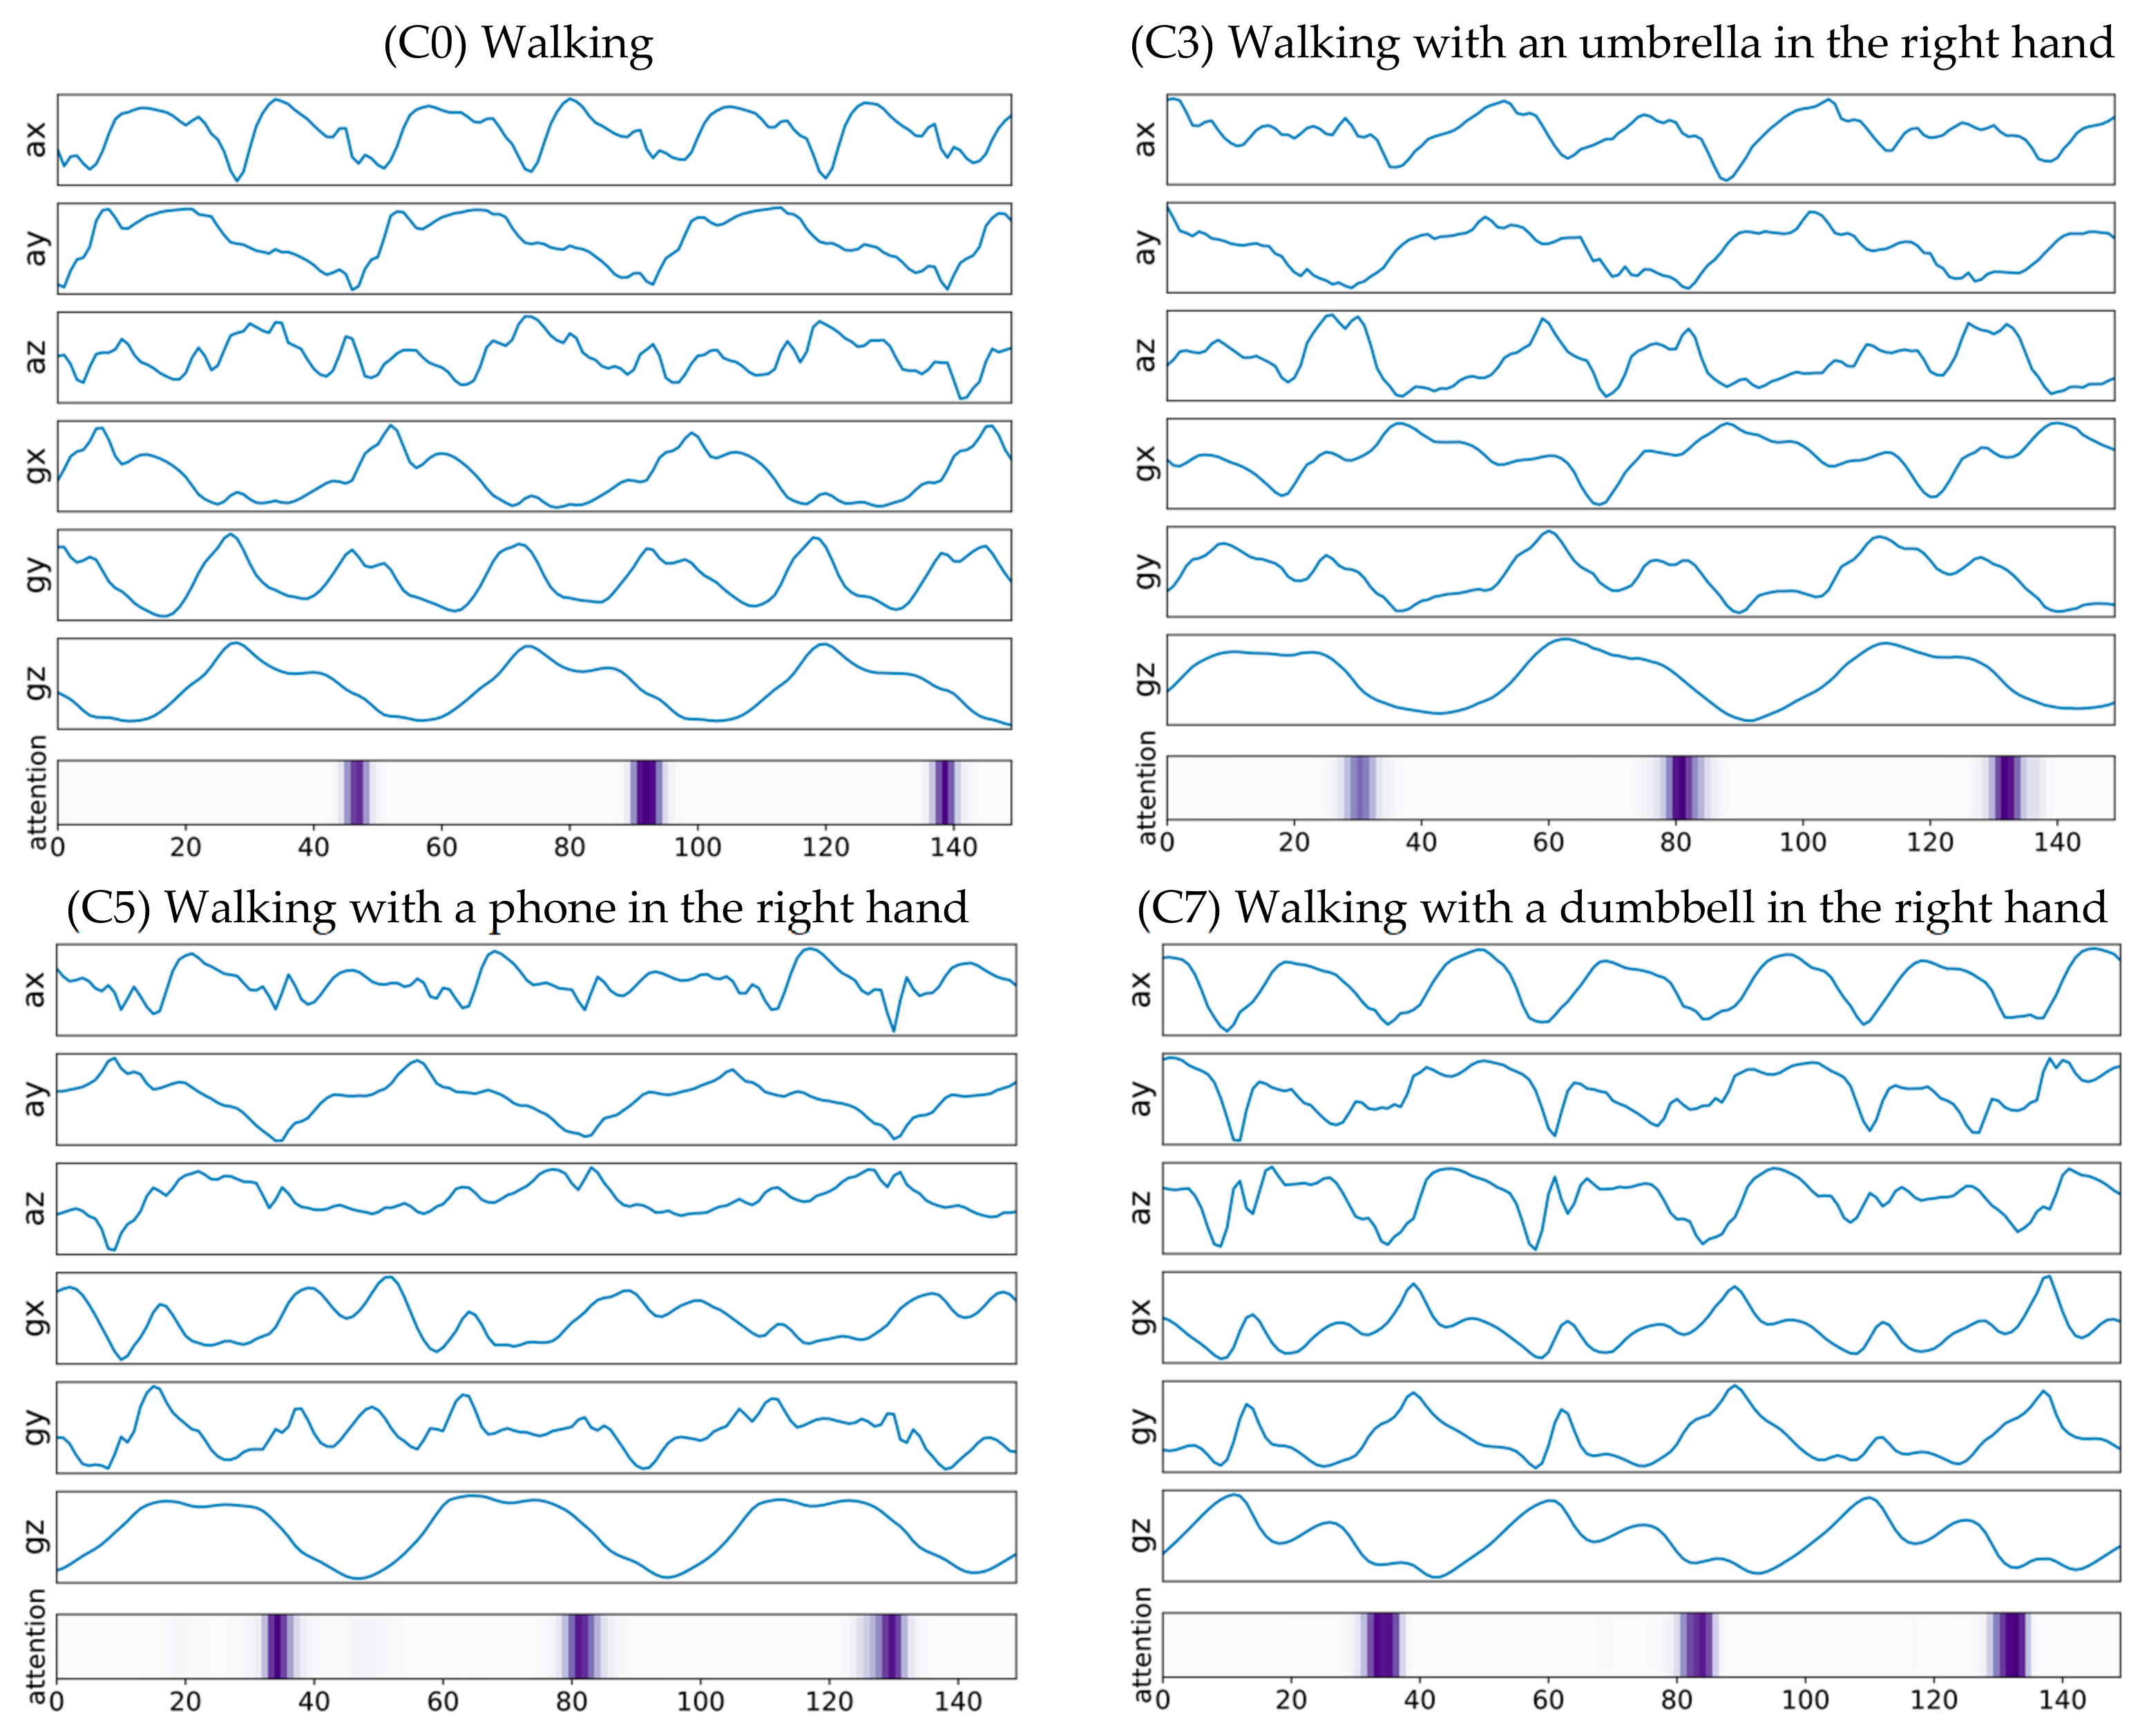
5.3. Walking with Something in the Right Hand
5.4. Evaluation on Walking-Related Datasets
6. Limitations and Applications
6.1. Limitations
6.2. Applications
7. Conclusions
Author Contributions
Funding
Informed Consent Statement
Data Availability Statement
Acknowledgments
Conflicts of Interest
References
- Kwon, M.C.; Ju, M.; Choi, S. Classification of various daily behaviors using deep learning and smart watch. In Proceedings of the 2017 Ninth International Conference on Ubiquitous and Future Networks (ICUFN), Milan, Italy, 4–7 July 2017; pp. 735–740. [Google Scholar]
- Balli, S.; Sağbaş, E.A.; Peker, M. Human activity recognition from smart watch sensor data using a hybrid of principal component analysis and random forest algorithm. Meas. Control 2019, 52, 37–45. [Google Scholar] [CrossRef] [Green Version]
- Fuller, D.; Anaraki, J.R.; Simango, B.; Rayner, M.; Dorani, F.; Bozorgi, A.; Luan, H.; A Basset, F. Predicting lying, sitting, walking and running using Apple Watch and Fitbit data. BMJ Open Sport Exerc. Med. 2021, 7, e001004. [Google Scholar] [CrossRef]
- Weiss, G.M.; Timko, J.L.; Gallagher, C.M.; Yoneda, K.; Schreiber, A.J. Smartwatch-based activity recognition: A machine learning approach. In Proceedings of the 2016 IEEE-EMBS International Conference on Biomedical and Health Informatics (BHI), Las Vegas, NV, USA, 24–27 February 2016; pp. 426–429. [Google Scholar]
- Laput, G.; Harrison, C. Sensing Fine-grained hand activity with smartwatches. In Proceedings of the 2019 CHI Conference on Human Factors in Computing Systems, Glasgow, Scotland, 4–9 May 2019; pp. 1–13. [Google Scholar]
- Wang, N.; Ambikairajah, E.; Lovell, N.H.; Celler, B.G. Accelerometry based classification of walking patterns using time-frequency analysis. In Proceedings of the 29th Annual International Conference of the IEEE Engineering in Medicine and Biology Society, Lyon, France, 22–26 August 2007; pp. 4899–4902. [Google Scholar]
- Bachlin, M.; Plotnik, M.; Roggen, D.; Maidan, I.; Hausdorff, J.M.; Giladi, N.; Troster, G. Wearable assistant for Parkinson’s disease patients with the freezing of gait symptom. IEEE Trans. Inf. Technol. Biomed. 2009, 14, 436–446. [Google Scholar] [CrossRef]
- Kwapisz, J.R.; Weiss, G.; Moore, S.A. Activity recognition using cell phone accelerometers. ACM SIGKDD Explor. Newsl. 2011, 12, 74–82. [Google Scholar] [CrossRef]
- Christ, M.; Braun, N.; Neuffer, J.; Kempa-Liehr, A.W. Time series feature extraction on basis of scalable hypothesis tests (tsfresh–a python package). Neurocomputing 2018, 307, 72–77. [Google Scholar] [CrossRef]
- Alsheikh, M.A.; Selim, A.; Niyato, D.; Doyle, L.; Lin, S.; Tan, H.P. Deep activity recognition models with triaxial accelerometers. In Proceedings of the Workshops at the Thirtieth AAAI Conference on Artificial Intelligence, Phoenix, AZ, USA, 12–17 February 2016. [Google Scholar]
- Hausdorff, J.M.; Edelberg, H.K.; Mitchell, S.L.; Goldberger, A.L.; Wei, J.Y. Increased gait unsteadiness in community-dwelling elderly fallers. Arch. Phys. Med. Rehabil. 1997, 78, 278–283. [Google Scholar] [CrossRef]
- Saito, K.; Zecca, M.; Sessa, S.; Lin, Z.; Bartolomeo, L.; Cosentino, S.; Petersen, K.; Ishii, H.; Ikai, T.; Takanishi, A. Assessment of walking quality by using inertial measurement units. In Proceedings of the 2012 First International Conference on Innovative Engineering Systems, Alexandria, Egypt, 7–9 December 2012; pp. 13–18. [Google Scholar]
- Bao, L.; Intille, S.S. Activity recognition from user-annotated acceleration data. In Pervasive Computing; Ferscha, A., Mattern, F., Eds.; Lecture Notes in Computer Science; Springer: Berlin/Heidelber, Germany, 2004; pp. 1–17. [Google Scholar]
- Bui, D.T.; Nguyen, N.D.; Jeong, G.-M. A robust step detection algorithm and walking distance estimation based on daily wrist activity recognition using a smart band. Sensors 2018, 18, 2034. [Google Scholar]
- Wang, J.-S.; Lin, C.-W.; Yang, Y.-T.C.; Ho, Y.-J. Walking pattern classification and walking distance estimation algorithms using gait phase information. IEEE Trans. Biomed. Eng. 2012, 59, 2884–2892. [Google Scholar] [CrossRef] [PubMed]
- Wang, N.; Redmond, S.J.; Ambikairajah, E.; Celler, B.G.; Lovell, N.H. Can triaxial accelerometry accurately recognize inclined walking terrains? IEEE Trans. Biomed. Eng. 2010, 57, 2506–2516. [Google Scholar] [CrossRef] [PubMed]
- Alemayoh, T.; Lee, J.; Okamoto, S. New Sensor data structuring for deeper feature extraction in human activity recognition. Sensors 2021, 21, 2814. [Google Scholar] [CrossRef] [PubMed]
- Hanai, Y.; Nishimura, J.; Kuroda, T. Haar-like filtering for human activity recognition using 3d accelerometer. In Proceedings of the 2009 IEEE 13th digital Signal Processing Workshop and 5th IEEE signal Processing Education Workshop, Marco Island, FL, USA, 4–7 January 2009; pp. 675–678. [Google Scholar]
- Lockhart, J.W.; Weiss, G.M. The benefits of personalized smartphone-based activity recognition models. In Proceedings of the SIAM international Conference On Data Mining, Philadelphia, PA, USA, 24–26 April 2014; pp. 614–622. [Google Scholar]
- Ordóñez, F.J.; Roggen, D. Deep convolutional and lstm recurrent neural networks for multimodal wearable activity recognition. Sensors 2016, 16, 115. [Google Scholar] [CrossRef] [Green Version]
- Mekruksavanich, S.; Hnoohom, N.; Jitpattanakul, A. Smartwatch-based sitting detection with human activity recognition for office workers syndrome. In Proceedings of the 2018 International ECTI Northern Section Conference on Electrical, Electronics, Computer and Telecommunications Engineering (ECTI-NCON), Chiang Rai, Thailand, 25–28 February 2018; pp. 160–164. [Google Scholar]
- Mekruksavanich, S.; Jitpattanakul, A. Smartwatch-based human activity recognition using hybrid lstm network. In Proceedings of the 2020 IEEE Sensors, Rotterdam, The Netherlands, 25–28 October 2020; pp. 1–4. [Google Scholar]
- Sun, K.; Xiao, B.; Liu, D.; Wang, J. Deep high-resolution representation learning for human pose estimation. In Proceedings of the IEEE/CVF Conference on Computer Vision and Pattern Recognition, Long Beach, CA, USA, 16–20 June 2019; pp. 5693–5703. [Google Scholar]
- Benjamini, Y.; Yekutieli, D. The control of the false discovery rate in multiple testing under dependency. Ann. Stat. 2001, 29, 1165–1188. [Google Scholar] [CrossRef]
- Cortes, C.; Vapnik, V. Support-vector networks. Mach. Learn. 1995, 20, 273–297. [Google Scholar] [CrossRef]
- Liaw, A.; Wiener, M. Classification and regression by randomForest. R News 2002, 2, 18–22. [Google Scholar]
- Bishop, C.M. Pattern Recognition and Machine Learning; Springer: New York, NY, USA, 2006. [Google Scholar]
- Gislason, P.O.; Benediktsson, J.A.; Sveinsson, J.R. Random forests for land cover classification. Pattern Recognit. Lett. 2006, 27, 294–300. [Google Scholar] [CrossRef]
- Kang, G.; Kim, S.-C. DeepEcho: Echoacoustic recognition of materials using returning echoes with deep neural networks. IEEE Trans. Emerg. Top. Comput. 2020, in press. [Google Scholar]
- Tran, D.; Bourdev, L.; Fergus, R.; Torresani, L.; Paluri, M. Learning spatiotemporal features with 3d convolutional networks. In Proceedings of the IEEE International Conference on Computer Vision, Las Condes, Chile, 11–18 December 2015; pp. 4489–4497. [Google Scholar]
- LeCun, Y.; Bengio, Y. Convolutional networks for images, speech, and time series. In The Handbook of Brain Theory and Neural Networks; MIT Press: Cambridge, MA, USA, 1995; Volume 3361. [Google Scholar]
- Kim, Y. Convolutional neural networks for sentence classification. In Proceedings of the Conference on Empirical Methods in Natural Language Processing (EMNLP), Doha, Qatar, 25–29 October 2014; pp. 1746–1751. [Google Scholar]
- Kiranyaz, S.; Avci, O.; Abdeljaber, O.; Ince, T.; Gabbouj, M.; Inman, D.J. 1D convolutional neural networks and applications: A survey. Mech. Syst. Signal Process. 2020, 151, 10739. [Google Scholar] [CrossRef]
- Perol, T.; Gharbi, M.; Denolle, M. Convolutional neural network for earthquake detection and location. Sci. Adv. 2018, 4, e1700578. [Google Scholar] [CrossRef] [PubMed] [Green Version]
- Ryu, S.; Kim, S.-C. Embedded identification of surface based on multirate sensor fusion with deep neural network. IEEE Embed. Syst. Lett. 2020, 13, 49–52. [Google Scholar] [CrossRef]
- Han, B.-K.; Ryu, J.-K.; Kim, S.-C. Context-aware winter sports based on multivariate sequence learning. Sensors 2019, 19, 3296. [Google Scholar] [CrossRef] [PubMed] [Green Version]
- Kiranyaz, S.; Ince, T.; Hamila, R.; Gabbouj, M. Convolutional neural networks for patient-specific ECG classification. In Proceedings of the 37th Annual International Conference of the IEEE Engineering in Medicine and Biology Society (EMBC), Milan, Italy, 25–29 August 2015; pp. 2608–2611. [Google Scholar]
- Ryu, S.; Kim, S.-C. Knocking and listening: Learning mechanical impulse response for understanding surface characteristics. Sensors 2020, 20, 369. [Google Scholar] [CrossRef] [Green Version]
- Hochreiter, S.; Schmidhuber, J. Long short-term memory. Neural Comput. 1997, 9, 1735–1780. [Google Scholar] [CrossRef]
- Chung, J.; Gulcehre, C.; Cho, K.; Bengio, Y. Empirical evaluation of gated recurrent neural networks on sequence modeling. arXiv 2014, arXiv:1412.3555. [Google Scholar]
- Cho, K.; Van Merrienboer, B.; Gulcehre, C.; Bahdanau, D.; Bougares, F.; Schwenk, H.; Bengio, Y. Learning phrase representations using RNN encoder-decoder for statistical machine translation. arXiv 2014, arXiv:1406.1078. [Google Scholar]
- Han, B.-K.; Kim, S.-C.; Kwon, N.-S. DeepSnake: Sequence learning of joint torques using a gated recurrent neural network. IEEE Access 2018, 6, 76263–76270. [Google Scholar] [CrossRef]
- Dua, N.; Singh, S.N.; Semwal, V.B. Multi-input CNN-GRU based human activity recognition using wearable sensors. Computing 2021, 103, 1461–1478. [Google Scholar] [CrossRef]
- Graves, A.; Mohamed, A.-R.; Hinton, G. Speech recognition with deep recurrent neural networks. In Proceedings of the IEEE International Conference on Acoustics, Speech and Signal Processing, Vancuver, BC, Canada, 26–31 May 2013; pp. 6645–6649. [Google Scholar]
- Bahdanau, D.; Cho, K.; Bengio, Y. Neural machine translation by jointly learning to align and translate. arXiv 2014, arXiv:1409.0473. [Google Scholar]
- Luong, T.; Pham, H.; Manning, C. Effective approaches to attention-based neural machine translation. arXiv 2015, arXiv:1508.04025. [Google Scholar]
- Xu, K.; Ba, J.; Kiros, R.; Cho, K.; Courville, A.; Salakhudinov, R.; Zemel, R.; Bengio, Y. Show, attend and tell: Neural image caption generation with visual attention. In Proceedings of the International Conference on Machine Learning, Lille, France, 6–11 July 2015; pp. 2048–2057. [Google Scholar]
- Ran, X.; Shan, Z.; Fang, Y.; Lin, C. An LSTM-based method with attention mechanism for travel time prediction. Sensors 2019, 19, 861. [Google Scholar] [CrossRef] [Green Version]
- Zeng, M.; Gao, H.; Yu, T.; Mengshoel, O.J.; Langseth, H.; Lane, I.; Liu, X. Understanding and improving recurrent networks for human activity recognition by continuous attention. In Proceedings of the 2018 ACM International Symposium on Wearable Computers, Singapore, 8–12 October 2018; pp. 56–63. [Google Scholar]
- Kingma, D.P.; Ba, J. Adam: A method for stochastic optimization. arXiv 2014, arXiv:1412.6980. [Google Scholar]
- Maaten, L.v.d.; Hinton, G. Visualizing data using t-SNE. J. Mach. Learn. Res. 2008, 9, 2579–2605. [Google Scholar]
- Haque, M.N.; Mahbub, M.; Tarek, M.H.; Lota, L.N.; Ali, A.A. Nurse care activity recognition: A GRU-based approach with attention mechanism. In Proceedings of the 2019 ACM International Joint Conference on Pervasive and Ubiquitous Computing and In Proceedings of the 2019 ACM International Symposium on Wearable Computers, London, UK, 11–13 September 2019; pp. 719–723. [Google Scholar]
- Ma, H.; Li, W.; Zhang, X.; Gao, S.; Lu, S. AttnSense: Multi-level attention mechanism for multimodal human activity recognition. In Proceedings of the Twenty-Eighth International Joint Conference on Artificial Intelligence, Macao, China, 10–16 August 2019; pp. 3109–3115. [Google Scholar]
- Gao, W.; Zhang, L.; Teng, Q.; He, J.; Wu, H.D. DanHAR: Dual attention network for multimodal human activity recognition using wearable sensors. Appl. Soft Comput. 2021, 111, 107728. [Google Scholar] [CrossRef]
- Reiss, A.; Stricker, D. Introducing a new benchmarked dataset for activity monitoring. In Proceedings of the 2012 16th International Symposium On Wearable Computers, Heidelberg, Germany, 12–16 September 2012; pp. 108–109. [Google Scholar]
- Anguita, D.; Ghio, A.; Oneto, L.; Parra, X.; Reyes-Ortiz, J.L. A public domain dataset for human activity recognition using smartphones. In Proceedings of the European Symposium on Artificial Neural Networks, Computational Intelligence and Machine Learning, Bruges, Belgium, 24–26 April 2013. [Google Scholar]
- Reyes-Ortiz, J.-L.; Oneto, L.; Sama, A.; Parra, X.; Anguita, D. Transition-aware human activity recognition using smartphones. Neurocomputing 2016, 171, 754–767. [Google Scholar] [CrossRef] [Green Version]
- Chen, T.; Xu, R.; He, Y.; Wang, X. Improving sentiment analysis via sentence type classification using BiLSTM-CRF and CNN. Expert Syst. Appl. 2017, 72, 221–230. [Google Scholar] [CrossRef] [Green Version]
- Schuster, M.; Paliwal, K.K. Bidirectional recurrent neural networks. IEEE Trans. Signal Process. 1997, 45, 2673–2681. [Google Scholar] [CrossRef] [Green Version]


| No. | Class | Description |
|---|---|---|
| C0 | walking | walking on flat ground |
| C1 | walking snow | walking on thick snow (approx. 5 cm to 7 cm) |
| C2 | walking umbrella left | walking with umbrella in left hand on a rainy day |
| C3 | walking umbrella right | walking with umbrella in right hand on a rainy day |
| C4 | walking phone left | walking while looking at a smartphone in the left hand |
| C5 | walking phone right | walking while looking at a smartphone in the right hand |
| C6 | walking dumbbell left | walking with a 2-kg dumbbell in the left hand |
| C7 | walking dumbbell right | walking with a 2-kg dumbbell in the right hand |
| C8 | walking dumbbell both | walking with a 2-kg dumbbell in each hand |
| C9 | walking cross arms | walking with arms crossed |
| C10 | walking hands behind back | walking with hands behind the back |
| C11 | walking pocket both | walking with hands in pockets |
| C12 | jogging | fitness running |
| C13 | uphill | walking up a hill |
| C14 | downhill | walking down a hill |
| C15 | upstairs | walking up steps |
| C16 | downstairs | walking down steps |
| C17 | standing and sitting | doing something while standing or sitting |
| Type of Machine Learning | Classification Accuracy | Classification Model | Target Motions | Literature |
|---|---|---|---|---|
| Feature-Based | 84.26% | decision tree | walking, walking carrying items, running, sitting, standing, lying, stretching, watching TV, scrubbing, folding laundry, brushing teeth, working, eating, or drinking, reading, bicycling, vacuuming, ascending stairs, riding elevator, or escalator | [13] |
| 90.80% | random forest | walking, running, sitting, lying | [3] | |
| 93.30% | random forest | walking, running, ascending stairs, standing, sitting, kicking soccer ball, dribbling basketball, playing catch with tennis ball, typing, handwriting, clapping, brushing teeth, folding laundry, eating, or drinking | [4] | |
| 93.91% | decision tree | walking, running, standing, walking slope-up, walking slope-down | [18] | |
| 82.46% | Gaussian mixture model | walking, walking slope-up, walking slope-down, ascending stairs, descending stairs, | [16] | |
| Deep Learning | 99.24% | neural network (5-level layer) | walking, running, working, reading, studying, taking a rest, playing a computer game, eating, or drinking, cooking, washing dished, taking a transport | [1] |
| 91.06% | neural network (multilayer perceptron) | walking, running, ascending stairs, descending stairs, sitting, standing | [8] | |
| 98.70% | neural network (multilayer perceptron) | walking, running, ascending stairs, descending stairs, sitting, standing, lying | [19] | |
| 92.05% | neural network (multilayer perceptron) | walking, walking slope-up, walking slope-down, ascending stairs, descending stairs | [6] | |
| 99.40% | neural network (CNN) | walking, running, jumping, ascending stairs, descending stairs, standing and sitting, lying, bicycling | [17] |
| No. | Class | Total Duration (min) | Total Duration (h) |
|---|---|---|---|
| C0 | walking | 188.7 | 3.14 |
| C1 | walking snow | 109.2 | 1.82 |
| C2 | walking umbrella left | 108.3 | 1.81 |
| C3 | walking umbrella right | 86.8 | 1.45 |
| C4 | walking phone left | 188.0 | 3.13 |
| C5 | walking phone right | 188.0 | 3.13 |
| C6 | walking dumbbell left | 180.2 | 3.00 |
| C7 | walking dumbbell right | 191.8 | 3.20 |
| C8 | walking dumbbell both | 70.5 | 1.18 |
| C9 | walking cross arms | 99.8 | 1.66 |
| C10 | walking hands behind back | 200.0 | 3.33 |
| C11 | walking pocket both | 180.0 | 3.00 |
| C12 | jogging | 96.2 | 1.60 |
| C13 | uphill | 121.7 | 2.03 |
| C14 | downhill | 148.2 | 2.47 |
| C15 | upstairs | 194.2 | 3.24 |
| C16 | downstairs | 174.0 | 2.90 |
| C17 | standing sitting | 185.2 | 3.09 |
| Total | 2768.8 | 46.45 |
| Feature Name | Descriptions |
|---|---|
| sum_values | sum over the timeseries values |
| fft_coefficient | Fourier coefficients of the one-dimensional discrete Fourier transform for real input by fast Fourier transform algorithm |
| autocorrelation | autocorrelation coefficient |
| partial_autocorrelation | value of partial autocorrelation function at the given lag |
| ar_coefficient | unconditional maximum likelihood of an autoregressive process |
| fourier_entropy | binned entropy of the power spectral density of the time series |
| change_quantiles | average absolute value of consecutive changes of the time series inside the corridor |
| binned_entropy | binned entropy |
| agg_linear_trend | linear least-squares regression for values of the time series |
| permutation_entropy | permutation entropy |
| number_peaks | number of peaks of the time series |
| lempel_ziv_complexity | complexity estimate based on the Lempel–Ziv compression algorithm |
| Approach | Model | T = 100 (Approx. 2 s) | T = 150 (Approx. 3 s) | ||
|---|---|---|---|---|---|
| Train Accuracy (Fm) | Test Accuracy (Fm) | Train Accuracy (Fm) | Test Accuracy (Fm) | ||
| Feature-based | NB | 49.564 (48.494) | 49.441 (48.442) | 53.019 (51.801) | 53.382 (52.108) |
| RF | 54.764 (49.016) | 53.895 (48.152) | 53.968 (48.096) | 53.400 (47.439) | |
| SVM | 88.513 (88.357) | 83.524 (83.262) | 88.843 (88.707) | 84.933 (84.706) | |
| Deep Learning | Conv1D | 96.902 (96.893) | 94.597 (94.571) | 99.212 (99.211) | 96.976 (96.971) |
| GRU | 99.968 (99.967) | 96.122 (96.109) | 100.0 (100.0) | 96.788 (96.782) | |
| LSTM | 99.970 (99.974) | 96.252 (96.249) | 99.989 (99.990) | 97.158 (97.156) | |
| GRU + Att | 99.949 (99.946) | 96.157 (96.156) | 99.997 (99.996) | 96.902 (96.903) | |
| LSTM + Att | 99.994 (99.996) | 96.103 (96.091) | 99.994 (99.993) | 97.096 (97.097) | |
| Approach | Model | T = 100 (Approx. 2 s) Inference Time (msec) | T = 150 (Approx. 3 s) Inference Time (msec) |
|---|---|---|---|
| Feature-based | NB | 3.553 ± 0.327 (521.888 ± 3.797) | 3.554 ± 0.092 (547.842 ± 0.479) |
| RF | 9.726 ± 0.908 (564.915 ± 3.968) | 9.627 ± 0.448 (526.848 ± 9.573) | |
| SVM | 8.947 ± 0.167 (519.796 ± 3.379) | 7.249 ± 0.137 (566.064 ± 3.605) | |
| Deep Learning | Conv1D | 32.336 ± 2.131 | 31.831 ± 2.390 |
| GRU | 34.947 ± 1.998 | 35.542 ± 2.173 | |
| LSTM | 34.493 ± 1.636 | 36.731 ± 2.022 | |
| GRU + Att | 35.261 ± 1.932 | 36.398 ± 1.934 | |
| LSTM + Att | 35.174 ± 1.908 | 36.693 ± 1.985 |
| No. | Class | Duration (min) |
|---|---|---|
| C0 | walking | 2.4 |
| C1 | walking snow | 2.1 |
| C2 | walking umbrella left | 2.5 |
| C3 | walking umbrella right | 2.0 |
| C4 | walking phone left | 3.0 |
| C5 | walking phone right | 3.0 |
| C6 | walking dumbbell left | 1.9 |
| C7 | walking dumbbell right | 2.1 |
| C8 | walking dumbbell both | 2.9 |
| C9 | walking cross arms | 2.1 |
| C10 | walking hands behind back | 3.1 |
| C11 | walking pocket both | 3.0 |
| C12 | jogging | 1.4 |
| C13 | uphill | 0.5 |
| C14 | downhill | 0.7 |
| C15 | upstairs | 0.7 |
| C16 | downstairs | 0.5 |
| C17 | standing sitting | 2.0 |
| Total | 35.9 |
| PAMAP2 [55] | PAMAP2-Hand [55] | SBHAR [56] | DG [7] | Our Dataset | |
|---|---|---|---|---|---|
| Sensor | IMUs on the hand, chest and ankle | IMU on the hand | smartphone on the waist | embedded board on the waist | smartwatch on the wrist |
| Dim. | 18 (=3 × 6) | 6 (=1 × 6) | 6 (=1 × 6) | 9 (=3 × 3) | 6 (=1 × 6) |
| # of classes | 12 classes | 12 classes | 12 classes | 2 classes | 18 classes |
| Sampling rate | 50 Hz (downsampled) | 50 Hz (downsampled) | 50 Hz | 50 Hz (downsampled) | 50 Hz |
| Window | 3 s | 3 s | 3 s (50% overlap) | 3 s | 3 s |
| Metric | Fm | Fm | Fm | F1 | Fm |
| LSTM+Att | 92.850 | 86.830 | 94.123 | 82.596 | 97.097 |
| GRU+Att | 86.981 | 86.981 | 94.069 | 82.979 | 96.875 |
| LSTM | 91.383 | 86.188 | 93.353 | 82.805 | 97.156 |
| bi-LSTM | 92.112 | 84.805 | 93.132 | 82.756 | 97.122 |
| Conv1D | 93.093 | 89.811 | 94.295 | 85.272 | 96.971 |
Publisher’s Note: MDPI stays neutral with regard to jurisdictional claims in published maps and institutional affiliations. |
© 2021 by the authors. Licensee MDPI, Basel, Switzerland. This article is an open access article distributed under the terms and conditions of the Creative Commons Attribution (CC BY) license (https://creativecommons.org/licenses/by/4.0/).
Share and Cite
Kim, H.; Kim, H.-J.; Park, J.; Ryu, J.-K.; Kim, S.-C. Recognition of Fine-Grained Walking Patterns Using a Smartwatch with Deep Attentive Neural Networks. Sensors 2021, 21, 6393. https://doi.org/10.3390/s21196393
Kim H, Kim H-J, Park J, Ryu J-K, Kim S-C. Recognition of Fine-Grained Walking Patterns Using a Smartwatch with Deep Attentive Neural Networks. Sensors. 2021; 21(19):6393. https://doi.org/10.3390/s21196393
Chicago/Turabian StyleKim, Hyejoo, Hyeon-Joo Kim, Jinyoon Park, Jeh-Kwang Ryu, and Seung-Chan Kim. 2021. "Recognition of Fine-Grained Walking Patterns Using a Smartwatch with Deep Attentive Neural Networks" Sensors 21, no. 19: 6393. https://doi.org/10.3390/s21196393