
Ports Digitalization Level Evaluation


Abstract
:1. Introduction
2. Literature Review
- Simple digital systems (e.g., IT systems devoted to specific cargoes) that are not integrated with systems used by the port’s customers and other participants in the supply chains [34,50,51]. Such digital solutions can be established using common programmes (e.g., Excel) and can facilitate the gathering of evidence and evaluation of cargos handling volumes or passenger flows, accounting requirements, etc. Such systems are implemented in selected small and medium-sized ports.
- Intermediate digital systems that are based on block schemes and may be connected with information systems of other entities, e.g., customs, border control, etc. Such digital systems may be created by a port’s IT staff or special IT companies and are not too expensive [23]. Such systems may be applied in small, medium-sized and large ports.
- High precision (modern) digital systems may integrate port terminals with port administration, control bodies, customers and other entities involved in supply chain operations, increasing navigational safety and security. Such modern IT systems are usually developed for the needs of the specific maritime transport or port and other groups of users [12,52]. Such systems may be observed in selected large seaports.
3. Materials and Methods
- Scoring group 1 (SG1): navigation (v1); port surface (ports maps) (v2); ships location in port (v3); cargo type in ports, especially dangerous goods (v4).
- Scoring group 2 (SG2): people entering the port, according to ISPS code or terminals’ technology requirements (v5); emergency procedures in port (v6); ETA and ATA of ships (v7); real (actual) depths in port (v8); legal documents valid in the port (e.g., port rules, navigational regulations, etc.) (v9); public procurement issues (v10); port annual reports (v11).
- Scoring group 3 (SG3): port statistical data (v12); port development programs (v13); port development projects (v14); port newsletters (v15); companies operating in port and their activities (v15); technology (v16); port promotion materials (e.g., video, audio) (v17).
- Scoring group 4 (SG4): port organization (v18); port administration working time (v19); additional services in port (v20); port dues and tariffs (v21), human factor (v22).
- —i port’s digitalisation level.
- —correlation coefficient, assuming that this could vary in a range between 0.96–0.98.
- —assessment of all scoring groups for i port, that can be calculated using Equation (2):where:
- —number of scoring group, n = 1, …, 4 (this depends on the selected groups of factors).
- —assessment of scoring factor j in group n, given by respondent.
- —number of factors in group n.
- —weight coefficient of the scoring group n.
- A, B, H—coefficients.
- ωk, υk—sequence of noisy observations.
- xk, uk—control vectors.
- —the number of the measurements (interviews conducted in ports).
- —particular measurement results (port’s DIP scoring).
- —mathematical expectation of the average DIP scores, which can be calculated using Equation (6).
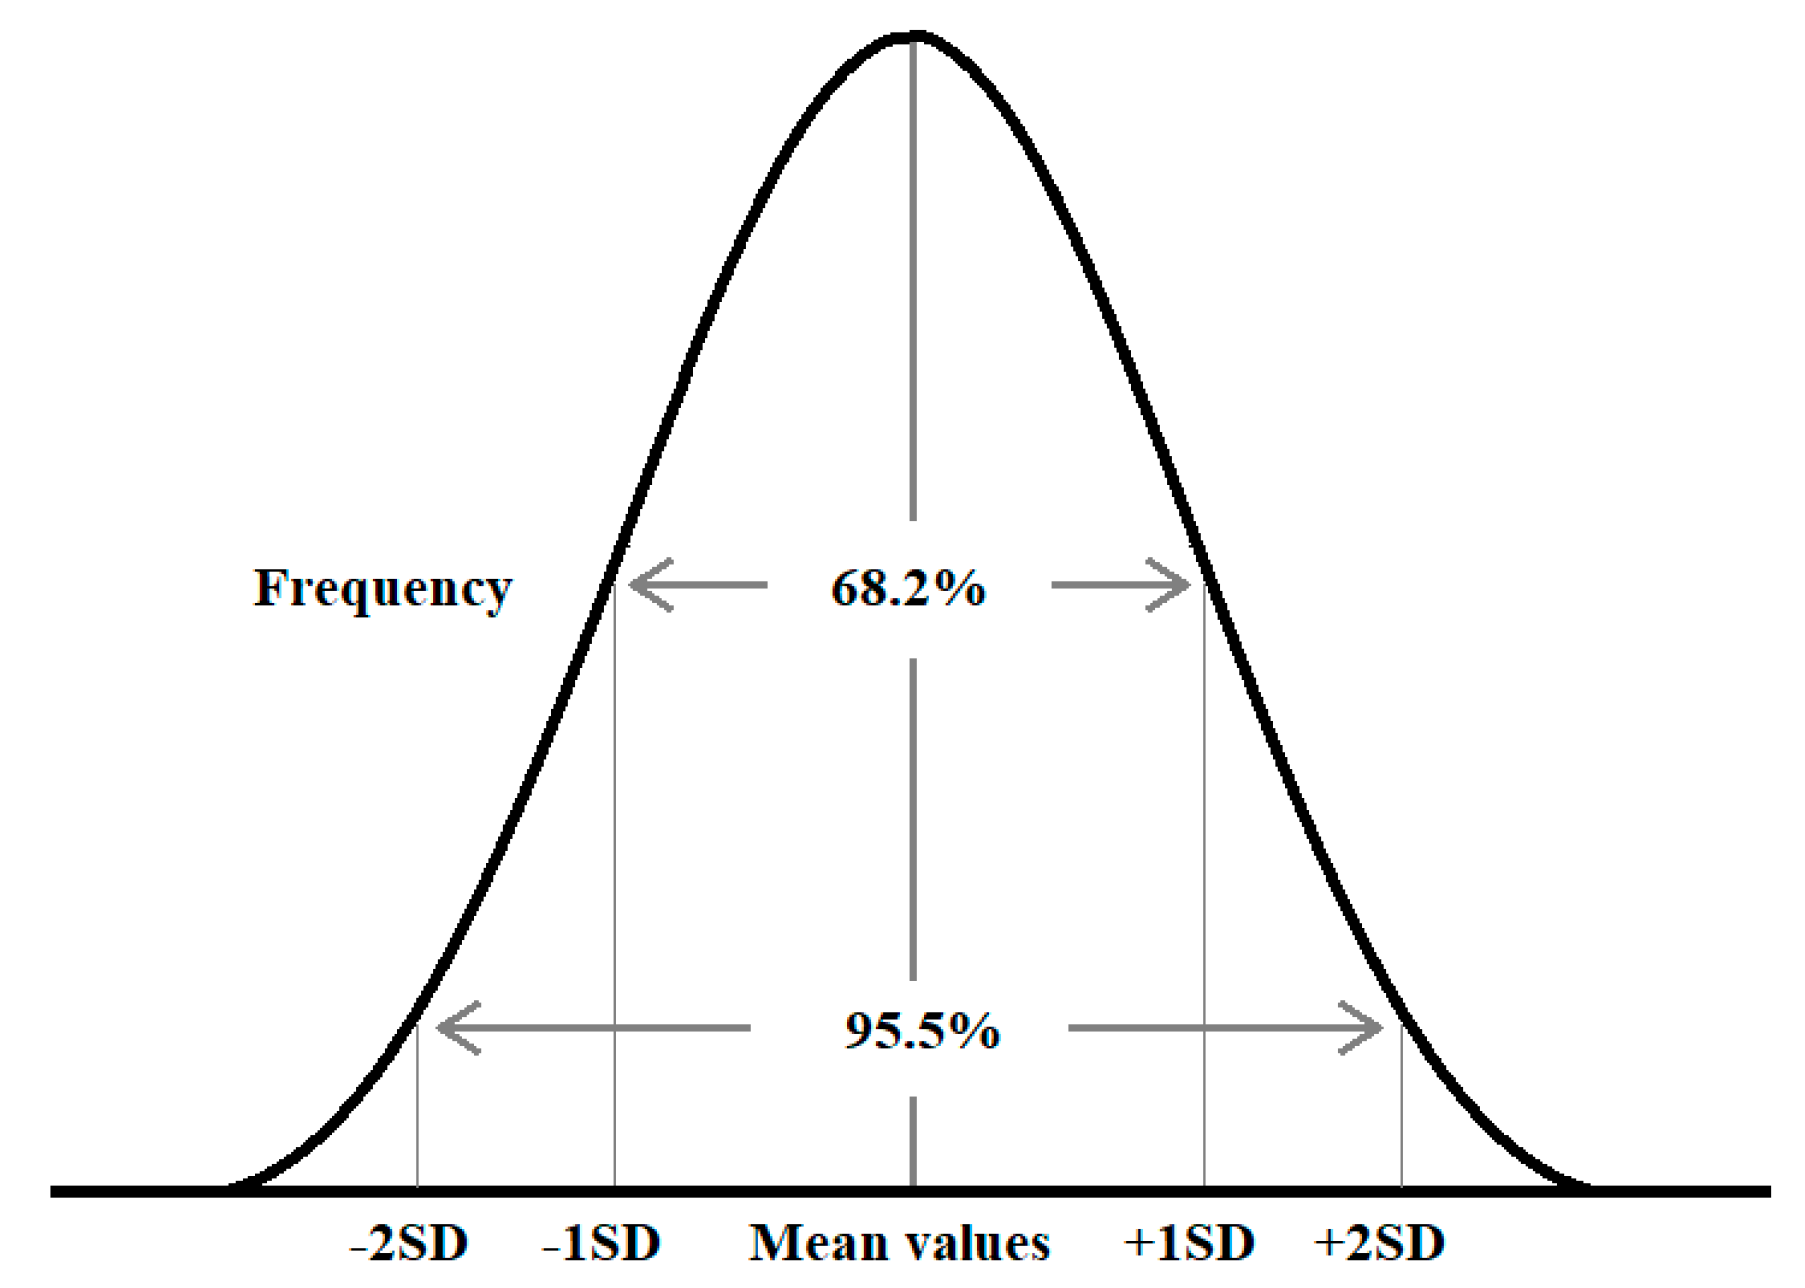
- —probability coefficient (it has been proposed that in case of a probability of 63–68%, the coefficient should equal 1; in the case of a probability of 95%, the probability coefficient should be 2, and in case of a probability of 99.7%, the probability coefficient equals 3).
- —difference between maximum and minimum ports’ DIP scoring values.
- —coefficient, which depends on the number of measurements (the number of possessed data): in case the number of data is 3, this coefficient will be 0.55; in case the data number is 4, this coefficient will be 0.47, and similarly depending on the data number 5—0.43; 6—0.395; 7—0.37; 8—0.351; 9—0.337; 10—0.329; 11—0.325; 12—0.322 and so on. The minimum value of this coefficient is about 0.315, in case the number of items of collected data is more than 15.
- number of serviced passengers (in case of passenger ports or ferry terminals):
- ○
- up to 50,000 passengers per year
- ○
- from 50,000 up to 100,000 passengers per year
- ○
- from 100,000 up to 1,000,000 passengers per year
- ○
- more than 1,000,000 passengers per year
- cargo type (in case of cargo ports or terminals):
- ○
- containers
- ○
- brake-bulk cargo, e.g., wood products
- ○
- bulk cargo, e.g., fertilizers, coal, ore, etc.
- ○
- liquid cargo, e.g., crude oil, oil products, LNG, etc.
- ○
- mixed cargo
- cargo turnover of ports or terminals:
- ○
- small ports (with annual turnover up to 1 million tons)
- ○
- medium-sized ports (with turnover from 1 million tons up to 10 million tons per year)
- ○
- large ports (with annual turnover of more than 10 million tons)
- analogue (DIP score from 1 up to 2.4)
- monitor (DIP score from 2.5 up to 3.4)
- adopter (DIP score from 3.5 up to 4.4)
- developer (DIP score from 4.5 up to 5.4)
- smart (DIP score from 5.5 up to 6.0) ports
4. Results
4.1. Case Study Description
4.2. Results Analysis
5. Discussion and Conclusions
Author Contributions
Funding
Institutional Review Board Statement
Informed Consent Statement
Data Availability Statement
Acknowledgments
Conflicts of Interest
References
- Heilig, L.; Lalla-Ruiz, E.; Voß, S. Digital transformation in maritime ports: Analysis and a game theoretic framework. NETNOMICS Econ. Res. Electron. Netw. 2017, 18, 227–254. [Google Scholar] [CrossRef]
- Yau, K.-L.A.; Peng, S.; Qadir, J.; Low, Y.-C.; Ling, M.H. Towards smart port infrastructures: Enhancing port activities using information and communications technology. IEEE Access 2020, 8, 83387–83404. [Google Scholar] [CrossRef]
- Back, A.; Berghaus, S.; Kaltenrieder, B. Digital Maturity & Transformation Studie; Institut für Wirtschaftsinformatik, Universität St. Gallen: Gallen, Switzerland, 2015; pp. 1–75. [Google Scholar]
- Gerlitz, L. Design-driven innovation in SMEs: Smart and sustainable organization within industrial transformation. Int. J. Environ. Policy Decis. Making 2017, 2, 98–124. [Google Scholar] [CrossRef]
- Fruth, M.; Teuteberg, F. Digitization in maritime logistics—What is there and what is missing? Cogent Bus. Manag. 2017, 4, 1411066. [Google Scholar] [CrossRef]
- Paulauskas, V.; Barzdziukas, R.; Derkintyte-Kaupiene, R.; Jonkus, M.; Kaulitzky, A.; Maksimavicius, R.; Paulauskas, D.; Placiene, B. Shipping engineering; Klaipeda University Publishing House: Klaipeda, Lithuania, 2019; 544p. (In Lithuanian) [Google Scholar]
- Jović, M.; Tijan, E.; Aksentijević, S.; Sotošek, B. The role of electronic transportation management systems in seaport digitalization. In Proceedings of the 32nd Bled eConference Humanizing Technology for a Sustainable Society, BLED 2019, Bled, Slovenia, 16–19 June 2019; pp. 1–15. [Google Scholar] [CrossRef] [Green Version]
- Mańkowska, M.; Kotowska, I.; Pluciński, M. Seaports as nodal points of circular supply chains: Opportunities and challenges for secondary ports. Sustainability 2020, 12, 3926. [Google Scholar] [CrossRef]
- Woo, S.H.; Pettit, S.J.; Beresford, A.K. An assessment of the integration of seaports into supply chains using a structural equation model. Supply Chain Manag. 2013, 18, 235–252. [Google Scholar] [CrossRef]
- Di Vaio, A.; Varriale, L. Digitalization in the sea-land supply chain: Experiences from Italy in rethinking the port operations within inter-organizational relationships. Prod. Plan. Control 2020, 31, 220–232. [Google Scholar] [CrossRef]
- Lepekhin, A.A.; Levina, A.I.; Dubgorn, A.S.; Weigell, J.; Kalyazina, S.E. Digitalization of Seaports based on Enterprise Architecture approach. IOP Conf. Ser. Mater. Sci. Eng. 2020, 940, 012023. [Google Scholar] [CrossRef]
- Brooks, M.R.; Schellinck, T. Measuring port effectiveness: What really determines cargo interests’ evaluations of port service delivery? Marit. Policy Manag. 2015, 42, 699–711. [Google Scholar] [CrossRef]
- Marlow, P.B.; Casaca, A.C.P. Measuring lean ports performance. Int. J. Transp. Manag. 2003, 1, 189–202. [Google Scholar] [CrossRef]
- Talley, W.K. Port performance: An economics perspective. Res. Transp. Econ. 2006, 17, 499–516. [Google Scholar] [CrossRef]
- Tsamboulas, D.; Moraiti, P.; Lekka, A.M. Performance evaluation for implementation of Port Community System. Transp. Res. Rec. 2012, 2273, 29–37. [Google Scholar] [CrossRef]
- Wiktorowska-Jasik, A.; Filina-Dawidowicz, L.; Cernova-Bickova, A.; Możdrzeń, D.; Bickovs, D. Integrated electronic systems for acquisition of customers for transport and logistics services. Smart Innov. Syst. Technol. 2021, 200, 521–530. [Google Scholar] [CrossRef]
- Paulauskas, V.; Filina-Dawidowicz, L.; Paulauskas, D.; Pridotkas, G. Small and Medium Sized Ports Digitalization Level Evaluation and Benchmarking. In Proceedings of the 24th International Scientific Conference, Transport Means 2020, Kaunas, Lithuania, 30 September–2 October 2020; pp. 502–506. [Google Scholar]
- George, S.A.; Tumma, A.C. A benchmarking study of Indian seaports. J. Glob. Oper. Strateg. Sourc. 2019, 13, 88–102. [Google Scholar] [CrossRef]
- El Imran, O.; Babounia, A. Benchmark and competitive analysis of port performances model: Algeciras Bay, Rotterdam, New York-New Jersey and Tangier Med. Eur. J. Log. Purch. Supply Chain Manag. 2018, 6, 28–48. [Google Scholar]
- Petrlić, A.; Pavletić, N. Benchmarking analysis of factors influencing container traffic in the Port of Rijeka. Pomorstvo 2019, 33, 119–129. [Google Scholar] [CrossRef]
- Feng, L.; Notteboom, T. Small and medium sized ports (SMPs) in multi-port gateway regions: The role of Yingkou port in the logistics system of the Bohai sea. In Proceedings of the ECONSHIP 2011 Conference, University of the Aegean, Chios, Greece, 22–24 June 2011. [Google Scholar]
- Official Project Website. Available online: https://connect2smallports.eu/ (accessed on 10 August 2021).
- Philipp, R. Digital readiness index assessment towards smart port development. Sustain. Manag. Forum 2020, 28, 49–60. [Google Scholar] [CrossRef]
- Philipp, R.; Gerlitz, L.; Moldabekova, A. Small and medium-sized seaports on the digital track: Tracing digitalisation across the South Baltic Region by innovative auditing procedures. Lect. Notes Netw. Syst. 2020, 117, 351–362. [Google Scholar] [CrossRef]
- Inkinen, T.; Helminen, R.; Saarikoski, J. Port digitalization with open data: Challenges, opportunities, and integrations. J. Open Innov. Technol. Mark. Complex. 2019, 5, 30. [Google Scholar] [CrossRef] [Green Version]
- Kostrzewski, M.; Chamier-Gliszczynski, N.; Królikowski, T. Selected reflections on formal modeling in Industry 4.0. Procedia Comput. Sci. 2020, 176, 3293–3300. [Google Scholar] [CrossRef]
- Lu, Y. Industry 4.0: A survey on technologies, applications and open research issues. J. Ind. Inf. Integr. 2017, 6, 1–10. [Google Scholar] [CrossRef]
- Bastug, S.; Arabelen, G.; Vural, C.A.; Deveci, D.A. A value chain analysis of a seaport from the perspective of Industry 4.0. Int. J. Shipp. Transp. Log. 2020, 12, 367–397. [Google Scholar] [CrossRef]
- Sanchez-Gonzalez, P.L.; Díaz-Gutiérrez, D.; Leo, T.J.; Núñez-Rivas, L.R. Toward digitalization of maritime transport? Sensors 2019, 19, 926. [Google Scholar] [CrossRef] [PubMed] [Green Version]
- Torlak, I.; Tijan, E.; Aksentijevic, S.; Jugović, A. Port Community System feasibility analysis-case study Split. In Proceedings of the 2020 43rd International Convention on Information, Communication and Electronic Technology, MIPRO 2020, Opatija, Croatia, 28 September–2 October 2020; pp. 1410–1415. [Google Scholar] [CrossRef]
- Notteboom, T.; van der Lugt, L.; van Saase, N.; Sel, S.; Neyens, K. The role of seaports in green supply chain management: Initiatives, attitudes, and perspectives in Rotterdam, Antwerp, North Sea Port, and Zeebrugge. Sustainability 2020, 12, 1688. [Google Scholar] [CrossRef] [Green Version]
- Buijs, P.; Wortmann, J.C. Joint operational decision-making in collaborative transportation networks: The role of IT. Supply Chain Manag. 2014, 19, 200–210. [Google Scholar] [CrossRef]
- Geissbauer, R.; Vedso, J.; Schrauf, S. Industry 4.0: Building the Digital Enterprise. Retrieved from PwC Website. 2016. Available online: https://www.pwc.com/gx/en/industries/industries-4.0/landing-page/industry-4.0-building-your-digital-enterprise-april-2016.pdf (accessed on 14 January 2020).
- Bogner, E.; Voelklein, T.; Schroedel, O.; Franke, J. Study based analysis on the current digitalization degree in the manufacturing industry in Germany. Procedia CIRP 2016, 57, 14–19. [Google Scholar] [CrossRef]
- Lambourdiere, E.; Corbin, E. Blockchain and maritime supply-chain performance: Dynamic capabilities perspective. Worldw. Hosp. Tour. Themes 2020, 12, 24–34. [Google Scholar] [CrossRef]
- Sadiq, M.; Ali, S.W.; Terriche, Y.; Mutarraf, M.U.; Hassan, M.A.; Hamid, K.; Ali, Z.; Sze, J.Y.; Su, C.-L.; Guerrero, J.M. Future Greener Seaports: A Review of New Infrastructure, Challenges, and Energy Efficiency Measures. IEEE Access 2021, 9, 9433559. [Google Scholar] [CrossRef]
- Agatić, A.; Kolanović, I. Improving the seaport service quality by implementing digital technologies. Pomorstvo 2020, 34, 93–101. [Google Scholar] [CrossRef]
- Del Giudice, M.; Di Vaio, A.; Hassan, R.; Palladino, R. Digitalization and new technologies for sustainable business models at the ship–port interface: A bibliometric analysis. Marit. Policy Manag. 2021. [Google Scholar] [CrossRef]
- Inkinen, T.; Helminen, R.; Saarikoski, J. Technological trajectories and scenarios in seaport digitalization. Res. Transp. Bus. Manag. 2021, 100633. [Google Scholar] [CrossRef]
- Maydanova, S.; Ilin, I.; Lepekhin, A. Capabilities evaluation in an enterprise architecture context for digital transformation of seaports network. In Proceedings of the 33rd International Business Information Management Association Conference, IBIMA 2019, Granada, Spain, 10–11 April 2019; pp. 5103–5111. [Google Scholar]
- Beck, R.; Avital, M.; Rossi, M.; Thatcher, J.B. Blockchain Technology in Business and Information Systems Research. Bus. Inf. Syst. Eng. 2017, 59, 381–384. [Google Scholar] [CrossRef] [Green Version]
- Hafizon, M.I.; Wicaksono, A.; Farizan, F.N. E-Toll LaUT: Blockchain port as the key for realizing Indonesia’s maritime fulcrum. ACM Int. Conf. Proc. Ser. 2019, F148155, 36–45. [Google Scholar] [CrossRef]
- Muñuzuri, J.; Onieva, L.; Cortés, P.; Guadix, J. Using IoT data and applications to improve port-based intermodal supply chains. Comput. Ind. Eng. 2020, 139, 105668. [Google Scholar] [CrossRef]
- Henesey, L.; Lizneva, Y.; Philipp, R.; Meyer, C.; Gerlitz, L. Improved load planning of RoRo vessels by adopting blockchain and internet-of-things. In Proceedings of the 22nd International Conference on Harbor, Maritime and Multimodal Logistics Modelling and Simulation, HMS 2020, On-Line Virtual Conference, 16–18 September 2020; pp. 58–65. [Google Scholar] [CrossRef]
- Bisogno, M.; Nota, G.; Saccomanno, A.; Tommasetti, A. Improving the efficiency of Port Community Systems through integrated information flows of logistic processes. Int. J. Dig. Acc. Res. 2015, 15, 1–31. [Google Scholar] [CrossRef] [Green Version]
- Tijan, E.; Agatić, A.; Jović, M.; Aksentijević, S. Maritime National Single Window—A prerequisite for sustainable seaport business. Sustainability 2019, 11, 4570. [Google Scholar] [CrossRef] [Green Version]
- Fedi, L.; Lavissiere, A.; Russell, D.; Swanson, D. The facilitating role of IT systems for legal compliance: The case of port community systems and container Verified Gross Mass (VGM). Supply Chain Forum 2019, 20, 29–42. [Google Scholar] [CrossRef]
- Zaychenko, I.; Smirnova, A.; Gorshechnikova, P.; Piminov, N. Sustainable digital transformation of the port equipment management system. E3S Web Conf. 2021, 25820, 020142021. [Google Scholar] [CrossRef]
- Notteboom, T.; Pallis, A.; Rodrigue, J.-P. Port Economics, Management and Policy; Routledge: New York, NY, USA, 2021; Available online: https://porteconomicsmanagement.org (accessed on 10 August 2021).
- Basl, J.; Doucek, P. A metamodel for evaluating enterprise readiness in the context of Industry 4.0. Information 2019, 10, 89. [Google Scholar] [CrossRef] [Green Version]
- De Langen, P.; Nidjam, M.; van der Horst, M. New indicators to measure port performance. J. Marit. Res. 2007, 4, 23–36. [Google Scholar]
- Tongzon, J.L. Determinants of port performance and efficiency. Transp. Res. Part A Policy Pract. 1995, 29, 245–252. [Google Scholar] [CrossRef]
- Meyer, C.; Gerlitz, L.; Henesey, L. Cross-Border Capacity-Building for Port Ecosystems in Small and Medium-Sized Baltic Ports. TalTech J. Eur. Stud. 2021, 11, 113–132. [Google Scholar] [CrossRef]
- Feng, L.; Notteboom, T. Peripheral challenge by small and medium sized ports (SMPs) in multi-port gateway regions: The case study of northeast of China. Pol. Marit. Res. 2013, 20, 55–66. [Google Scholar] [CrossRef]
- Rozmarynowska, M.; Oldakowski, B. Development perspectives for small and medium Baltic Sea ports. In Proceedings of the TransBaltic and Baltic Ports Organization’s Seminar, Elbląg, Poland, 7–8 June 2013; Available online: https://www.yumpu.com/en/document/read/27192550/development-perspectives-for-small-and-medium-baltic-transbaltic (accessed on 7 August 2021).
- Jacobsson, S.; Arnäs, P.O.; Stefansson, G. Automatic information exchange between interoperable information systems: Potential improvement of access management in a seaport terminal. Res. Transp. Bus. Manag. 2020, 35, 100429. [Google Scholar] [CrossRef]
- Paulauskas, V.; Filina-Dawidowicz, L.; Paulauskas, D. Ro-Ro and Ro-Pax vessels ETA and ATA analysis. In Proceedings of the 23rd International Scientific Conference on Transport Means 2019, Hotel Gabija, Palanga, Lithuania, 2–4 October 2019; pp. 852–855. [Google Scholar]
- Elbert, R.; Pontow, H.; Benlian, A. The role of inter-organizational information systems in maritime transport chains. Electron. Mark. 2017, 27, 157–173. [Google Scholar] [CrossRef]
- Vairetti, C.; González-Ramírez, R.G.; Maldonado, S.; Álvarez, C.; Voβ, S. Facilitating conditions for successful adoption of inter-organizational information systems in seaports. Transp. Res. Part A Policy Pract. 2019, 130, 333–350. [Google Scholar] [CrossRef]
- Heilig, L.; Voß, S. Information systems in seaports: A categorization and overview. Inf. Technol. Manag. 2017, 18, 179–201. [Google Scholar] [CrossRef]
- Koroleva, E.; Sokolov, S.; Makashina, I.; Filatova, E. Information technologies as a way of port activity optimization in conditions of digital economy. E3S Web Conf. 2019, 138, 02002. [Google Scholar] [CrossRef]
- Tsiulin, S.; Reinau, K.H.; Goryaev, N. Conceptual Comparison of Port Commmunity System and Blockchain Scenario for Maritime Document Handling. In Proceedings of the 2020 Global Smart Industry Conference, GloSIC 2020, Chelyabinsk, Russia, 7–19 November 2020; Volume 9267847, pp. 66–71. [Google Scholar] [CrossRef]
- Garibin, P.; Ol’Khovik, E. Application of BIM technology in operation of port marine structures. E3S Web Conf. 2019, 135, 01022. [Google Scholar] [CrossRef]
- Gonzalez, O.A.; Koivisto, H.; Mustonen, J.M.; Keinanen-toivola, M.M. Digitalization in just-in-time approach as a sustainable solution for maritime logistics in the baltic sea region. Sustainability 2021, 13, 1173. [Google Scholar] [CrossRef]
- Zerbino, P.; Aloini, D.; Dulmin, R.; Mininno, V. Towards analytics-enabled efficiency improvements in maritime transportation: A case study in a mediterranean port. Sustainability 2019, 11, 4473. [Google Scholar] [CrossRef] [Green Version]
- Brooks, M.R. Issues in measuring port devolution program performance: A managerial perspective. Res. Transp. Econ. 2006, 17, 599–629. [Google Scholar] [CrossRef]
- Plomaritou, E.; Konsta, K. Key Performance Indicators (KPIs), Shipping Marketing and Safety Orientation: The Case of Greek Tanker Shipping Companies. SPOUDAI-J. Econ. Bus. 2013, 63, 83–101. [Google Scholar]
- Sarabia-Jacome, D.; Palau, C.E.; Esteve, M.; Boronat, F. Seaport data space for improving logistic maritime operations. IEEE Access 2020, 8, 4372–4382. [Google Scholar] [CrossRef]
- Cullinane, K.; Song, D.W.; Wang, T. The application of mathematical programming approaches to estimating container port production efficiency. J. Prod. Anal. 2005, 24, 73–92. [Google Scholar] [CrossRef]
- Bagirov, E.; Pantina, T.; Borodulina, S. Seaport development management based on business process modelling. E3S Web Conf. 2021, 25820, 020022021. [Google Scholar] [CrossRef]
- Jovic, M.; Kavran, N.; Aksentijevic, S.; Tijan, E. The transition of Croatian seaports into smart ports. In Proceedings of the 42nd International Convention on Information and Communication Technology, Electronics and Microelectronics, MIPRO 2019, Opatija, Croatia, 20–24 May 2019; pp. 1386–1390. [Google Scholar] [CrossRef]
- Joshi, A.; Kale, S.; Chandel, S.K.; Pal, D.K. Likert scale: Explored and explained. Br. J. Appl. Sci. Technol. 2015, 7, 396–403. [Google Scholar] [CrossRef]
- Dasgupta, A.; Wahed, A. Laboratory Statistics and Quality Control. A Comprehensive Review for Board Preparation, Certification and Clinical Practice; Elsevier: San Diego, CA, USA, 2014; p. 25. ISBN 978-0-12-407821-5. [Google Scholar]
- Paulauskas, V. Ships Entering the Ports; N.I.M.S Publish House: Riga, Latvia, 2013; 240p, ISBN 9984-679-71-3. [Google Scholar]
- Chauhan, S.; Patil, C.; Sinha, M.; Halder, A. Fuzzy state noise-driven Kalman filter for sensor fusion. Proc. Inst. Mech. Eng. Part G J. Aerosp. Eng. 2009, 223, 1091–1097. [Google Scholar] [CrossRef]
- Chen, J.; Sitter, R.R.; Wu, C. Using empirical likelihood methods to obtain range restricted weights in regression estimators for surveys. Biometrika 2002, 89, 230–237. [Google Scholar] [CrossRef]
- Plikusas, A.; Pumputis, D. Estimation of the finite population covariance using calibration. Nonlinear Anal. Model. Control 2010, 15, 325–340. [Google Scholar] [CrossRef]


| Strengths | Weaknesses |
|---|---|
|
|
| Opportunities | Threats |
|
|
| Small Ports (S) | Medium-Sized Ports (M) | Large Ports (L) |
|---|---|---|
| S1—Hel (Poland), Baltic Sea S2—Landskrona (Sweden), Baltic Sea S3—Vordingborg (Denmark), Baltic Sea S4—Assens (Denmark), Baltic Sea S5—Elblag (Poland), Baltic Sea S6—Kolobrzeg (Poland), Baltic Sea S7—Vejle (Denmark), Baltic Sea S8—Hvide-Sande (Denmark), North Sea S9—Horsens (Denmark), Baltic Sea S10—Sölvesborg (Sweden), Baltic Sea | M1—Kalundborg (Denmark), Baltic Sea M2—Karlshamn (Sweden), Baltic Sea M3—Karlskrona (Sweden), Baltic Sea M4—Koge (Denmark), Baltic Sea M5—Naantali (Finland), Baltic Sea M6—Wismar (Germany), Baltic Sea M7—Lulea (Sweden), Baltic Sea M8—Esbjerg (Denmark), North Sea M9—Stralsund (Germany), Baltic Sea M10—Lindo (Denmark), Baltic Sea M11—Ronne (Denmark), Baltic Sea M12—Rauma (Finland), Baltic Sea M13—Södertälje (Sweden), Baltic Sea | L1—Rostock (Germany), Baltic Sea L2—Ystad (Sweden), Baltic Sea L3—Lubeck (Germany), Baltic Sea L4—Trelleborg (Sweden), Baltic Sea L5—Copenhagen (Denmark)—Malmo (Sweden), Baltic Sea L6—Valencia (Spain), Mediterranean Sea L7—Klaipeda (Lithuania), Baltic Sea |
| Factor | Sub-Factor | Abbreviation | Assessment Given by Port Representative (Round 1) | Applied Scale Range |
|---|---|---|---|---|
| Port development programs | Digitalization strategy | v13-1 | 3 | 1—there is no activity in port, 6—the activity is implemented |
| Port digitalization development program | v13-2 | 2 | ||
| Digitalization pilot initiatives | v13-3 | 2 | ||
| Funds for the port development | v13-4 | 3 | ||
| Technology | Smart Enterprise Resource Planning System | v16-1 | 3 | 1—technology is not known, 6—comprehensive usage of the technology |
| Smart Warehouse Management System | v16-2 | 4 | ||
| Smart Port Community System | v16-3 | 4 | ||
| Web-based Communication Platforms | v16-4 | 4 | ||
| Mobile Data Access for Employees | v16-5 | 4 | ||
| Mobile Data Access for Customers | v16-6 | 4 | ||
| Internet-of-Things | v16-7 | 5 | ||
| Cloud Computing | v16-8 | 5 | ||
| Localization Technologies | v16-9 | 5 | ||
| Sensors | v16-10 | 5 | ||
| Big Data and Predictive Analytics | v16-11 | 5 | ||
| Blockchain | v16-12 | 4 | ||
| Artificial Intelligence | v16-13 | 2 | ||
| Robotics | v16-14 | 2 | ||
| Drones | v16-15 | 2 | ||
| Autonomous Solutions | v16-16 | 2 | ||
| Digital Twinning, Augmented and Virtual Reality | v16-17 | 2 | ||
| Port promotion materials | Personal Network | v17-1 | 4 | 1—very bad, 6—very good |
| Printed Media | v17-2 | 4 | ||
| Internet | v17-3 | 5 | ||
| Social Media | v17-4 | 5 | ||
| Fairs | v17-5 | 4 | ||
| Conferences | v17-6 | 4 | ||
| Associations and Consultancies | v17-7 | 4 | ||
| Scientific Institutions | v17-8 | 3 | ||
| Port organization | Port management system | v18-1 | 1 | 1—very bad, 6—very good |
| IT infrastructure | v18-2 | 4 | ||
| Automation technology | v18-3 | 3 | ||
| Data analytics | v18-4 | 3 | ||
| Data security/communications security | v18-5 | 4 | ||
| Development/application of assistance systems | v18-6 | 3 | ||
| Collaboration software | v18-7 | 3 | ||
| Non-technical skills such | v18-8 | 4 | ||
| Port diversification programs | v18-9 | 4 | ||
| Human factor | Port management approach to digitalization | v22-2 | 4 | 1—very bad, 6—very good |
| Port management education level | v22-3 | 4 | ||
| Personal network system | v22-4 | 4 | ||
| Ability of port IT staff and readiness to implement digitalization tasks | v22-5 | 4 | ||
| Port staff periodical training system | v22-6 | 4 | ||
| Funds for port staff education and training | v22-7 | 4 |
| Port | Hel | Lands-Krona | Vording-Borg | Assens | Elblag | Kolobrzeg | Vejle | Hvide-Sande | Horsens | Solves-Borg |
|---|---|---|---|---|---|---|---|---|---|---|
| S1 | S2 | S3 | S4 | S5 | S6 | S7 | S8 | S9 | S10 | |
| DIP | 2.54 | 2.55 | 3.08 | 3.37 | 3.43 | 3.47 | 3.9 | 3.91 | 3.99 | 4.03 |
| Filtrated DIP | 2.65 | 2.66 | 3.05 | 3.35 | 3.42 | 3.46 | 3.88 | 3.89 | 3.92 | 3.98 |
| Port | Kalun-Borg | Karls-Hamn | Karls-Krona | Koge | Naantali | Wismar | Lulea | Esbjerg | Stral-Sund | Lindo | Ronne | Rauma | Soder-Talje |
|---|---|---|---|---|---|---|---|---|---|---|---|---|---|
| M1 | M2 | M3 | M4 | M5 | M6 | M7 | M8 | M9 | M10 | M11 | M12 | M13 | |
| DIP | 2.85 | 2.92 | 3.18 | 3.23 | 3.4 | 3.49 | 3.51 | 3.6 | 3.62 | 3.69 | 3.73 | 3.92 | 4.32 |
| Filtrated DIP | 2.94 | 2.98 | 3.21 | 3.25 | 3.39 | 3.49 | 3.51 | 3.6 | 3.62 | 3.68 | 3.71 | 3.87 | 4.22 |
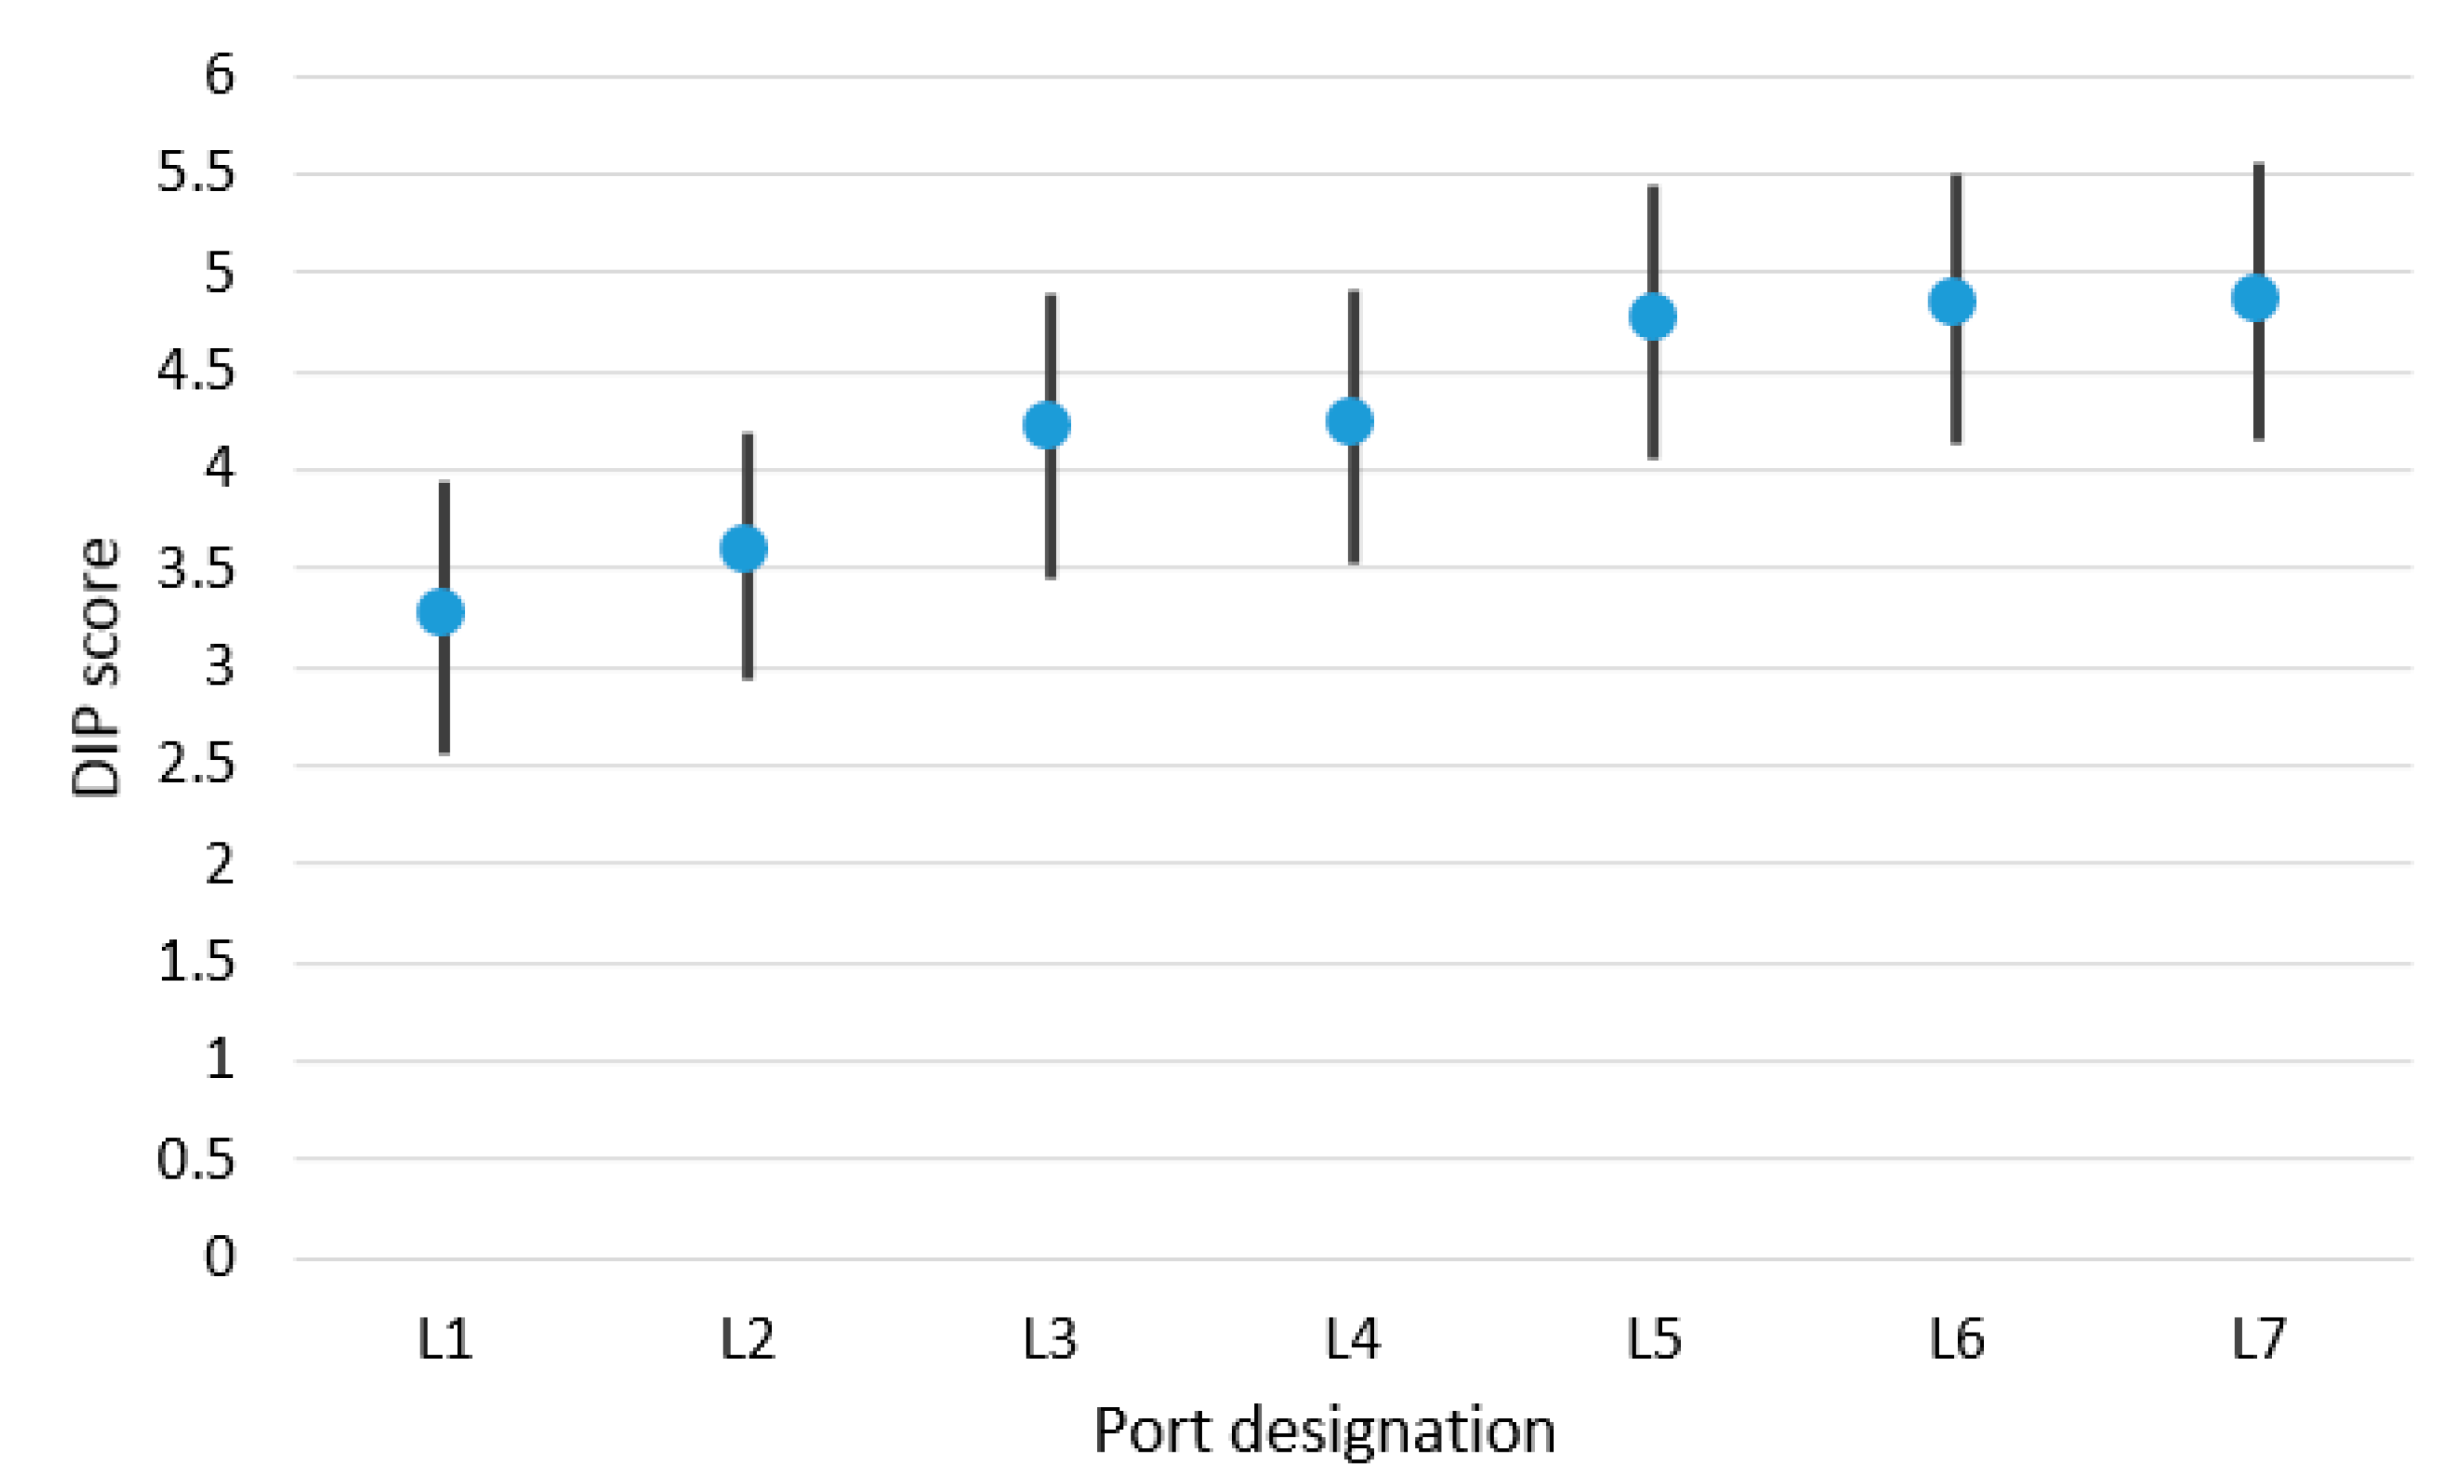
| Port | Rostock | Ystad | Lubeck | Trelleborg | Coppenhagen-Malmo | Valencia | Klaipeda |
|---|---|---|---|---|---|---|---|
| L1 | L2 | L3 | L4 | L5 | L6 | L7 | |
| DIP | 3.15 | 3.50 | 4.20 | 4.22 | 4.78 | 4.88 | 4.90 |
| Filtrated DIP | 3.25 | 3.58 | 4.20 | 4.22 | 4.75 | 4.84 | 4.85 |
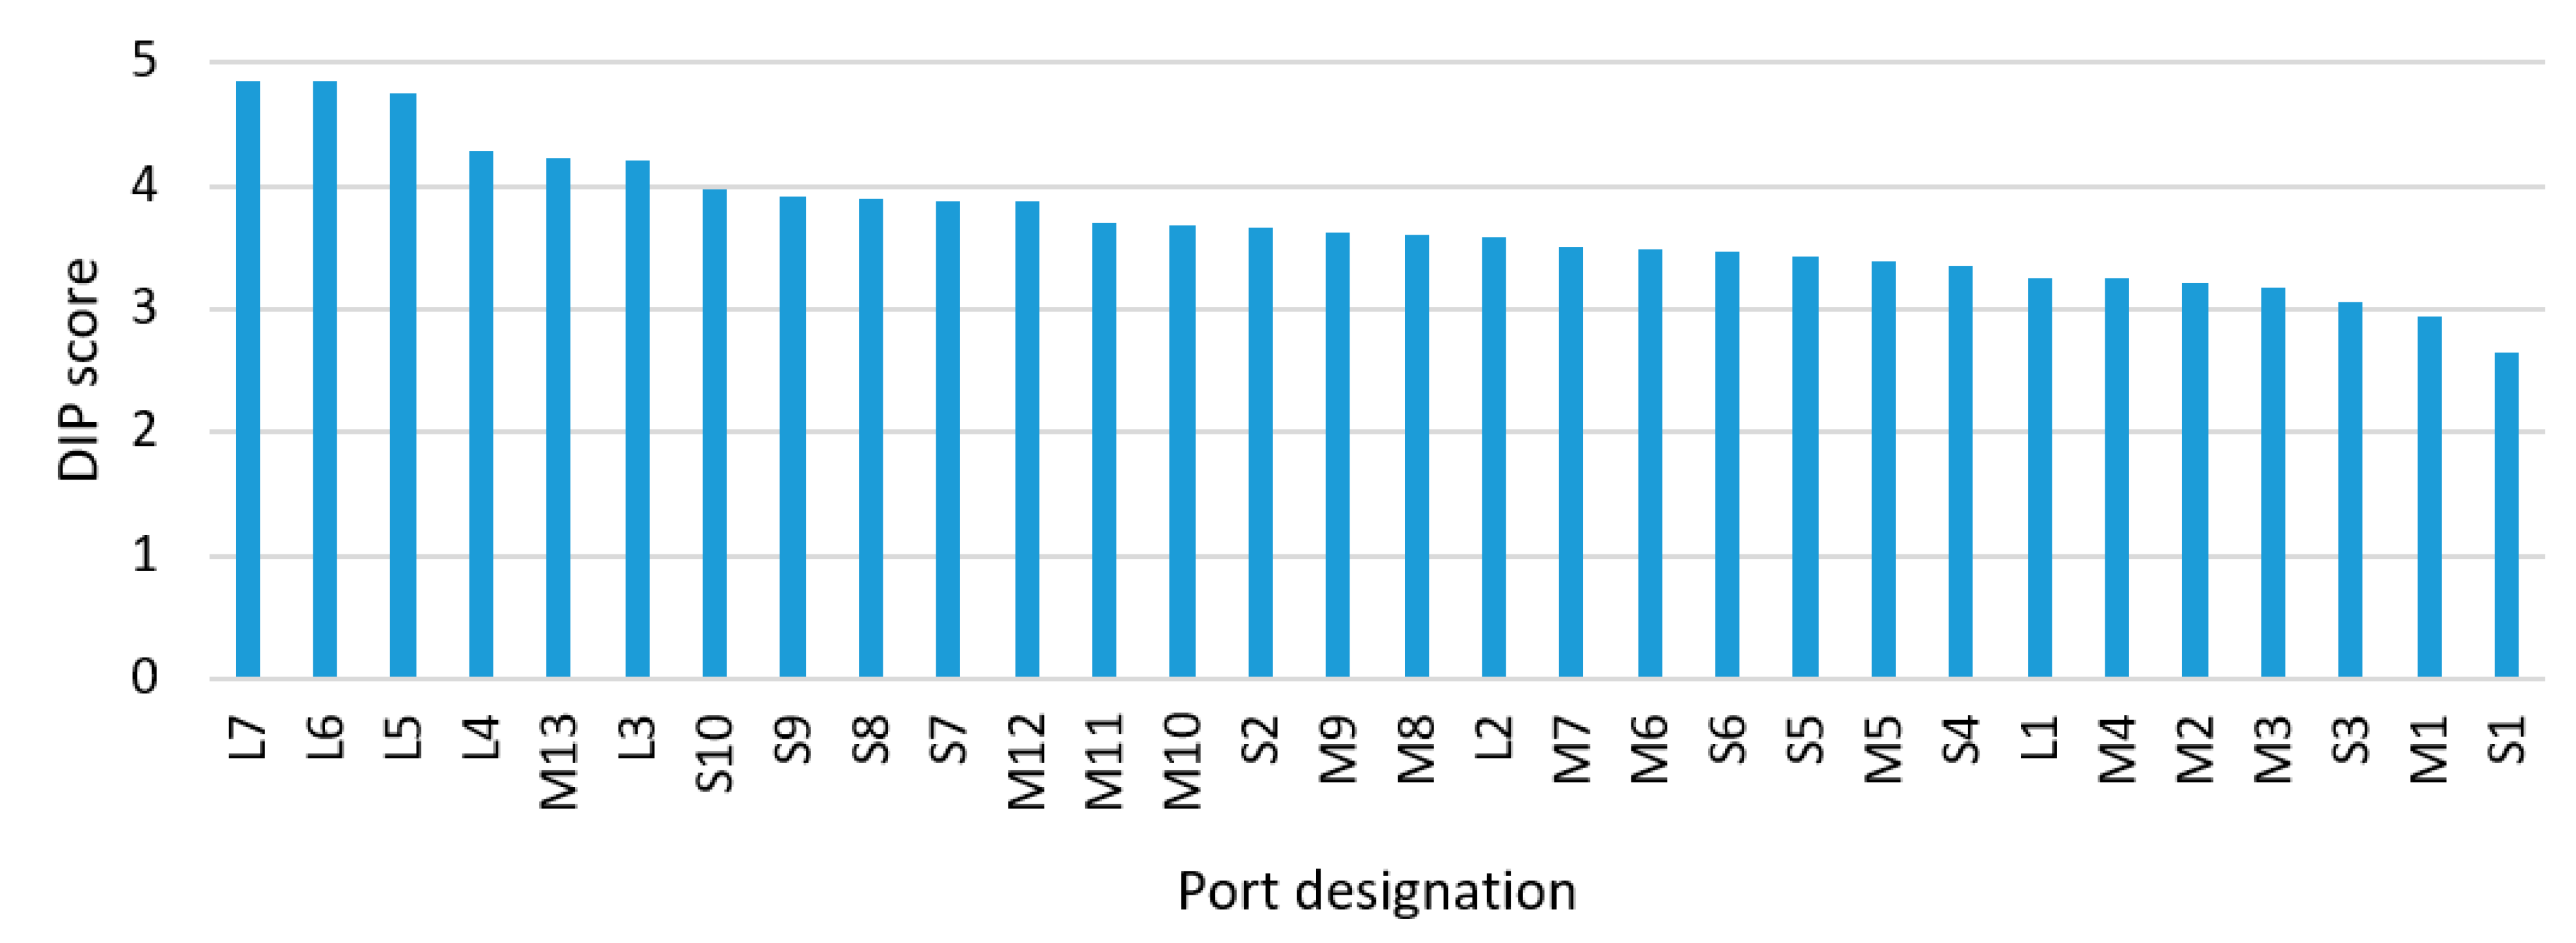
| Port Designation | Port | Turnover (mln tons) | DIP Score |
|---|---|---|---|
| L6 | Valencia (Spain), Mediteraininan Sea | 80 | 4.84 |
| L7 | Klaipeda (Lithuania), Baltic Sea | 48 | 4.85 |
| L1 | Rostock (Germany), Baltic Sea | 26 | 3.25 |
| L3 | Lubeck (Germany), Baltic Sea | 22 | 4.2 |
| L5 | Copenhagen (Denmark)–Malmo (Sweden), Baltic Sea | 15 | 4.75 |
| L2 | Ystad (Sweden), Baltic Sea | 12 | 3.58 |
| L4 | Trelleborg (Sweden), Baltic Sea | 11 | 4.28 |
| M5 | Naantali (Finland), Baltic Sea | 7.6 | 3.39 |
| M7 | Lulea (Sweden), Baltic Sea | 7.5 | 3.51 |
| M12 | Rauma (Finland), Baltic Sea | 6.1 | 3.87 |
| M6 | Wismar (Germany), Baltic Sea | 6.1 | 3.49 |
| M2 | Karlshamn (Sweden), Baltic Sea | 5.3 | 3.21 |
| M8 | Esbjerg (Denmark), North Sea | 4.1 | 3.6 |
| M9 | Stralsund (Germany), Baltic Sea | 2 | 3.62 |
| M1 | Kalundborg (Denmark), Baltic Sea | 2 | 2.94 |
| M4 | Koge (Denmark), Baltic Sea | 2 | 3.25 |
| M3 | Karlskrona (Sweden), Baltic Sea | 1.8 | 3.18 |
| M10 | Lindo (Denmark), Baltic Sea | 1.7 | 3.68 |
| M13 | Sodertalje (Sweden), Baltic Sea | 1.5 | 4.22 |
| M11 | Ronne (Denmark), Baltic Sea | 1 | 3.71 |
| S10 | Sölvesborg (Sweden), Baltic Sea | 0.9 | 3.98 |
| S7 | Vejle (Denmark), Baltic Sea | 0.78 | 3.88 |
| S9 | Horsens (Denmark), Baltic Sea | 0.75 | 3.92 |
| S3 | Vordingborg (Denmark), Baltic Sea | 0.7 | 3.05 |
| S2 | Landskrona (Sweden), Baltic Sea | 0.5 | 3.66 |
| S6 | Kolobrzeg (Poland), Baltic Sea | 0.3 | 3.46 |
| S8 | Hvide-Sande (Denmark), North Sea | 0.15 | 3.89 |
| S5 | Elblag (Poland), Baltic Sea | 0.15 | 3.42 |
| S1 | Hel (Poland), Baltic Sea | 0.05 | 2.65 |
| S4 | Assens (Denmark), Baltic Sea | 0.02 | 3.35 |
Publisher’s Note: MDPI stays neutral with regard to jurisdictional claims in published maps and institutional affiliations. |
© 2021 by the authors. Licensee MDPI, Basel, Switzerland. This article is an open access article distributed under the terms and conditions of the Creative Commons Attribution (CC BY) license (https://creativecommons.org/licenses/by/4.0/).
Share and Cite
Paulauskas, V.; Filina-Dawidowicz, L.; Paulauskas, D. Ports Digitalization Level Evaluation. Sensors 2021, 21, 6134. https://doi.org/10.3390/s21186134
Paulauskas V, Filina-Dawidowicz L, Paulauskas D. Ports Digitalization Level Evaluation. Sensors. 2021; 21(18):6134. https://doi.org/10.3390/s21186134
Chicago/Turabian StylePaulauskas, Vytautas, Ludmiła Filina-Dawidowicz, and Donatas Paulauskas. 2021. "Ports Digitalization Level Evaluation" Sensors 21, no. 18: 6134. https://doi.org/10.3390/s21186134