
Generation of Gait Events with a FSR Based Cane Handle

 ,
,  and
and
Abstract
:1. Introduction
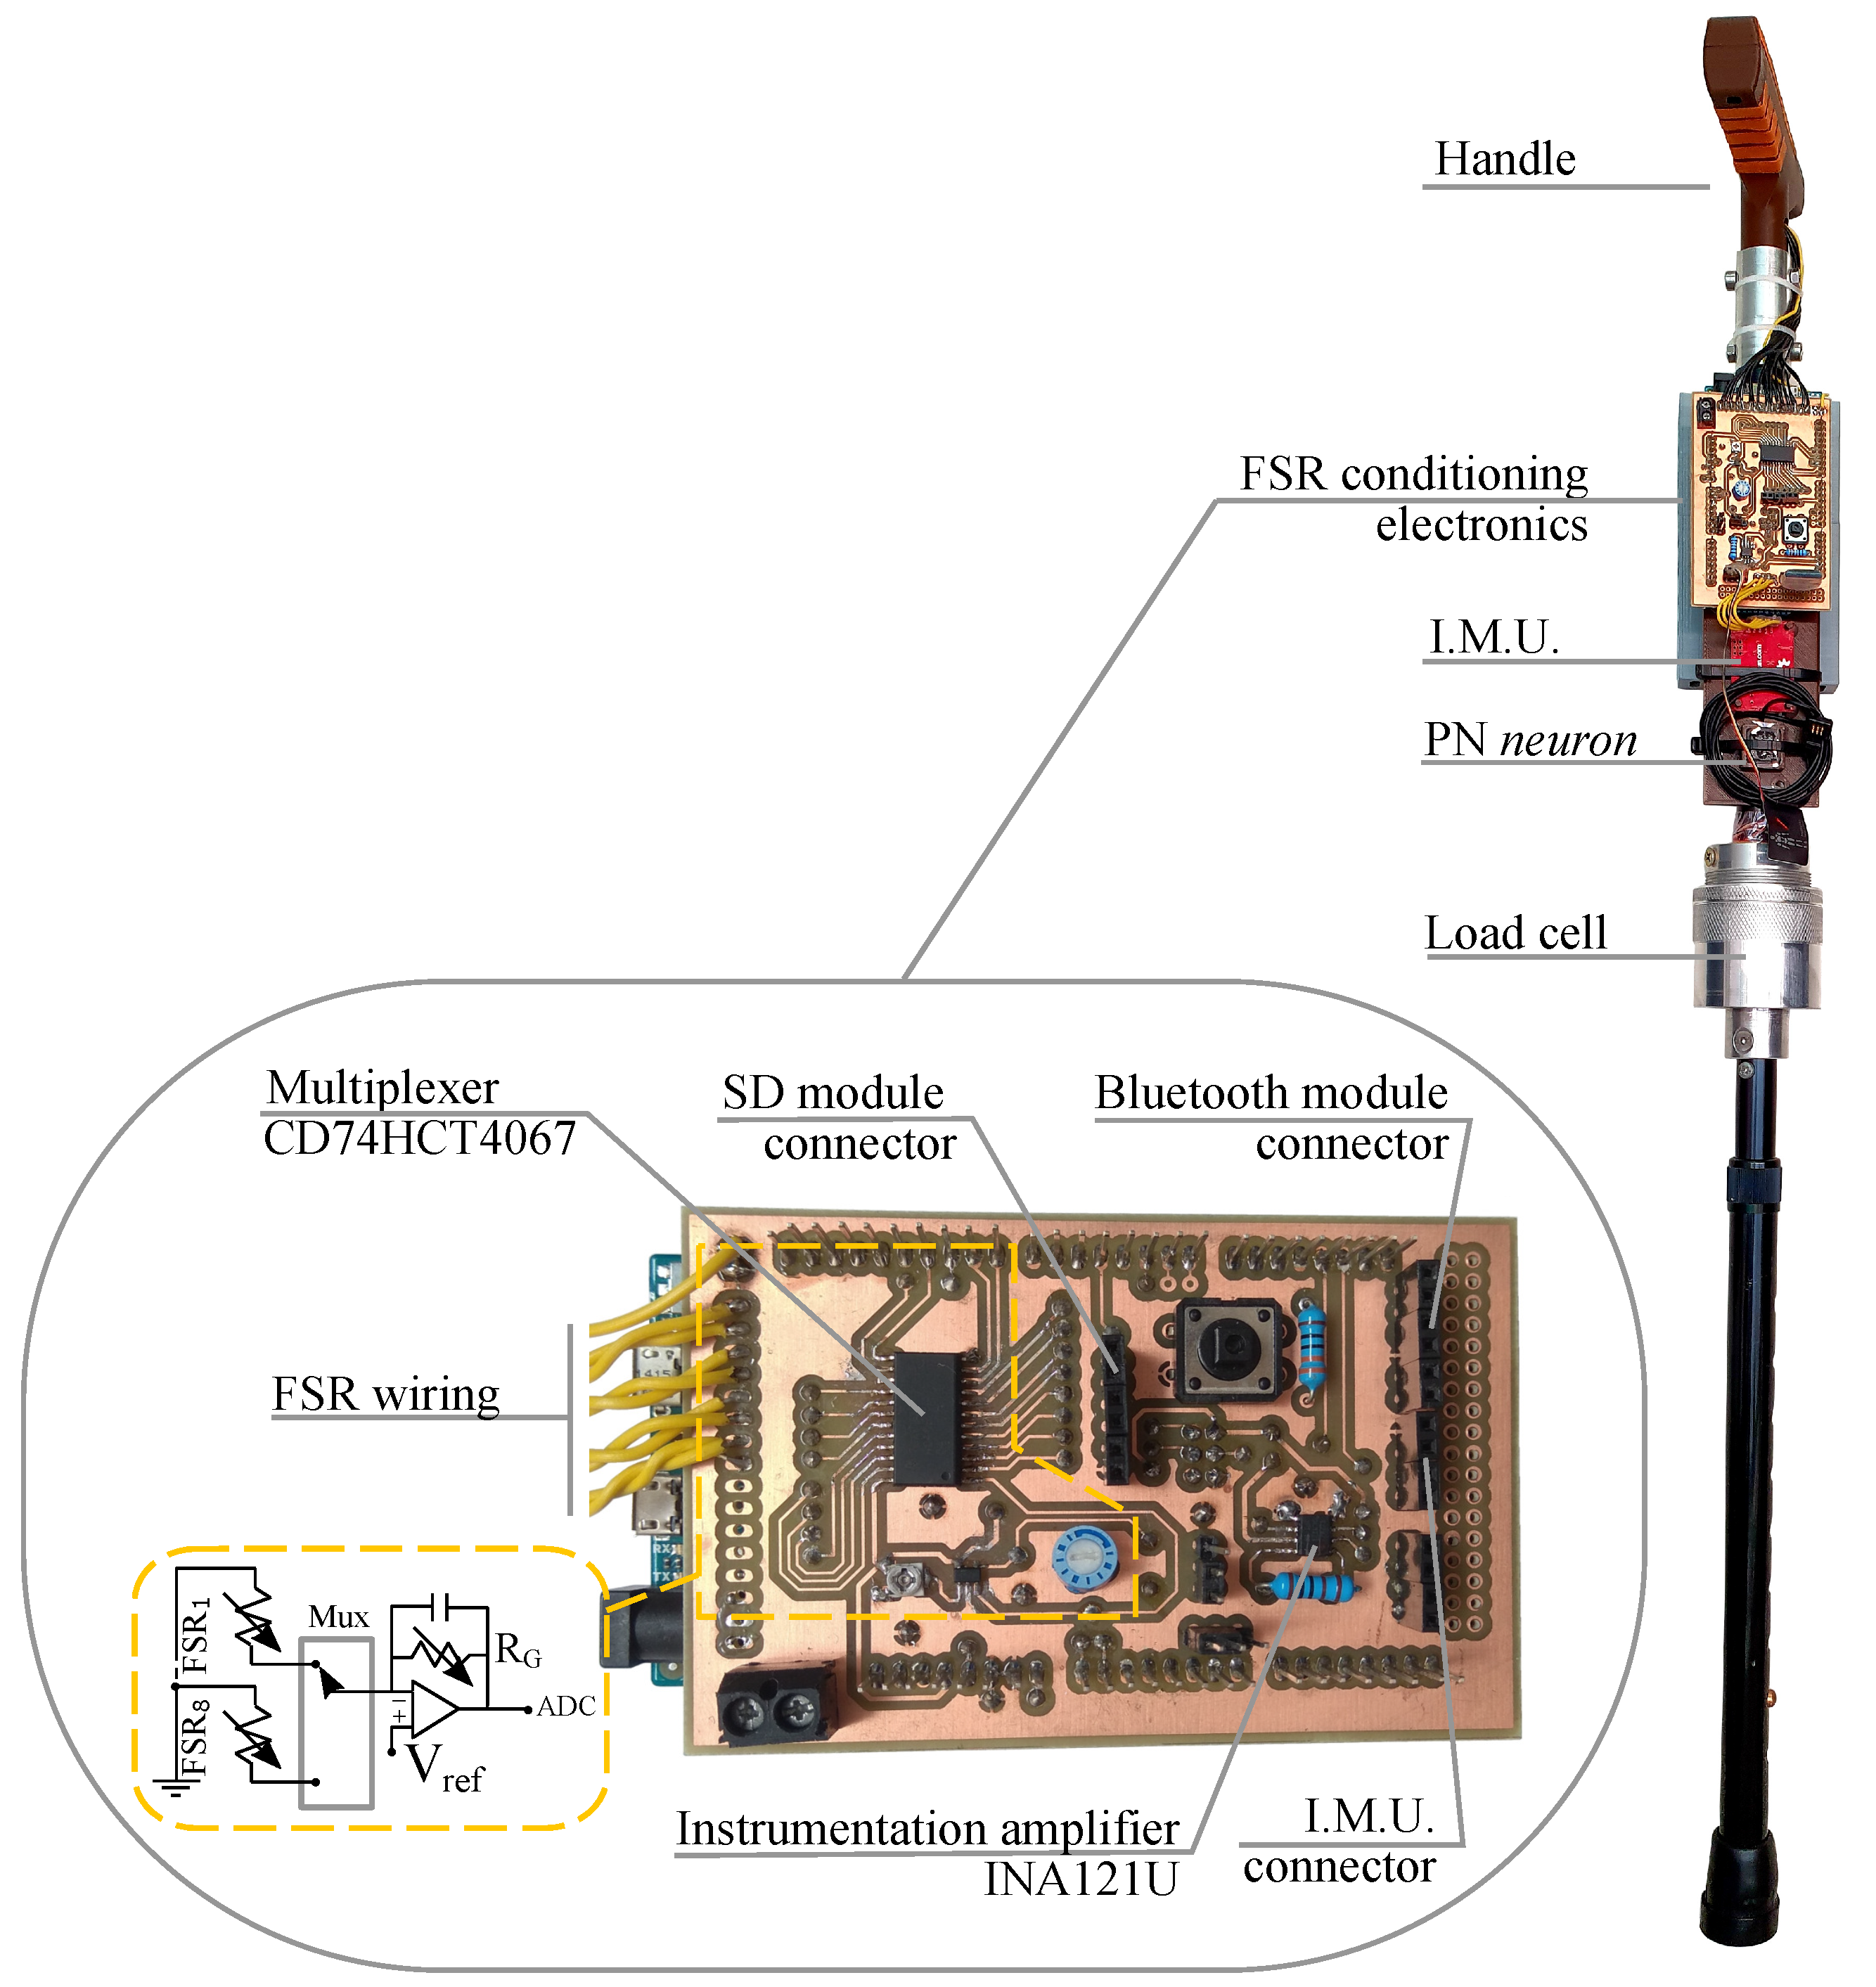
2. Cane Handle
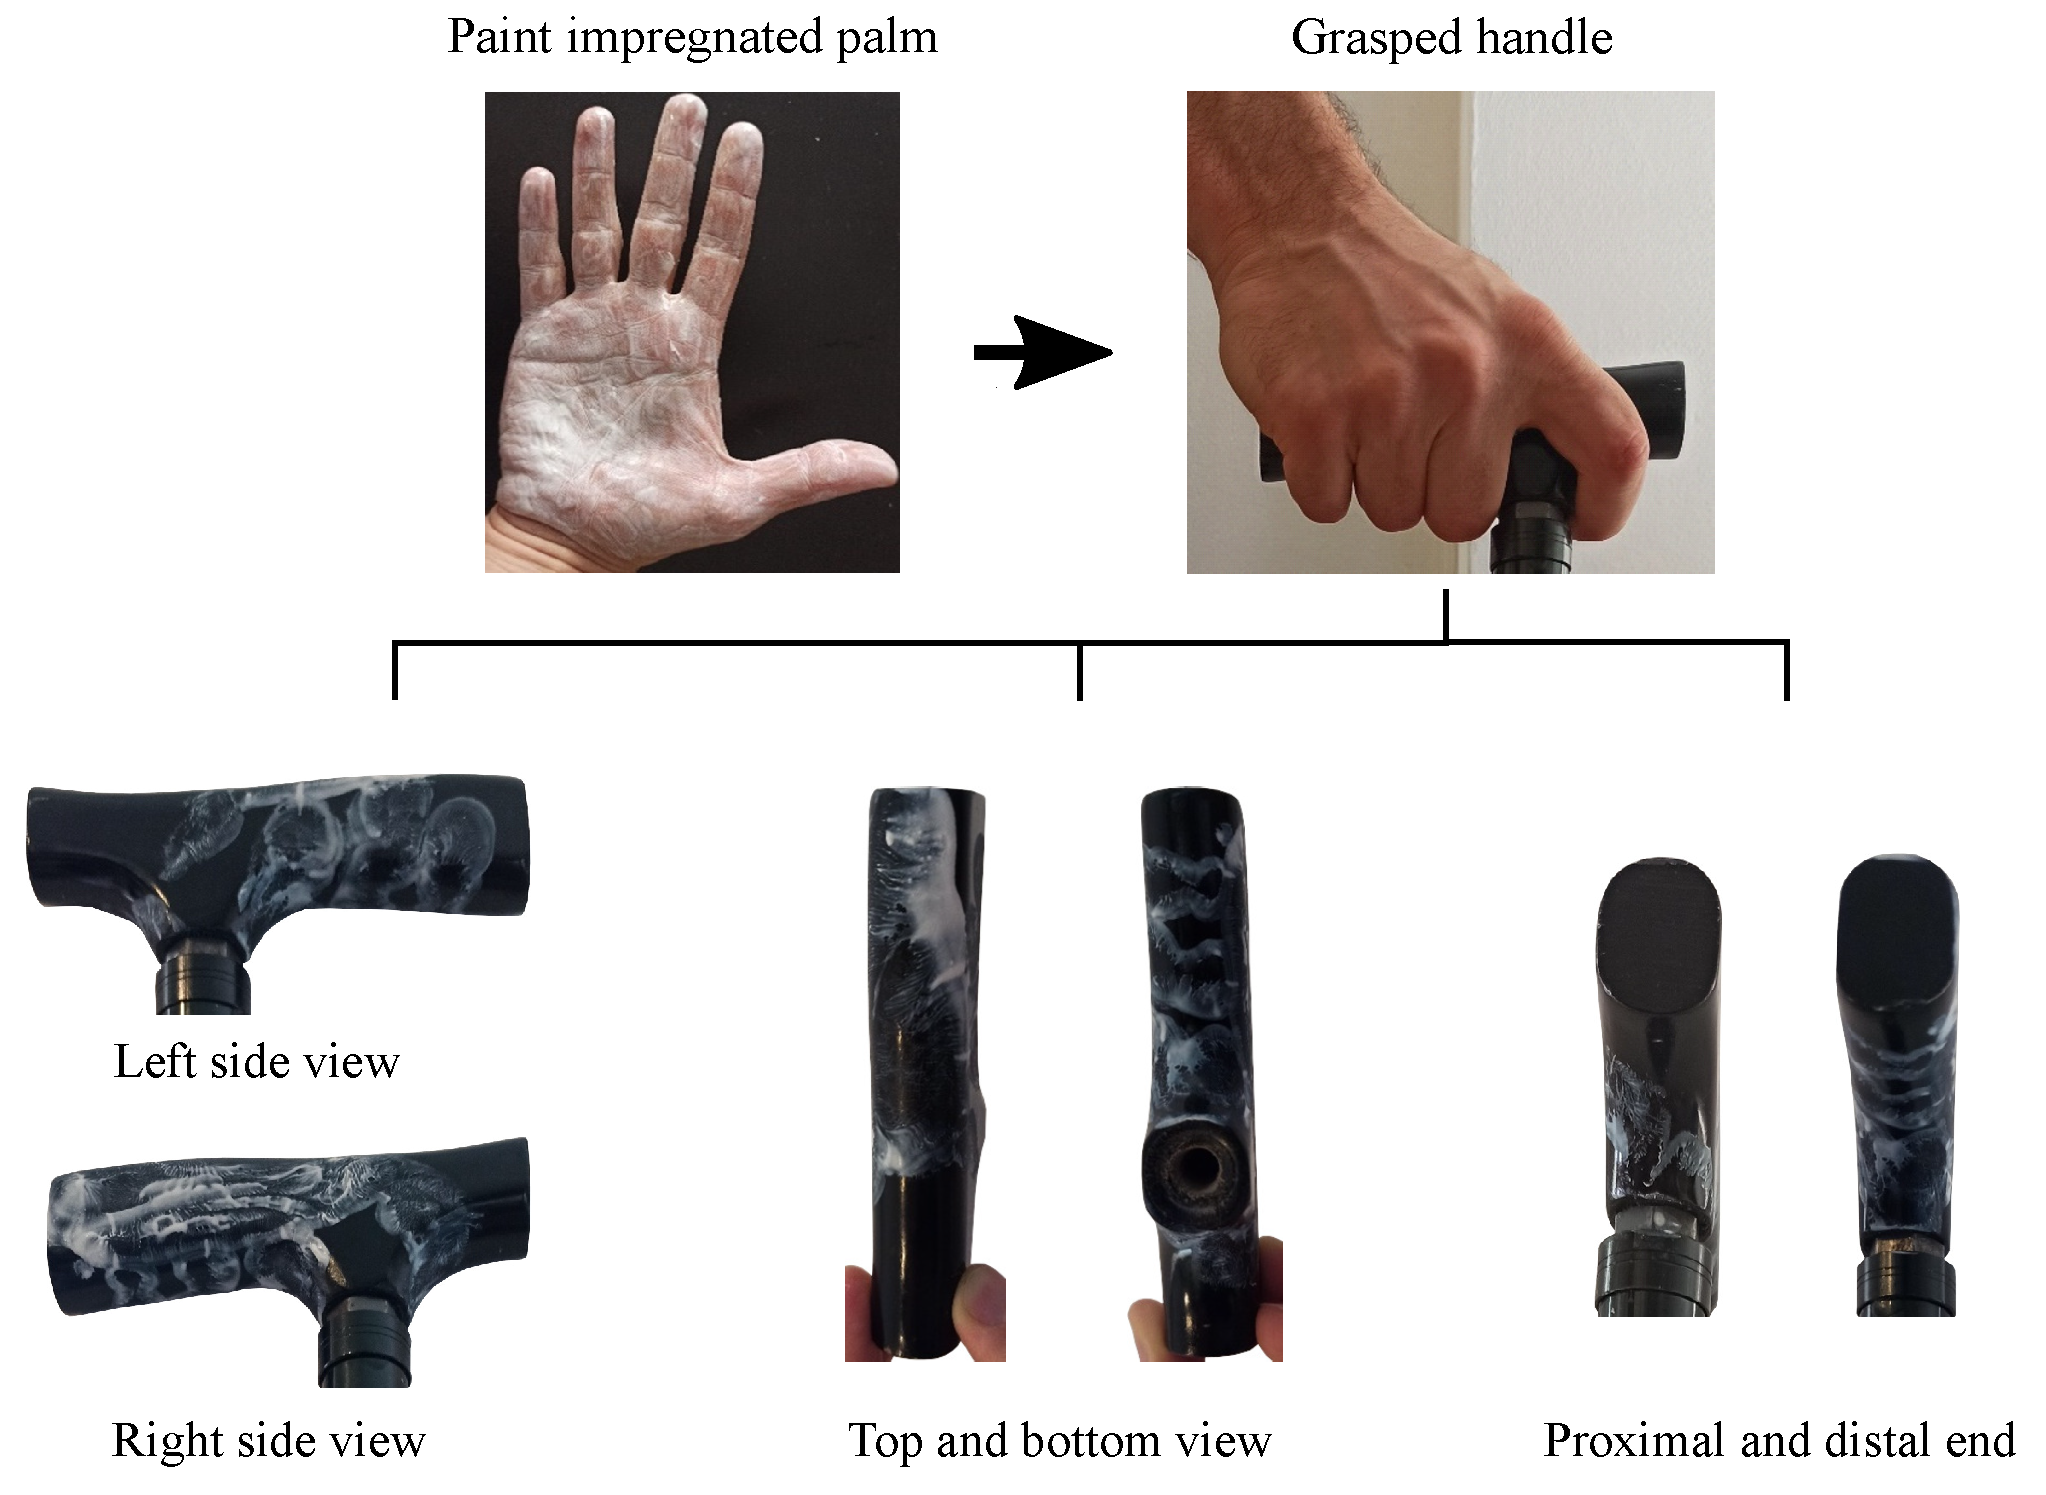
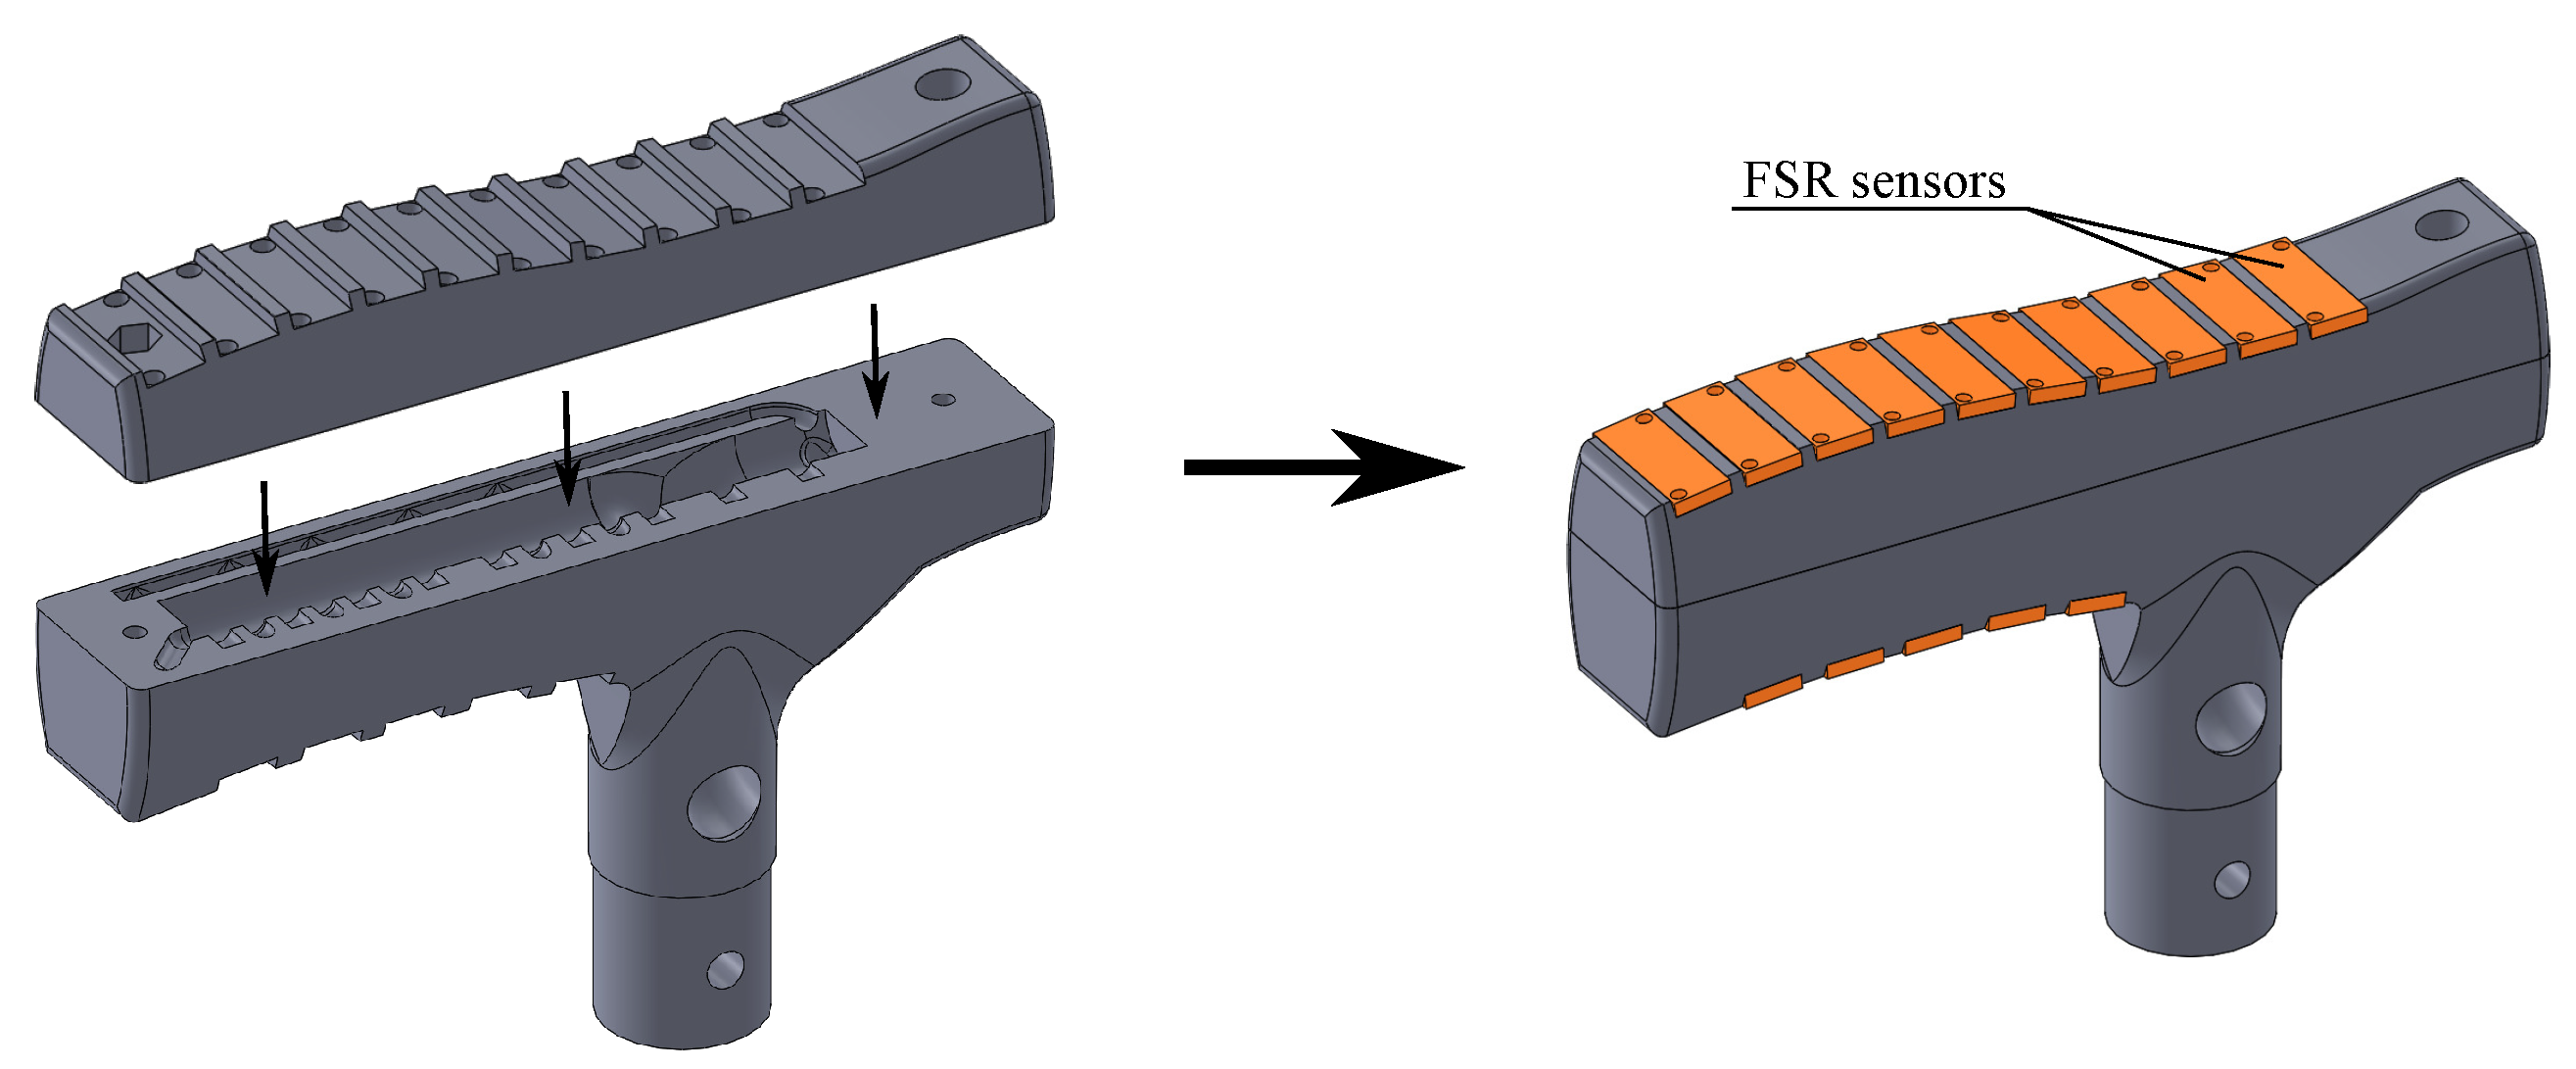
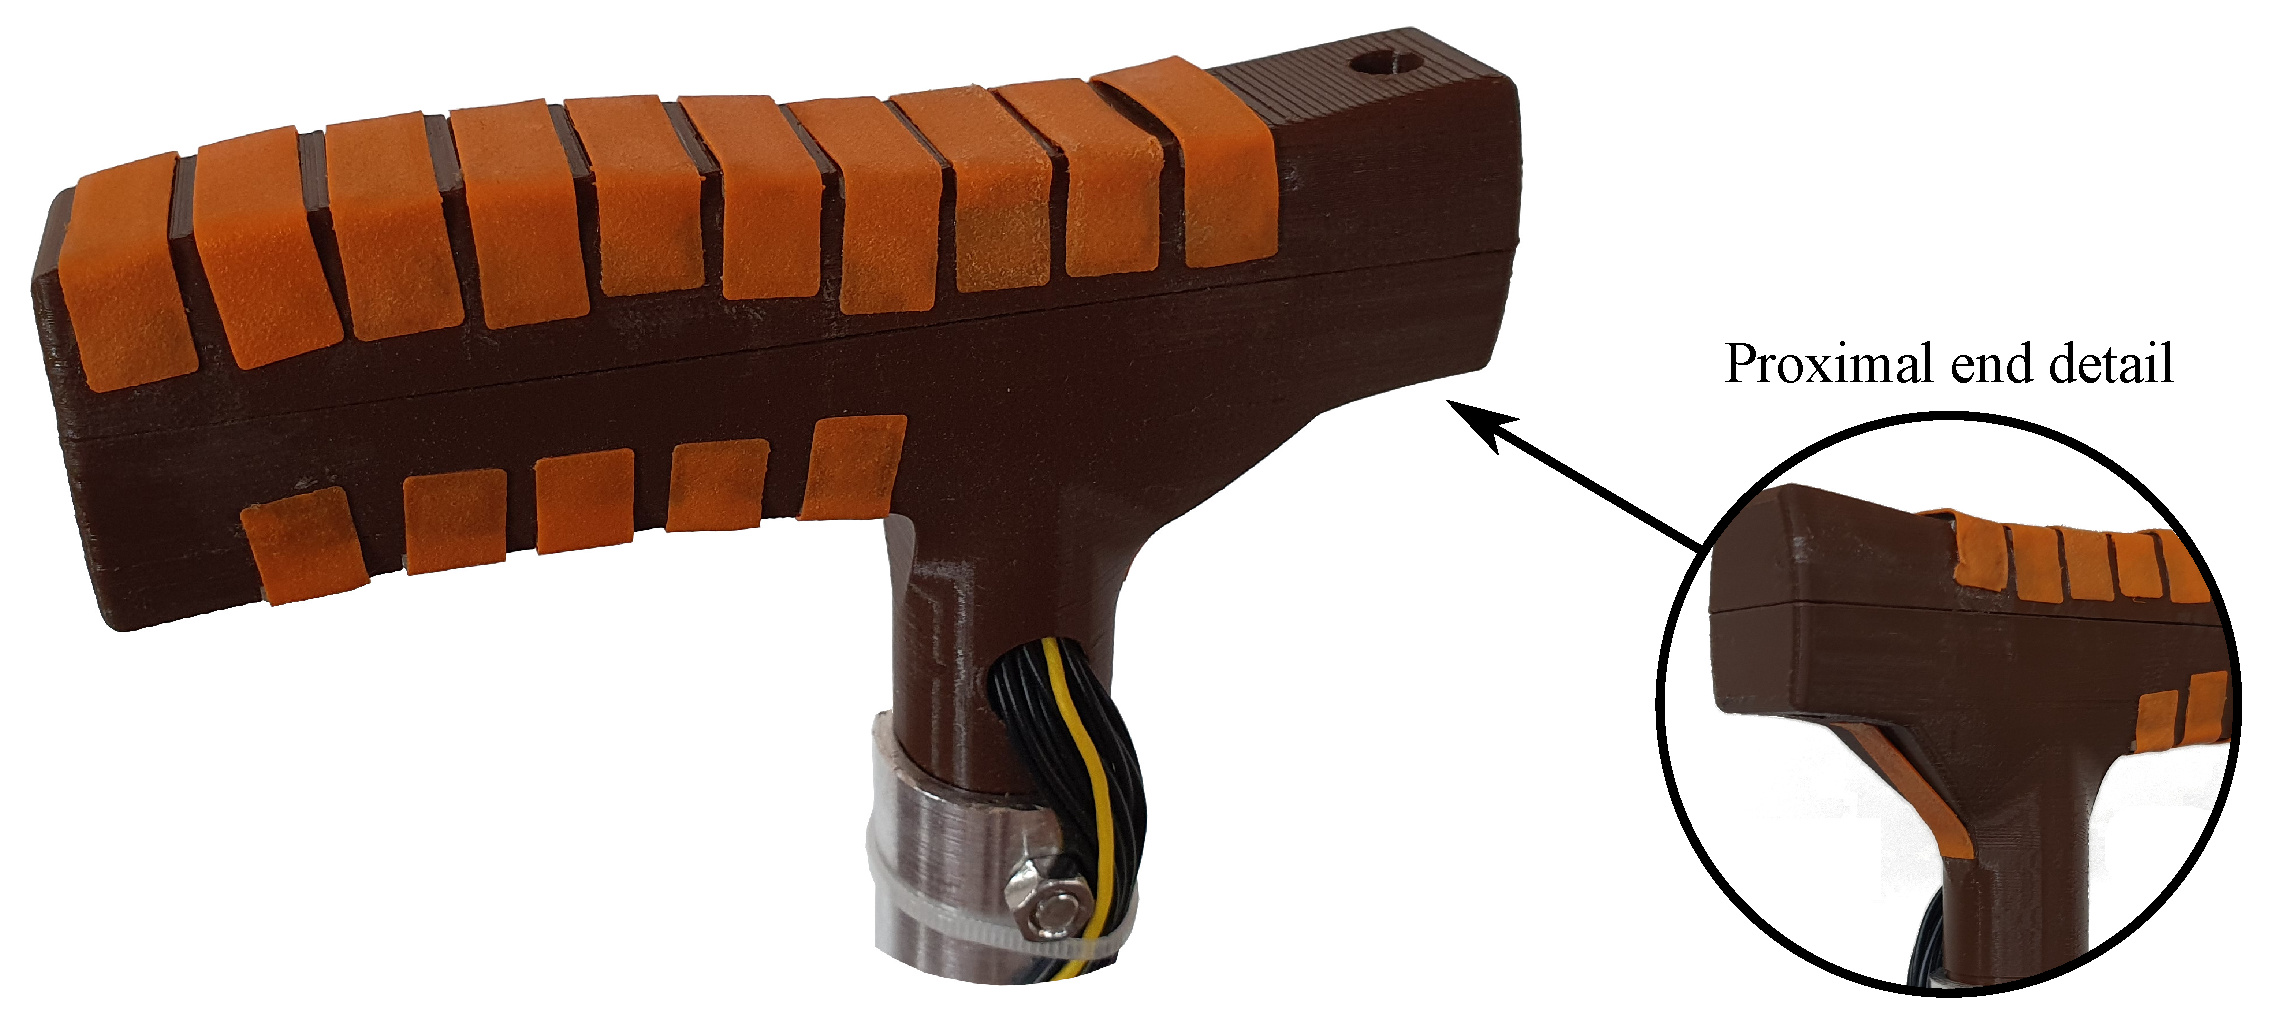
2.1. Handle Design
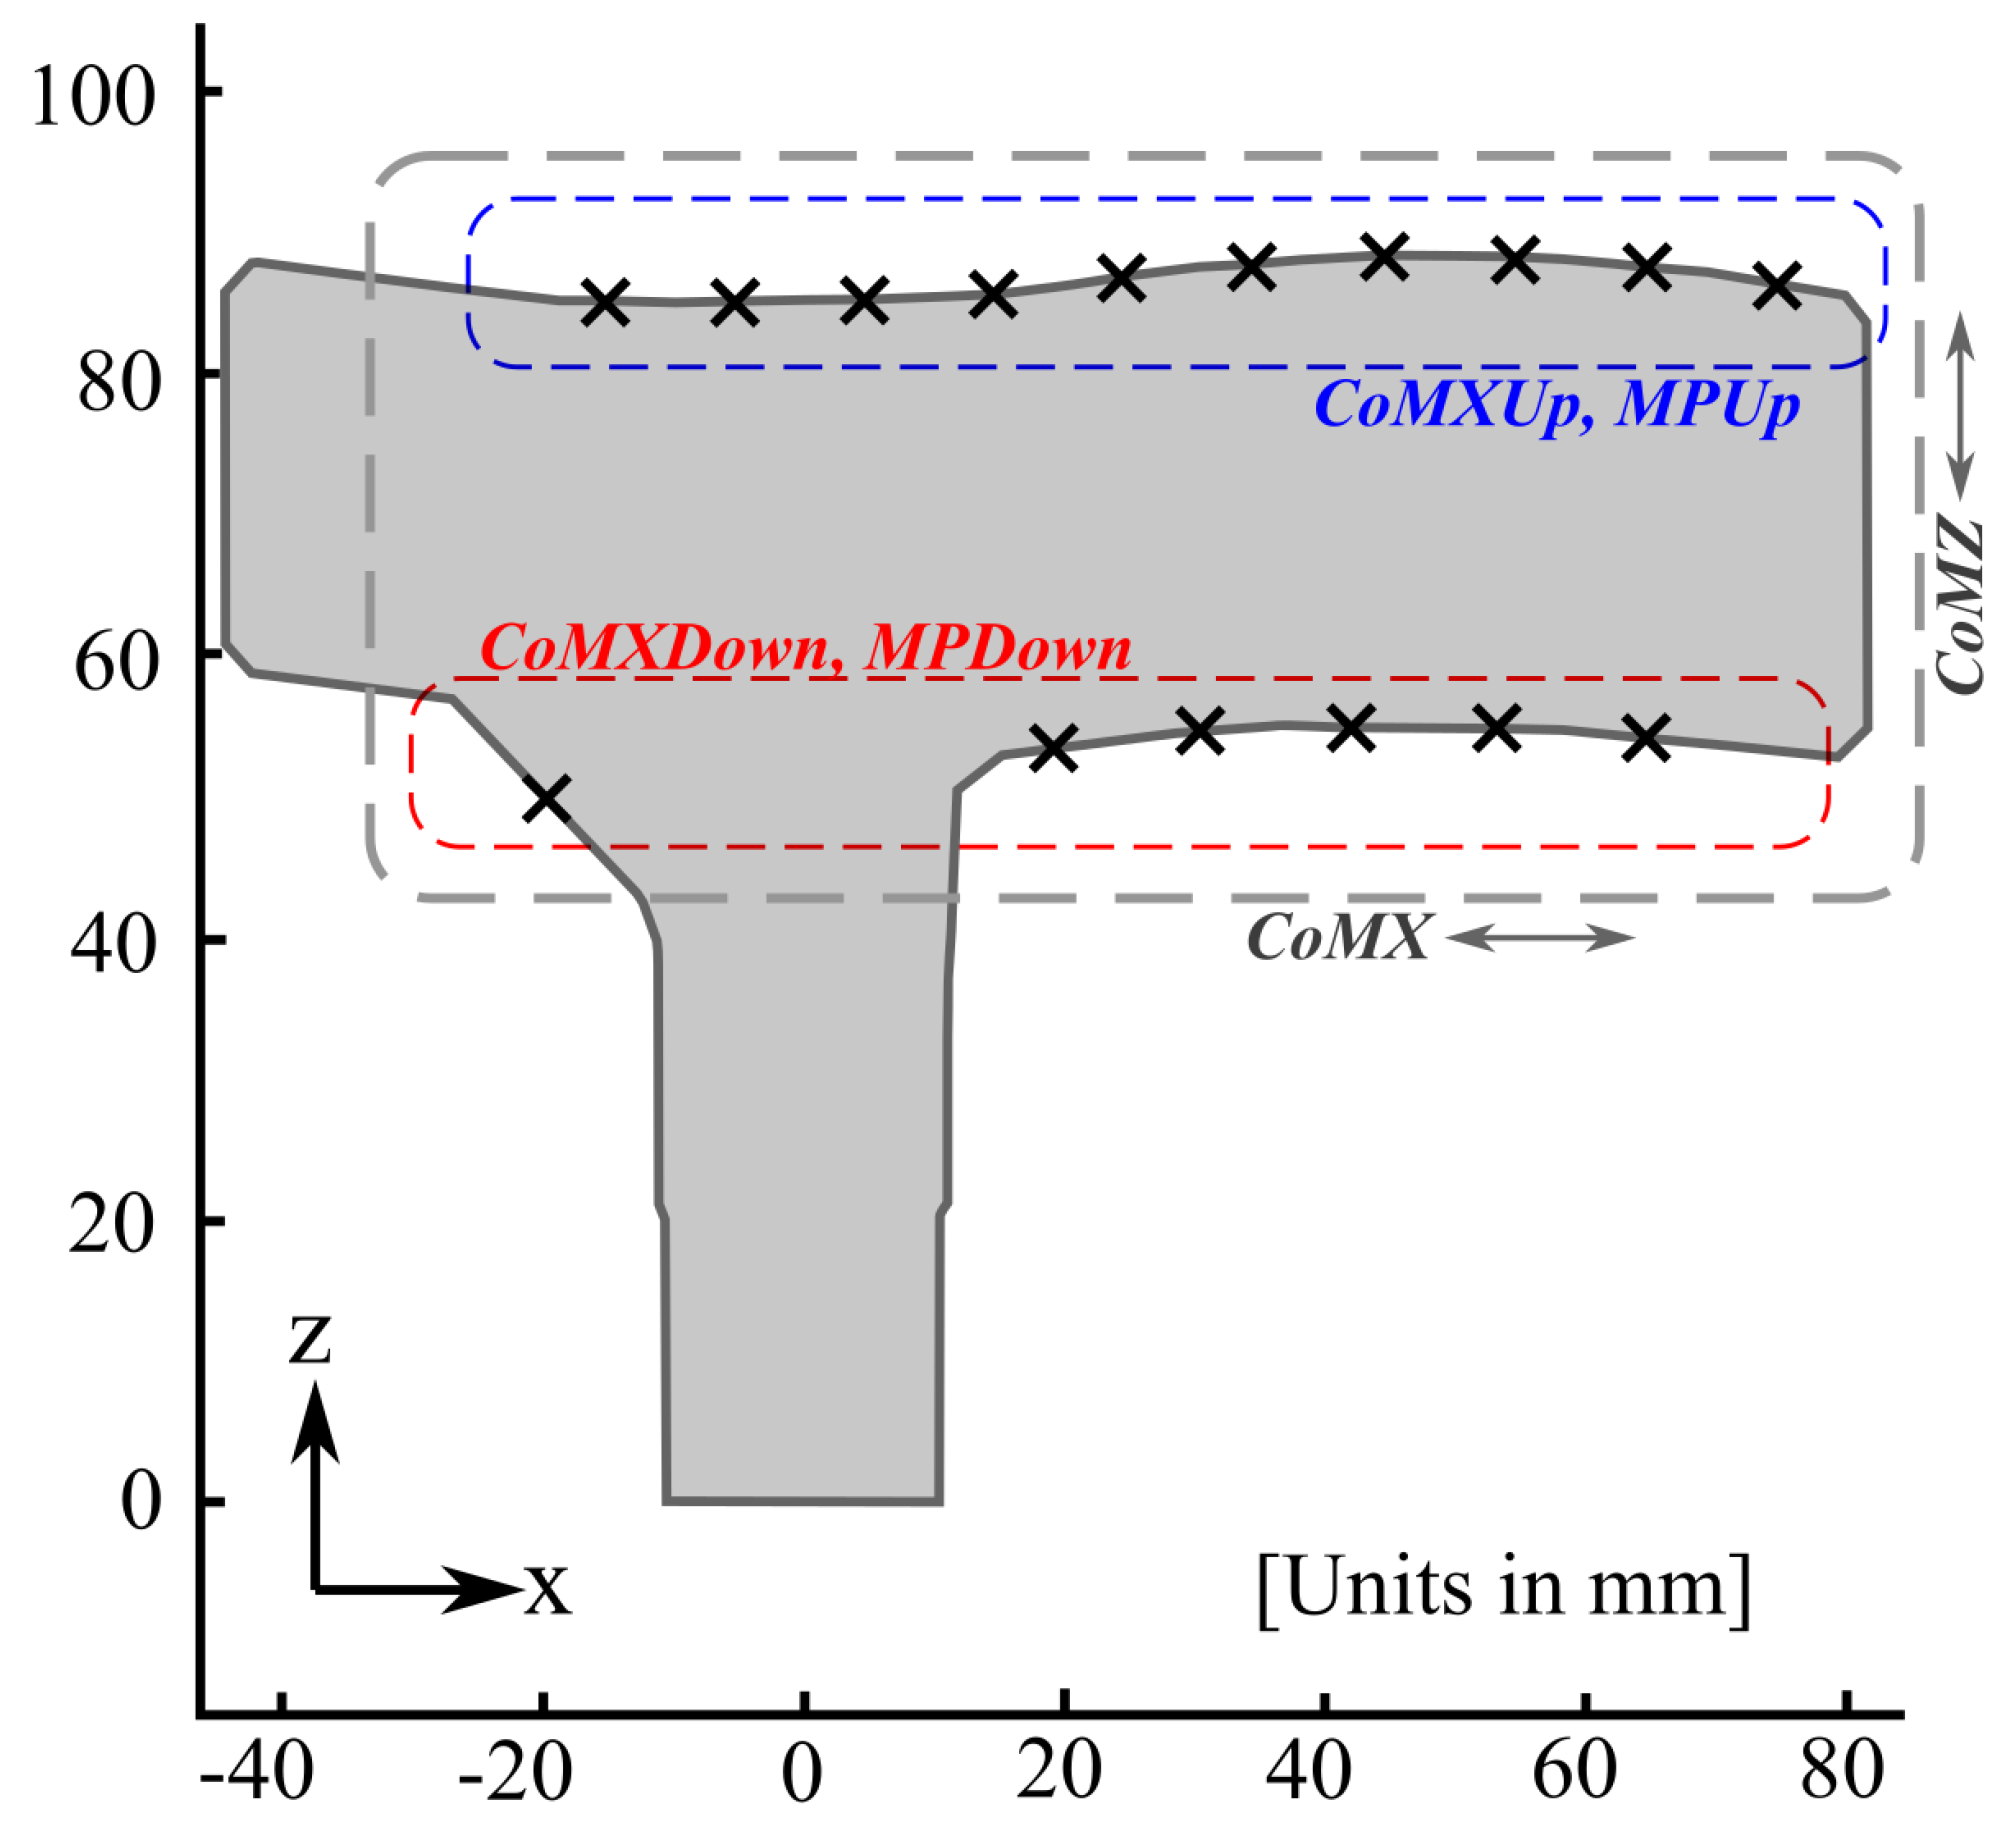
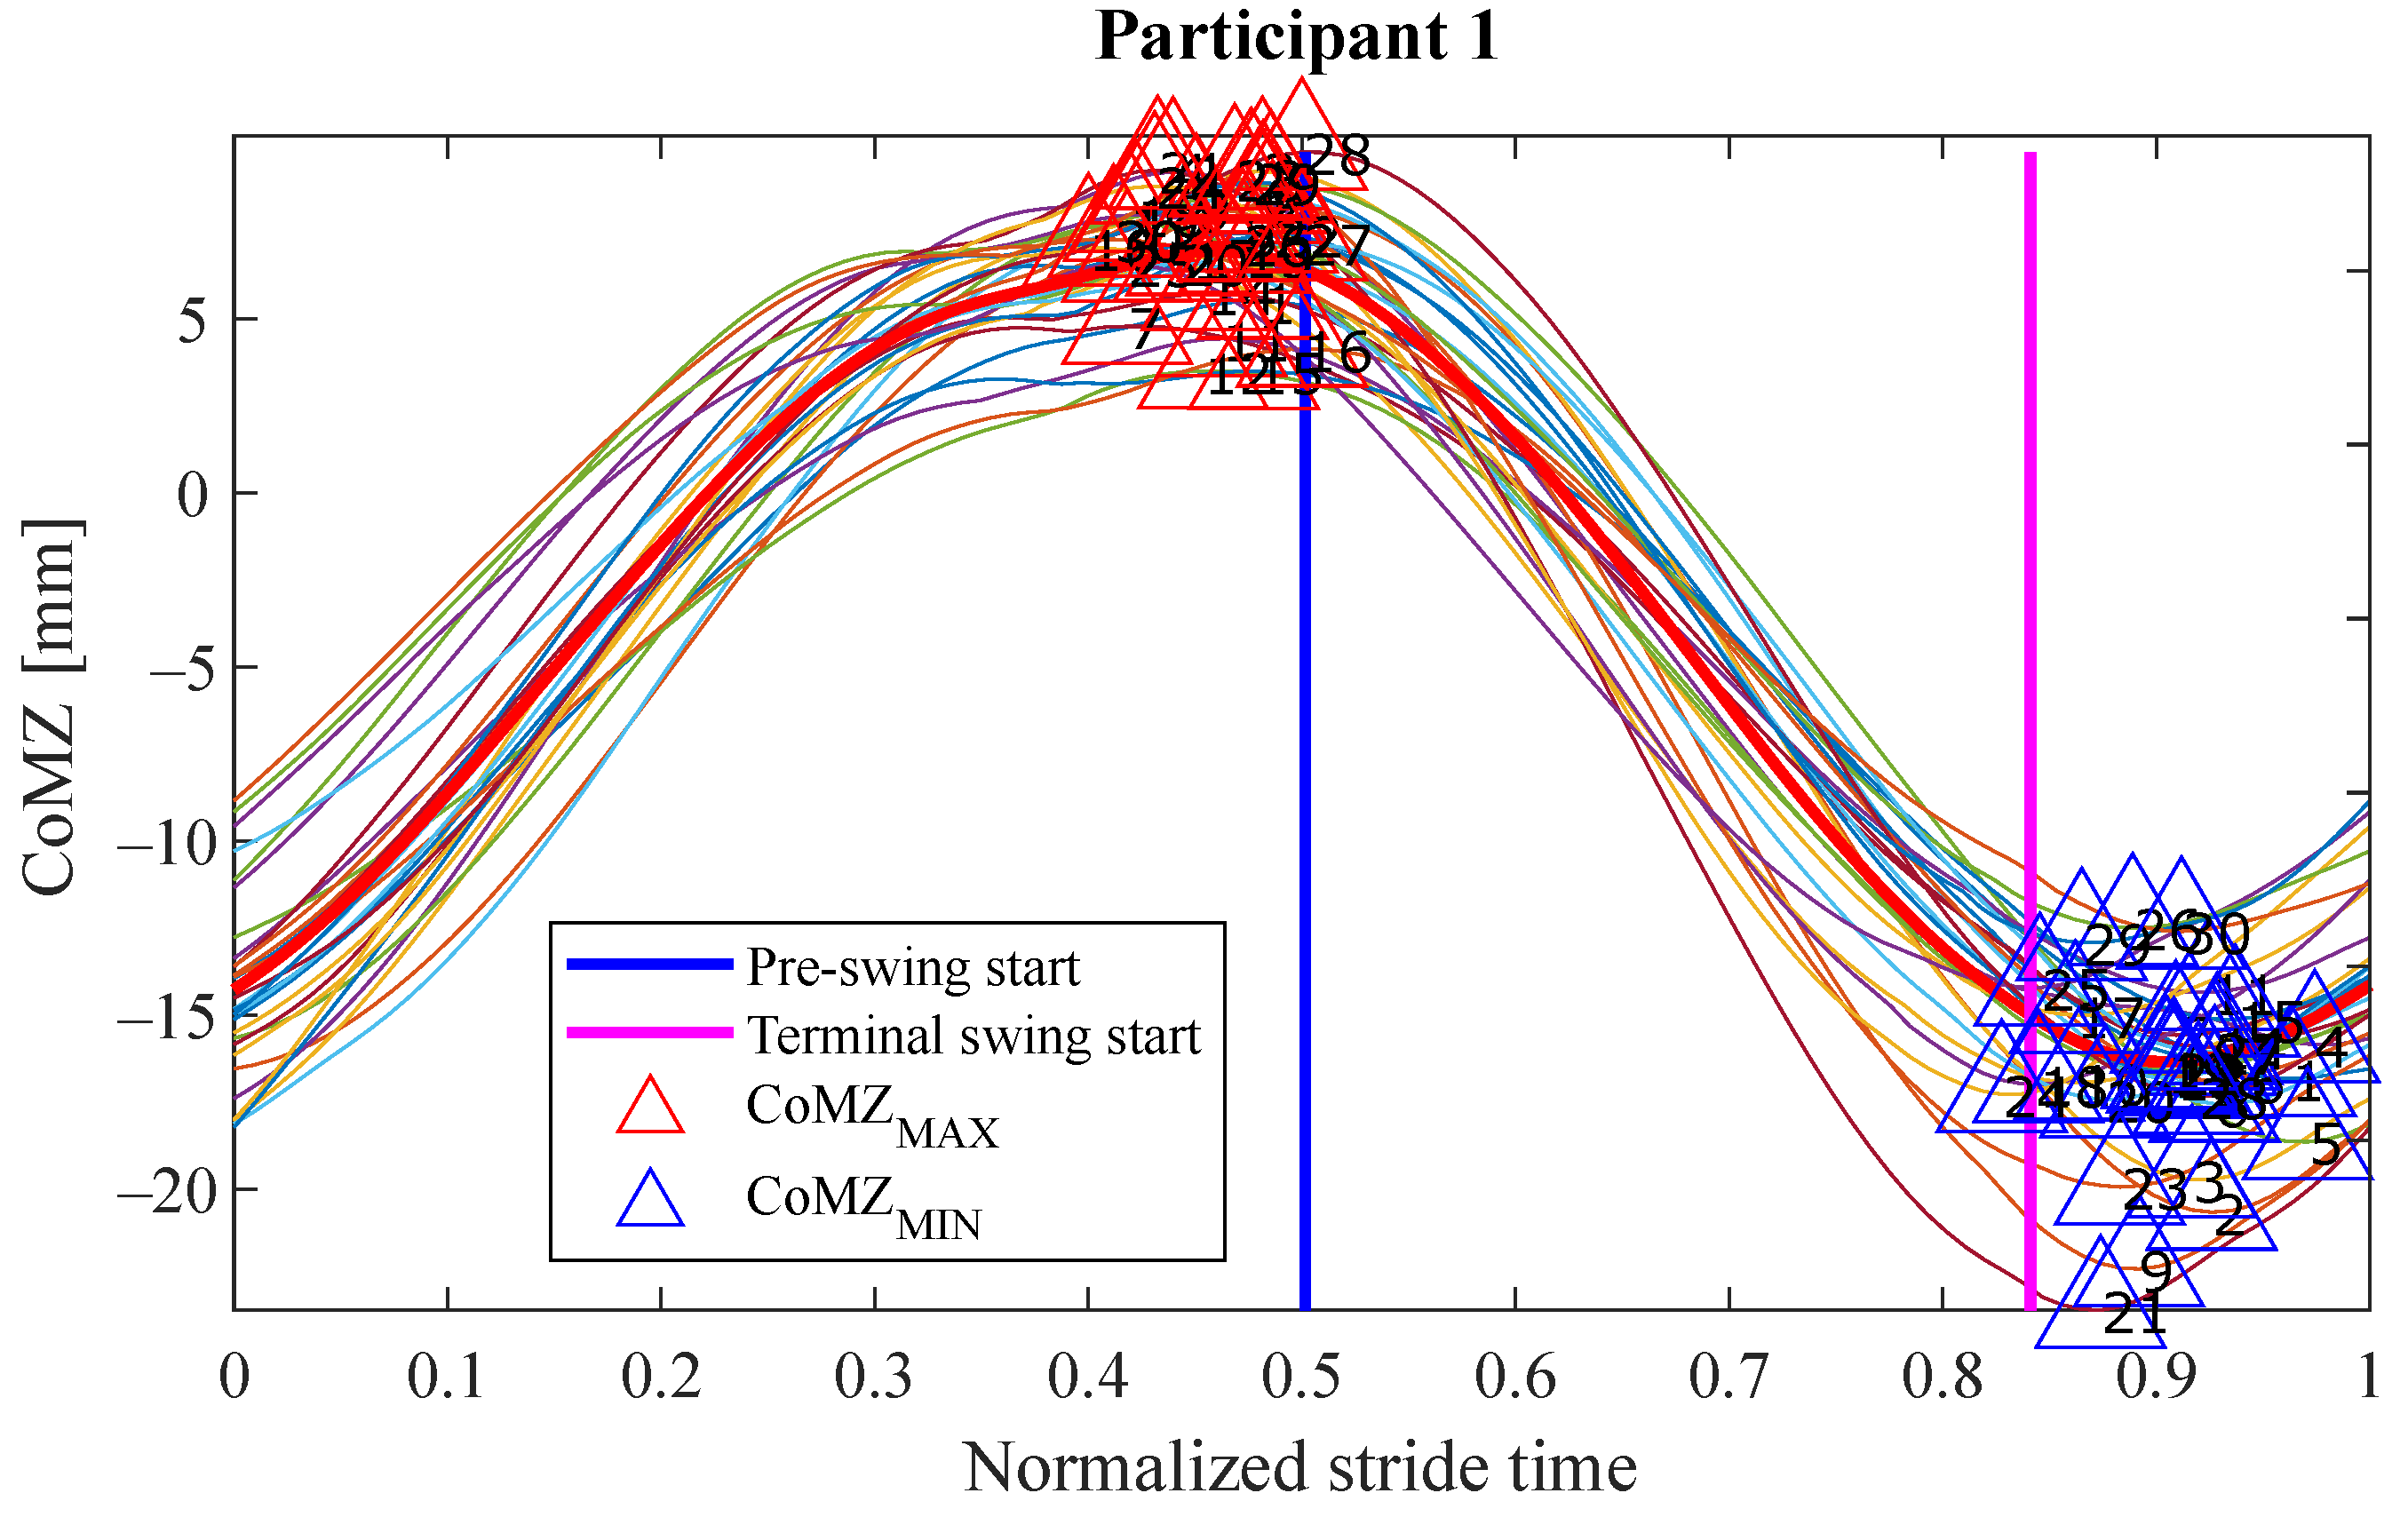
2.2. Analyzed Variables
- Top side center of mass in x-axis direction:where the index i is the same as that in Table 1 and (number of FSRs on the handle top side).
- Bottom side center of mass in x-axis direction:where (number of FSR units in the handle bottom side).
- Center of mass in x-axis direction:
- Center of mass in z-axis direction:
- Top side mean pressure:
- Bottom side mean pressure:
3. Materials
3.1. Instrumented Cane
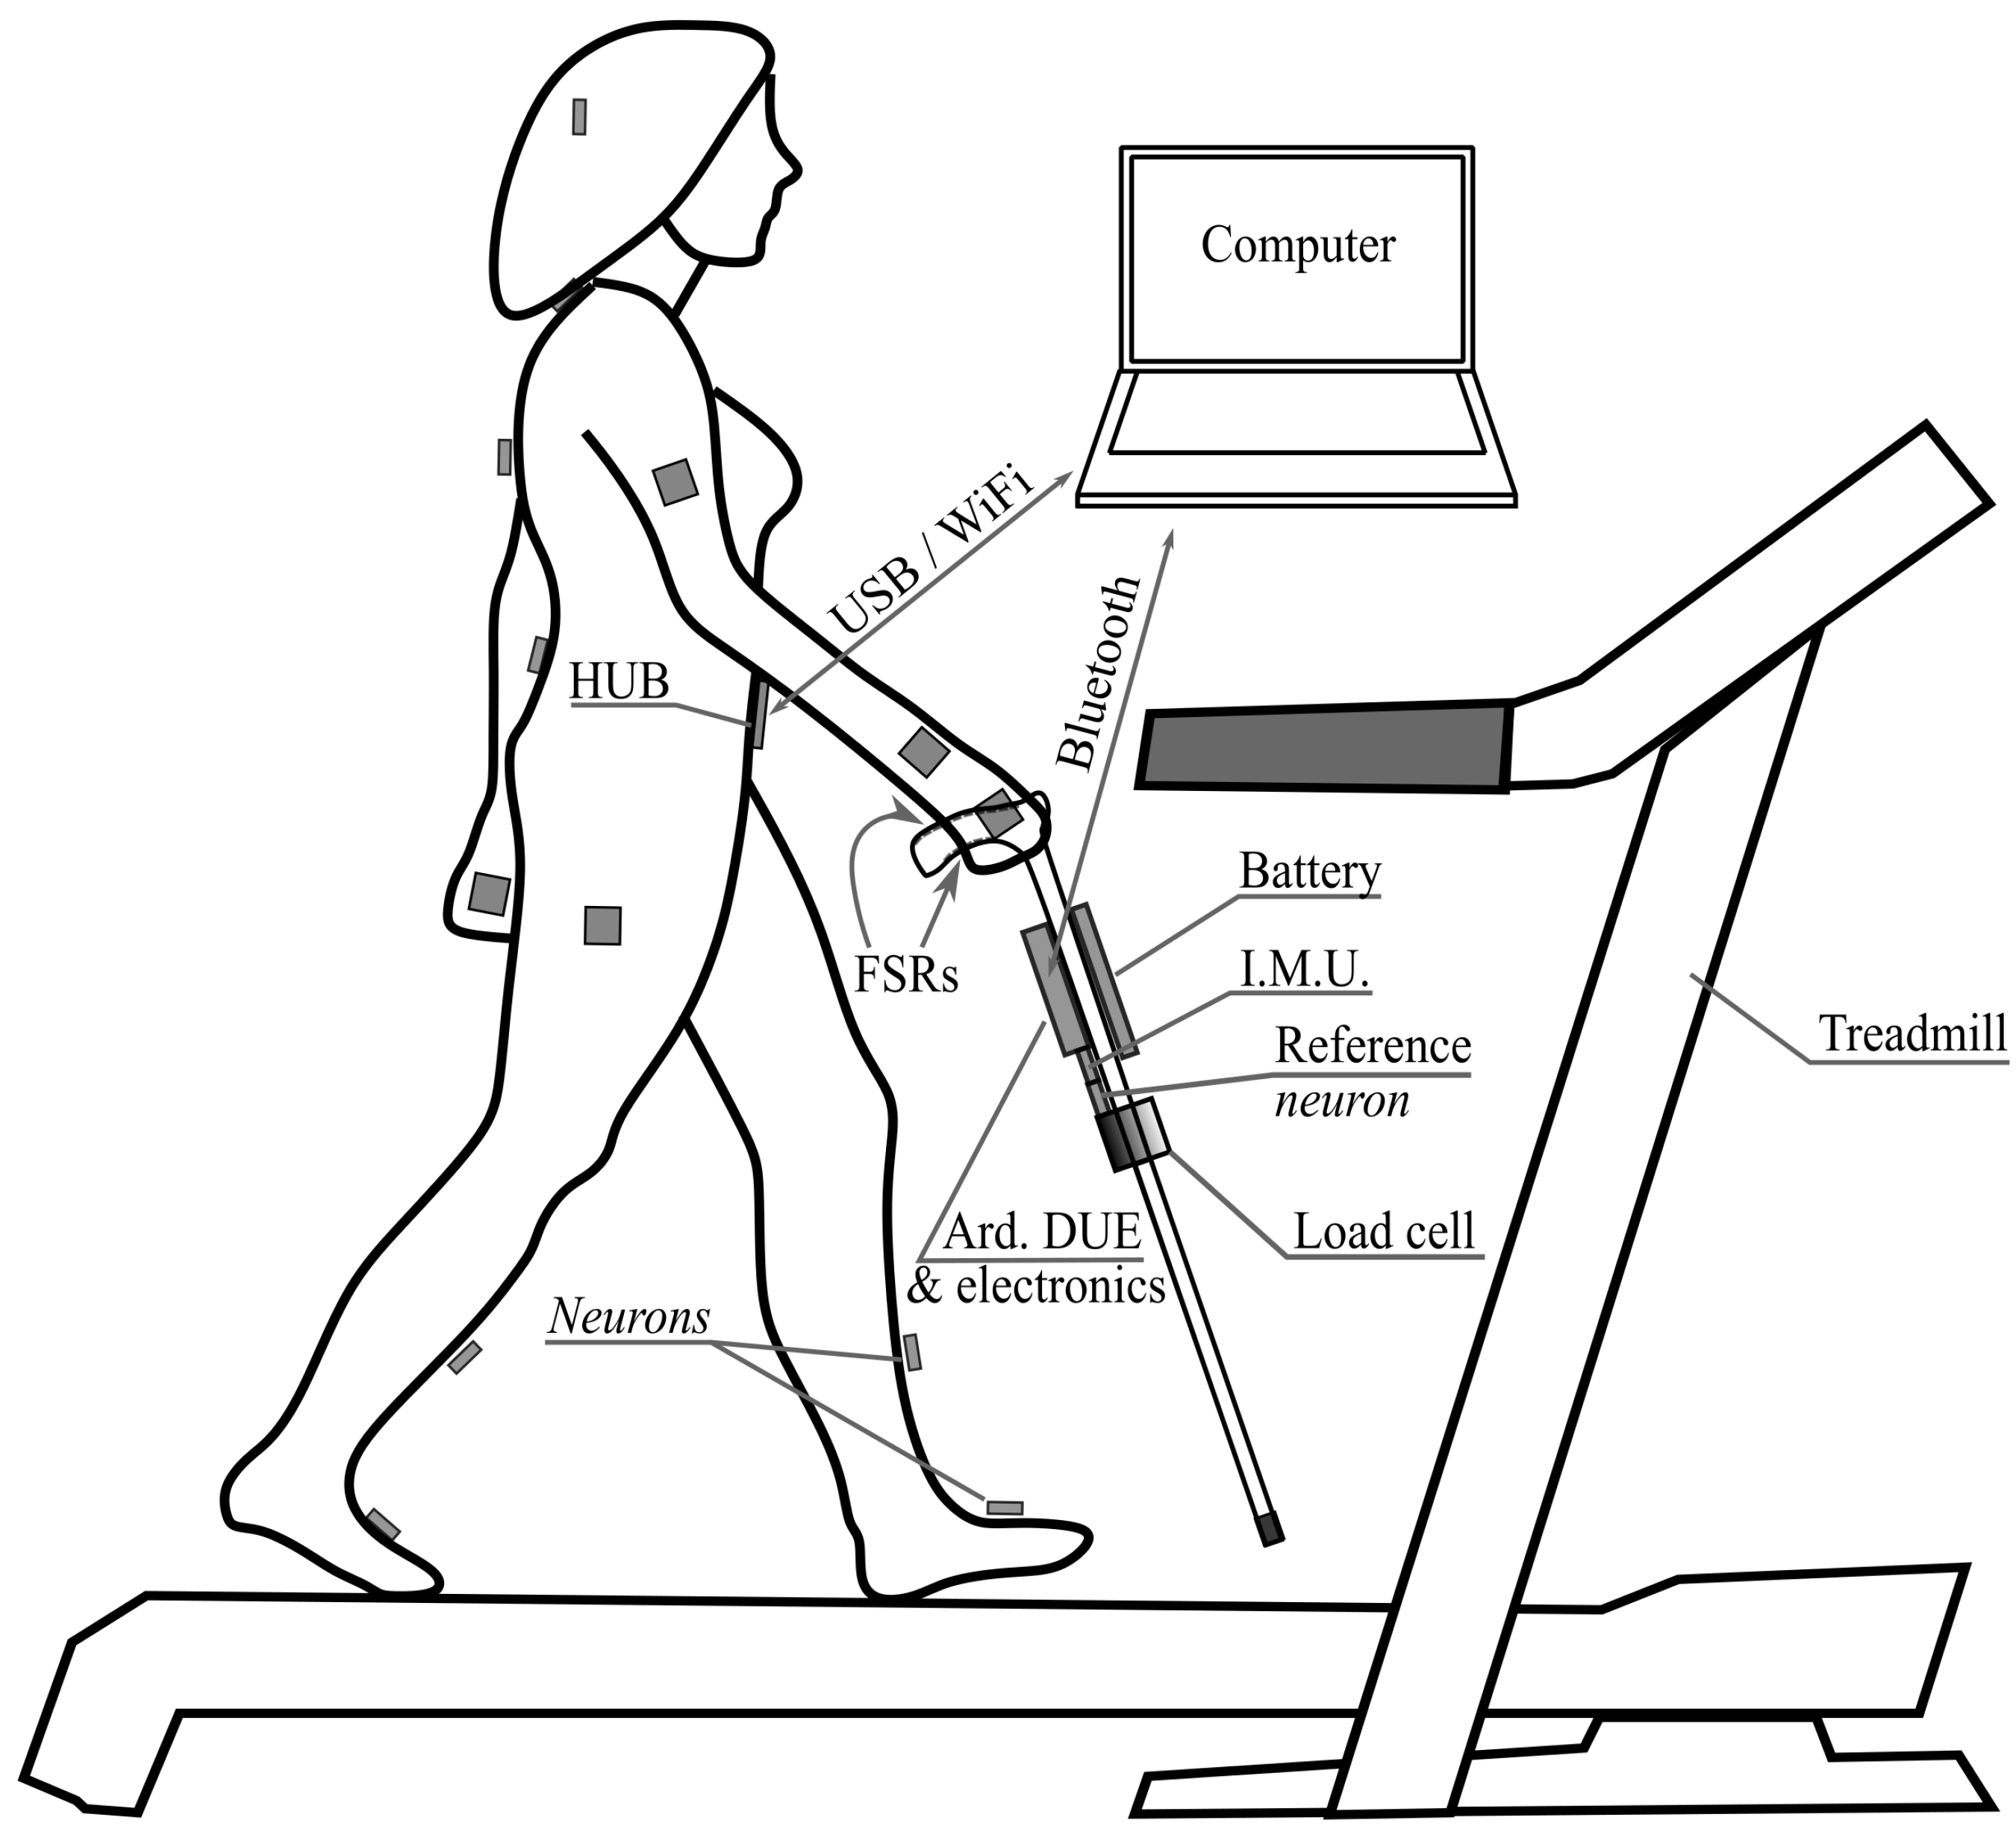
3.2. The Reference System
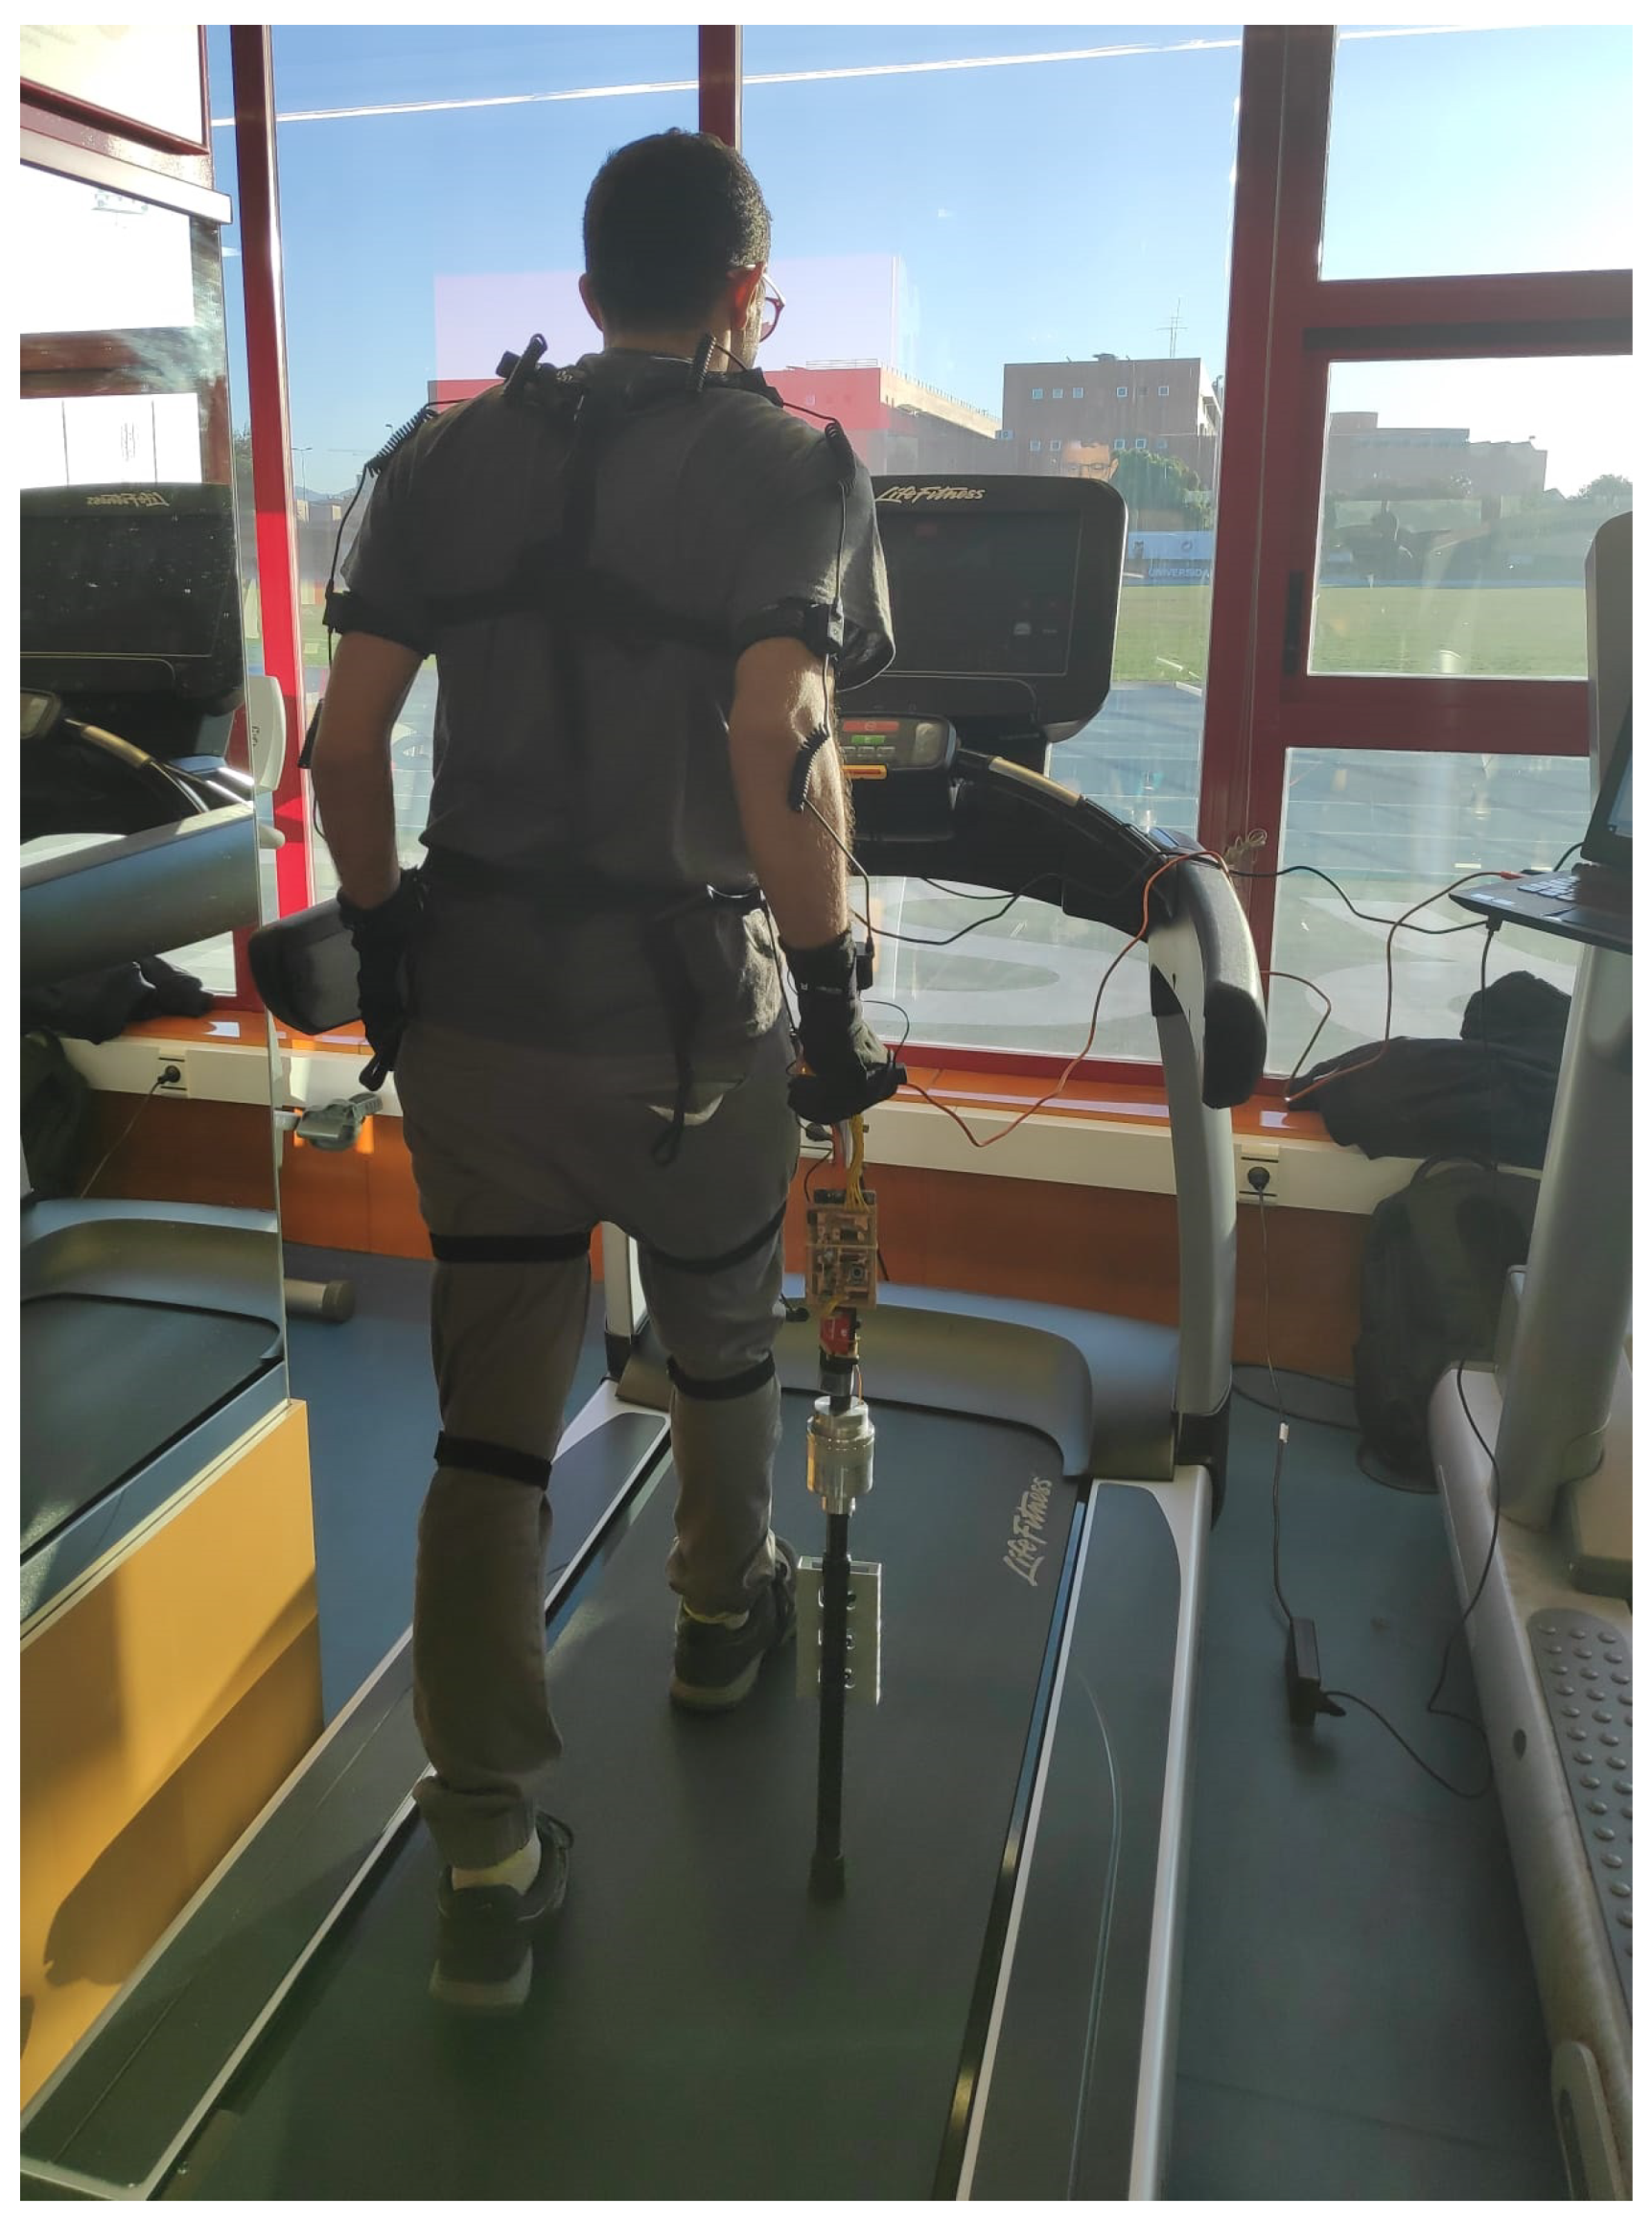
3.3. Experimental Setup
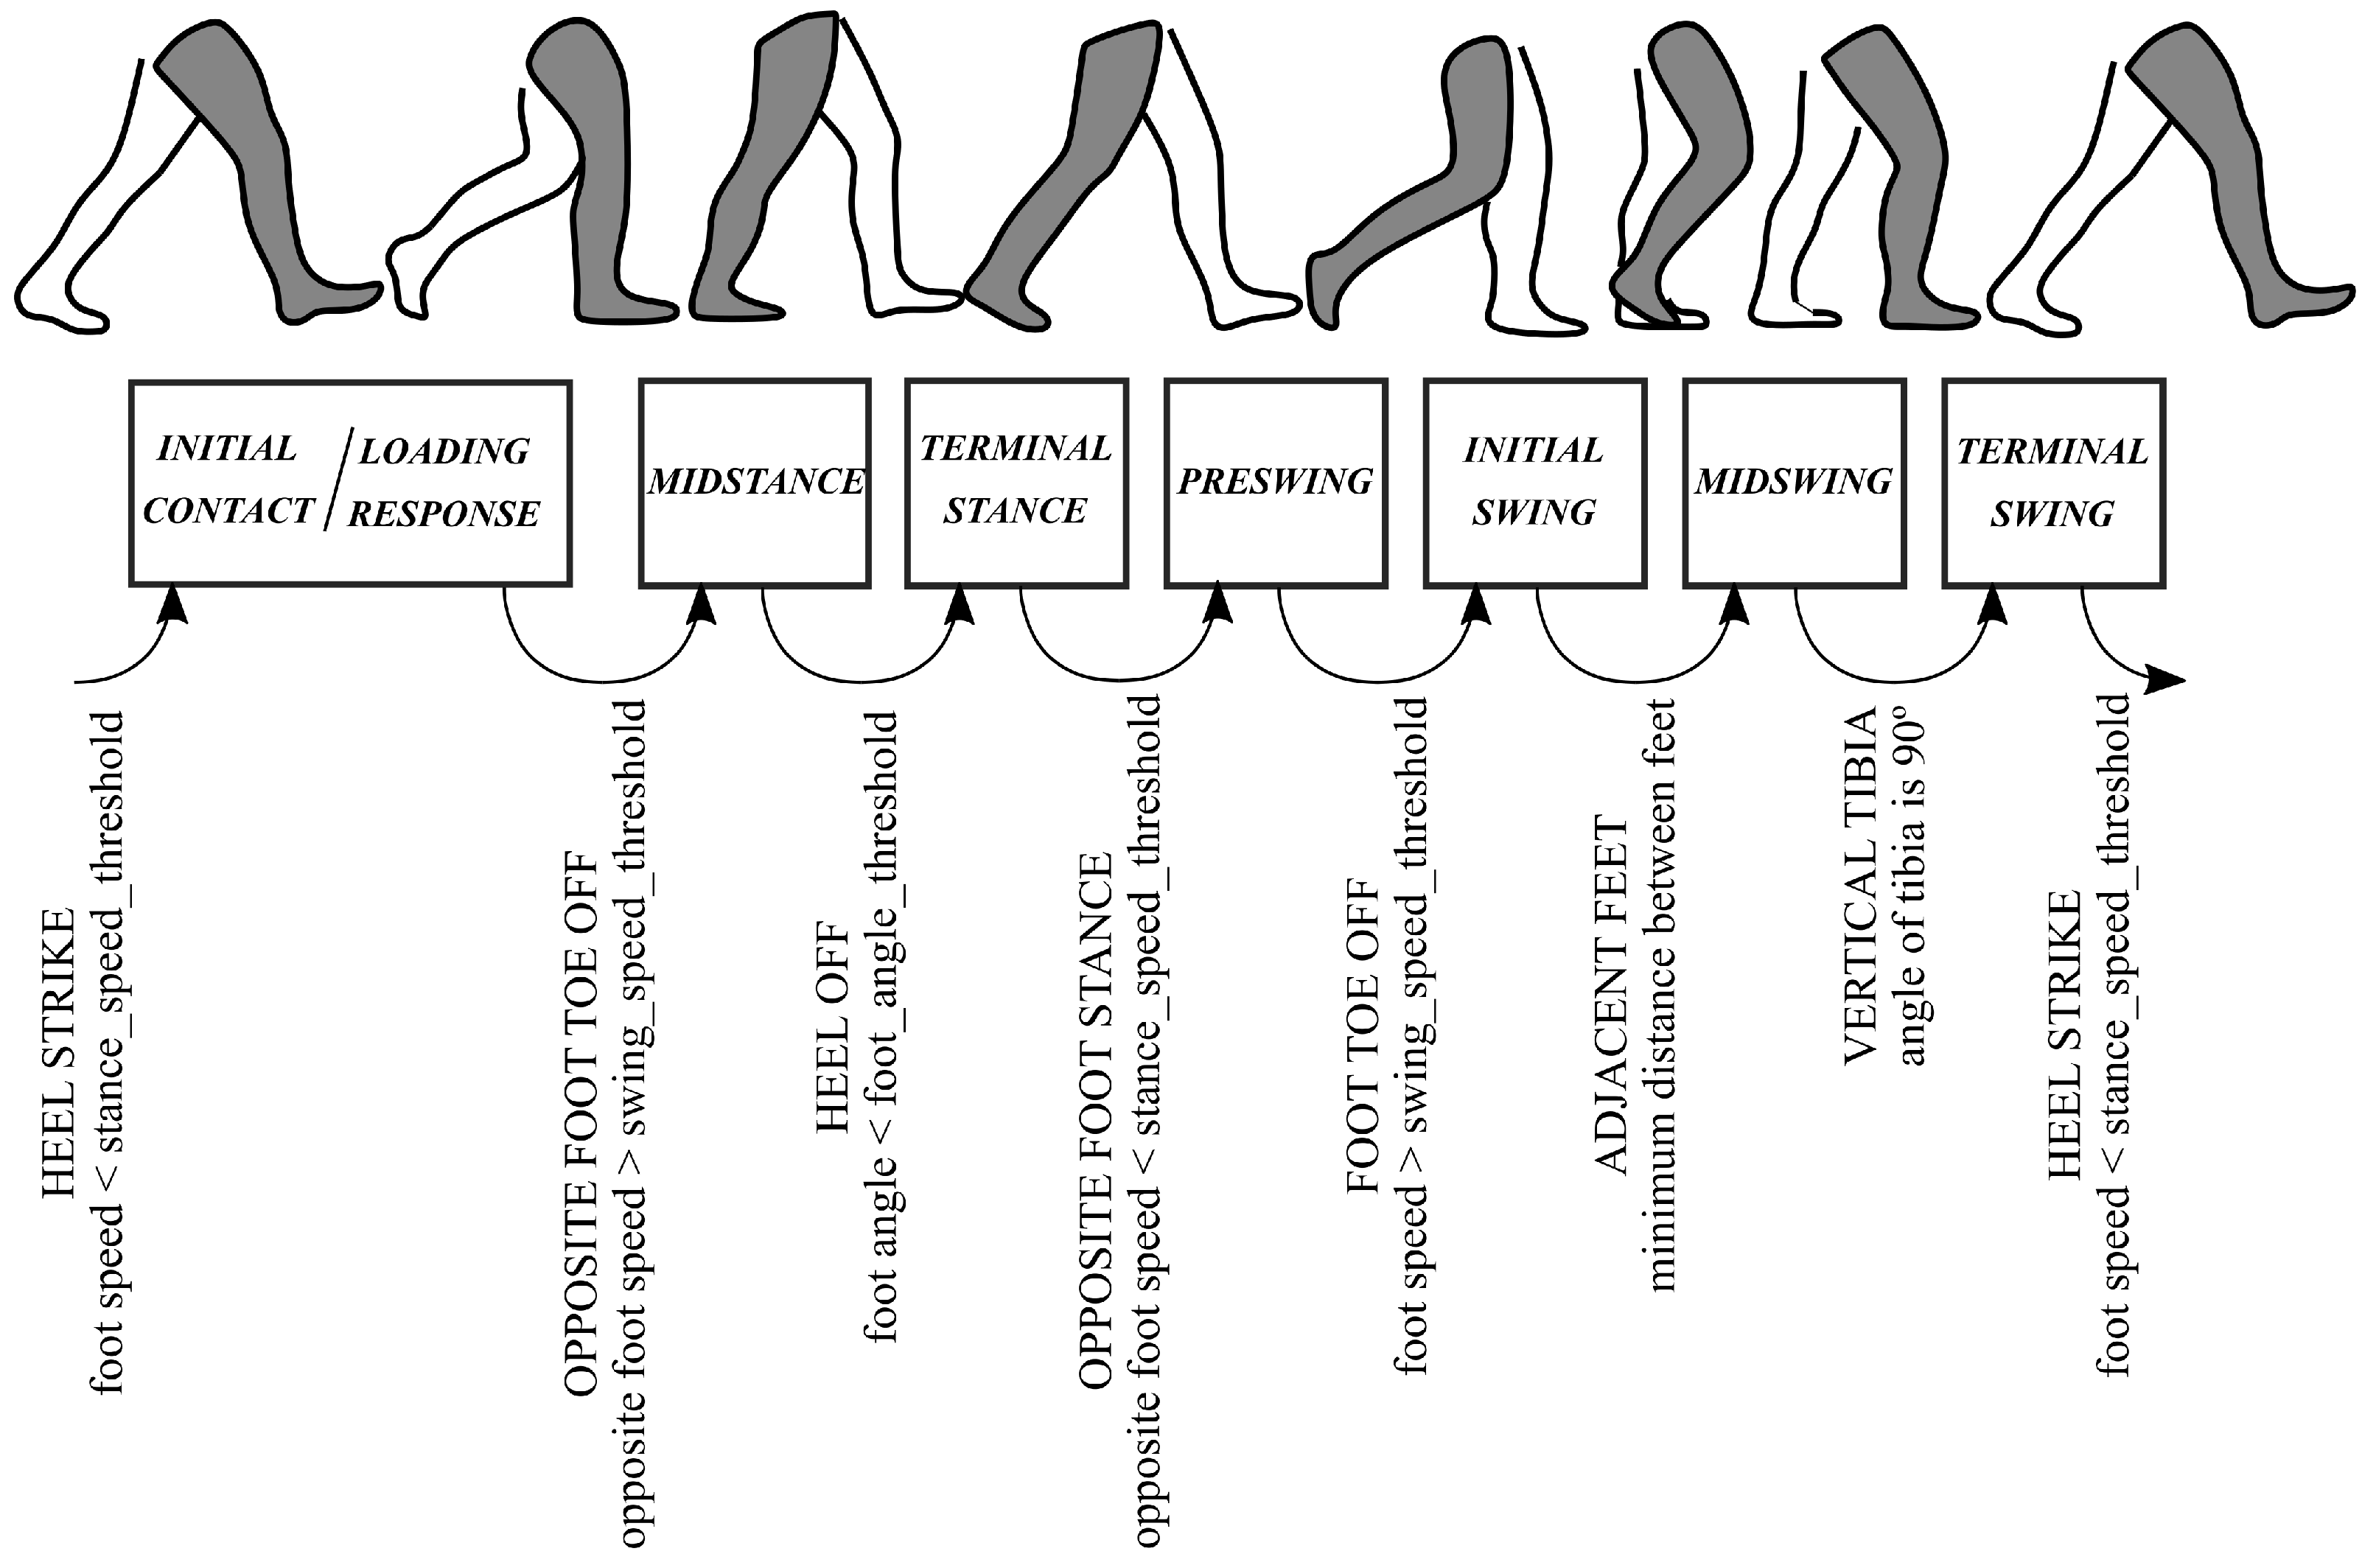
4. Methods
4.1. Participants
4.2. Protocol
4.3. Data Processing
- and are normalized to obtain their output between 0 and 1.
- The portion of both signals that precedes or is after the first and last local peak respectively, is removed.
- Since the scanning rate of the PN is higher than that of the instrumented cane, more samples are obtained by interpolation for the latter to obtain the same number for both.
- One of the resulting signals is shifted with respect the other until a maximum Pearson correlation between the two of them is obtained.
- The shift between both signals computed in the previous step is stored and added to all signals from the cane and the PN to synchronize them.
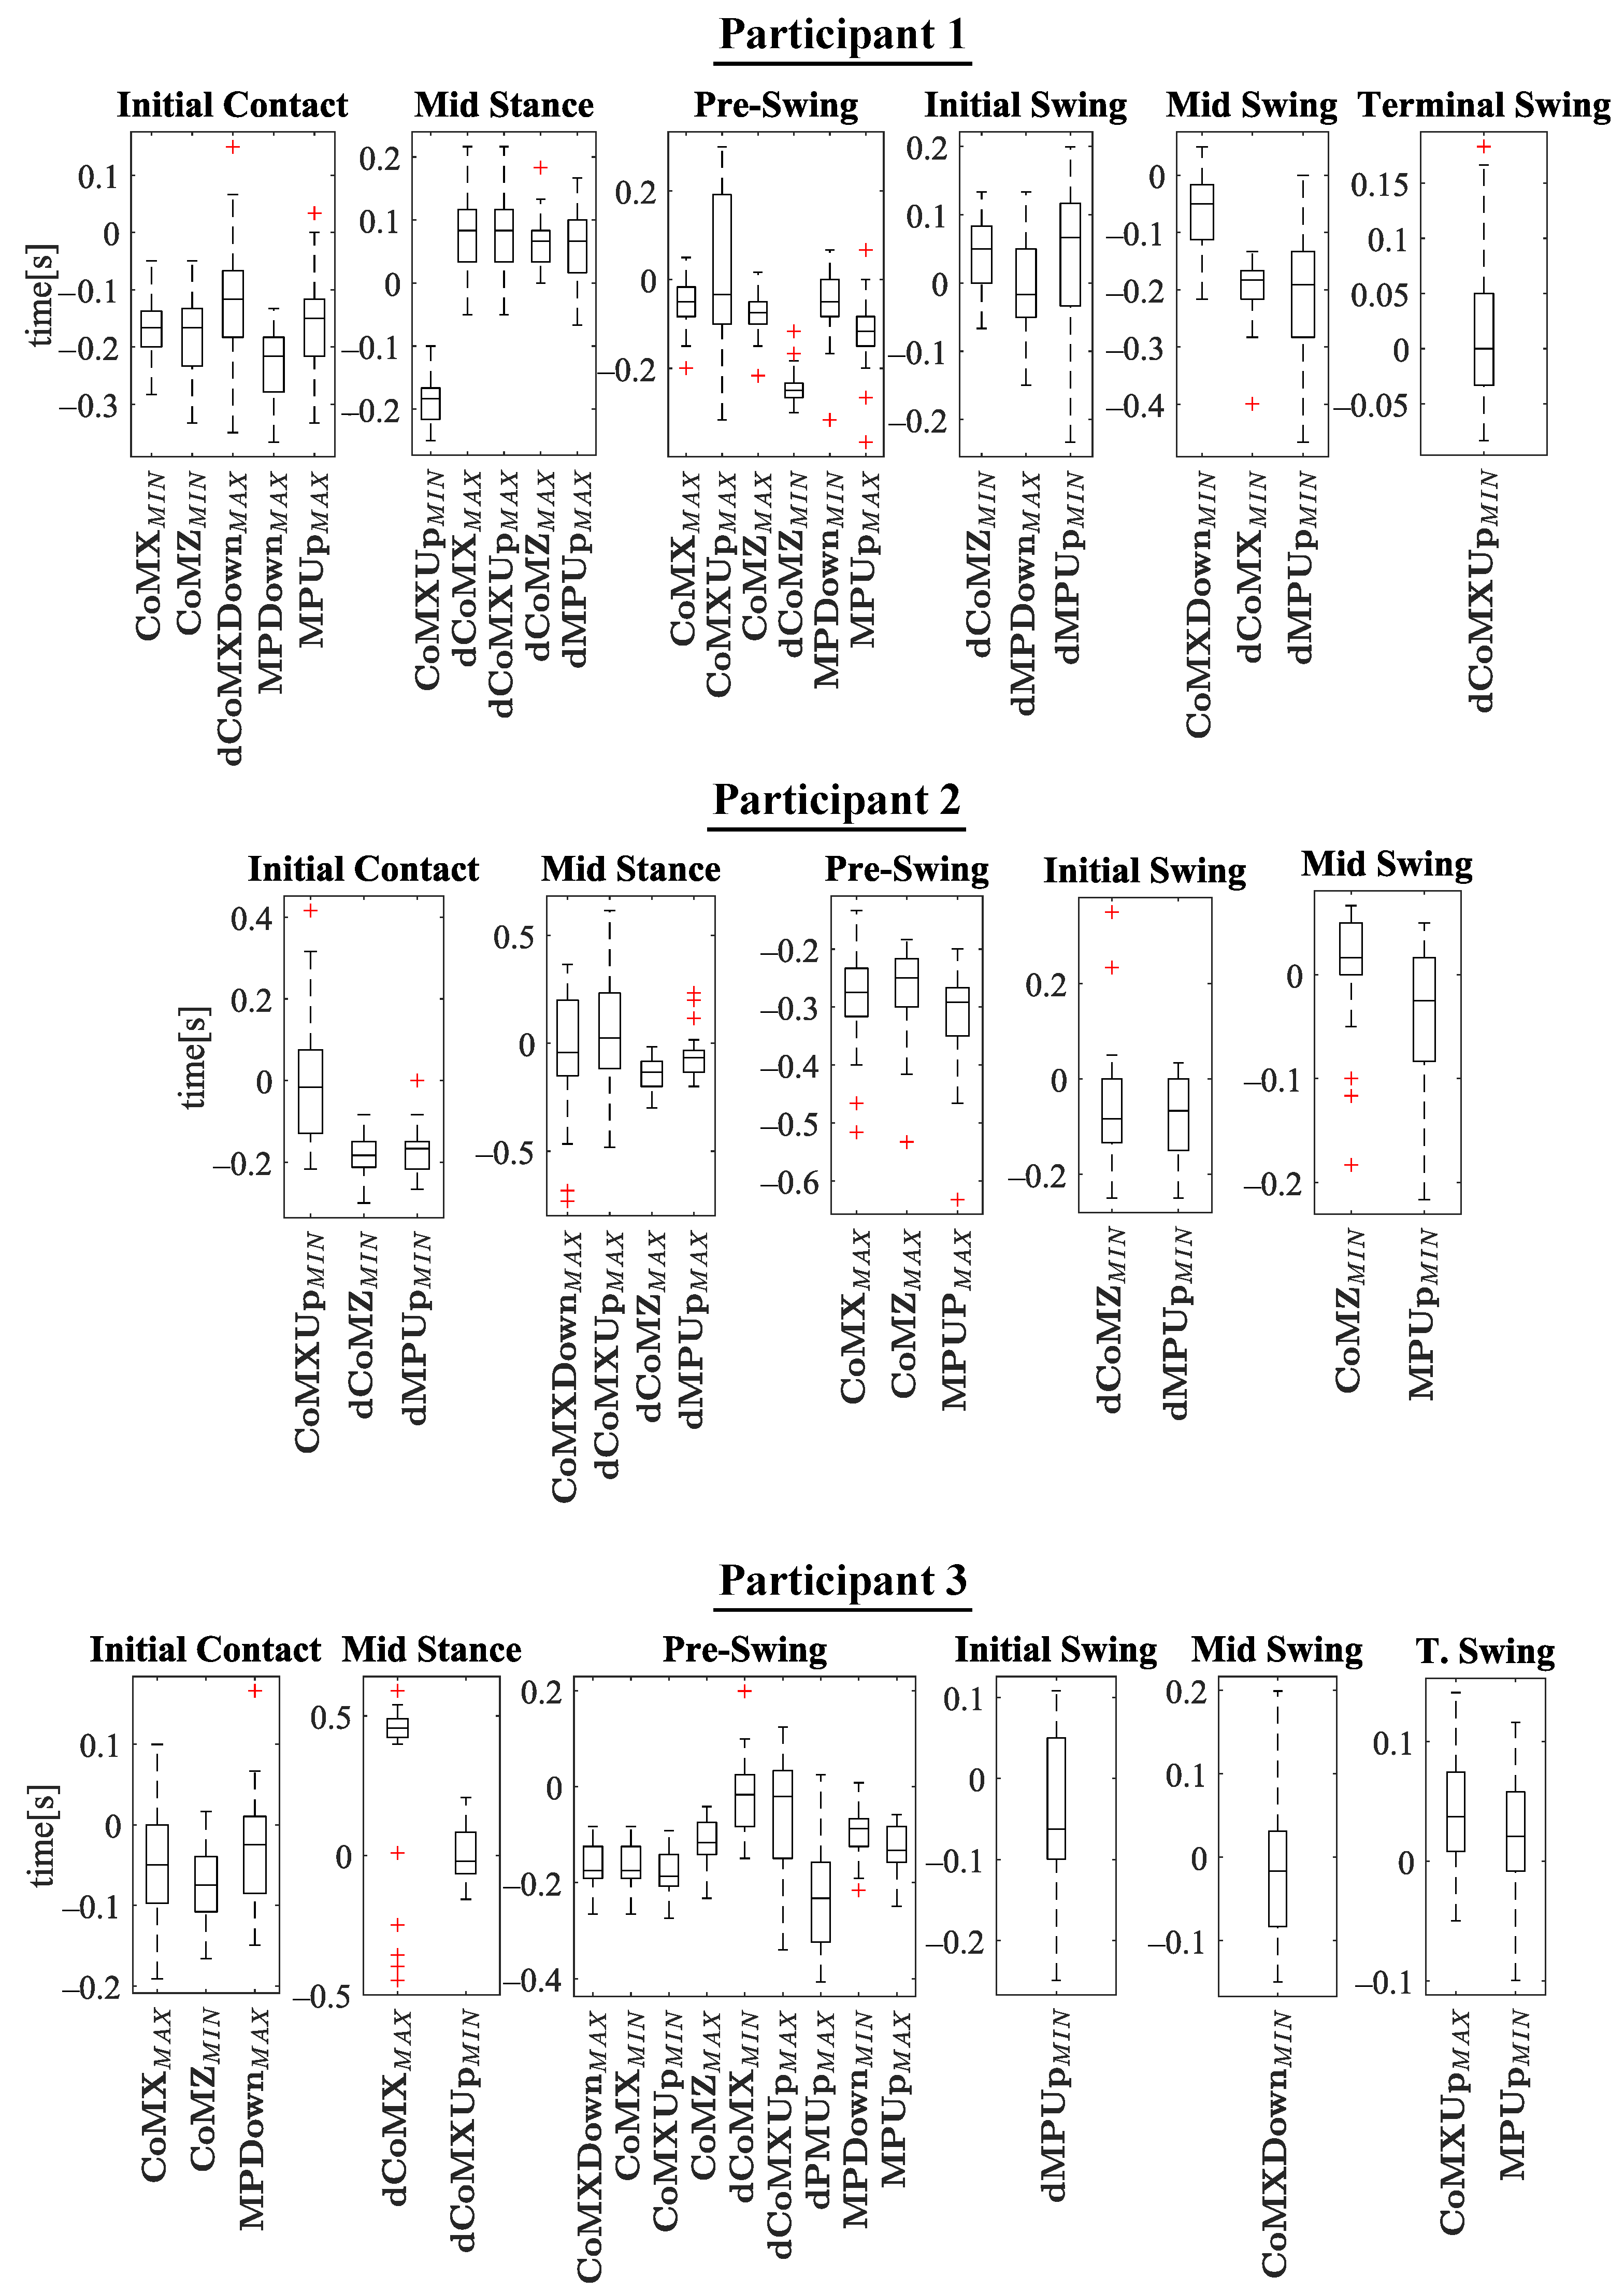
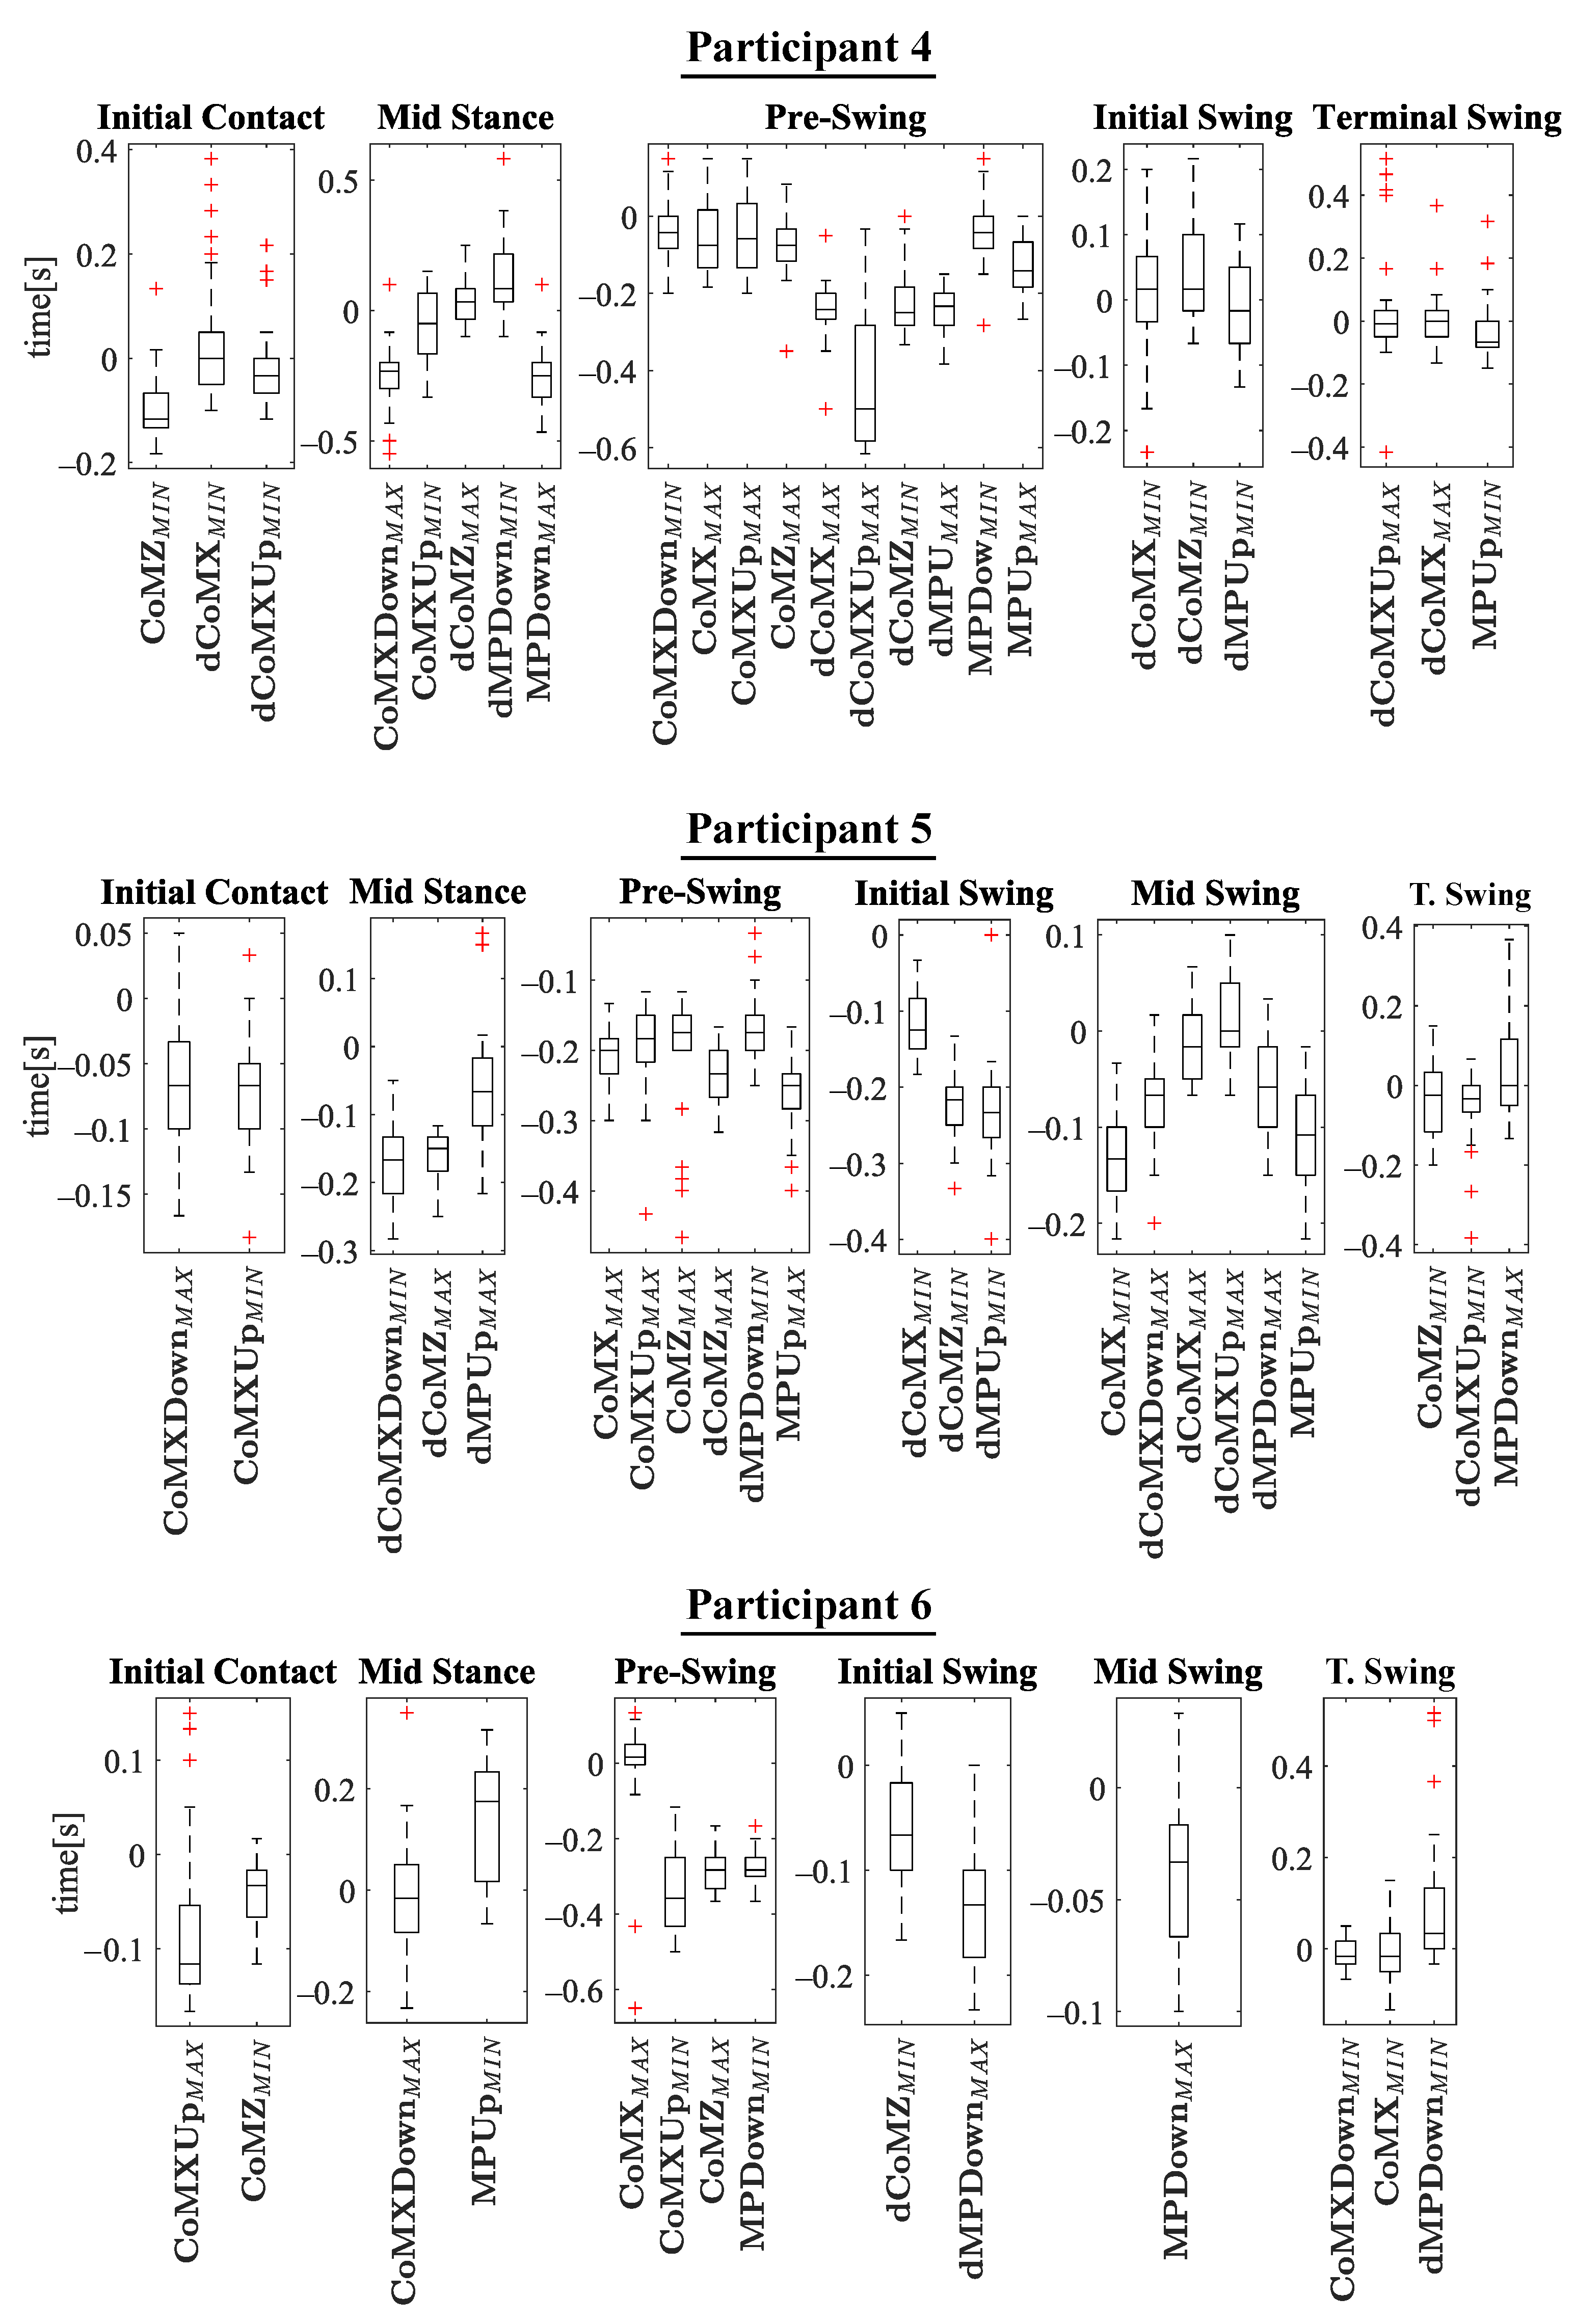
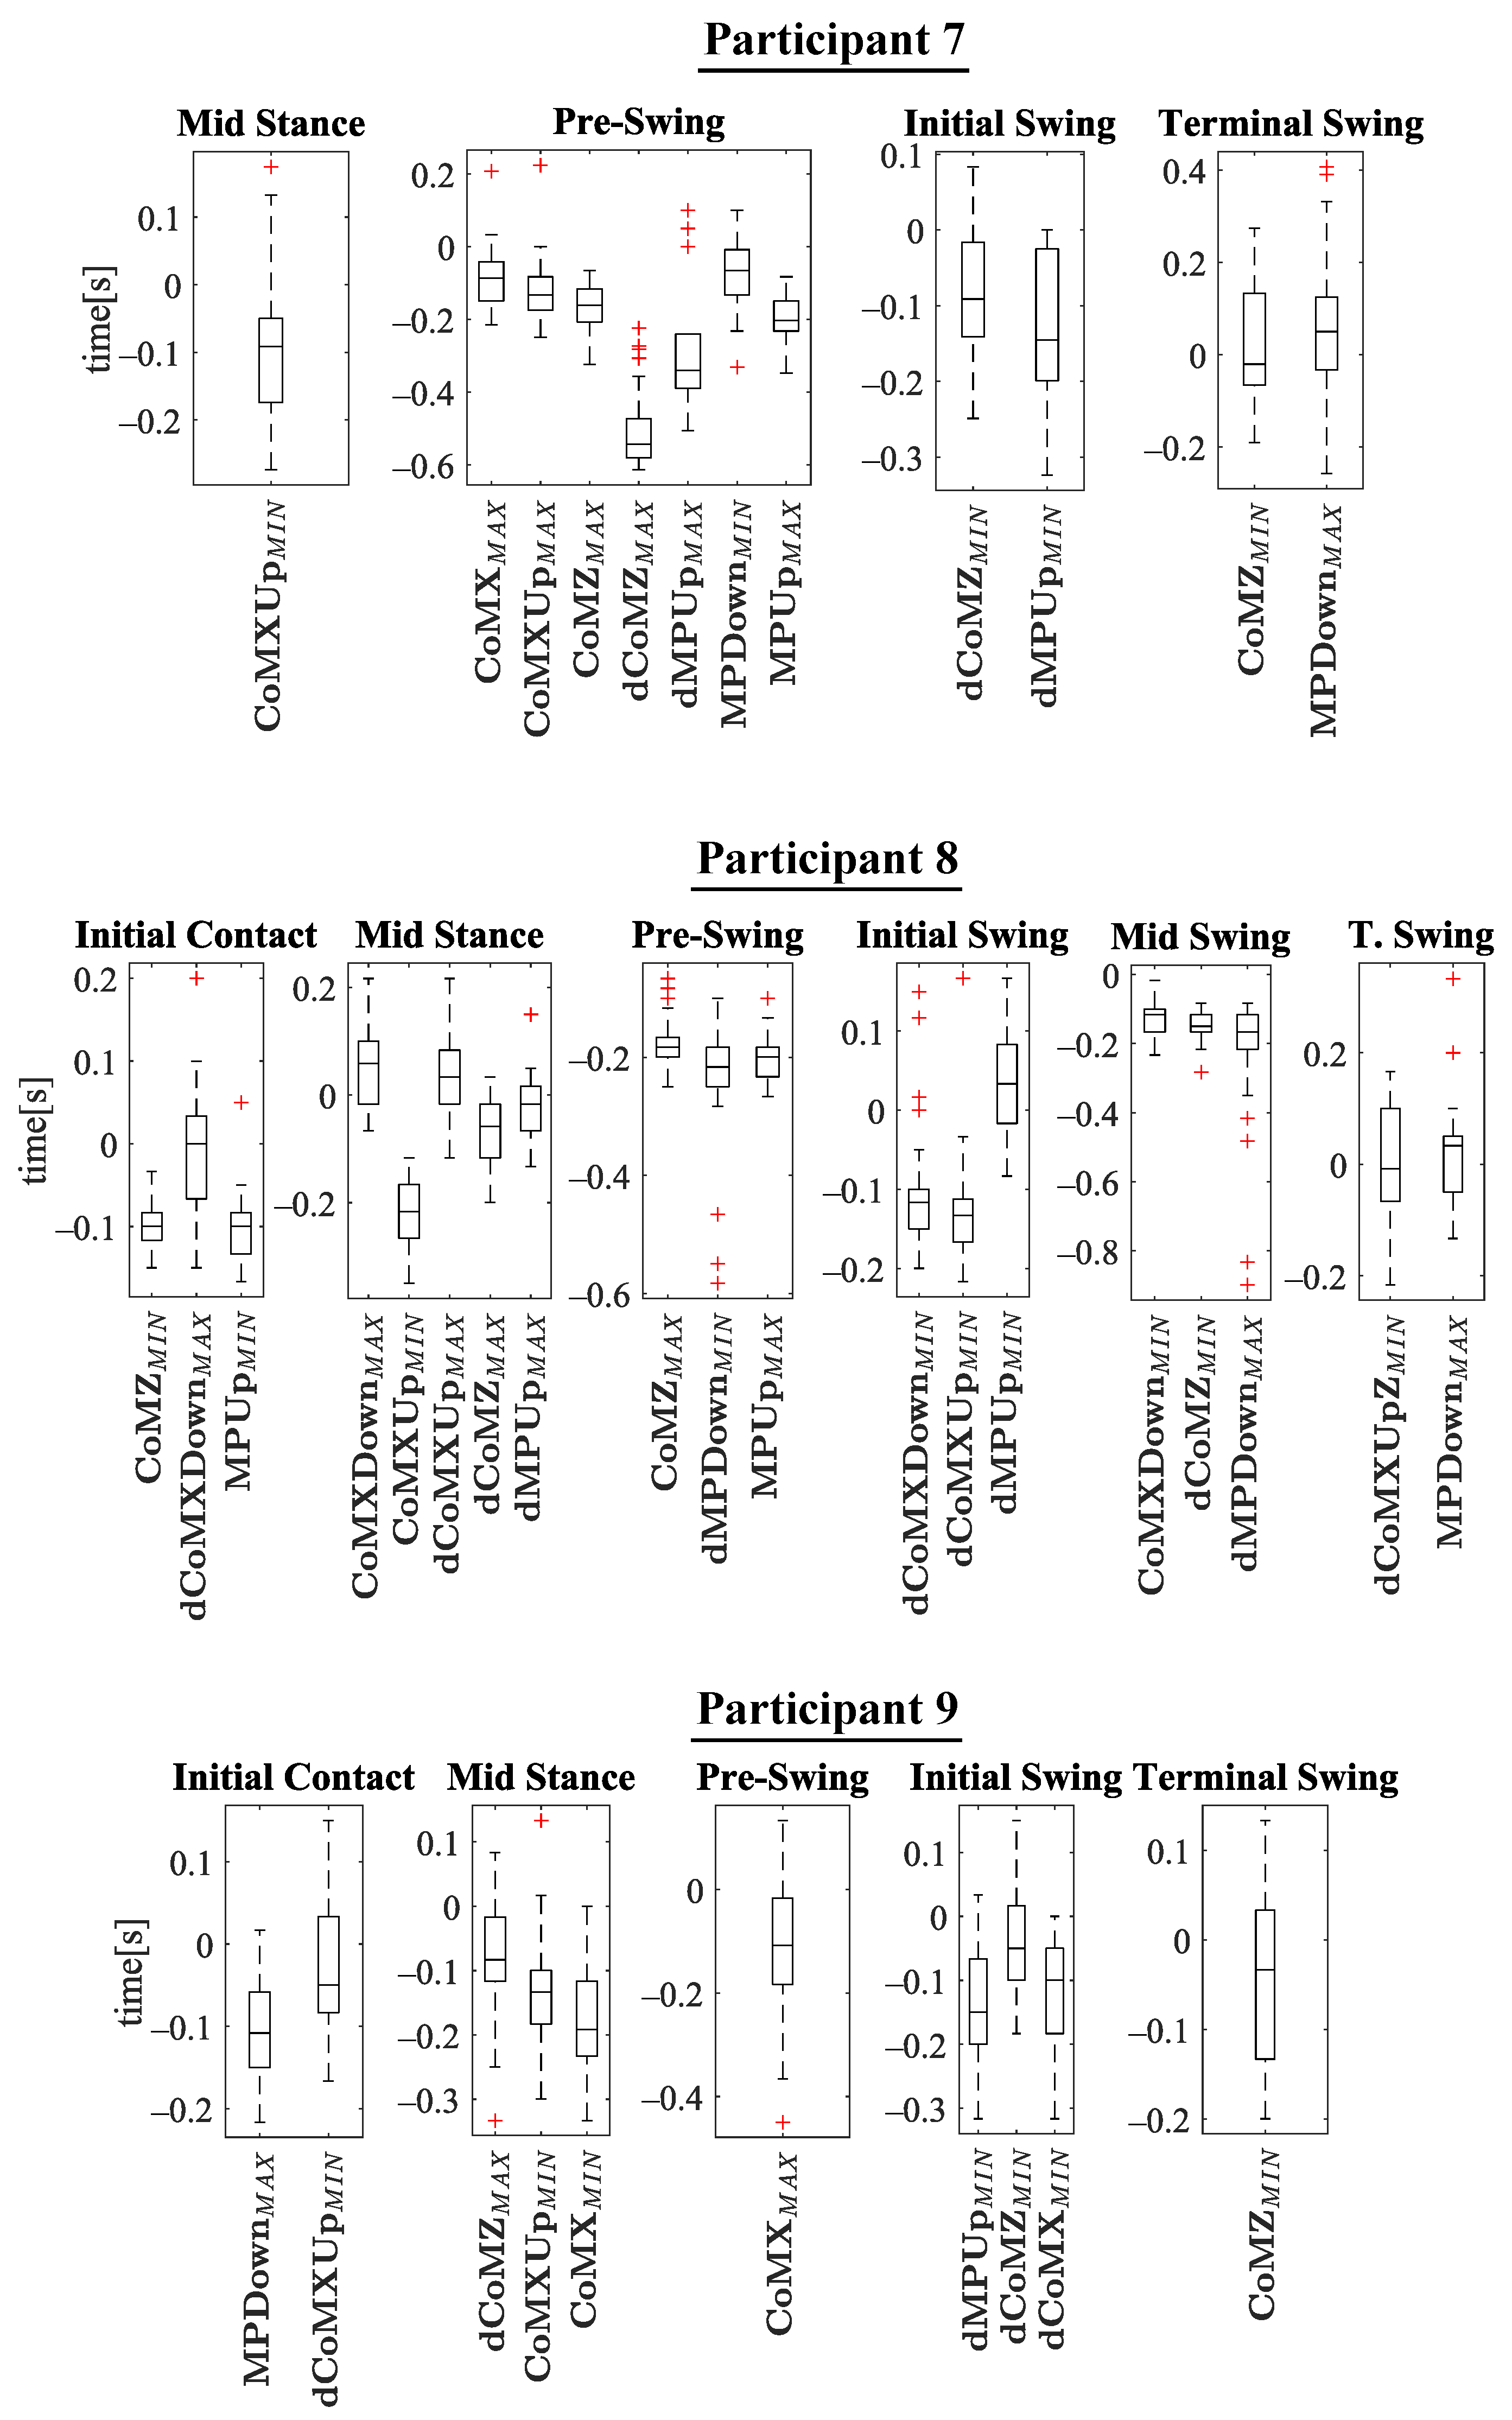
5. Results and Discussion
6. Conclusions
Supplementary Materials
Author Contributions
Funding
Institutional Review Board Statement
Informed Consent Statement
Data Availability Statement
Conflicts of Interest
Abbreviations
| FSR | Force sensor resistor |
| FES | Functional Electrical Stimulation |
| IMU or I.M.U. | Inertial Measure Unit |
| PN | Perception Neuron |
| CoM | Center of Mass |
| MP | Mean pressure |
References
- Redkar, S. A Review on Wearable Inertial Tracking based Human Gait Analysis and Control Strategies of Lower-Limb Exoskeletons. Int. Robot. Autom. J. 2017, 3. [Google Scholar] [CrossRef] [Green Version]
- Manchola, M.D.; Bernal, M.J.; Munera, M.; Cifuentes, C.A. Gait phase detection for lower-limb exoskeletons using foot motion data from a single inertial measurement unit in hemiparetic individuals. Sensors 2019, 19, 2988. [Google Scholar] [CrossRef] [Green Version]
- Prasanth, H.; Caban, M.; Keller, U.; Courtine, G.; Ijspeert, A.; Vallery, H.; von Zitzewitz, J. Wearable sensor-based real-time gait detection: A systematic review. Sensors 2021, 21, 2727. [Google Scholar] [CrossRef] [PubMed]
- Gill, S.; Seth, N.; Scheme, E. A multi-sensor matched filter approach to robust segmentation of assisted gait. Sensors 2018, 18, 2970. [Google Scholar] [CrossRef] [PubMed] [Green Version]
- Rueterbories, J.; Spaich, E.G.; Larsen, B.; Andersen, O.K. Methods for gait event detection and analysis in ambulatory systems. Med. Eng. Phys. 2010, 32, 545–552. [Google Scholar] [CrossRef] [PubMed]
- Wade, J.; Beccani, M.; Myszka, A.; Bekele, E.; Valdastri, P.; Flemming, P.; De Riesthal, M.; Withrow, T.; Sarkar, N. Design and implementation of an instrumented cane for gait recognition. IEEE Int. Conf. Robot. Autom. 2015, 2015, 5904–5909. [Google Scholar] [CrossRef] [Green Version]
- Culmer, P.R.; Brooks, P.C.; Strauss, D.N.; Ross, D.H.; Levesley, M.C.; Oconnor, R.J.; Bhakta, B.B. An instrumented walking aid to assess and retrain gait. IEEE/ASME Trans. Mechatron. 2014, 19, 141–148. [Google Scholar] [CrossRef]
- Sprint, G.; Cook, D.J.; Weeks, D.L. Quantitative assessment of lower limb and cane movement with wearable inertial sensors. In Proceedings of the 3rd IEEE EMBS International Conference on Biomedical and Health Informatics, BHI 2016, Chicago, IL, USA, 19–22 May 2016; pp. 418–421. [Google Scholar] [CrossRef]
- Ballesteros, J.; Tudela, A.; Caro-Romero, J.R.; Urdiales, C. Weight-bearing estimation for cane users by using onboard sensors. Sensors 2019, 19, 509. [Google Scholar] [CrossRef] [PubMed] [Green Version]
- Gill, S.; Seth, N.; Scheme, E. A multi-sensor cane can detect changes in gait caused by simulated gait abnormalities and walking terrains. Sensors 2020, 20, 631. [Google Scholar] [CrossRef] [PubMed] [Green Version]
- Wade, J.W.; Boyles, R.; Flemming, P.; Sarkar, A.; De Riesthal, M.; Withrow, T.J.; Sarkar, N. Feasibility of Automated Mobility Assessment of Older Adults via an Instrumented Cane. IEEE J. Biomed. Health Inform. 2019, 23, 1631–1638. [Google Scholar] [CrossRef]
- Taborri, J.; Palermo, E.; Rossi, S.; Cappa, P. Gait partitioning methods: A systematic review. Sensors 2016, 16, 66. [Google Scholar] [CrossRef] [PubMed] [Green Version]
- Caro-Romero, J.R.; Ballesteros, J.; Garcia-Lagos, F.; Urdiales, C.; Sandoval, F. A Neural Network for Stance Phase Detection in Smart Cane Users. In Proceedings of the International Work-Conference on Artificial Neural Networks, Gran Canaria, Spain, 12–14 June 2019; Springer: Cham, Switzerland, 2019; Volume 11506, pp. 310–321. [Google Scholar] [CrossRef] [Green Version]
- Fernandez, I.G.; Ahmad, S.A.; Wada, C. Inertial sensor-based instrumented cane for real-time walking cane kinematics estimation. Sensors 2020, 20, 4675. [Google Scholar] [CrossRef] [PubMed]
- Gambon, T.M.; Schmiedeler, J.P.; Wensing, P.M. User Intent Identification in a Lower-Extremity Exoskeleton via the Mahalanobis Distance. In Proceedings of the IEEE RAS and EMBS International Conference on Biomedical Robotics and Biomechatronics, New York, NY, USA, 29 November–1 December 2020; pp. 1115–1121. [Google Scholar] [CrossRef]
- Grimmer, M.; Schmidt, K.; Duarte, J.E.; Neuner, L.; Koginov, G.; Riener, R. Stance and swing detection based on the angular velocity of lower limb segments during walking. Front. Neurorobotics 2019, 13, 1–15. [Google Scholar] [CrossRef] [PubMed] [Green Version]
- Goher, K.M.; Fadlallah, S.O. 11—Assistive devices for elderly mobility and rehabilitation: Review and reflection. In Assistive Technology for the Elderly; Suryadevara, N.K., Mukhopadhyay, S.C., Eds.; Academic Press: Cambridge, MA, USA, 2020; pp. 305–341. [Google Scholar] [CrossRef]
- Awad, L.N.; Kudzia, P.; Revi, D.A.; Ellis, T.D.; Walsh, C.J. Walking Faster and Farther With a Soft Robotic Exosuit: Implications for Post-Stroke Gait Assistance and Rehabilitation. IEEE Open J. Eng. Med. Biol. 2020, 1, 108–115. [Google Scholar] [CrossRef] [PubMed]
- Bulea, T.C.; Chen, J.; Damiano, D.L. Exoskeleton Assistance Improves Crouch during Overground Walking with Forearm Crutches: A Case Study. In Proceedings of the IEEE RAS and EMBS International Conference on Biomedical Robotics and Biomechatronics, New York, NY, USA, 29 November–1 December 2020; pp. 679–684. [Google Scholar] [CrossRef]
- Li, M.; Aoyama, T.; Hasegawa, Y. Gait modification for improving walking stability of exoskeleton assisted paraplegic patient. ROBOMECH J. 2020, 7, 21. [Google Scholar] [CrossRef]
- Hassan, M.; Kadone, H.; Suzuki, K.; Sankai, Y. Wearable gait measurement system with an instrumented cane for exoskeleton control. Sensors 2014, 14, 1705–1722. [Google Scholar] [CrossRef] [Green Version]
- Huang, R.; Pengl, Z.; Cheng, H.; Hu, J.; Qiu, J.; Zou, C.; Chen, Q. Learning-based Walking Assistance Control Strategy for a Lower Limb Exoskeleton with Hemiplegia Patients. In Proceedings of the IEEE International Conference on Intelligent Robots and Systems, Madrid, Spain, 1–5 October 2018; pp. 2280–2285. [Google Scholar] [CrossRef]
- Hassan, M.; Kadone, H.; Ueno, T.; Hada, Y.; Sankai, Y.; Suzuki, K. Feasibility of synergy-based exoskeleton robot control in hemiplegia. IEEE Trans. Neural Syst. Rehabil. Eng. 2018, 26, 1233–1242. [Google Scholar] [CrossRef] [PubMed]
- Jang, E.; Cho, Y.; Chi, S.; Lee, J.; Kang, S.S.; Chun, B. Recognition of walking intention using multiple bio/kinesthetic sensors for lower limb exoskeletons. In Proceedings of the ICCAS 2010, Gyeonggido, Korea, 27–30 October 2010; pp. 1802–1805. [Google Scholar] [CrossRef]
- Trujillo-León, A.; Ady, R.; Vidal-Verdú, F.; Bachta, W. A tactile handle for cane use monitoring. In Proceedings of the 2015 37th Annual International Conference of the IEEE Engineering in Medicine and Biology Society (EMBC), Milano, Italy, 25–29 August 2015; pp. 3586–3589. [Google Scholar] [CrossRef]
- Smith, B.T.; Coiro, D.J.; Finson, R.; Betz, R.R.; McCarthy, J. Evaluation of force-sensing resistors for gait event detection to trigger electrical stimulation to improve walking in the child with cerebral palsy. IEEE Trans. Neural Syst. Rehabil. Eng. 2002, 10, 22–29. [Google Scholar] [CrossRef] [PubMed]
- De Guzmán-Manzano, A.; Trujillo-León, A.; Lora-Rivera, R.; Vidal-Verdú, F. Tactile Sensor on Cane Handle for Gait Phase Analysis. In Proceedings of the 2019 IEEE SENSORS, Montreal, QC, Canada, 27–30 October 2019; pp. 1–4. [Google Scholar] [CrossRef]
- Schepers, H.M.; Koopman, H.F.; Veltink, P.H. Ambulatory assessment of ankle and foot dynamics. IEEE Trans. Biomed. Eng. 2007, 54, 895–902. [Google Scholar] [CrossRef] [PubMed] [Green Version]
- Vu, H.T.T.; Dong, D.; Cao, H.L.; Verstraten, T.; Lefeber, D.; Vanderborght, B.; Geeroms, J. A review of gait phase detection algorithms for lower limb prostheses. Sensors 2020, 20, 3972. [Google Scholar] [CrossRef] [PubMed]
- Behboodi, A.; Zahradka, N.; Wright, H.; Alesi, J.; Lee, S.C. Real-time detection of seven phases of gait in children with cerebral palsy using two gyroscopes. Sensors 2019, 19, 2517. [Google Scholar] [CrossRef] [PubMed] [Green Version]
- Schmidt, K.; Duarte, J.E.; Grimmer, M.; Sancho-Puchades, A.; Wei, H.; Easthope, C.S.; Riener, R. The Myosuit: Bi-articular Anti-gravity Exosuit That Reduces Hip Extensor Activity in Sitting Transfers. Front. Neurorobotics 2017, 11, 57. [Google Scholar] [CrossRef] [PubMed] [Green Version]
- Cavanagh, P.R.; Komi, P.V. Electromechanical delay in human skeletal muscle under concentric and eccentric contractions. Eur. J. Appl. Physiol. Occup. Physiol. 1979, 42, 159–163. [Google Scholar] [CrossRef] [PubMed]
- Pappas, I.P.; Popovic, M.R.; Keller, T.; Dietz, V.; Morari, M. A reliable gait phase detection system. IEEE Trans. Neural Syst. Rehabil. Eng. 2001, 9, 113–125. [Google Scholar] [CrossRef] [PubMed]
- Zahradka, N.; Behboodi, A.; Wright, H.; Bodt, B.; Lee, S. Evaluation of Gait Phase Detection Delay Compensation Strategies to Control a Gyroscope-Controlled Functional Electrical Stimulation System During Walking. Sensors 2019, 19, 2471. [Google Scholar] [CrossRef] [PubMed] [Green Version]
- Kotiadis, D.; Hermens, H.J.; Veltink, P.H. Inertial Gait Phase Detection for control of a drop foot stimulator: Inertial sensing for gait phase detection. Med. Eng. Phys. 2010, 32, 287–297. [Google Scholar] [CrossRef] [PubMed]
- Glowinski, S.; Krzyzynski, T.; Bryndal, A.; Maciejewski, I. A Kinematic Model of a Humanoid Lower Limb Exoskeleton with Hydraulic Actuators. Sensors 2020, 20, 6116. [Google Scholar] [CrossRef] [PubMed]
- Müller, P.; Seel, T.; Schauer, T. Experimental Evaluation of a Novel Inertial Sensor Based Realtime Gait Phase Detection Algorithm. In Proceedings of the Technically Assisted Rehabilitation Conference, Berlin, Germany, 12–13 March 2015. [Google Scholar]


| FSR Unit | X Location [mm] | Z Location [mm] |
|---|---|---|
| 1 | −15.21 | 85.05 |
| 2 | −5.29 | 84.95 |
| 3 | 4.71 | 85.22 |
| 4 | 14.58 | 85.61 |
| 5 | 24.44 | 86.72 |
| 6 | 34.50 | 87.72 |
| 7 | 44.60 | 88.19 |
| 8 | 54.71 | 88.10 |
| 9 | 64.80 | 87.47 |
| 10 | 74.86 | 86.27 |
| 11 | −19.66 | 49.89 |
| 12 | 19.12 | 53.30 |
| 13 | 30.40 | 54.54 |
| 14 | 42.10 | 54.85 |
| 15 | 53.15 | 54.74 |
| 16 | 64.65 | 54.08 |
| Neuron Specifications | |
|---|---|
| Size | 12.5 × 13.1 × 4.3 mm |
| Dynamic Range | 360 deg |
| Accelerometer Range | ±16 g |
| Gyroscope Range | ±2000 dps |
| Resolution | 0.02 deg |
| Static Accuracy: | |
| Roll | <1 deg |
| Pitch | <1 deg |
| Yaw angle | <2 deg |
Publisher’s Note: MDPI stays neutral with regard to jurisdictional claims in published maps and institutional affiliations. |
© 2021 by the authors. Licensee MDPI, Basel, Switzerland. This article is an open access article distributed under the terms and conditions of the Creative Commons Attribution (CC BY) license (https://creativecommons.org/licenses/by/4.0/).
Share and Cite
Trujillo-León, A.; de Guzmán-Manzano, A.; Velázquez, R.; Vidal-Verdú, F. Generation of Gait Events with a FSR Based Cane Handle. Sensors 2021, 21, 5632. https://doi.org/10.3390/s21165632
Trujillo-León A, de Guzmán-Manzano A, Velázquez R, Vidal-Verdú F. Generation of Gait Events with a FSR Based Cane Handle. Sensors. 2021; 21(16):5632. https://doi.org/10.3390/s21165632
Chicago/Turabian StyleTrujillo-León, Andrés, Arturo de Guzmán-Manzano, Ramiro Velázquez, and Fernando Vidal-Verdú. 2021. "Generation of Gait Events with a FSR Based Cane Handle" Sensors 21, no. 16: 5632. https://doi.org/10.3390/s21165632