
Landmark-Assisted Compensation of User’s Body Shadowing on RSSI for Improved Indoor Localisation with Chest-Mounted Wearable Device


Abstract
:1. Introduction
- The estimation of the orientation angle between a user and an RN in real time.
- The derivation of a BSE compensation model that can mitigate the user’s body effects for every single orientation angle scenario instead of some discrete orientation angles.
- The adaptation of the orientation angle estimation and BSE mitigation methods in real-life indoor localisation applications.
- An in-depth analysis of the behaviour of XBee RSSI is performed to investigate its effect on the user’s body.
- A unique method is proposed to estimate the orientation angle between a user and the RNs.
- A new model is proposed that can compensate the user’s BSE on XBee RSSI for every possible orientation angle.
- A landmark-assisted weight calculation method is used to implement the WK-NN algorithm to improve the localisation accuracy.
- Experiments were conducted in a real indoor scenario by applying the proposed method and model for real-time application.
2. Related Works

| Research Type 1 | Wireless Technology | Measurement Approach | Sensor Placement | Angle Variations (°) | Localisation Methods | Evaluation 2 | Localisation Accuracy (m) | Ref. |
|---|---|---|---|---|---|---|---|---|
| An, Co | 2.4 GHz RF | RSSI | Handheld | 90 | Fingerprinting | Ex | 2.94 (50th percentile) | [5] |
| An, Co | WiFi | RSSI | Handheld | 45 | Fingerprinting | Ex | 1.65 (average) | [14] |
| Mo, Co | RFID | RSSI | Wrist | N/A | Monte Carlo | Ex | 1.18 | [13] |
| An, Mo, Co | WiFi | RSSI | Chest, Handheld | N/A | NLLS | Ex | N/A | [15] |
| An, Mo, Co | Zigbee | RSSI | Chest, Back | 45 | Fingerprinting | Ex | 2.5 (median) | [16] |
| An, Mo, Co | Zigbee | RSSI | Chest, Back, Wrist | 45 | Fingerprinting | Si and Ex | 2.99 (50th percentile for chest) | [17] |
| An, Mo | WiFi | RSSI | Handheld | N/A | Fingerprinting | Ex | N/A | [18] |
| An, Co | WiFi | RSSI | Handheld | 90 | Fingerprinting | Ex | 2.00 (50th percentile) | [19] |
| An, Mo, Co | BLE | RSSI | Handheld | 3 orientations | Ranging, Trilateration | Ex | 0.77 (mean) | [20] |
| An, Mo, Co | Zigbee | RSSI | Chest | 15 | Fingerprinting | Ex | 0.74 (median) | This study |
3. Analysis of User’s Body Shadowing Effect on RSSI
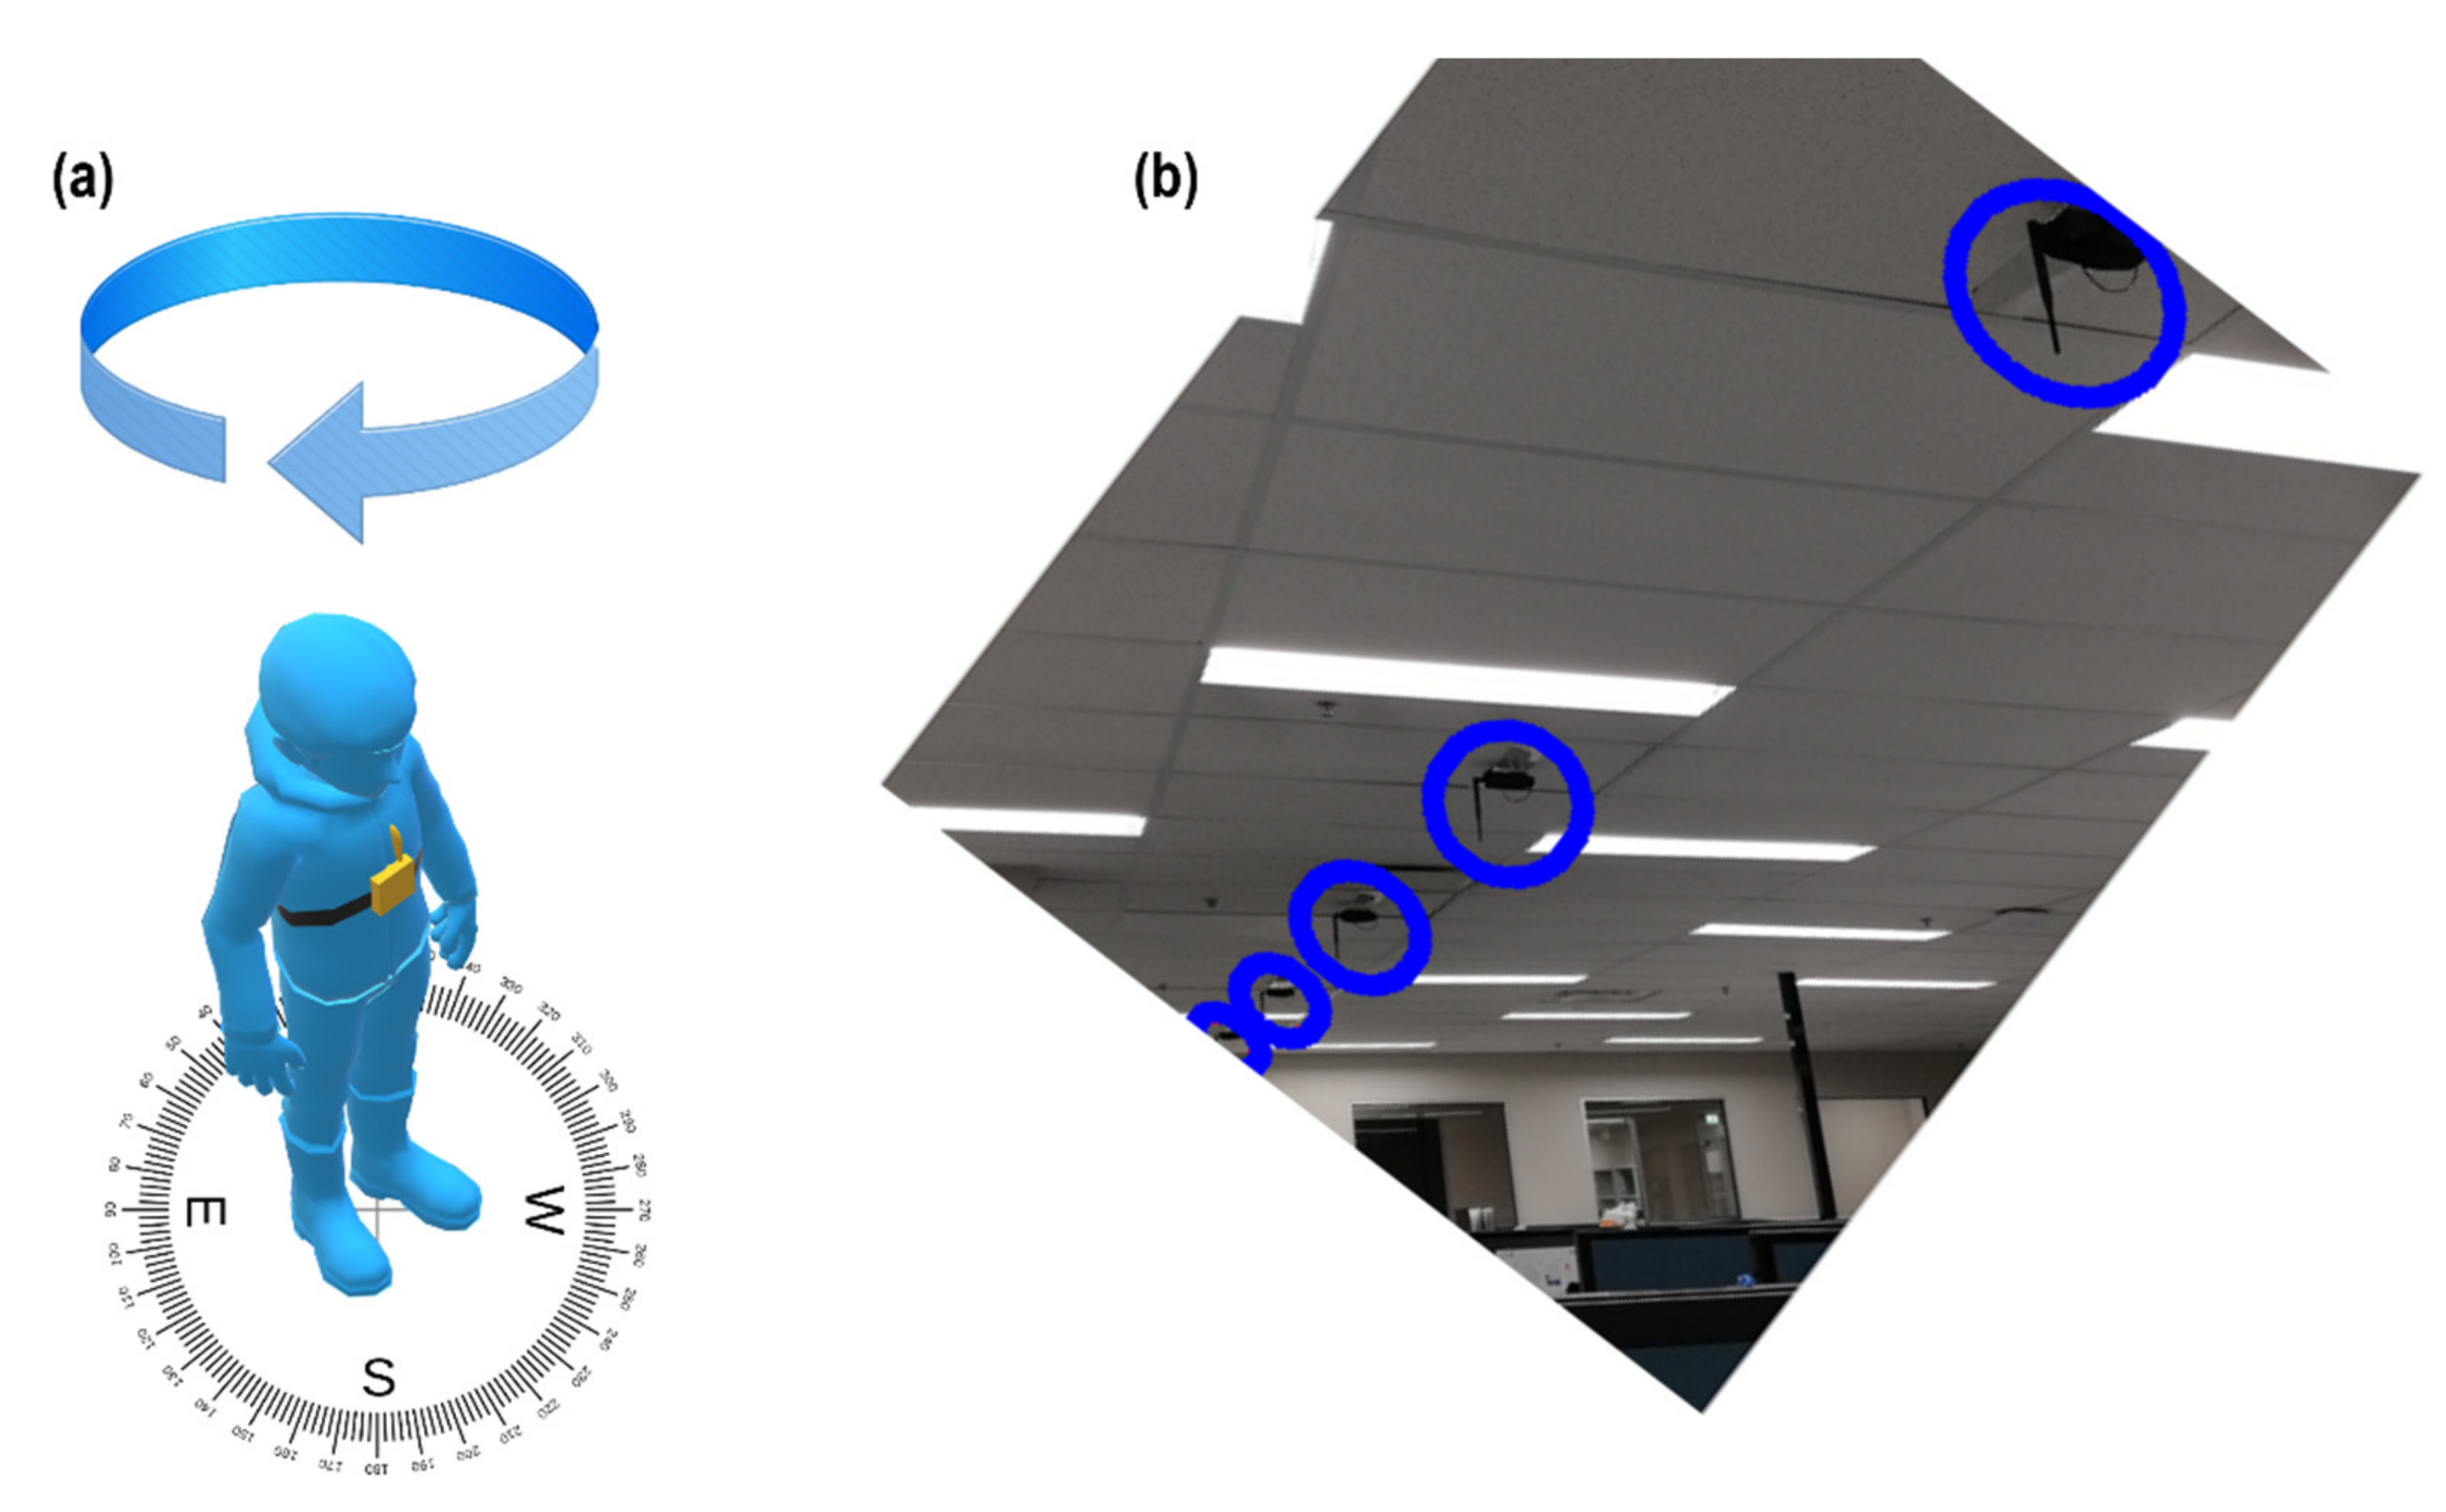
3.1. Experiments Overview
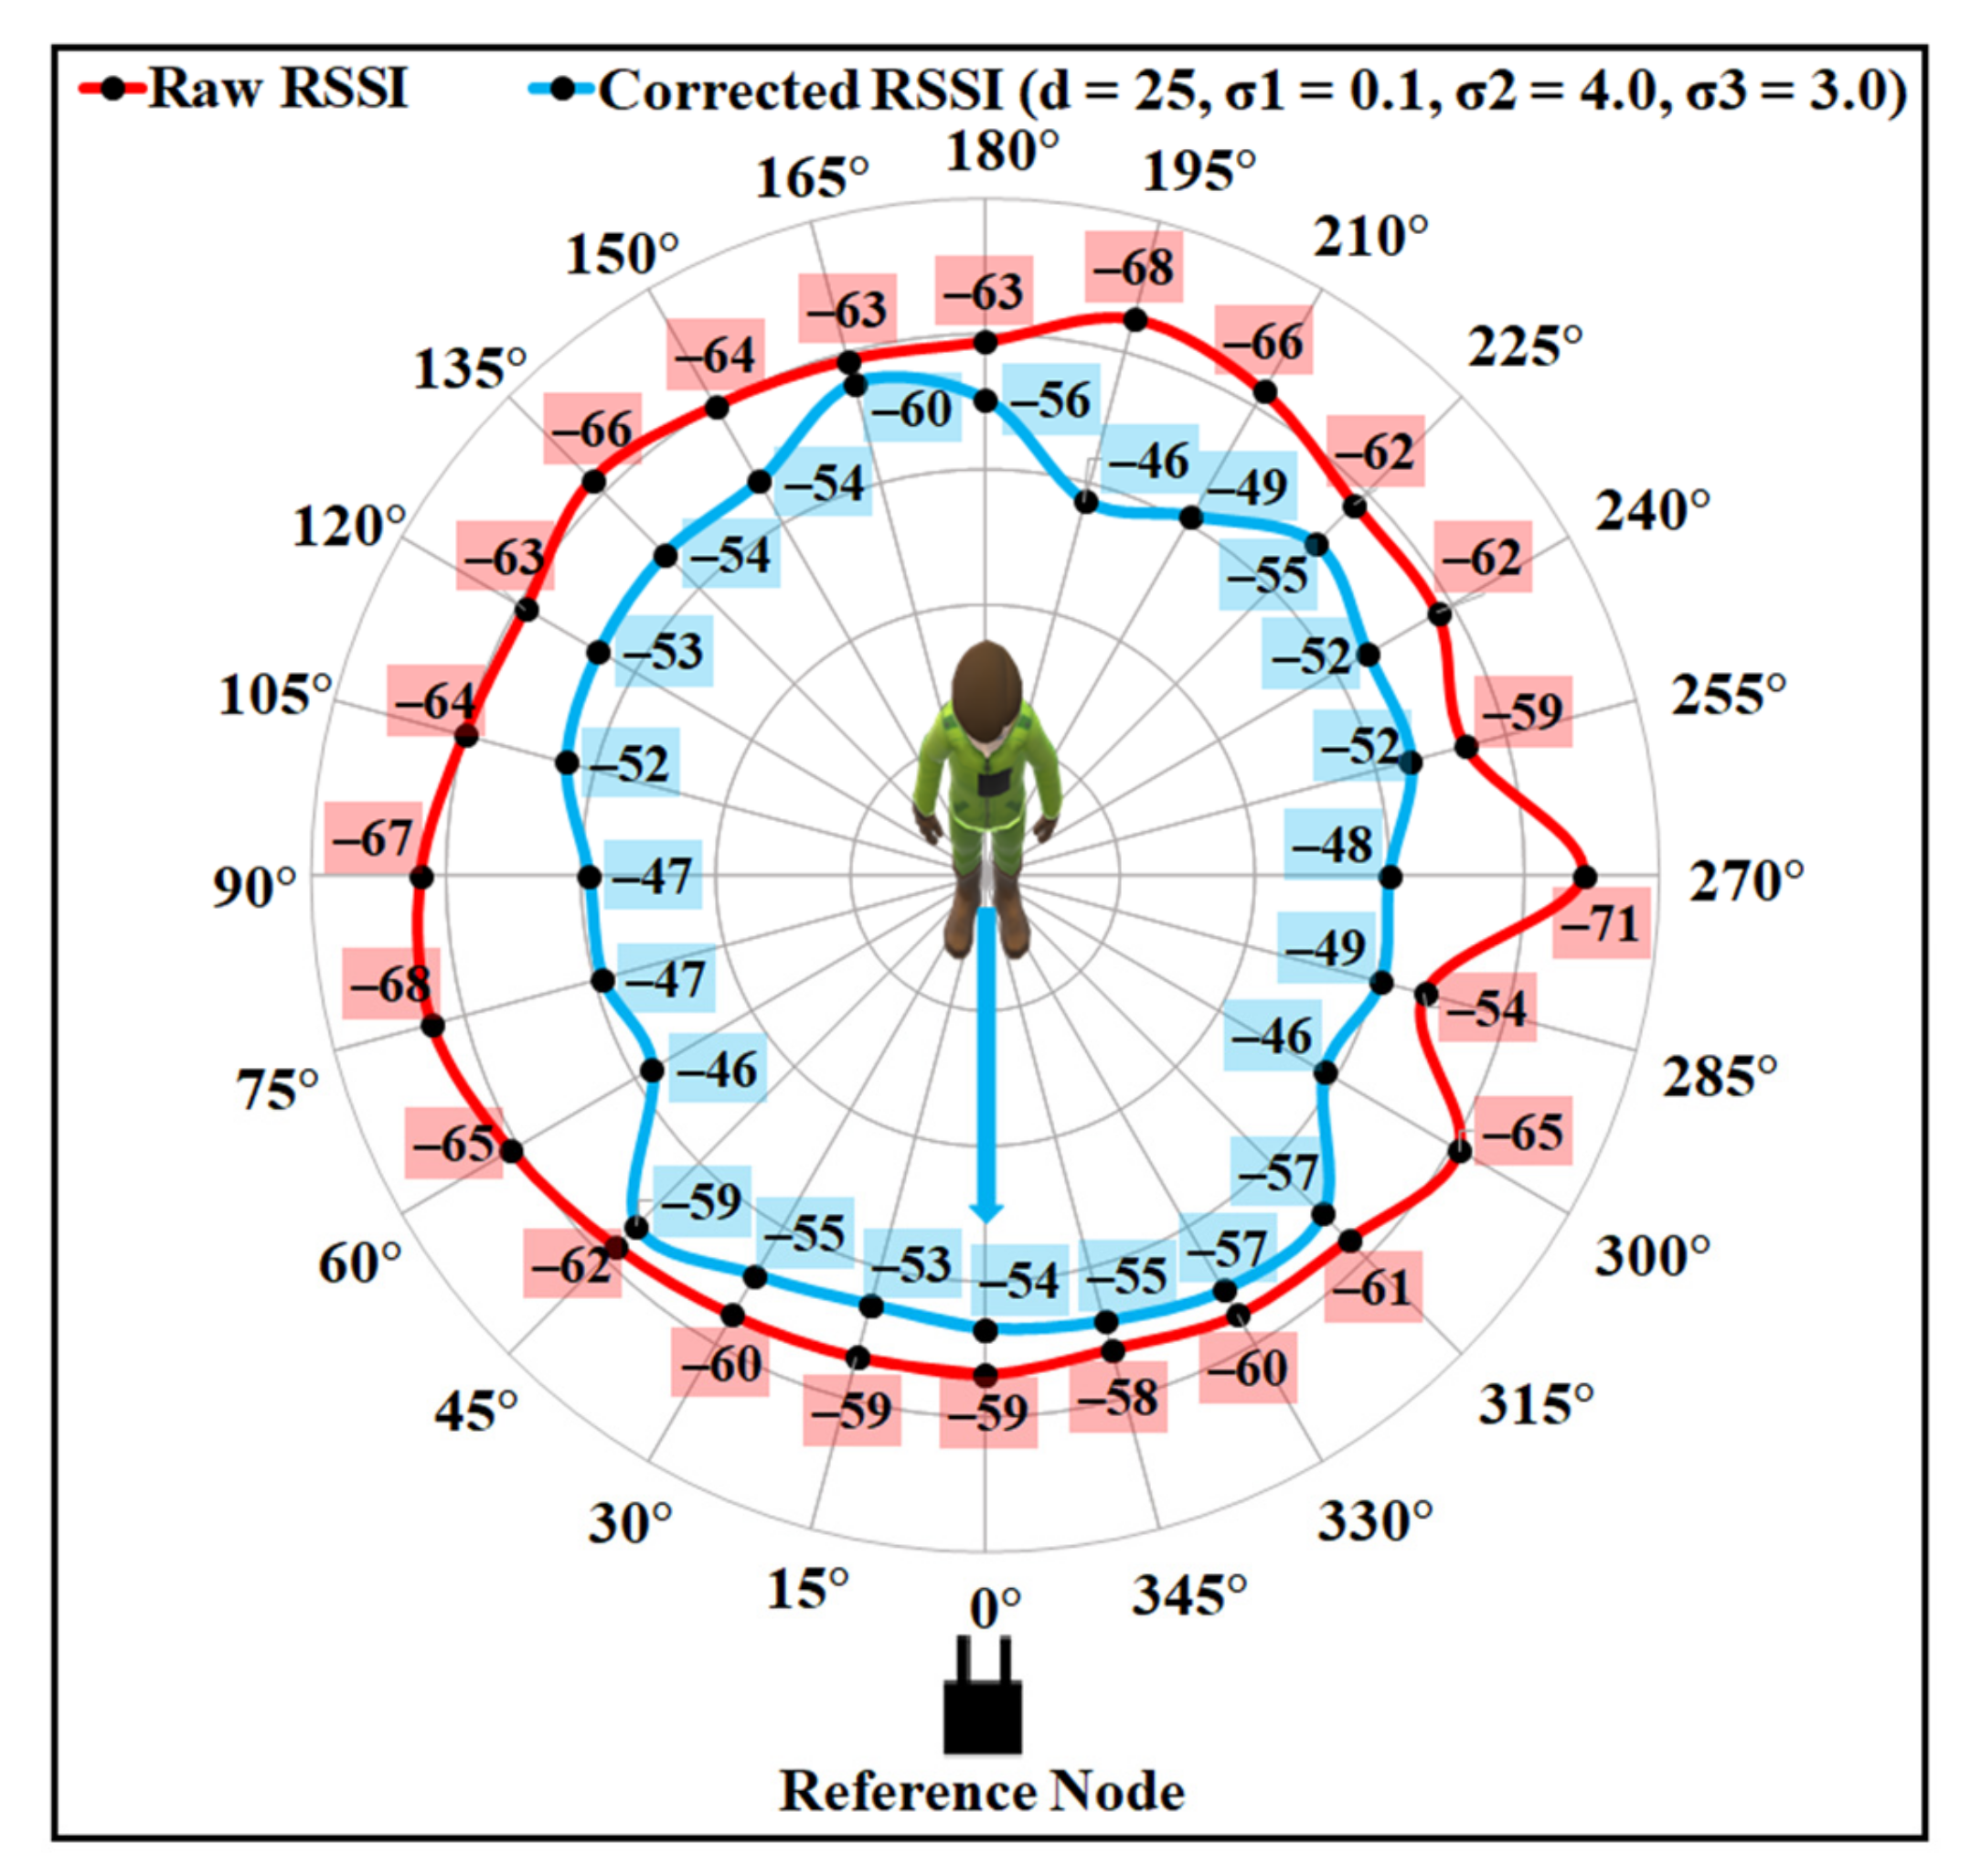
3.2. Observations
4. Overview of the Proposed System
4.1. Offline Training Phase
4.2. Online Localisation Phase
5. Landmark Identification
5.1. Landmarks and Landmark Graph
5.2. Motion Mode Detection
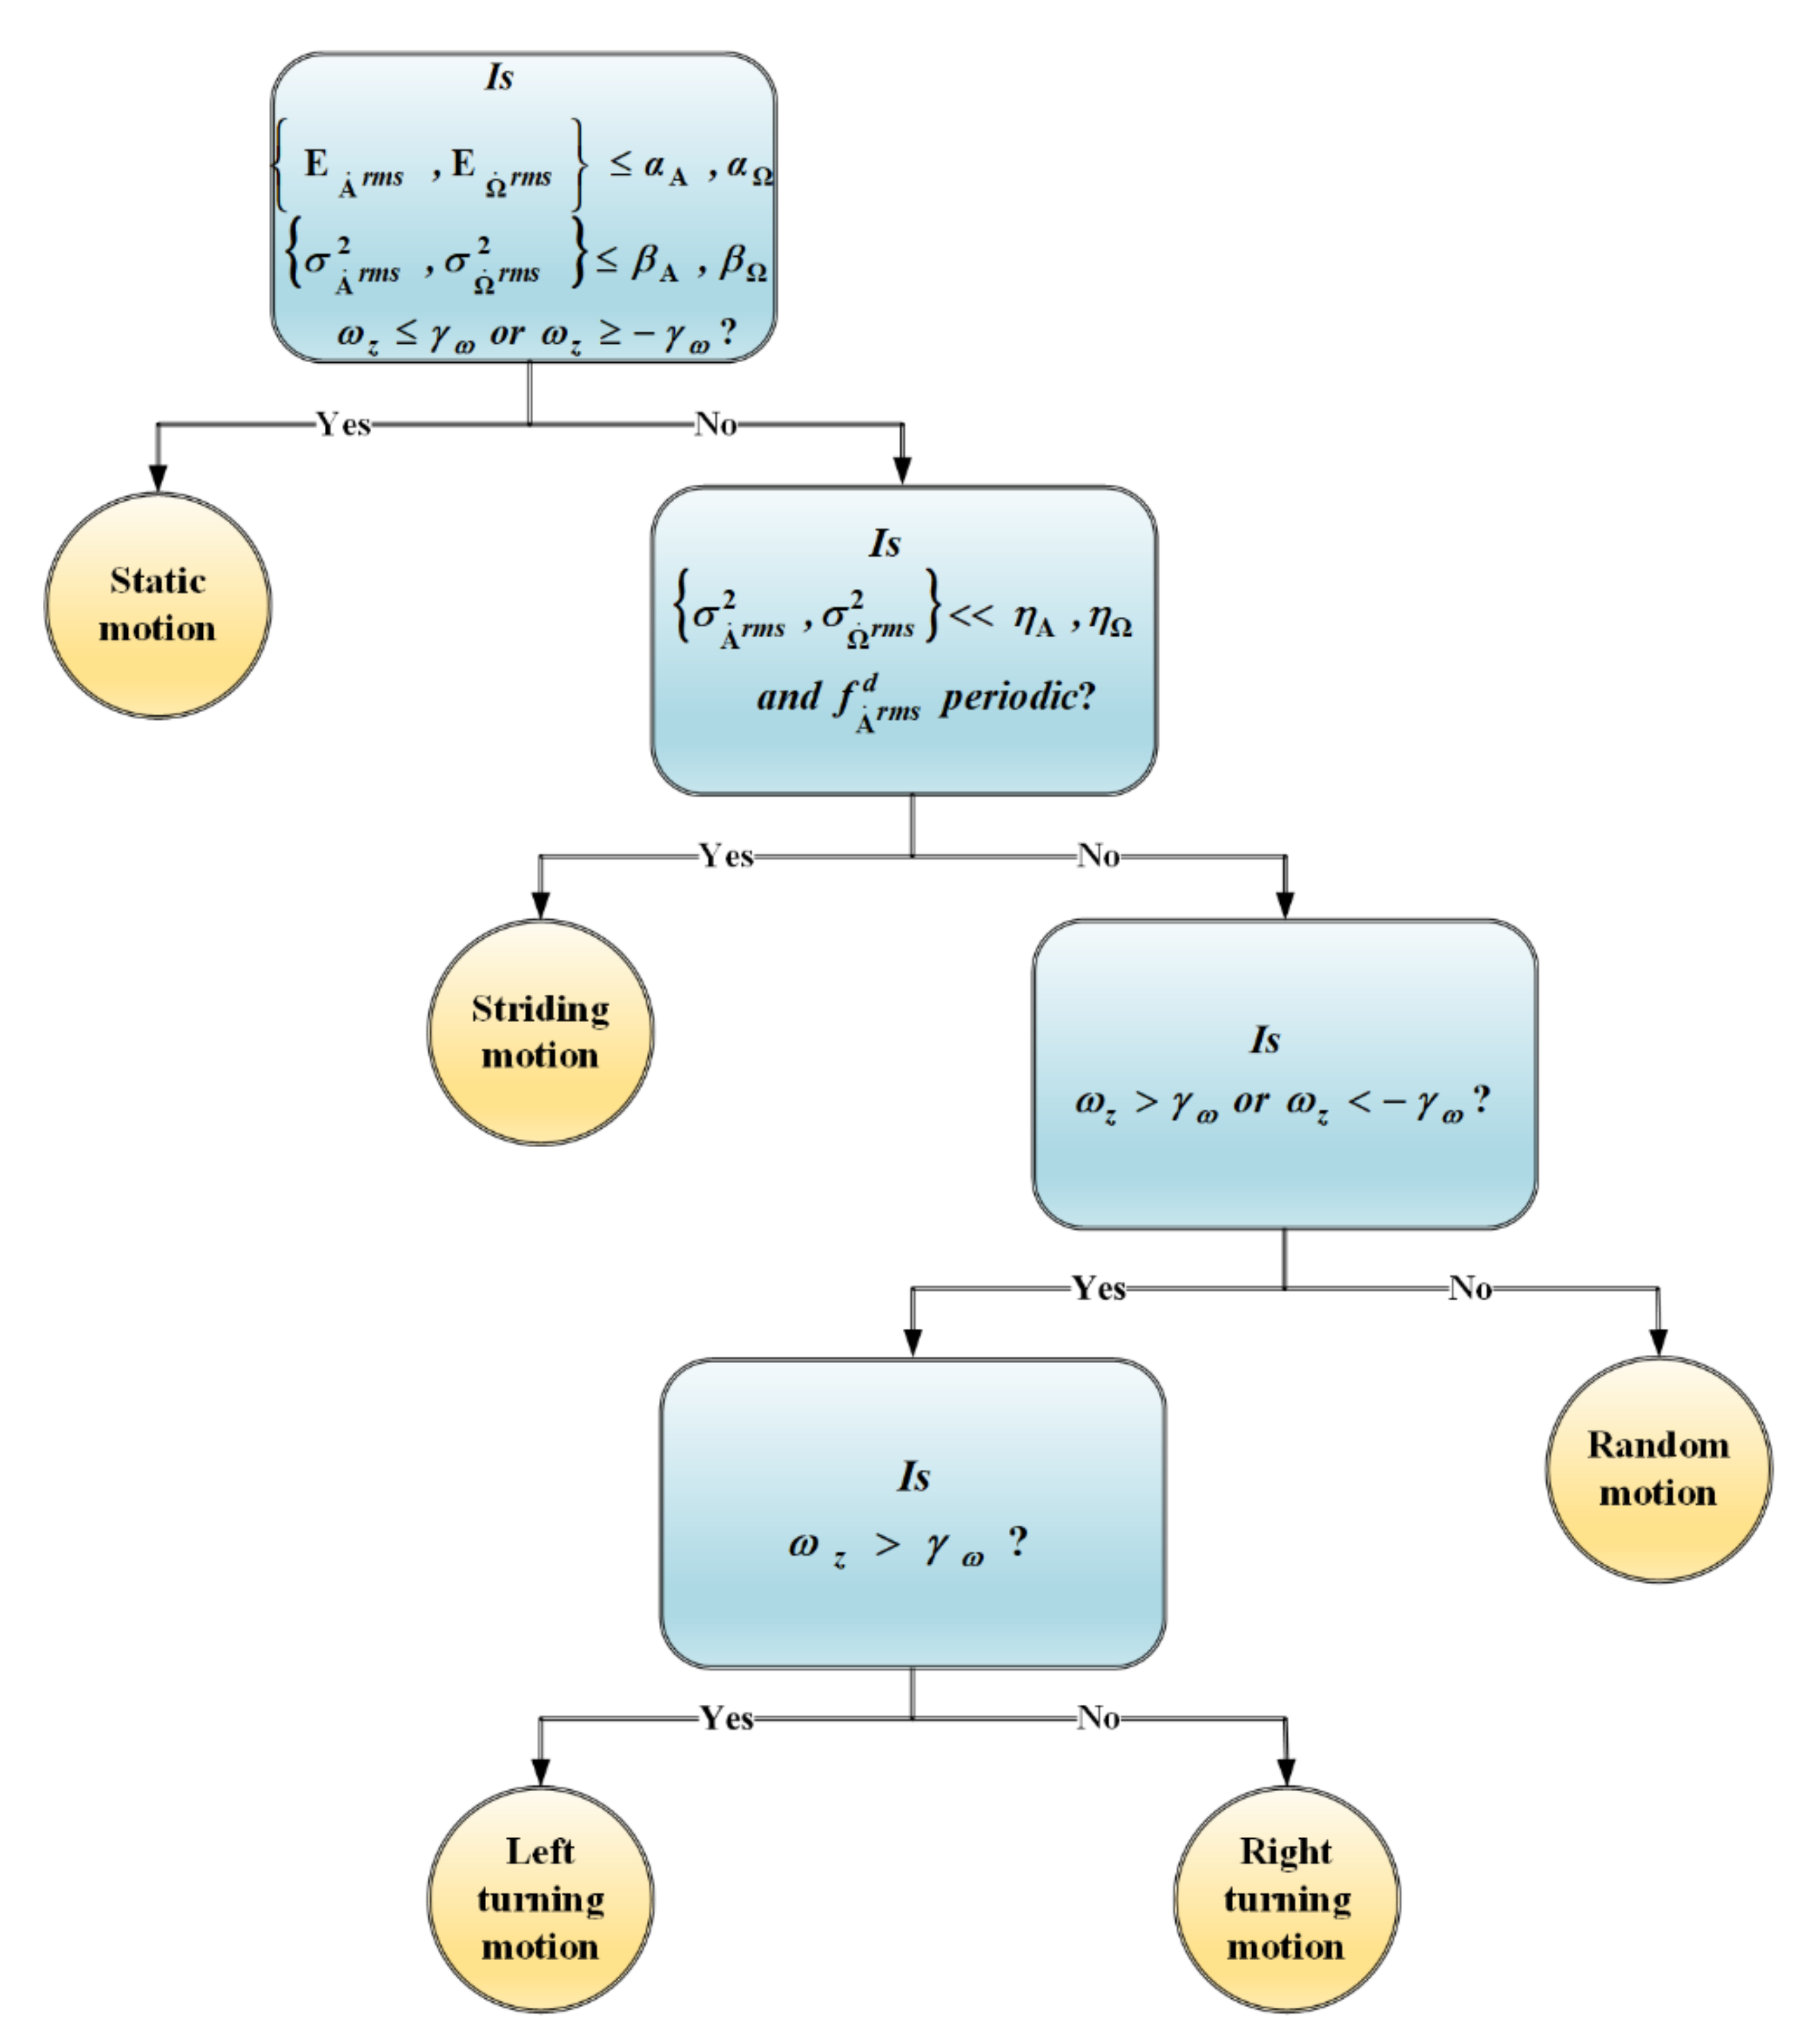
5.2.1. Motion Mode Definition
- Static motion: this type of motion mode includes all the circumstances when a subject is static. A subject will be deemed to be in static mode when his/her spatial position does not change throughout a considered time window. This mode also considers the states as static when a subject obtains slight motion that is not significant enough to infer it as typical locomotion, for example, if a subject moves slightly by stepping on the same spot while opening a door. To detect a landmark correctly, this type of movement must be identified as static.
- Striding motion: this type of motion mode involves the continuous and smooth motion states that contain periodicity and similarity characteristics for a particular time period in their feature set attributes. It includes the motions that change a subject’s spatial position, e.g., plain walking, walking on stairs, or running.
- Turning motion: this refers to the motion states when a subject takes a turn while standing or walking, e.g., performing left or right turning.
- Intermittent motion: this type of motion mode refers to the cases that generate irregular motion states without having the periodicity and continuity properties. It includes all the motion states that a subject performs while remain standing and does not contribute to the change in his/her spatial position, for example, bending or shaking the subject’s body while standing on the same spot.
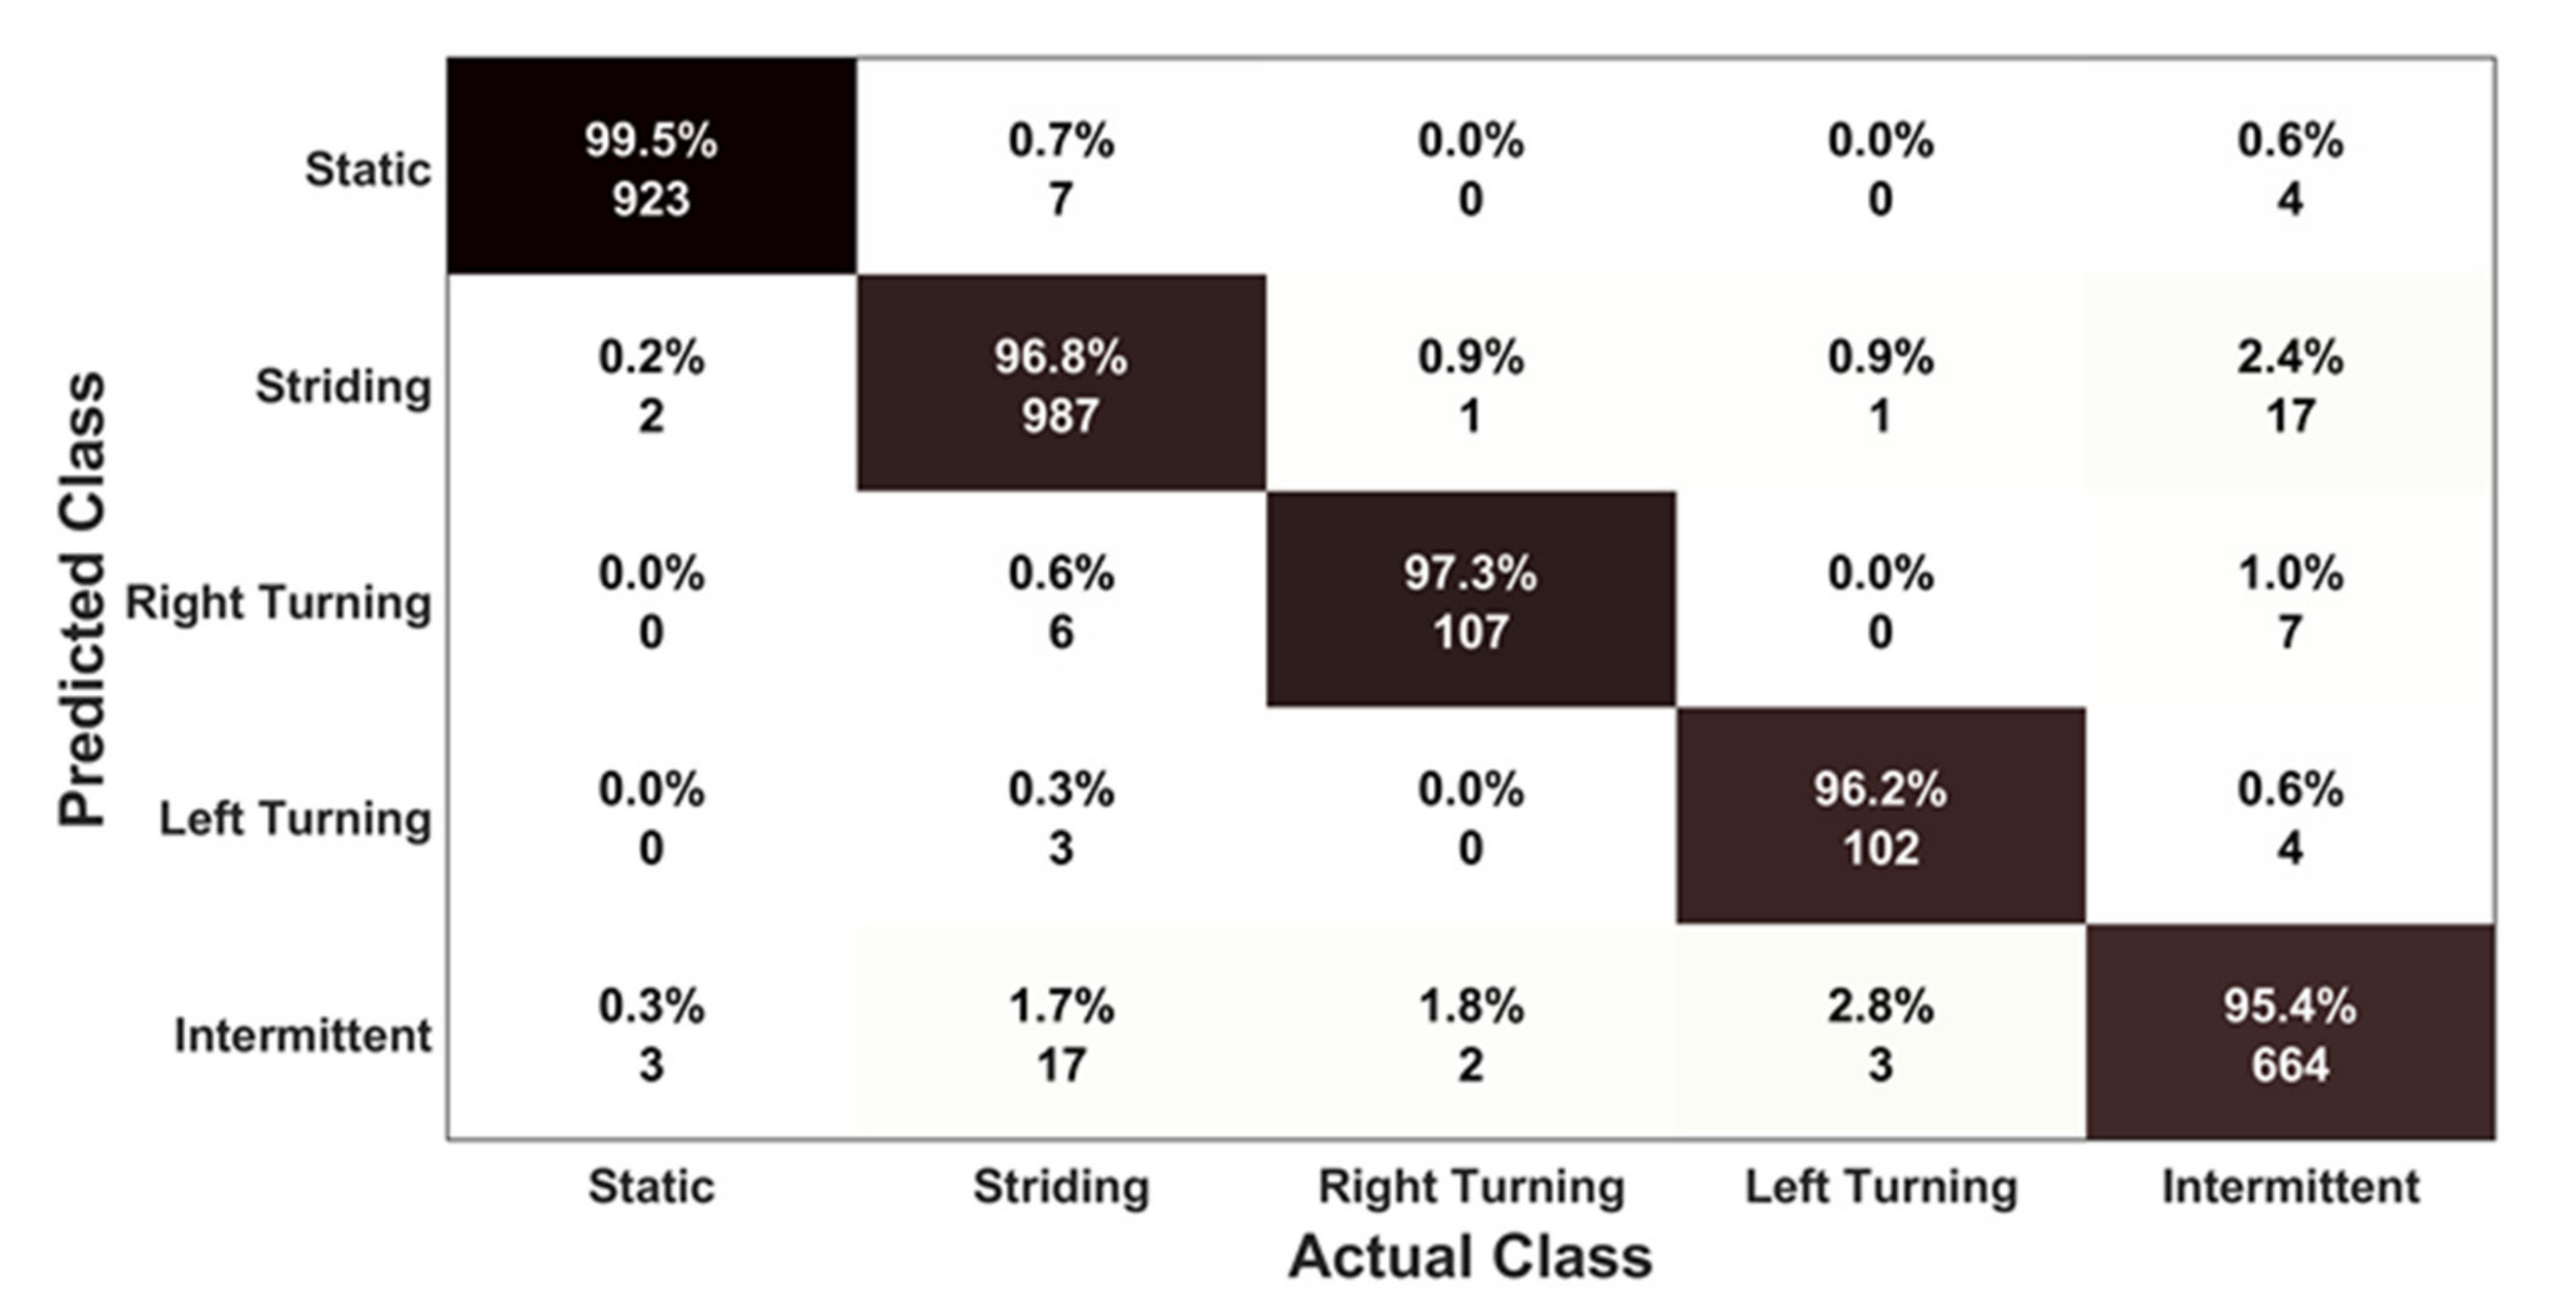
5.2.2. Motion Mode Classification
6. User’s Body Shadowing Effect Compensation
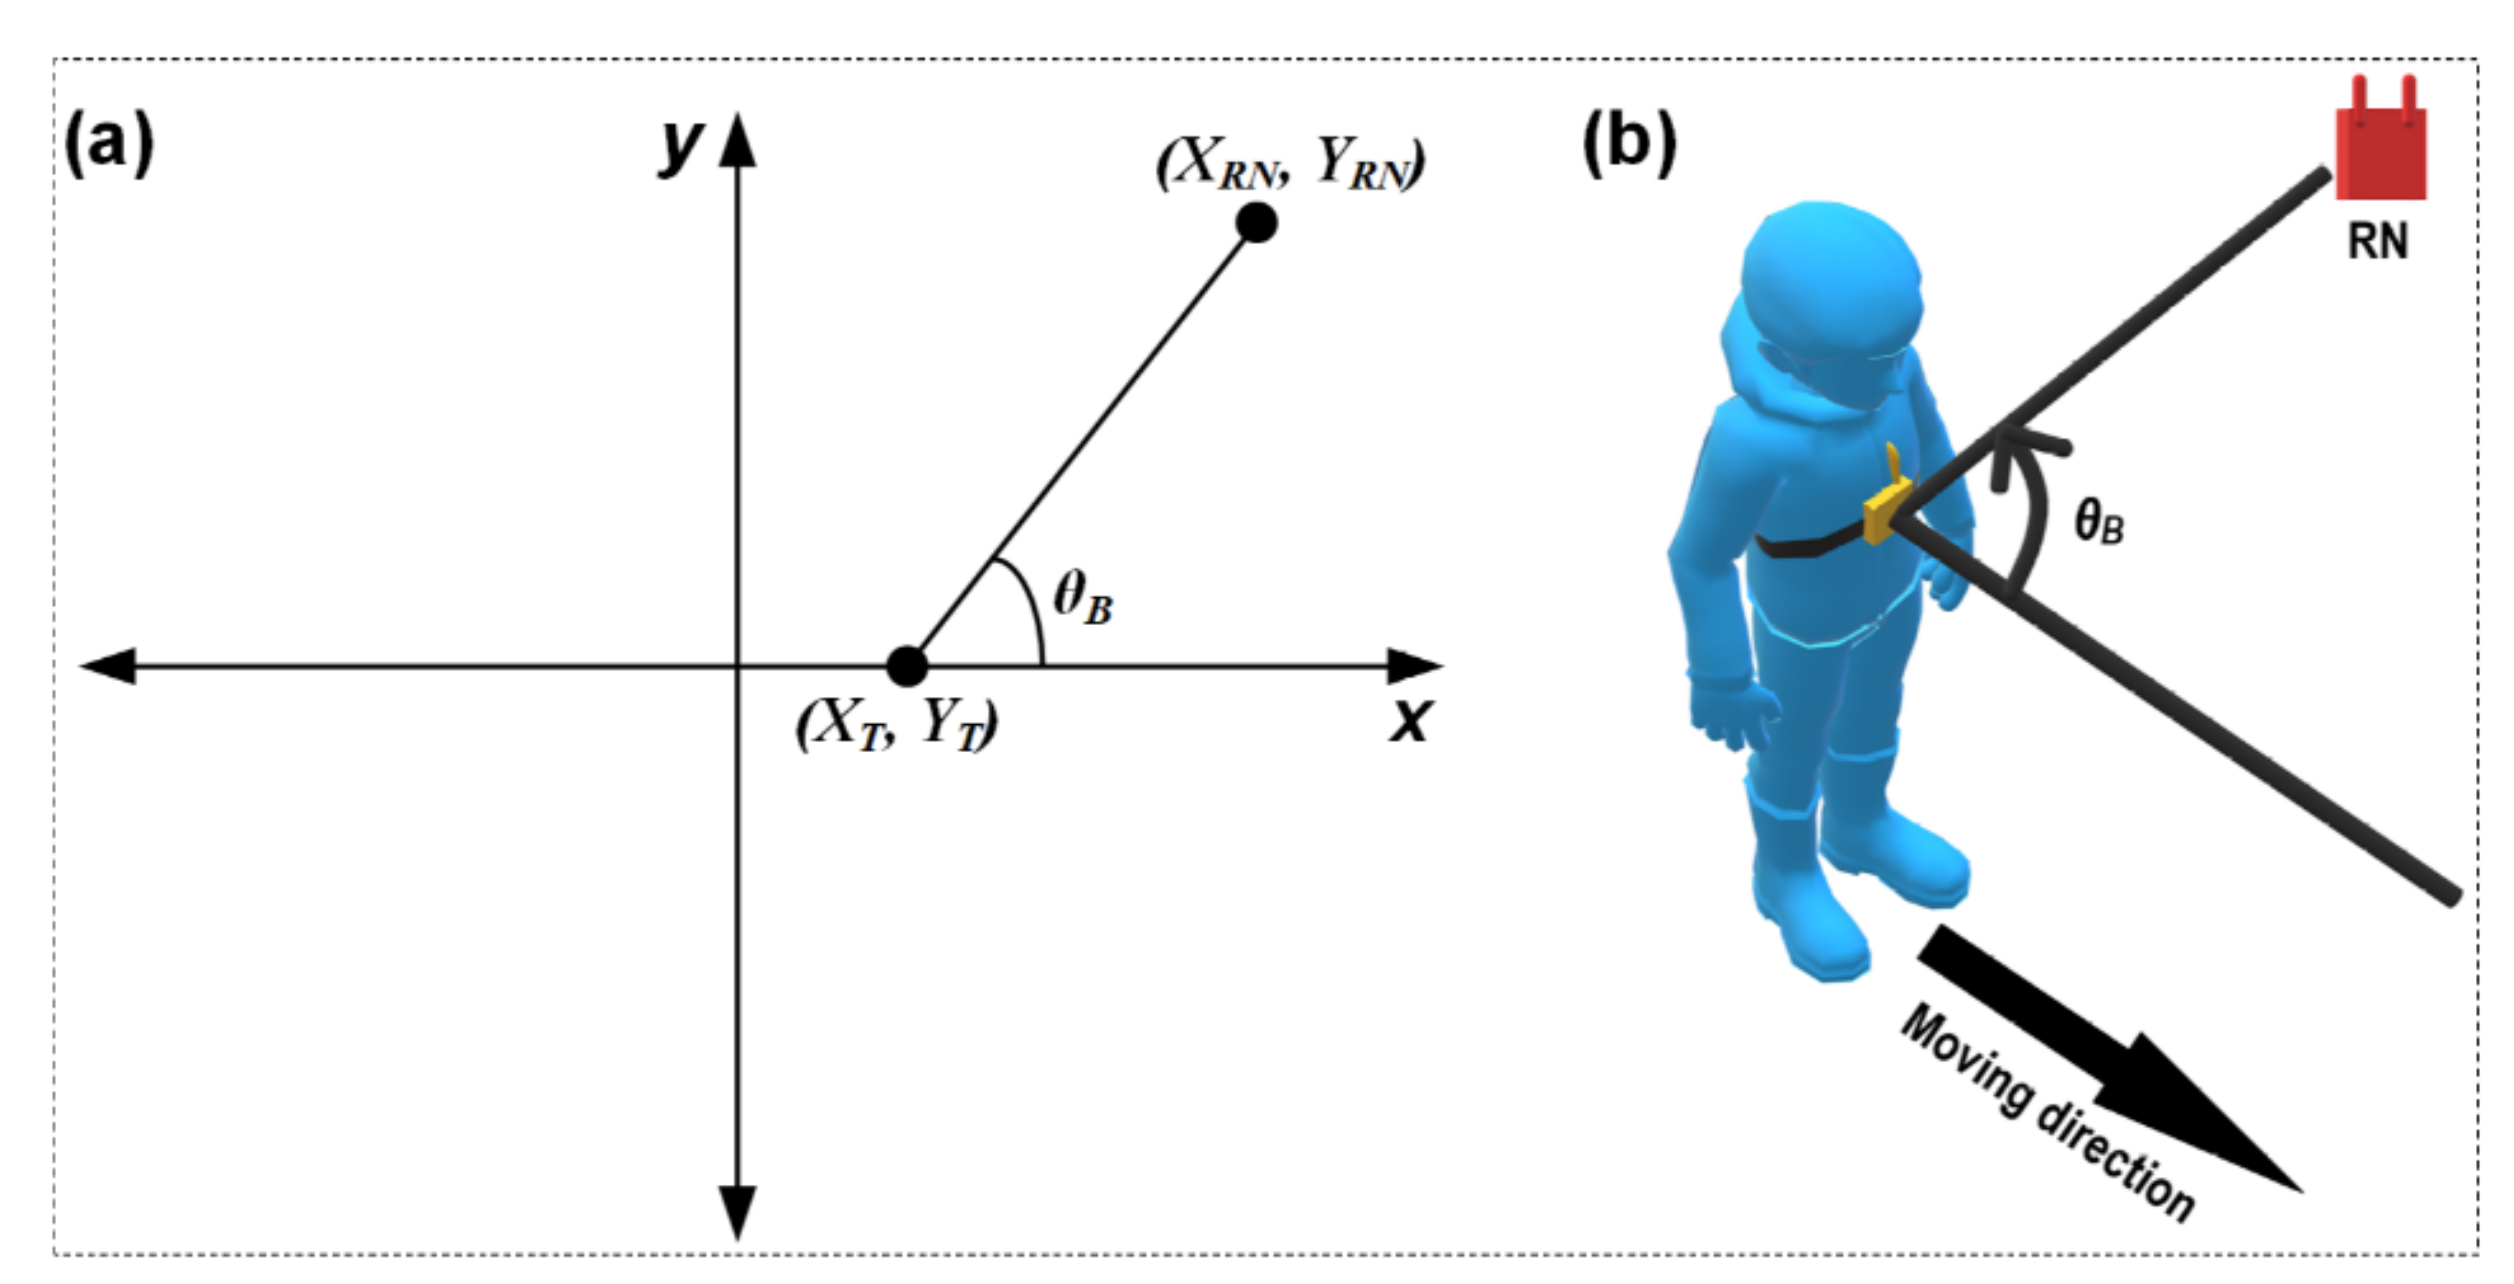
6.1. Angle Estimation
6.2. Compensation Model
7. Location Estimation
8. Experimental Evaluation
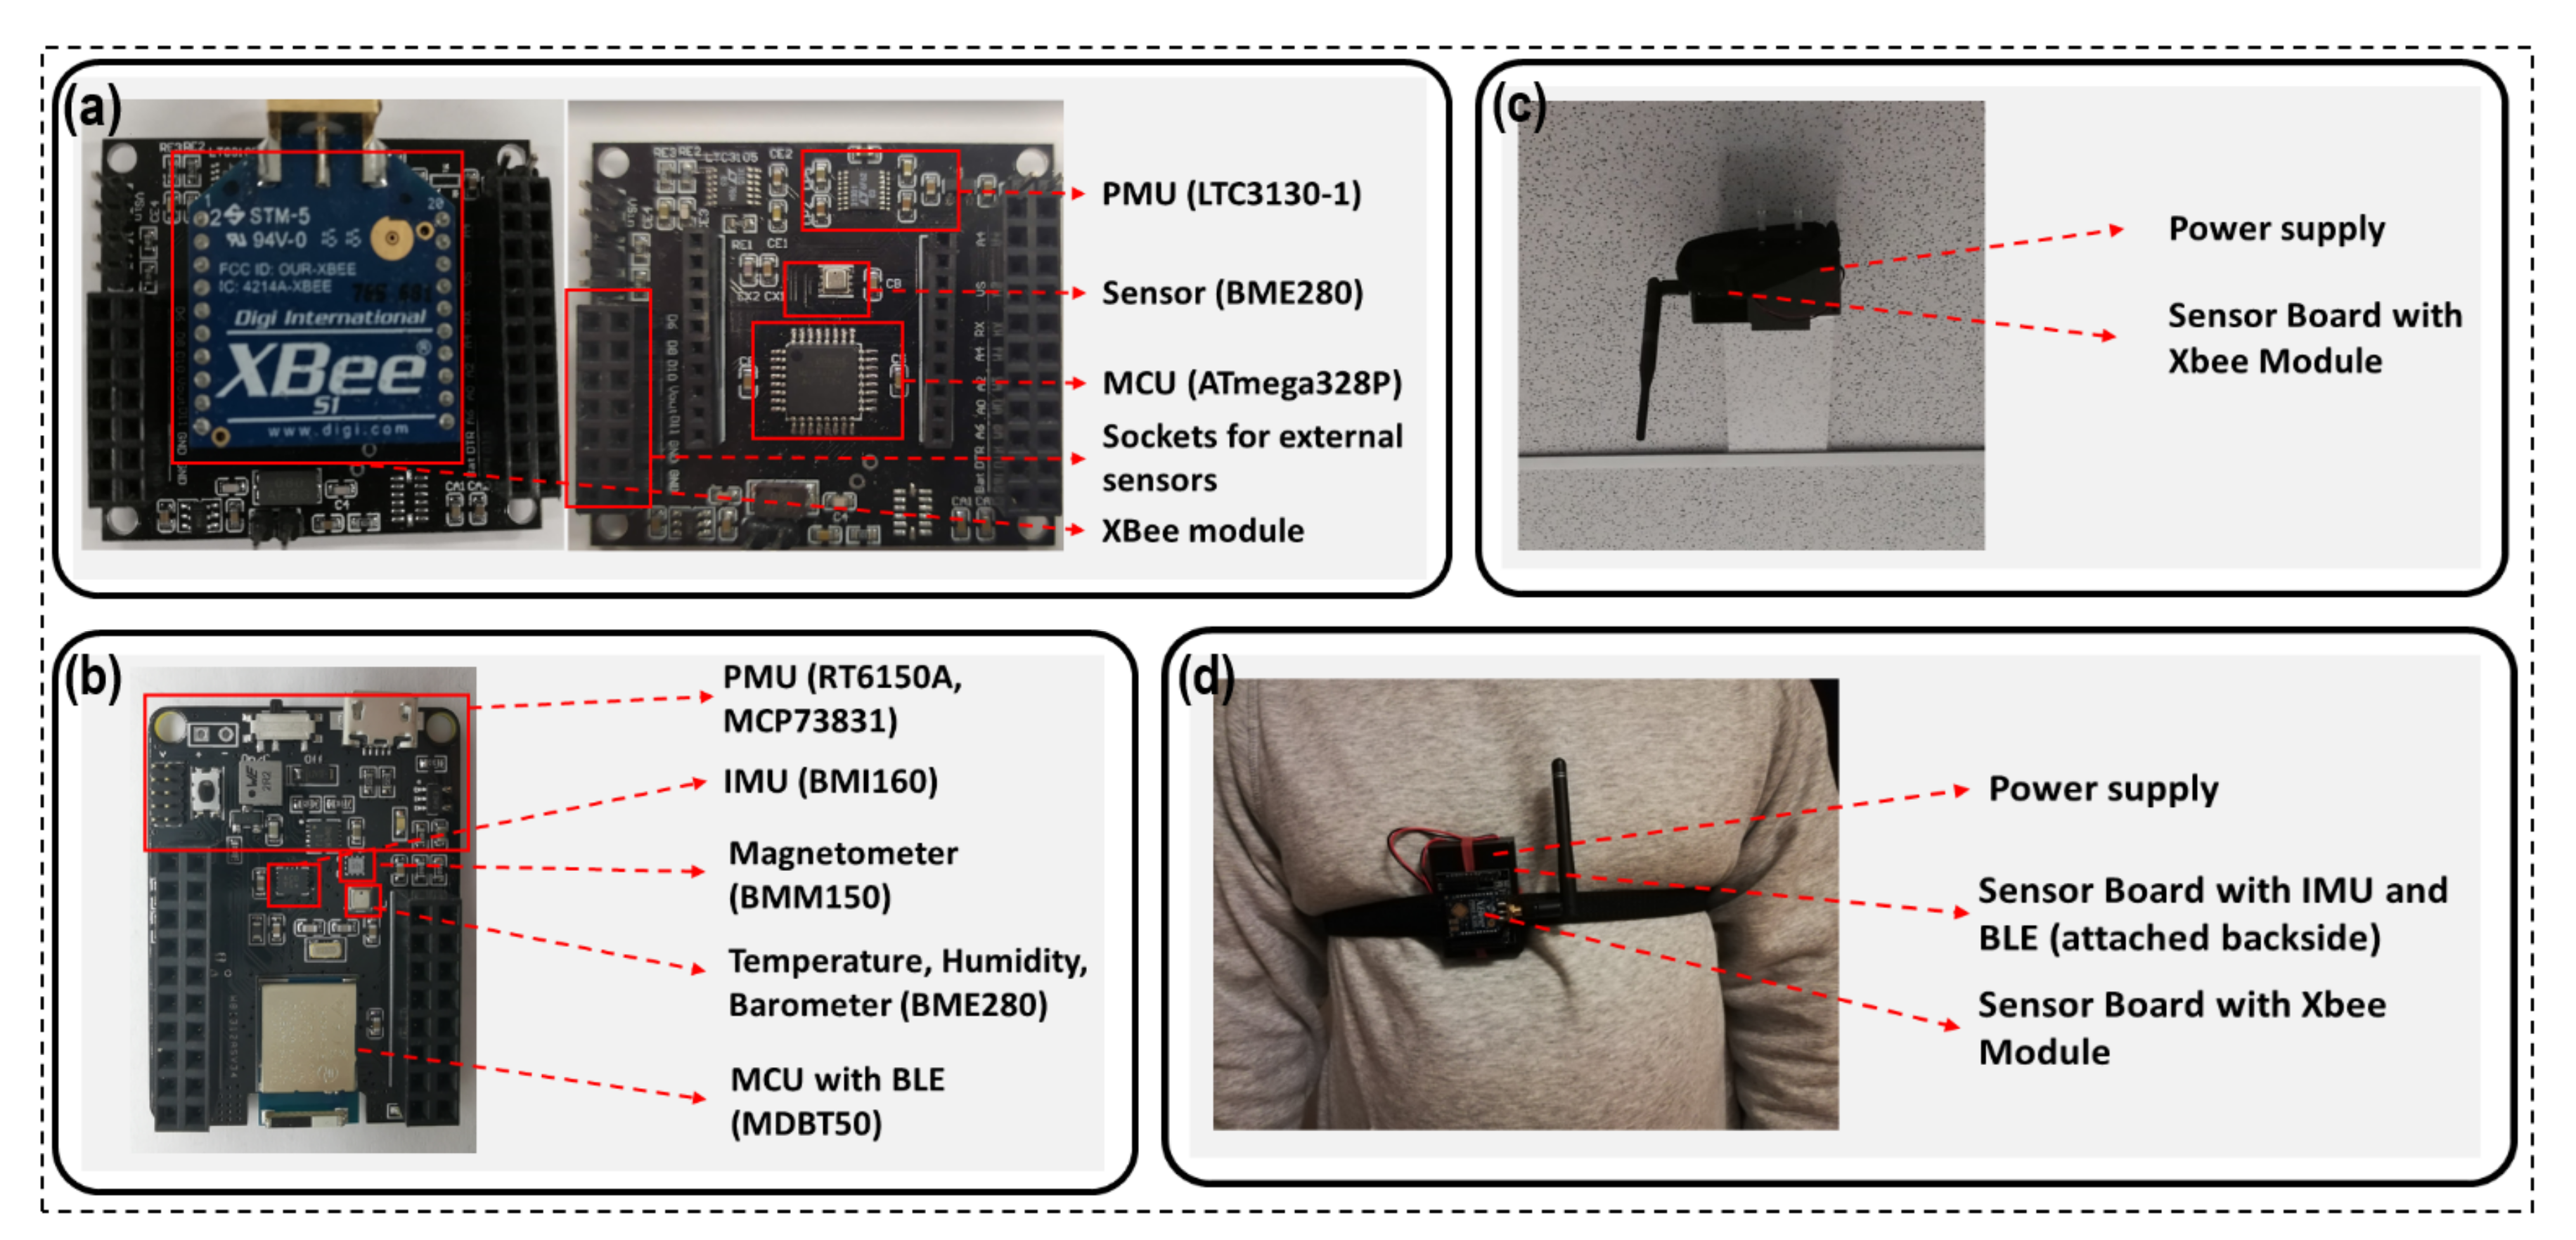
8.1. Experimental Setup
8.2. Evaluation of Motion Mode Detection
8.2.1. Data Collection
8.2.2. Evaluation Metrics
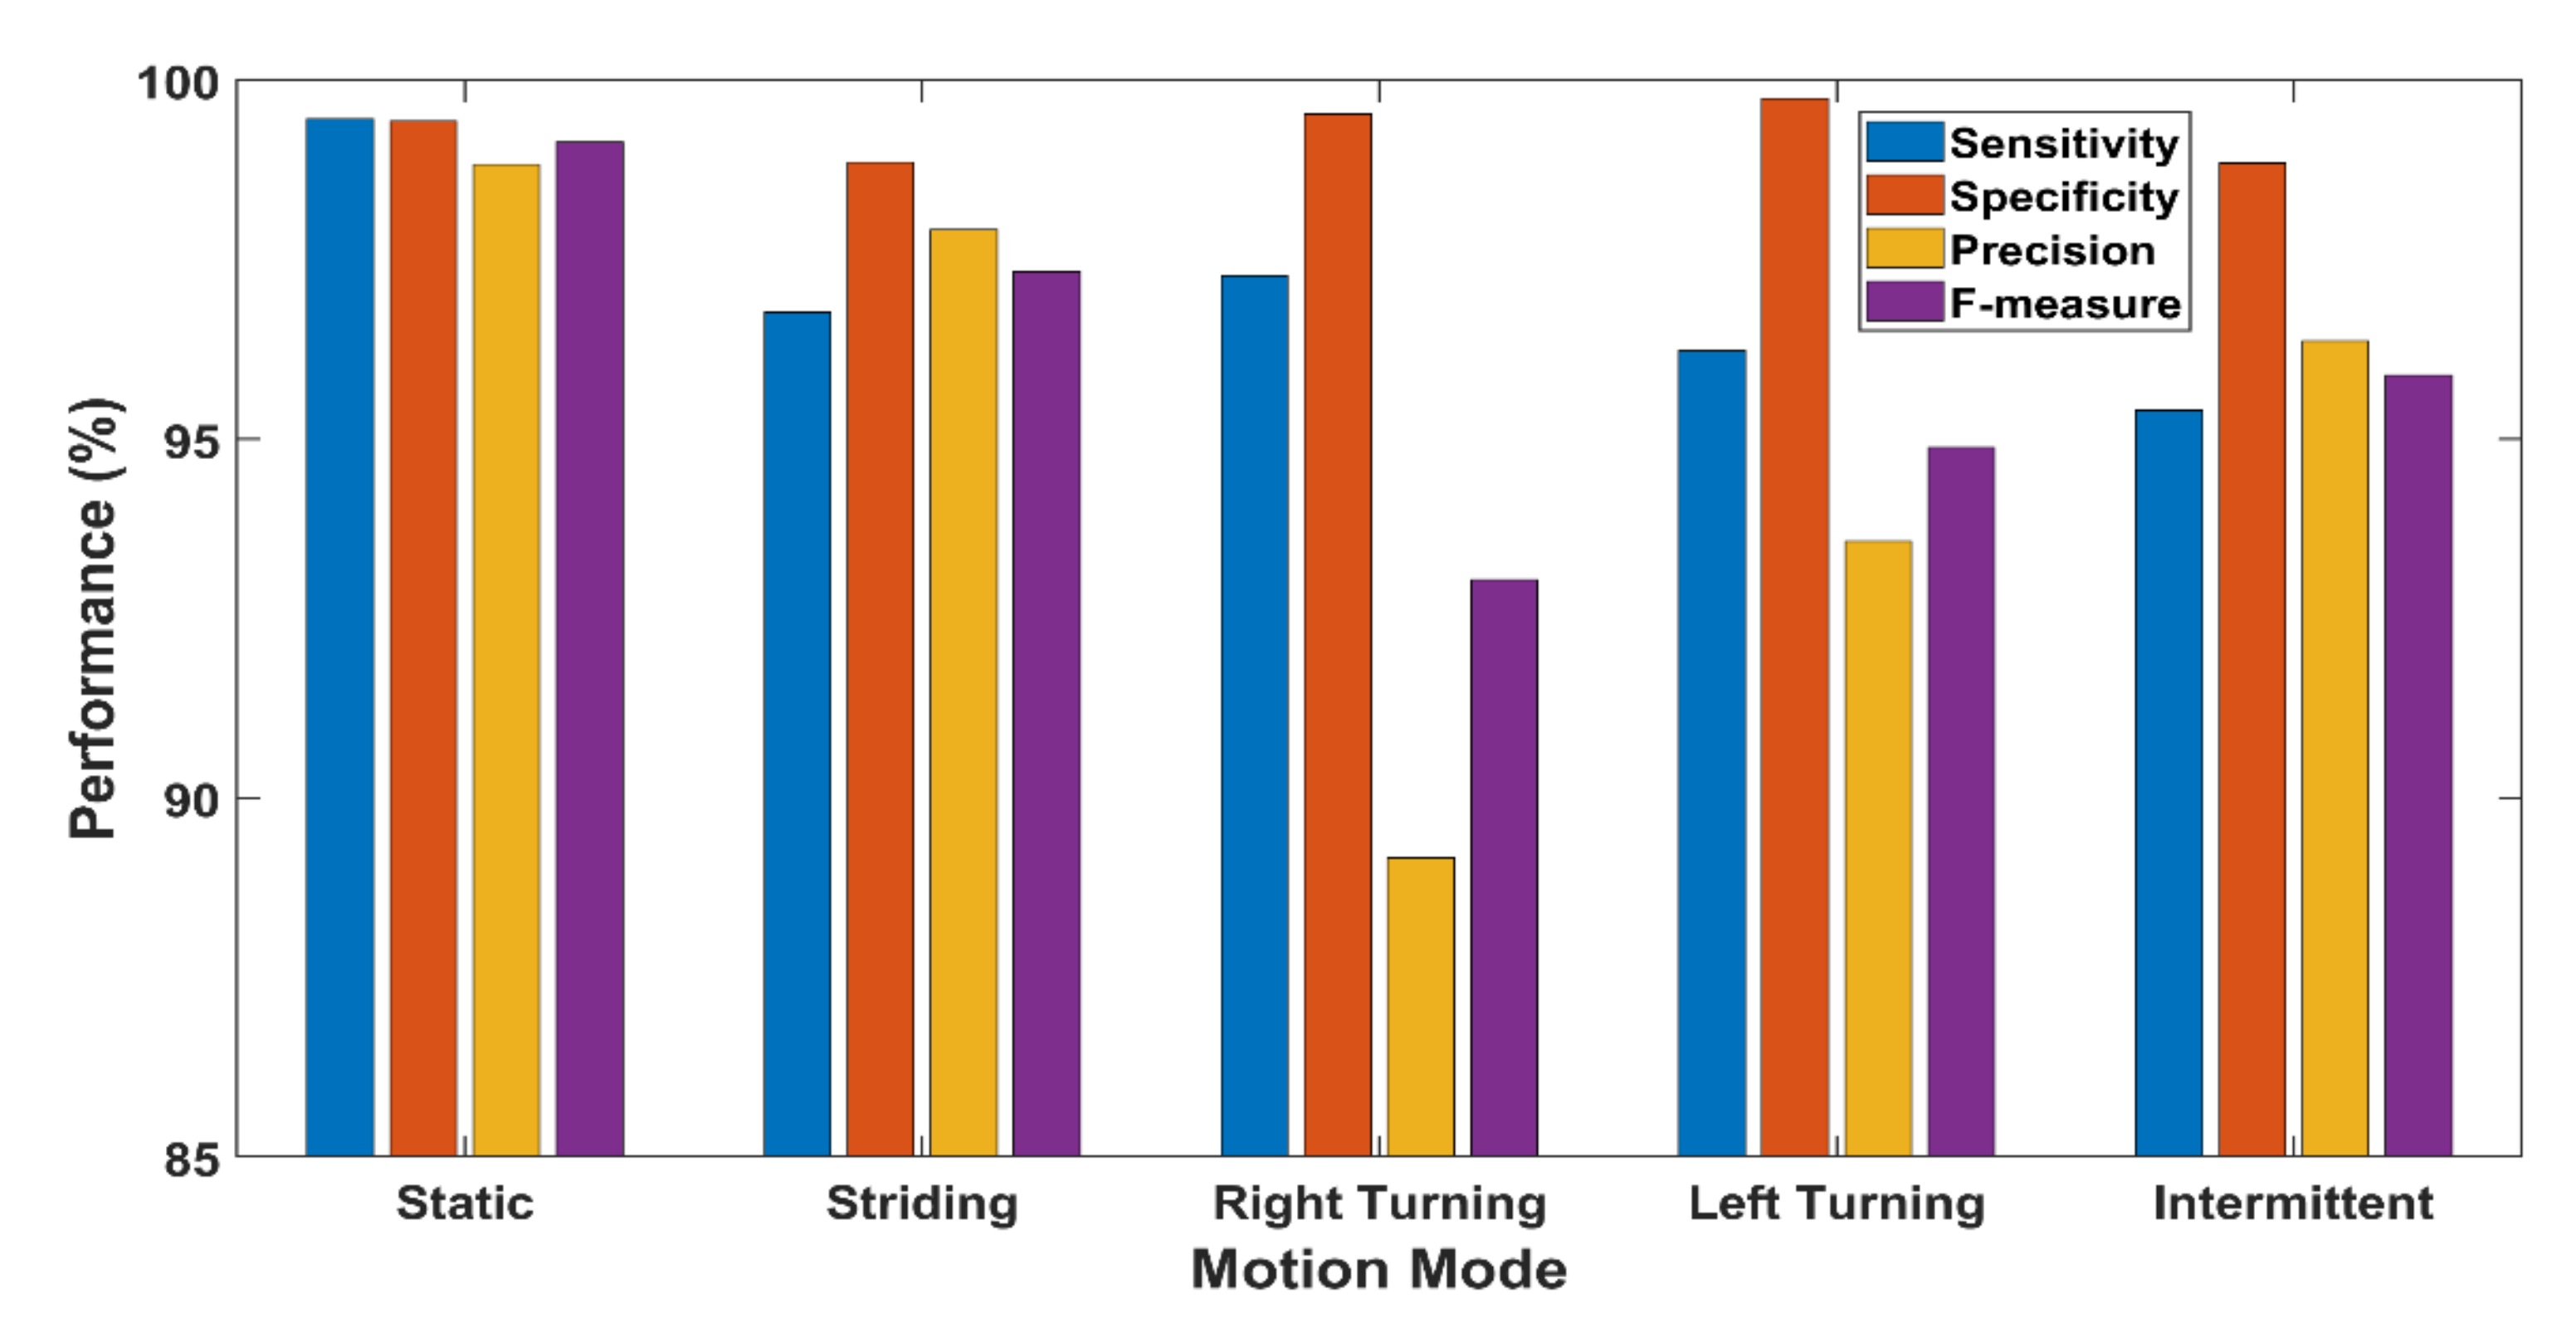
8.2.3. Classification Performance
8.3. Evaluation of User’s Body Shadowing Effect Compensation Model
8.4. Evaluation of the Proposed Localisation System
8.4.1. Evaluation Criterion
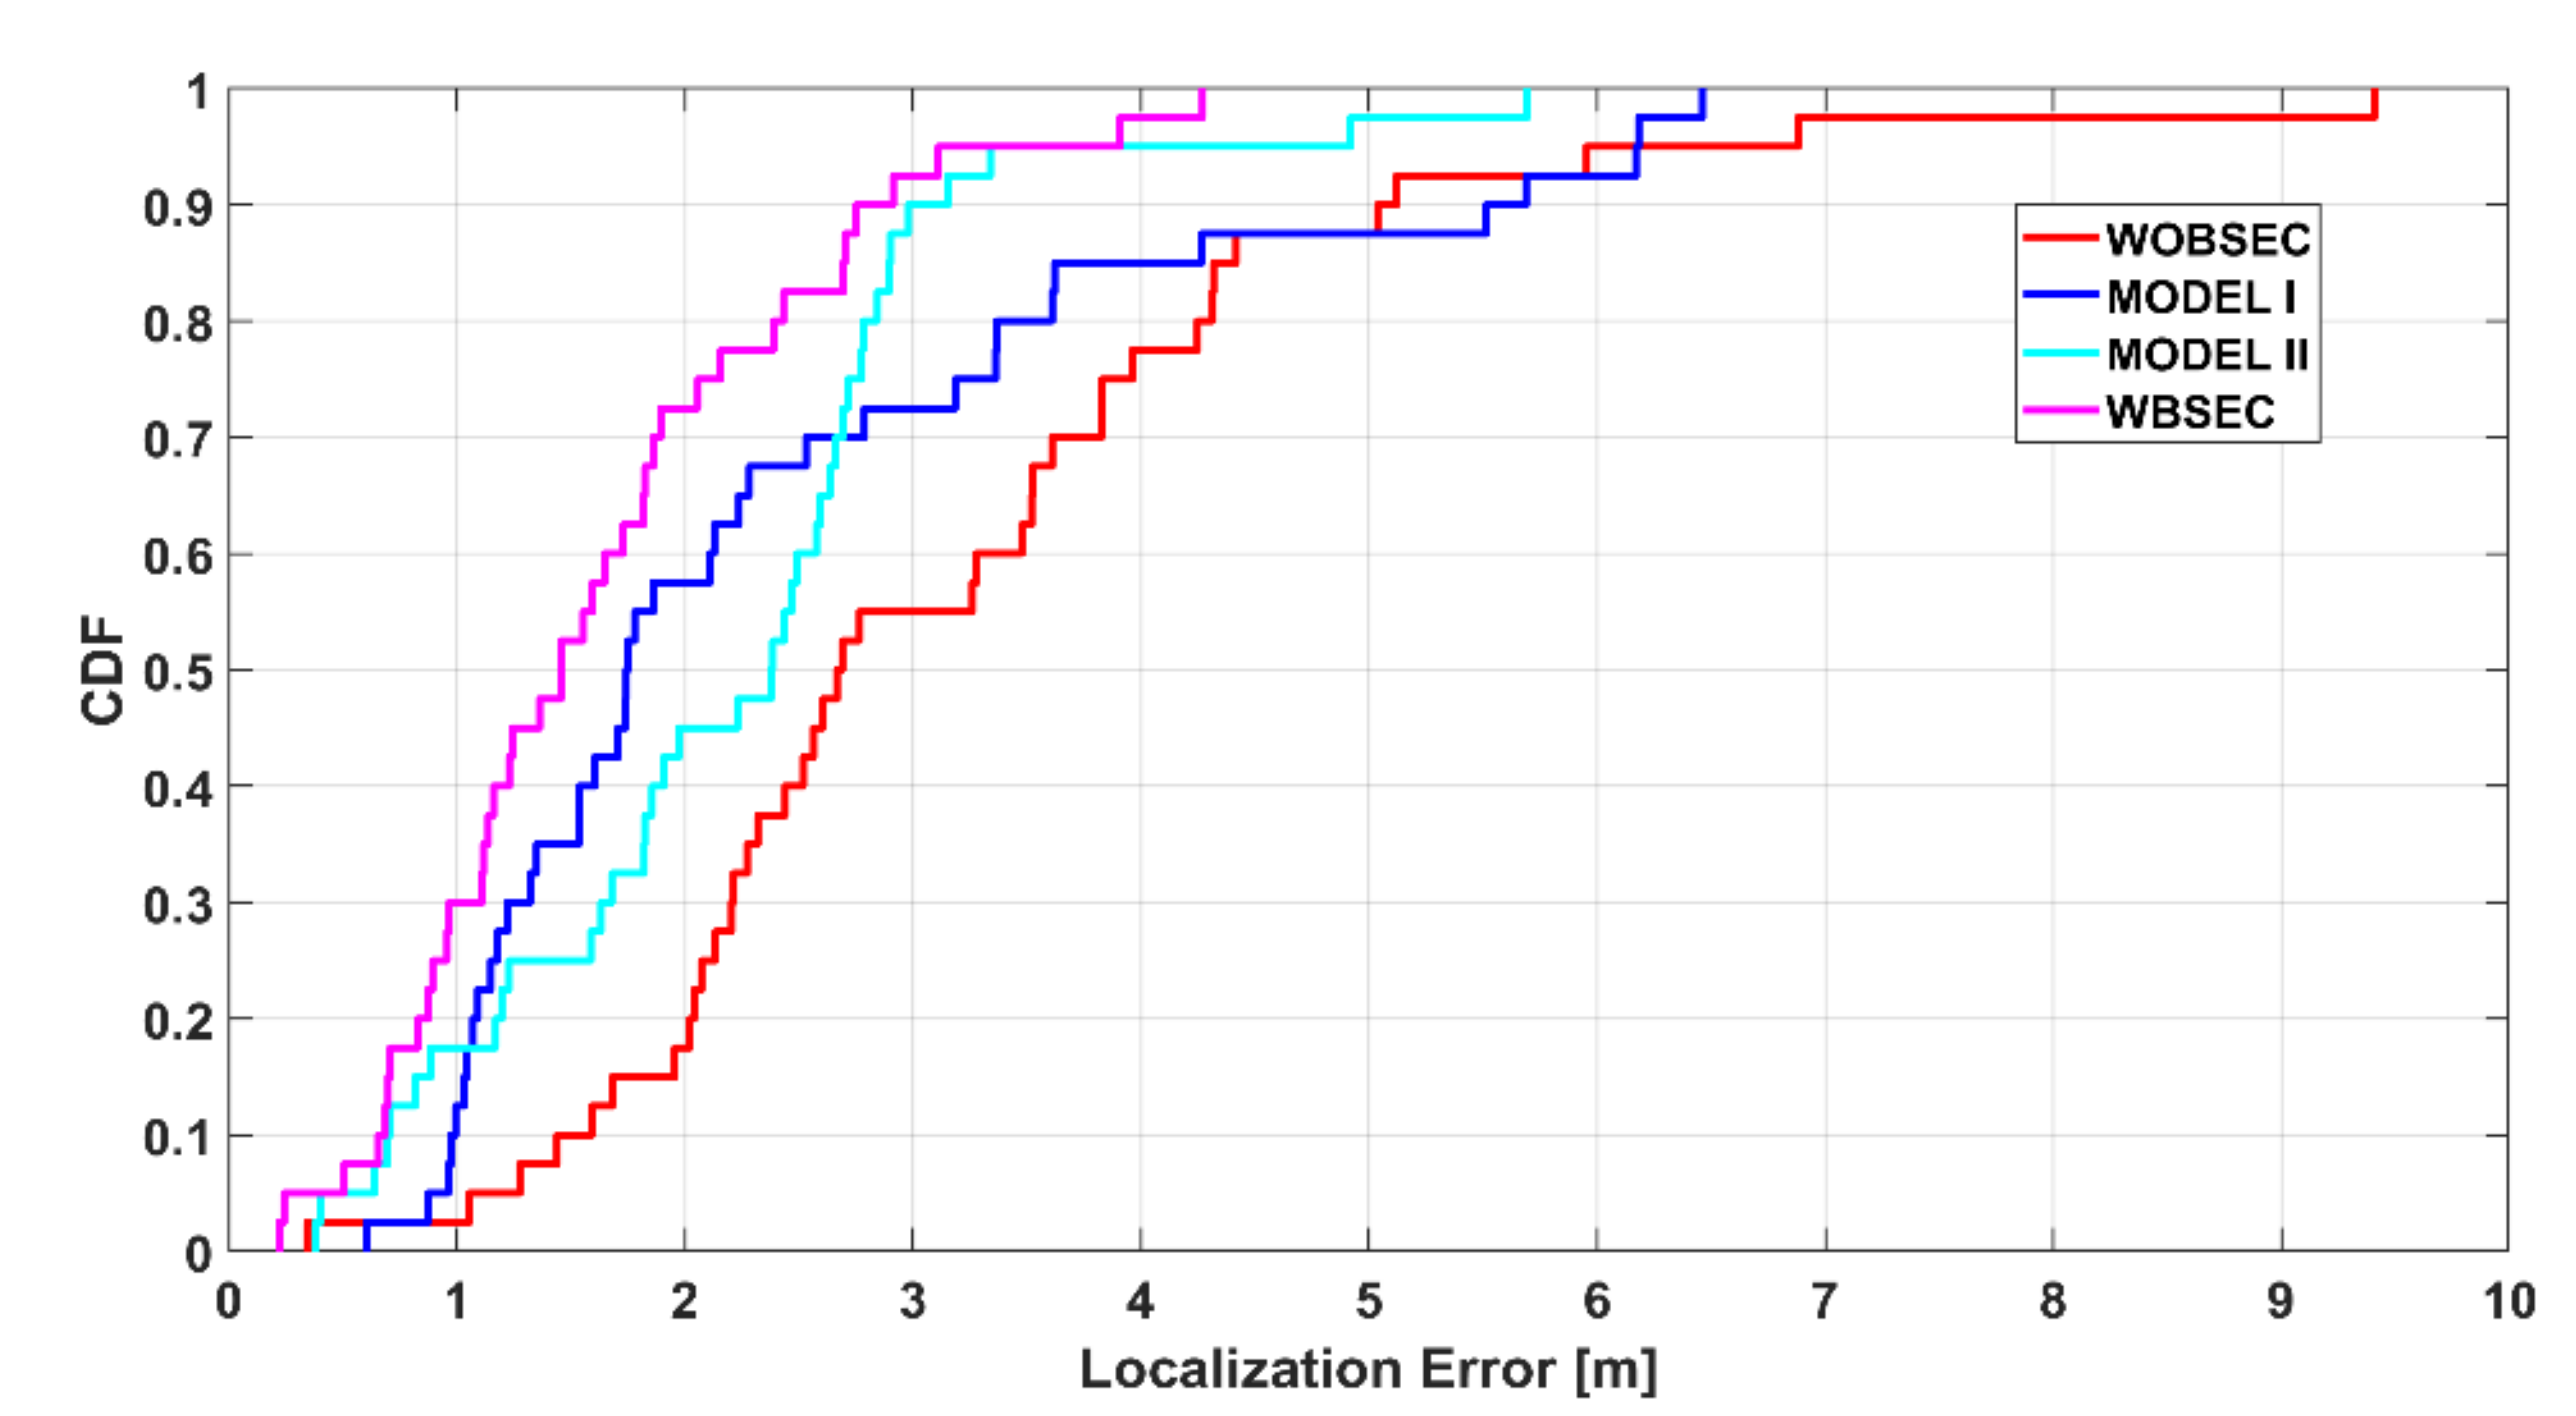
8.4.2. Localisation Performance
9. Conclusions
Author Contributions
Funding
Conflicts of Interest
References
- Li, Y.; Zhuang, Y.; Hu, X.; Gao, Z.; Hu, J.; Chen, L.; He, Z.; Pei, L.; Chen, K.; Wang, M.; et al. Toward Location-Enabled IoT (LE-IoT): IoT Positioning Techniques, Error Sources, and Error Mitigation. IEEE Internet Things J. 2021, 8, 4035–4062. [Google Scholar] [CrossRef]
- Wang, H.; Sen, S.; Elgohary, A.; Farid, M.; Youssef, M.; Choudhury, R.R. No need to war-drive: Unsupervised indoor localization. In Proceedings of the 10th International Conference on Mobile Systems, Applications, and Services, Low Wood Bay, UK, 25–29 June 2012; pp. 197–210. [Google Scholar]
- Schmitt, S.; Adler, S.; Kyas, M. The effects of human body shadowing in RF-based indoor localization. In Proceedings of the 2014 International Conference on Indoor Positioning and Indoor Navigation (IPIN), Busan, Korea, 27–30 October 2014; pp. 307–313. [Google Scholar]
- Popleteev, A. Improving ambient FM indoor localization using multipath-induced amplitude modulation effect: A year-long experiment. Pervasive Mob. Comput. 2019, 58, 101022. [Google Scholar] [CrossRef]
- Bahl, P.; Padmanabhan, V.N. RADAR: An in-building RF-based user location and tracking system. In Proceedings of the IEEE INFOCOM 2000, Tel Aviv, Israel, 26–30 March 2000; Volume 2, pp. 775–784. [Google Scholar]
- Gu, F.; Valaee, S.; Khoshelham, K.; Shang, J.; Zhang, R. Landmark Graph-Based Indoor Localization. IEEE Internet Things J. 2020, 7, 8343–8355. [Google Scholar] [CrossRef]
- Xu, C.; Firner, B.; Moore, R.S.; Zhang, Y.; Trappe, W.; Howard, R.; Zhang, F.; An, N. SCPL: Indoor device-free multi-subject counting and localization using radio signal strength. In Proceedings of the 12th International Conference on Information Processing in Sensor Networks, Philadelphia, PA, USA, 8–11 April 2013; Association for Computing Machinery: New York, NY, USA, 2013; pp. 79–90. [Google Scholar]
- Jeong, J.; Shen, Y.; Kim, S.; Choe, D.; Lee, K.; Kim, Y. DFC: Device-free human counting through WiFi fine-grained subcarrier information. IET Commun. 2021, 15, 337–350. [Google Scholar] [CrossRef]
- Wang, Y.; Wu, K.; Ni, L.M. WiFall: Device-Free Fall Detection by Wireless Networks. IEEE Trans. Mob. Comput. 2017, 16, 581–594. [Google Scholar] [CrossRef]
- Kianoush, S.; Savazzi, S.; Vicentini, F.; Rampa, V.; Giussani, M. Device-Free RF Human Body Fall Detection and Localization in Industrial Workplaces. IEEE Internet Things J. 2017, 4, 351–362. [Google Scholar] [CrossRef]
- Wang, J.; Zhang, X.; Gao, Q.; Yue, H.; Wang, H. Device-Free Wireless Localization and Activity Recognition: A Deep Learning Approach. IEEE Trans. Veh. Technol. 2017, 66, 6258–6267. [Google Scholar] [CrossRef]
- Leith, D.J.; Farrell, S. Coronavirus contact tracing: Evaluating the potential of using bluetooth received signal strength for proximity detection. SIGCOMM Comput. Commun. Rev. 2020, 50, 66–74. [Google Scholar] [CrossRef]
- Cully, W.P.L.; Cotton, S.L.; Scanlon, W.G.; McQuiston, J.B. Body shadowing mitigation using differentiated LOS/NLOS channel models for RSSI-based Monte Carlo personnel localization. In Proceedings of the 2012 IEEE Wireless Communications and Networking Conference (WCNC), Paris, France, 1–4 April 2012; pp. 694–698. [Google Scholar]
- King, T.; Kopf, S.; Haenselmann, T.; Lubberger, C.; Effelsberg, W. COMPASS: A probabilistic indoor positioning system based on 802.11 and digital compasses. In Proceedings of the 1st International Workshop on Wireless Network Testbeds, Experimental Evaluation & Characterization, Los Angeles, CA, USA, 29 September 2006; Association for Computing Machinery: New York, NY, USA; pp. 34–40. [Google Scholar]
- Della Rosa, F.; Pelosi, M.; Nurmi, J. Human-Induced Effects on RSS Ranging Measurements for Cooperative Positioning. Int. J. Navig. Obs. 2012, 2012, 959140. [Google Scholar] [CrossRef]
- Trogh, J.; Plets, D.; Martens, L.; Joseph, W. Improved Tracking by Mitigating the Influence of the Human Body. In Proceedings of the 2015 IEEE Globecom Workshops (GC Wkshps), San Diego, CA, USA, 6–10 December 2015; pp. 1–6. [Google Scholar]
- Trogh, J.; Plets, D.; Thielens, A.; Martens, L.; Joseph, W. Enhanced Indoor Location Tracking Through Body Shadowing Compensation. IEEE Sens. J. 2016, 16, 2105–2114. [Google Scholar] [CrossRef] [Green Version]
- Rapiński, J.; Zinkiewicz, D.; Stanislawek, T. Influence of human body on Radio Signal Strength Indicator readings in indoor positioning systems. Tech. Sci. Univ. Warm. Mazury Olszt. 2016, 19, 117–127. [Google Scholar]
- Bi, J.; Wang, Y.; Li, X.; Cao, H.; Qi, H.; Wang, Y. A novel method of adaptive weighted K-nearest neighbor fingerprint indoor positioning considering user’s orientation. Int. J. Distrib. Sens. Netw. 2018, 14, 1550147718785885. [Google Scholar] [CrossRef]
- Deng, Z.; Fu, X.; Wang, H. An IMU-Aided Body-Shadowing Error Compensation Method for Indoor Bluetooth Positioning. Sensors 2018, 18, 304. [Google Scholar] [CrossRef] [PubMed] [Green Version]
- Plets, D.; Joseph, W.; Vanhecke, K.; Tanghe, E.; Martens, L. Coverage prediction and optimization algorithms for indoor environments. EURASIP J. Wirel. Commun. Netw. 2012, 2012, 123. [Google Scholar] [CrossRef] [Green Version]
- Wang, J.; Wang, Q. Body Area Communications: Channel Modeling, Communication Systems, and EMC; John Wiley & Sons: Singapore, Singapore, 2013. [Google Scholar]
- Hall, P.S.; Hao, Y. Antennas and Propagation for Body-Centric Wireless Communications; Artech House: Norwood, MA, USA, 2012. [Google Scholar]
- Harmuth, H.F.; Hussain, M.G.; Boules, R.N. Electromagnetic Signals: Reflection, Focusing, Distortion, and Their Practical Applications; Springer: New York, USA, 1999. [Google Scholar]
- Mamun, M.A.A.; Anaya, D.V.; Wu, F.; Redouté, J.M.; Yuce, M.R. Radio Map Building with IEEE 802.15.4 for Indoor Localization Applications. In Proceedings of the 2019 IEEE International Conference on Industrial Technology (ICIT), Melbourne, Australia, 13–15 February 2019; pp. 181–186. [Google Scholar]
- Ruiz, A.R.J.; Granja, F.S.; Honorato, J.C.P.; Rosas, J.I.G. Accurate Pedestrian Indoor Navigation by Tightly Coupling Foot-Mounted IMU and RFID Measurements. IEEE Trans. Instrum. Meas. 2012, 61, 178–189. [Google Scholar] [CrossRef] [Green Version]
- Antigny, N.; Servières, M.; Renaudin, V. Pedestrian track estimation with handheld monocular camera and inertial-magnetic sensor for urban augmented reality. In Proceedings of the 2017 International Conference on Indoor Positioning and Indoor Navigation (IPIN), Sapporo, Japan, 18–21 September 2017; pp. 1–8. [Google Scholar]
- Zhang, Y.; Hu, W.; Xu, W.; Wen, H.; Chou, C.T. NaviGlass: Indoor Localisation Using Smart Glasses. In Proceedings of the 2016 International Conference on Embedded Wireless Systems and Networks, Graz, Austria, 15–17 February 2016; pp. 205–216. [Google Scholar]
- Susi, M.; Renaudin, V.; Lachapelle, G. Motion Mode Recognition and Step Detection Algorithms for Mobile Phone Users. Sensors 2013, 13, 1539–1562. [Google Scholar] [CrossRef] [PubMed]
- Kołodziej, M.; Majkowski, A.; Tarnowski, P.; Rak, R.J.; Gebert, D.; Sawicki, D. Registration and Analysis of Acceleration Data to Recognize Physical Activity. J. Healthc. Eng. 2019, 2019, 9497151. [Google Scholar] [CrossRef] [PubMed] [Green Version]
- Reddy, S.; Mun, M.; Burke, J.; Estrin, D.; Hansen, M.; Srivastava, M. Using mobile phones to determine transportation modes. ACM Trans. Sen. Netw. 2010, 6, 1–27. [Google Scholar] [CrossRef]
- Renaudin, V.; Susi, M.; Lachapelle, G. Step Length Estimation Using Handheld Inertial Sensors. Sensors 2012, 12, 8507–8525. [Google Scholar] [CrossRef]
- Brunato, M.; Battiti, R. Statistical learning theory for location fingerprinting in wireless LANs. Comput. Netw. 2005, 47, 825–845. [Google Scholar] [CrossRef] [Green Version]


| Method | Min. (m) | Max. (m) | Mean (m) | Median (m) | STD (m) | 25th (m) | 75th (m) | 90th (m) |
|---|---|---|---|---|---|---|---|---|
| WOBSEC | 0.34 | 9.41 | 3.17 | 2.68 | 1.69 | 2.10 | 3.89 | 5.08 |
| MODEL I | 0.60 | 6.46 | 2.39 | 1.75 | 1.64 | 1.16 | 3.27 | 5.60 |
| MODEL II | 0.38 | 5.69 | 2.17 | 2.38 | 1.10 | 1.41 | 2.74 | 3.07 |
| WBSEC | 0.22 | 4.27 | 1.62 | 1.46 | 0.94 | 0.92 | 2.11 | 2.83 |
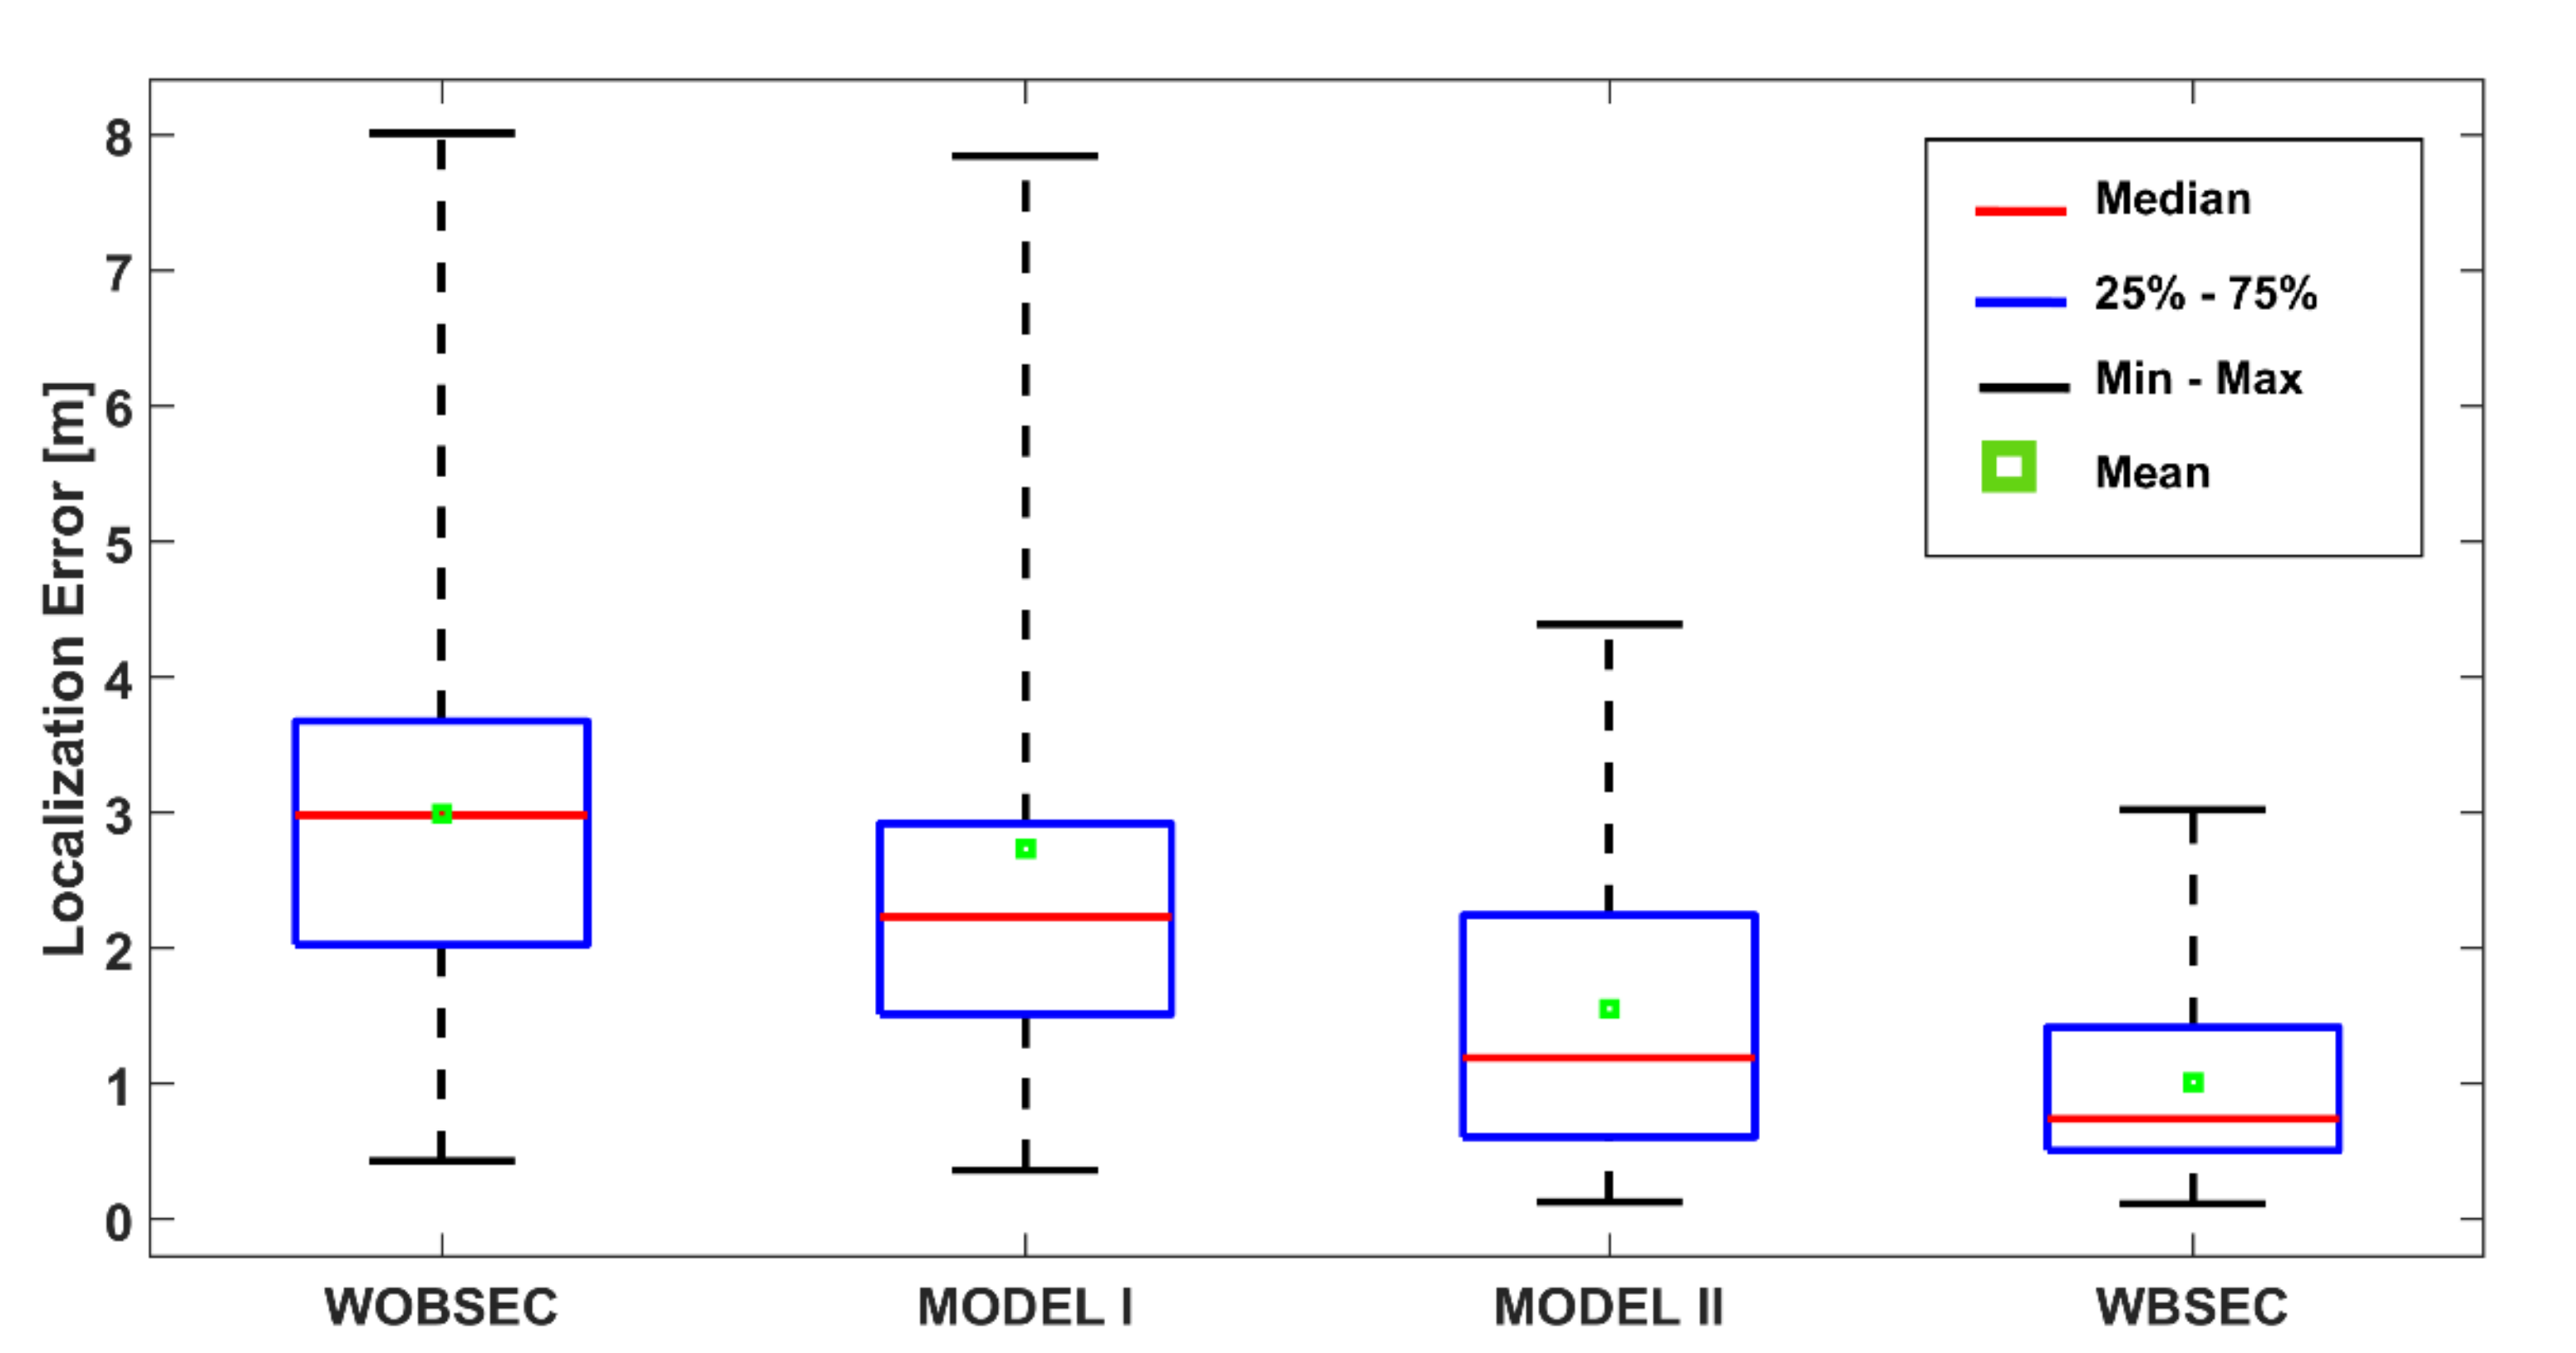
| Method | Min. (m) | Max. (m) | Mean (m) | Median (m) | STD (m) | 25th (m) | 75th (m) | 90th (m) |
|---|---|---|---|---|---|---|---|---|
| WOBSEC | 0.43 | 8.01 | 2.99 | 2.98 | 1.65 | 2.03 | 3.68 | 4.58 |
| MODEL I | 0.36 | 7.85 | 2.74 | 2.23 | 1.92 | 1.51 | 2.92 | 6.29 |
| MODEL II | 0.13 | 4.39 | 1.56 | 1.19 | 1.14 | 0.61 | 2.25 | 3.14 |
| WBSEC | 0.12 | 3.02 | 1.01 | 0.74 | 0.73 | 0.51 | 1.42 | 1.99 |
Publisher’s Note: MDPI stays neutral with regard to jurisdictional claims in published maps and institutional affiliations. |
© 2021 by the authors. Licensee MDPI, Basel, Switzerland. This article is an open access article distributed under the terms and conditions of the Creative Commons Attribution (CC BY) license (https://creativecommons.org/licenses/by/4.0/).
Share and Cite
Mamun, M.A.A.; Anaya, D.V.; Wu, F.; Yuce, M.R. Landmark-Assisted Compensation of User’s Body Shadowing on RSSI for Improved Indoor Localisation with Chest-Mounted Wearable Device. Sensors 2021, 21, 5405. https://doi.org/10.3390/s21165405
Mamun MAA, Anaya DV, Wu F, Yuce MR. Landmark-Assisted Compensation of User’s Body Shadowing on RSSI for Improved Indoor Localisation with Chest-Mounted Wearable Device. Sensors. 2021; 21(16):5405. https://doi.org/10.3390/s21165405
Chicago/Turabian StyleMamun, Md Abdulla Al, David Vera Anaya, Fan Wu, and Mehmet Rasit Yuce. 2021. "Landmark-Assisted Compensation of User’s Body Shadowing on RSSI for Improved Indoor Localisation with Chest-Mounted Wearable Device" Sensors 21, no. 16: 5405. https://doi.org/10.3390/s21165405