1. Introduction
Surface plasmon polaritons (SPPs) are localized electromagnetic wave modes that propagate at the interface between a metal and dielectric material. The excitation of SPPs is possible only under specific conditions regarding the exciting light wavelength, the incidence angle, and the refraction index of the material surrounding the metal layer. This latter property makes them particularly useful in sensing applications.
The electric field of SPPs is highly localized, which enables the miniaturization of plasmonic devices [
1]. Typically, the main design challenge of such devices is in overcoming the absorption [
2], which results in a widespread use of noble metals, especially in the spectral range of visible light. However, the usual materials cannot be used beyond visible wavelengths [
3]. On the other hand, aluminium is a promising candidate for UV plasmonics due to its particularly large bulk plasma frequency [
4]. With the appropriate geometry, low absorption and considerable propagation distances can be achieved [
5].
There are many promising application fields of UV plasmonics, such as biomedical imaging [
6,
7], thickness measurement [
8], photoacoustics, electrochemistry [
9], and label-free DNA and single molecule sensing [
9,
10]. Due to the fact that many media exhibit a significant absorption in the UV region, an SPP sensor in this spectral range may be characterized by particularly good material selectivity and sensitivity [
11]. Currently, with the rapid development of technology and the need for specialized plasmonic sensors in the ultraviolet wavelength region, aluminium has become a favoured metal for designing such devices with its combination of low cost and ease of fabrication [
6,
12,
13].
Here, we investigate the performance of Al-based plasmonic sensors in the near ultraviolet spectral region. One of the characteristic features of Al is the native oxide layer that appears when the Al film is exposed to air. This, as a consequence, influences the UV-SPPs sensing performance. The integration of a passive oxidation layer into the device design not only allows for its operation in normal atmospheric conditions but may also be used for the detection of oxidizing agents, such as ozone [
14]. Due to the fact that the thicknesses of both the Al film and Al
2O
3 layers affect the sensor performance, it is crucial to optimize the geometry of the sensor.
In contrast to the nanoparticle- [
6] and nanostructure- [
8] based approaches, we started from the basic case of a continuous metal layer that was easy to fabricate. The oxidation layer inherent to the Al surface was taken into account as an integral part of the structure. In the experimental study by Tanabe and Tanaka [
11], the reflectance of an Al surface was found to be consistent with a theoretical model that assumed a fixed 4-nm oxide layer. Here, we present a general theoretical and numerical approach using the thickness of the Al
2O
3 as one of the optimization parameters of the plasmonic sensor and indicating how the oxide layer thickness can be optimized for specified operating conditions. Moreover, the possibility of enhancing the sensitivity by a modification of the geometry of the oxide surface is explored.
The paper is organized as follows. In the first section, the basic theory of SPP propagation is presented, and the reflection coefficient of a four-layer system is derived. Then, the details of finite-difference time-domain simulation are described, with a particular focus on modelling the optical properties of the dispersive media in the system. In the next section, theoretical and numerical results are presented. Following that, the results are discussed and compared with the experimental data. Finally, in the last section, our conclusions are presented.
2. Theory
The SPPs are localized electromagnetic excitations that occur on an interface between two media that exhibit opposite signs of dielectric permittivity for some frequency
. Usually the material with negative permittivity
is a metal, and the one that is characterized by
is dielectric. Such a system is described with the help of the Maxwell’s equations with boundary conditions at the metal–dielectric interface. In solving this set, one obtains the wave vector
of the SPP. Particularly, a plasmonic mode propagating along the interface is characterized by a component parallel to the interface [
1]
where
and
are, respectively, the real and imaginary parts of the wave vector component, and
c is the vacuum light velocity. For real values of
and
, one obtains a real wave vector when
and
. In such a case, propagating SPPs can be excited. However, an effective excitation is possible only when the parallel wave vector component of the incident light matches
; this puts limits on the incidence angle
. The permittivity
is directly related to the refraction index
.
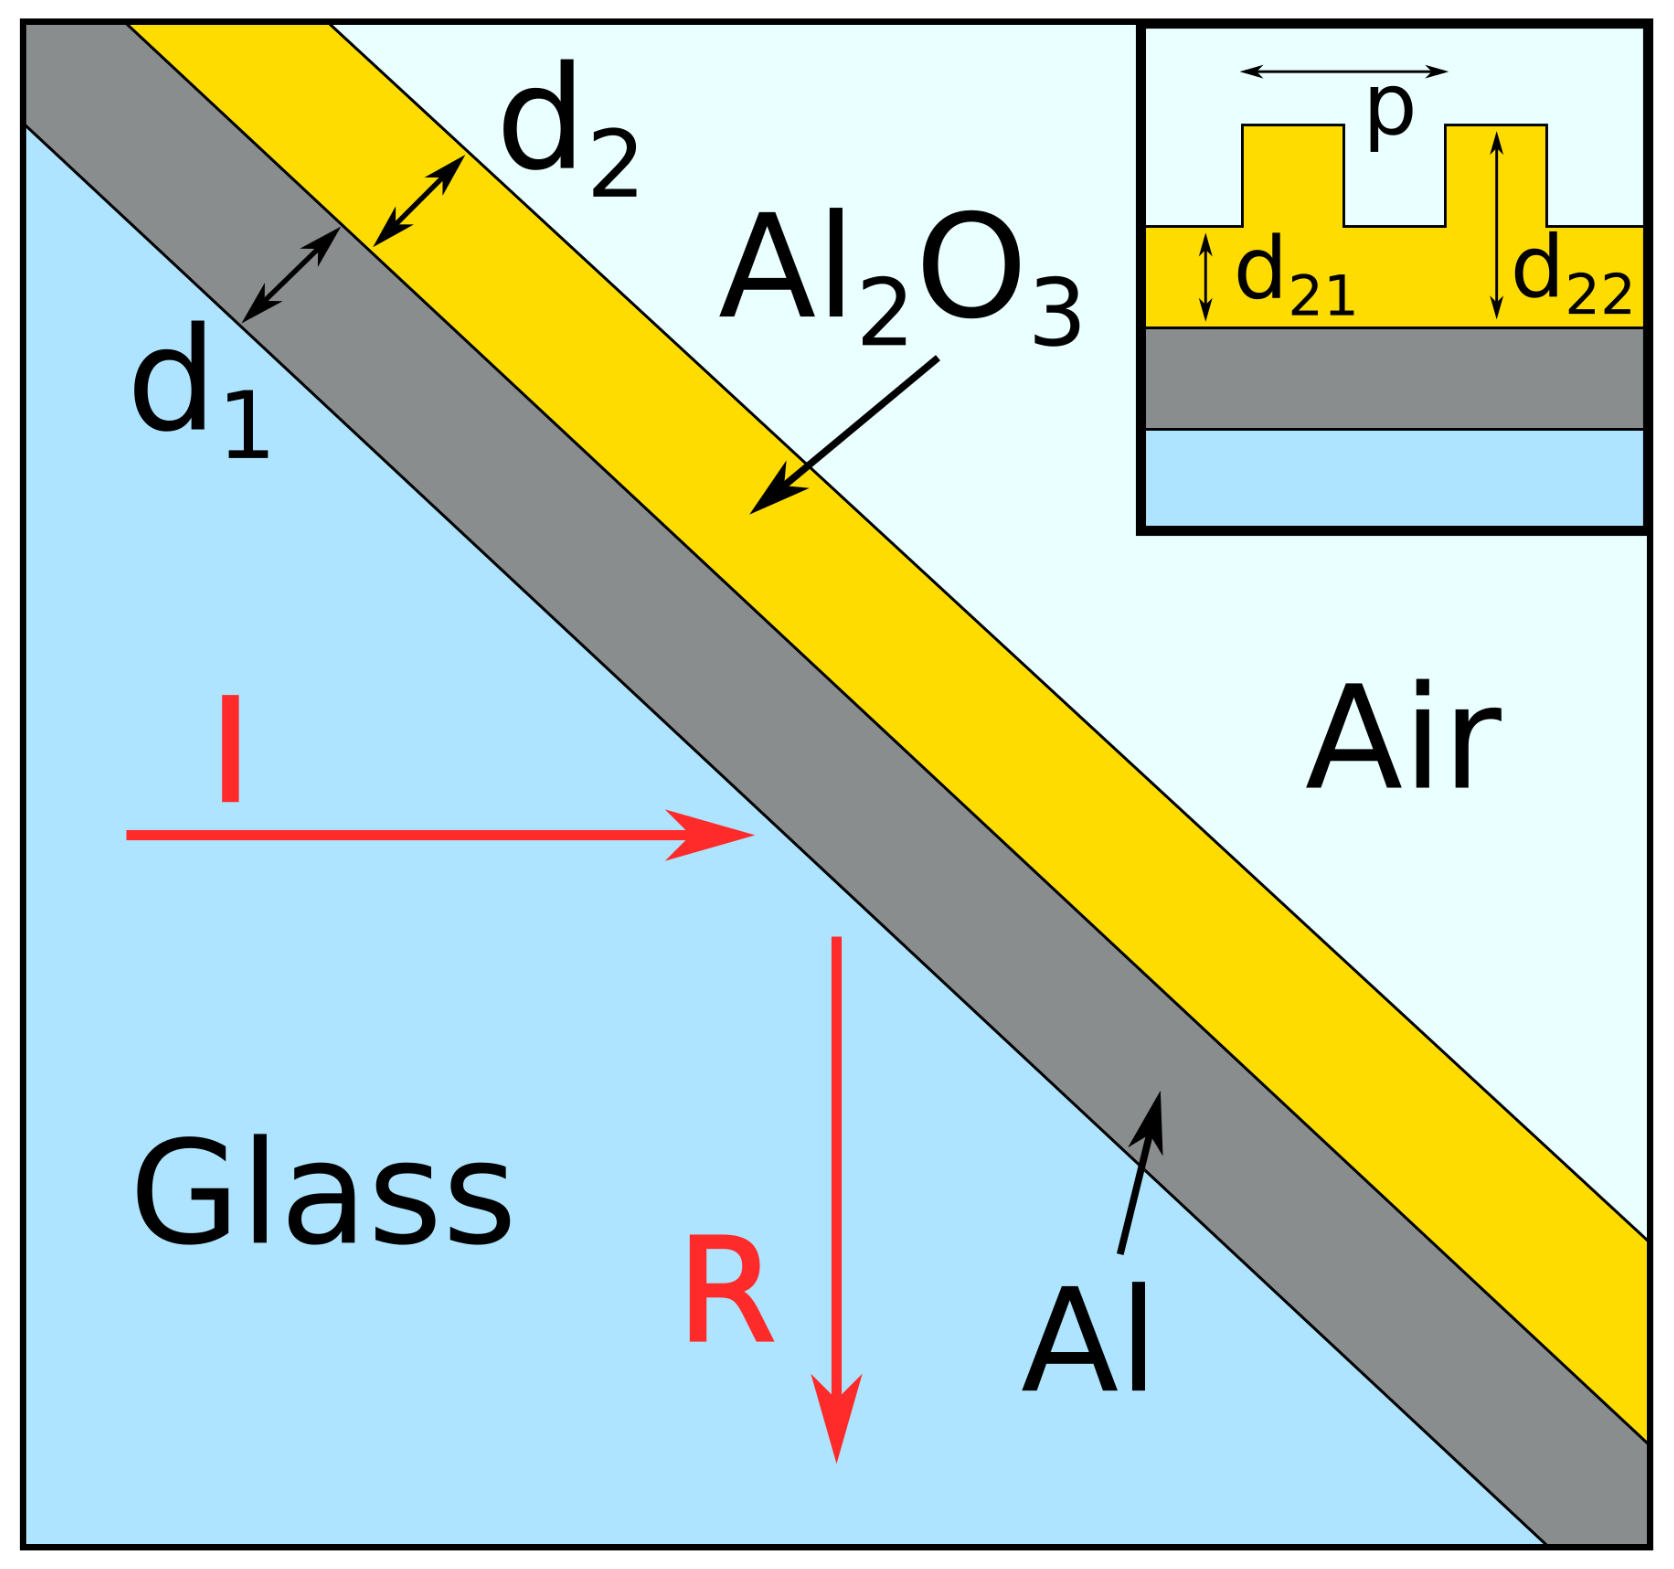
In this paper, we examined a plasmonic sensor in a form of a four-layer structure with the general geometry as shown in
Figure 1. The setup follows the Kretschmann configuration [
15], where the incident light
I propagates in a glass prism (characterized by the permittivity
). The light on an Al layer of the thickness
is at the angle of incidence
degrees. The third layer is aluminium oxide (Al
2O
3) with the thickness
.
Finally, the last medium is either air or some material characterized by the permittivity , which is measured by the sensor. The wavelength values referred to throughout the manuscript are the free space wavelengths of the source , where is the source frequency. The wavelength of the surface plasmon is shorter by a factor , where is the effective refraction index of the plasmon, which can be derived from its dispersion relation .
For SPPs in the ultraviolet range (
nm), one has
. We consider a wide range of Al and Al
2O
3 layer thicknesses; the starting point was the system presented in [
11], where a 19-nm Al layer with a natural 4-nm oxide layer was used. The performance of thicker aluminium layers up to 44 nm is investigated. For the Al
2O
3, we consider values up to
nm, which can be produced with electron beam evaporation [
16].
One can calculate the reflectivity
R of
N parallel layers system using Parratt’s recursive method, which treats the system as a stratified medium on top of an infinitely thick substrate [
17]. We assume that the substrate and the surroundings are semi-finite and that the inner materials have finite thickness
. Each layer is described by the dielectric function
, where
i = 1, …, N + 1. The dielectric functions are described by the Drude–Lorentz model
which describes the optical properties of the medium in terms of harmonic oscillators (
j = 1, 2, …,
J) with plasma frequencies
, resonance frequencies
, and damping constants
. These parameters were obtained by fitting the permittivity given by Equation (
2) with two oscillators to the experimental data [
5]. In particular, we use the data for Al [
4] and Al
2O
3 [
18], while the permittivity of glass is assumed to be a constant
, and the permittivity of air is
. In the simulations where the refraction index sensing is tested, air is replaced with another medium with
. The fitted model values are shown in
Table 1.
The value of the wave vector of a plane wave with angular frequency
, propagating in the medium
i (
i = 1, …, 4) is given by
where
is the refraction index of the medium
i. For a given incidence angle
, the components of wave vector parallel to surface
and perpendicular
are given by
Using these values, one can derive the Fresnel coefficient,
for each interface between the layers
i and
. Additionally, each of the layers of thickness
introduces a phase shift
. In the system described in this paper, there are only two layers of the finite thicknesses, marked
and
: the metal characterized with permittivity
and thickness
and the oxide layer characterized by
,
. The values of
and
are taken as 0 due to the fact that the phase shifts
and
in these media are irrelevant to the solution. Parratt’s recursive relation yields
The recurrence relation may be solved for
, which then provides the total reflectivity of the system
. Since the last layer is infinite, there is no reflection at its end, and hence
. In the presented four-layer case, one can obtain an analytical solution
3. Numerical Simulations
The Finite-Difference-Time-Domain method is a valuable tool in the analysis of plasmonic systems. The method consists of solving Maxwell’s equations in a finite region that is divided into a spatial grid of discrete values. An in-house MATLAB code from our previous work [
19] was adapted to the simulation of a four-layer structure. Expressions for time evolution of the electric and the magnetic field were derived and integrated with finite time step.
The spatial simulation domain used in this work was two-dimensional. The whole domain was divided into a rectangular grid with a single cell size . The magnetic field was perpendicular to the plane, and the electric field had two components in the plane of incidence located at every cell of the grid. Calculations of reflection spectra were performed in a square computational domain with the size of 300 × 300 cells of equal size = 4 nm, which was the minimum structure size that could be simulated.
The domain size of 1200 × 1200 nm was sufficient for the simulation of propagating waves up to
nm before diffraction-related issues became severe. The computational domain was terminated with a 30-cell thick absorbing layer characterized by the reflection coefficient of
. The Auxiliary Differential Equations (ADE) method [
20] based on a Drude model was used. Medium polarization
was computed by solving a second-order partial differential equation in the form
for every oscillator
j with the fitted medium parameters: plasma frequency
, damping constant
, and high-frequency permittivity limit
. The full set of equations solved in the FDTD approach is as follows
where
and
are components of the polarization vector,
and
are the current densities in the directions
x and
y, and
and
are the vacuum permittivity and permeability, respectively. Unit normalisation is used so that
. The above equations are rearranged to obtain time derivatives of the
,
, and
fields, which are then used to calculate the field evolution with a constant time step
. The used value
is the upper limit of stability of the used ADE scheme and is slightly below the upper limit of 2-dimensional FDTD (
). To obtain the reflectivity at a single frequency, the simulation runs for 2500 time steps with a monochromatic source of radiation. The mean ratio of incidence to reflected power was calculated for the last 1000 steps, where steady-state conditions were established.
4. Results
The first step in a design of a plasmonic sensor is the determination of the optimal conditions in which SPP resonance occurs. The main parameter that has to be determined during the fabrication process is the thickness of the Al layer.
Figure 2 shows the results for different values of
. In general, a thicker layer results in a shallower reflection dip with a slightly smaller spectral width.
The oxidation layer that always appears on the surface of Al has a pronounced impact on the reflectivity spectrum of the metallic layer. This provides an additional degree of freedom in the sensor design due to which one can influence the width of the layer during the fabrication process. The calculation results based on Equation (
8), for selected values of
are shown in
Figure 3. The general structure of reflectivity
on
Figure 3a is in excellent agreement with the results presented in [
11] for the comparable thicknesses
and
. The plasmonic resonance occurred in the visible part of the spectrum at small incidence angles of
degrees, quickly moving into the UV range for
degrees.
The fact that the reflectivity spectrum moves significantly with the change of
indicates that the system is sensitive to changes of permittivity in the near vicinity of the Al layer. This is confirmed by the results shown in
Figure 4, where the spectra were calculated for
nm and
nm. An increase of
causes a significant shift of the SPP resonance toward larger incidence angles (
Figure 4a). The shift is roughly three-times greater than in the experimental results in [
11] in which the refraction index (and thus permittivity) was changed only within 2 nm from the metal layer. Such a shift is also comparable to those from more complicated nanostructure-based sensors [
8].
In a realistic system, one can expect some variation in the thickness of the oxidation layer. Therefore, it is useful to go beyond the simple theoretical model described by Equation (
8) and perform an FDTD simulation that is based directly on Maxwell’s equations. In the first test, the multilayer system with
nm and
nm was illuminated by a point source of UV radiation (such as an LED diode), so that a wide range of incidence angles appear.
In such a case, the resulting reflection spectrum is determined by the overall structure of the reflectivity function
as shown in
Figure 3a. As mentioned before, there are two characteristic areas in which the spectrum is independent of
and
, located in the visible and UV parts of the spectrum. This can be seen in
Figure 5 where the FDTD simulation results are presented. There are two pronounced peaks corresponding to the visible light SPPs excited at
degrees and UV SPPs at
degrees. The product of these two reflectivities closely matches the FDTD results. Thus, one can obtain significant, easily measurable reflectivity dips even when the incident angle is not precisely specified.
Next, the sensitivity of the plasmonic sensor to the changes of permittivity
was tested. The simulation results are shown in
Figure 6a. The incidence angle was set to
degrees. Again, there was a fairly good match between the theoretical predictions and FDTD results. A
change of
(
change of
) resulted in a 20 nm shift of the reflection minimum, which is comparable to the results presented in [
8].
To better assess the performance of the sensor, one can compute the shift of the reflection minimum with the change of
. The results are shown in
Figure 7.
One can see that the changes of the position of the minimum are very similar regardless of
, with the exception of a very small metal thickness and large
(
Figure 7a). The change of the oxide layer thickness
resulted in a considerable shift of the minimum but had only a minimal influence on how the system responded to the changes of
. The rate of change of the wavelength of the reflectance dip
in response to the changes of
was the sensitivity
[
21]. To accurately resolve the location of the dip, the full-width half-maximum (FWHM) of the minimum should be small. Thus, one can introduce another important performance parameter—the figure of merit
. Finally, one can calculate the Q factor
. These parameters, calculated for an incidence angle of 60 degrees, are shown in
Figure 8.
Overall, the peak sensitivity of nm was achieved in the limit of large . However, at this point, the minimum of the reflection was wide, resulting in small values of F and Q. The most well-defined minimum with the highest , occurred at , nm.
Finally, one can modify the geometry of the oxide layer to improve the sensing performance. In particular, let us consider the model of a porous Al
2O
3 layer, which could resemble the realistic experimental situation. In particular, the form of a grating with period
nm and two thickness values of
nm and
nm was used (
Figure 1 inset). Such a structure supports the creation of plasmons with a wavelength that is a multiple of the period [
19]. Here, the value of
p was set so that SPPs could be excited with the source characterized by
nm.
Localized SPP resonances on nanostructures [
6,
7] have the form of standing wave modes that may provide a superior spectral resolution or refraction index sensitivity as compared to a smooth surface. It should be stressed that, in opposition to the studies of Al nanoparticles or rough surfaces [
22], here, only the oxide layer on the surface is modified, which potentially simplifies the fabrication.
The results are presented in
Figure 6b. One can see that introduction of the grating gave rise to an additional reflection minimum at the wavelength equal to the grating period. Interestingly, in the grating system, the reflectivity contained the minimum corresponding to
nm but not
nm. The grating-related minimum was relatively narrow, comparable to that obtained for
nm despite the fact that the effective thickness of the layer with the grating was considerably larger.
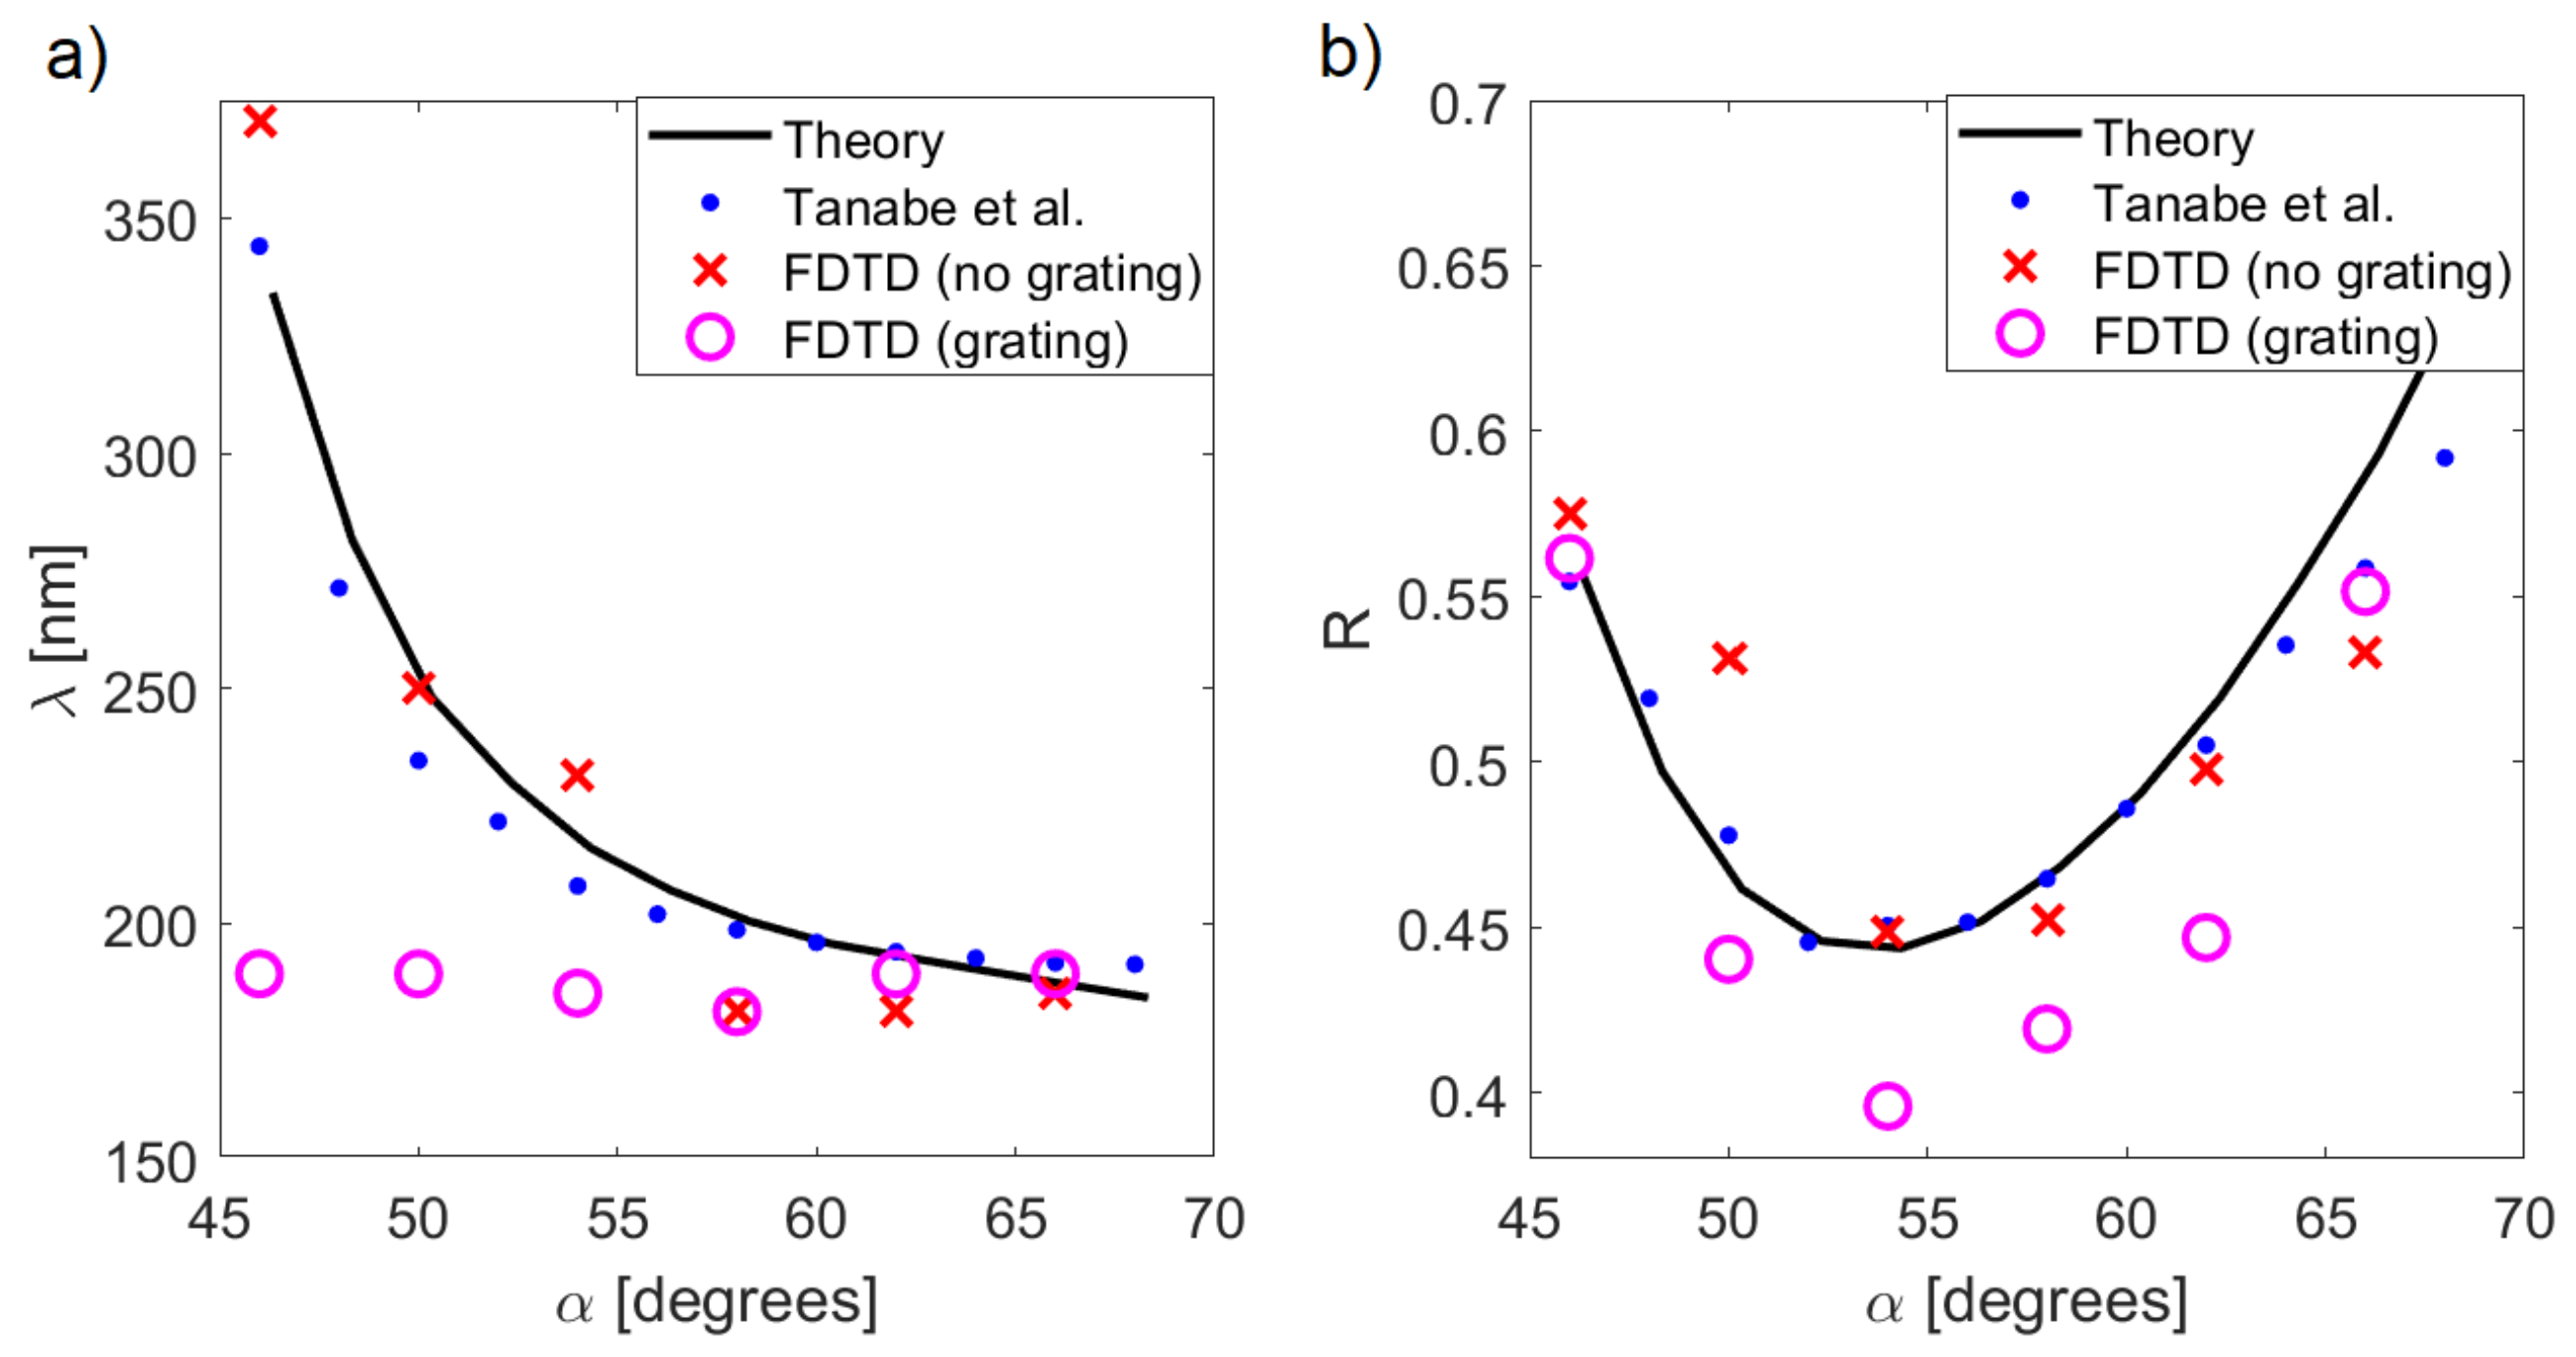
To further study the effect of the grating, the location of the reflectivity minimum and the smallest value of R were obtained for a range of angles
. The results are shown in
Figure 9. There was excellent agreement between the theoretical predictions given by Equation (
8) and the experimental data [
11]; the minimum shifts were from
nm at
degrees to
nm at
degrees (
Figure 9a). The largest drop of reflectivity occurred at an intermediate angle of 54 degrees, where
(
Figure 9b).
The FDTD results followed the same trends, with up to a ∼10% error caused by a finite size of the numerical representation of the system; this introduced diffraction-related effects that resulted in variance of the incidence angle. When a grating with a period nm was added to the oxide layer, the excitation of plasmons by nm source was enhanced, and thus the wavelength of the reflection minimum became tied to this geometric feature of the system and did not change with the incidence angle.
The fixed wavelength meant that the effective excitation of SPPs was more dependent on the proper incidence angle. In
Figure 9b, the reflection minimum of the grating system was deeper at
degrees, which is the optimal conditions for exciting plasmons by
nm light (
Figure 9a). Outside this region, the reflectivity was roughly the same as in the no grating system. This result demonstrates that the sensitivity of a plasmonic sensor based on measurement of reflection coefficient at some specified wavelength can be enhanced by an appropriately fabricated oxidation layer on top of the metal.
5. Discussion
The results shown in
Figure 2 indicate that the optimal choice for the metal thickness
depends on the desired trade-off between the magnitude of changes of
R and the angular/spectral resolution. The angle and wavelength corresponding to the reflection minimum did not change with an increase of
. Additionally, with a thicker layer, the overall reflectance away from the SPP resonance approached unity.
The next important parameter is the thickness of the oxide layer. In general, a thin oxidation layer is advantageous for operation in the far-UV part of the spectrum (
Figure 3). In the region of SPP resonance, one can observe an approximately
reduction of reflectivity, which is consistent with the experimental data [
11]. By increasing the thickness of the oxide layer, one can observe a gradual shift of the reflection dip toward longer wavelengths.
The angular and spectral widths of the minimum remain unchanged. Two regions of particular interest are the areas where the spectrum is insensitive to changes of one of the parameters ( or ). In the far UV range, for nm, the SPP resonance occurs in a wide range of angles between 60–70 degrees. Conversely, for the visible part of the spectrum, the angle range is much narrower and centred around degrees; however, the wavelength can vary in the range of 300–500 nm.
The crucial characteristic of the plasmonic sensor is its response to the changes of the refraction index
, which is shown in
Figure 4. Both the central wavelength and the incidence angle of the reflection minimum exhibit considerable shifts for changing
, suggesting that both parameters are useful for the measurement of a refraction index. In particular, a small change of refraction index (∼1.5%), which corresponds to a ∼5% change of
, resulted in an approximately 20 nm shift of the reflection minimum when operating in the far UV regime (lower part of the
Figure 4b) and up to 200 nm in the visible range. However, in the latter case, the minimum is spectrally very wide and thus it cannot be precisely located. On the other hand, the dependence of the incidence angle on
is much closer to linear; the same
% change of the refraction index resulted in a change of roughly 5 degrees for the optimum incidence angle.
Overall, the shift toward larger angles for a given wavelength can be intuitively interpreted; the increased permittivity
serves as an effective extension of the oxide layer with
. Similarly, in
Figure 4b, there is a significant dependence of the resonant wavelength on
. In this particular example, the sensor was the most sensitive for
; the value can be fine tuned by changing the angle or
, for example to adapt the design to aqueous solutions.
The FDTD results in
Figure 5 and
Figure 6 validate the analytical formula in Equation (
8) and confirmed the theoretical predictions regarding the sensor performance. The numerically obtained minima shown in
Figure 6a are only slightly wider than theoretical predictions, and the difference between
and
(
and
, respectively) can be easily resolved. This indicates that, with the proper choice of
,
, and
, the variance of the incidence angle is not very detrimental to the sensor operation.
Figure 7 expands upon the results shown in
Figure 4b; the roughly quadratic shift of the reflection minimum with the changes of
is preserved in a wide range of thicknesses
and
. However, while the position of the minimum remains the same for various values of
(
Figure 2 and
Figure 7a), its size and line width change significantly, which affects performance estimates, such as the Q factor and figure of merit. These parameters, presented in
Figure 8, are similar to the results presented in [
21].
In particular, one can obtain either a comparable sensitivity
, the figure of merit
, and factor
as in [
21], or superior sensitivity
at the expense of the
F and
Q factor. These values can be further fine-tuned by changing
and the angle of incidence. In general,
Q and
F are the largest for some optimal thickness of the metal layer
. This is consistent with the earlier observation that a thicker layer results in a smaller but narrower reflection minimum.
Finally, the simulation results obtained for the system with a grating structure of the oxide layer serve as a general indication of the behaviour of such a system, which is also closely related to realistic, rough surfaces. When the wavelength of the reflection minimum becomes mostly independent of
and instead becomes fixed for the geometric features of the system, the reflectance changes are amplified. This suggests that such a geometry may be beneficial for the sensors that measure the power of the reflected light to detect changes of the refraction index [
23,
24].


