
A Three-Dimensional Microstructure Reconstruction Framework for Permeable Pavement Analysis Based on 3D-IWGAN with Enhanced Gradient Penalty


Abstract
:1. Introduction
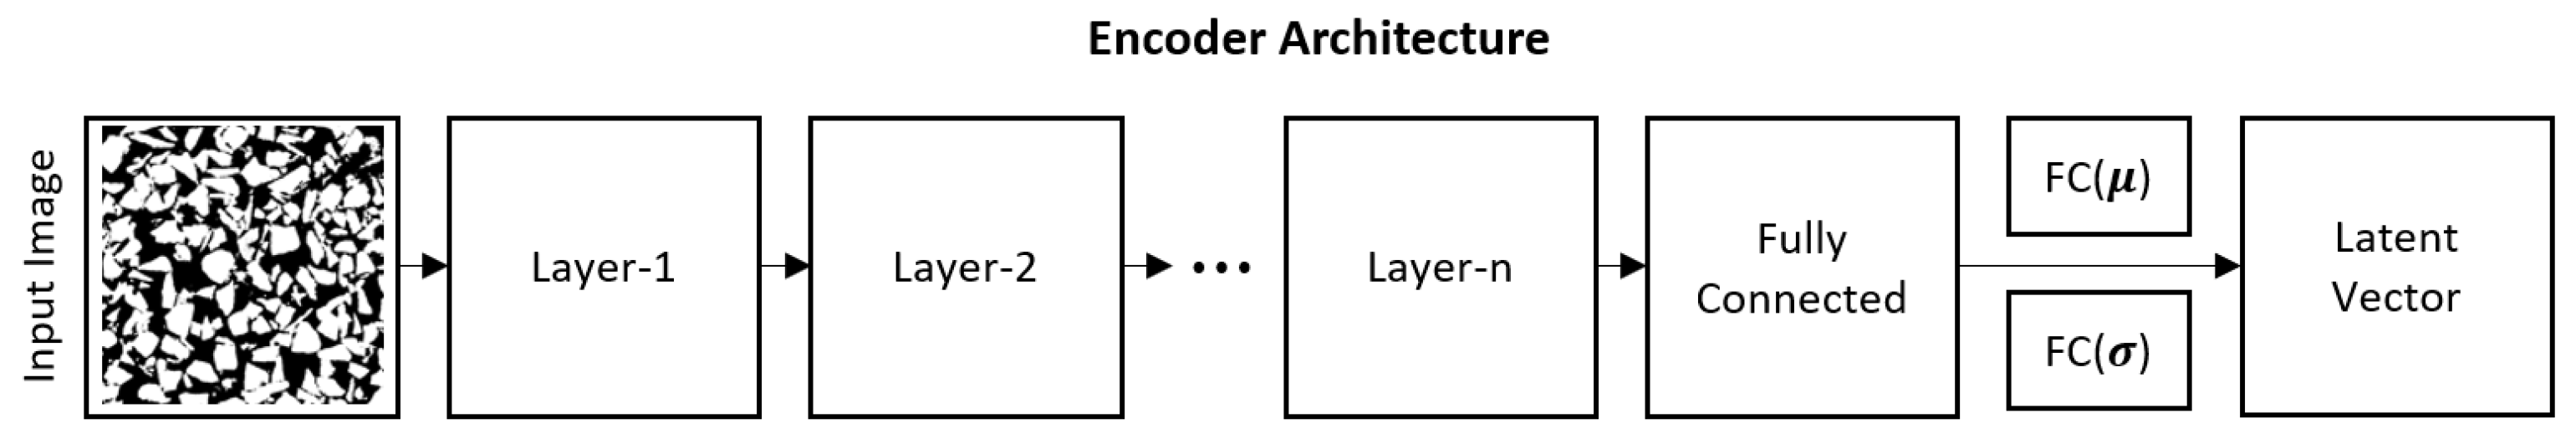
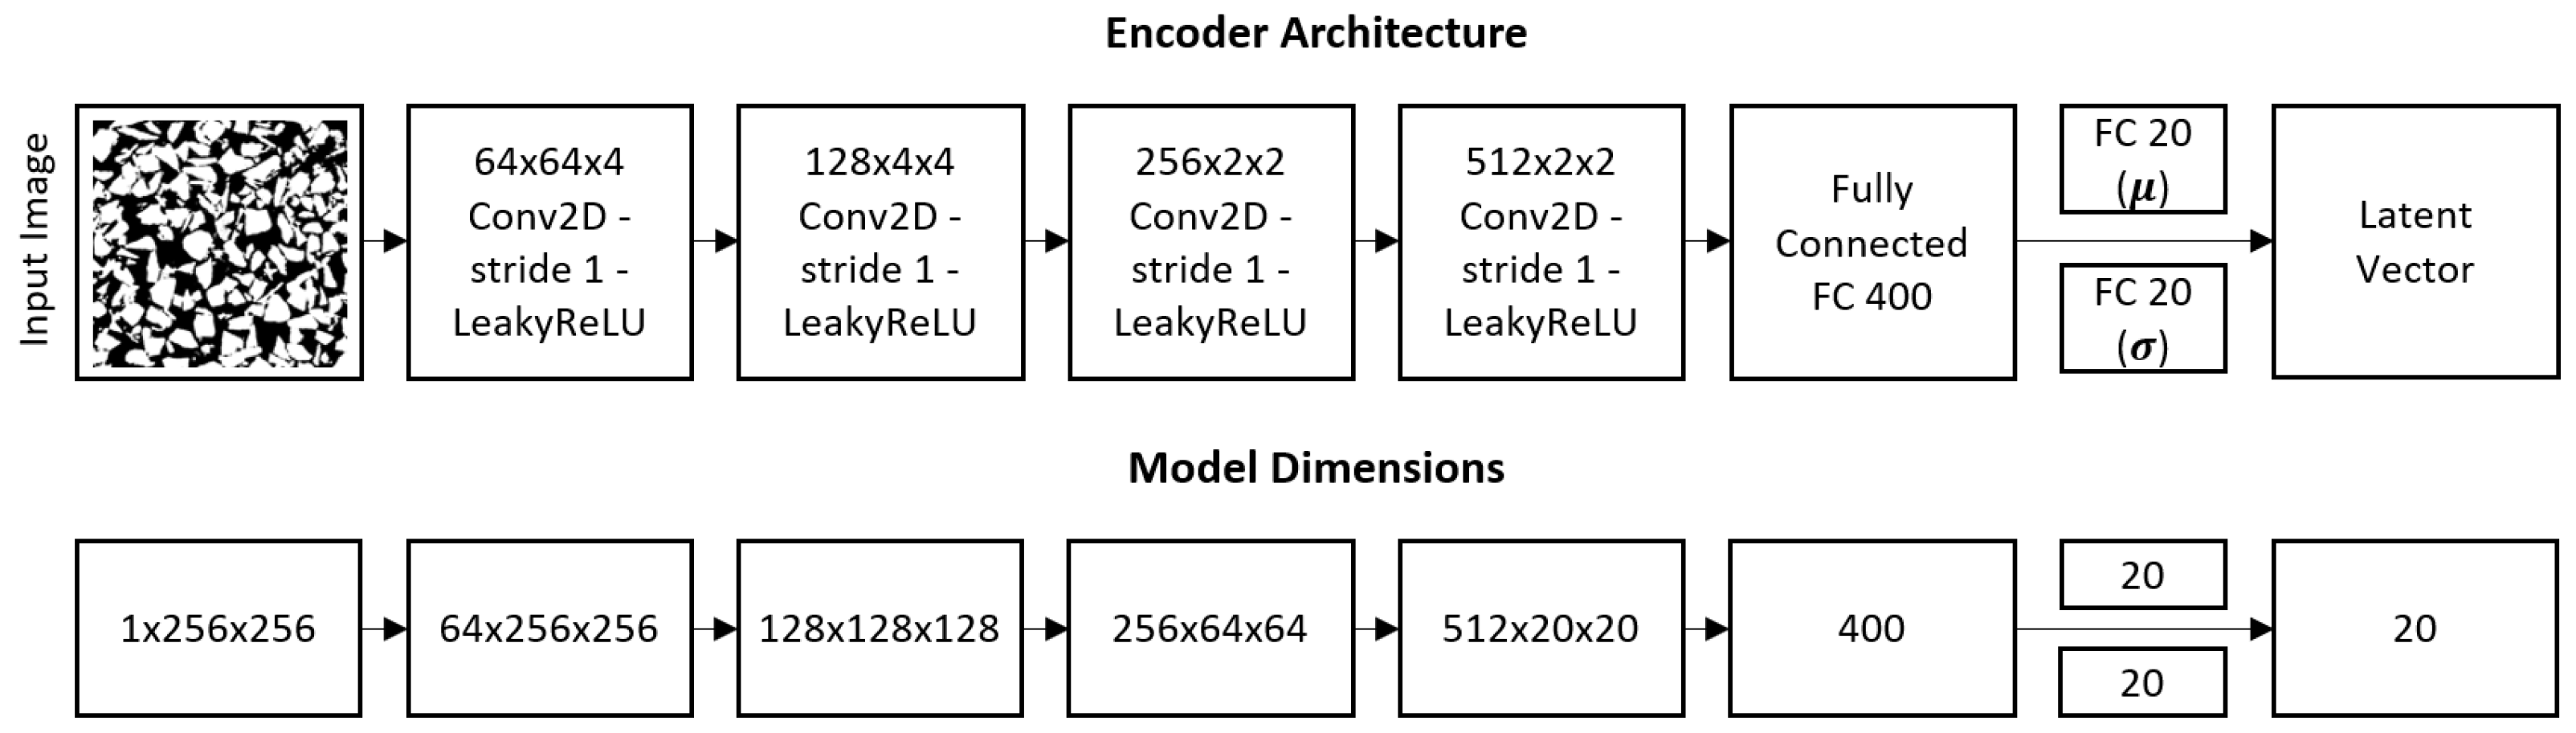
- We propose a deep-learning-based 3D microstructure reconstruction framework for permeable pavement analysis. Our proposed framework can effectively reconstruct a 3D microstructure image after taking only one 2D image. For this purpose, our framework applies several image preprocessing techniques to the input 2D images and extracts the latent features from them via the variational autoencoder (VAE) method.
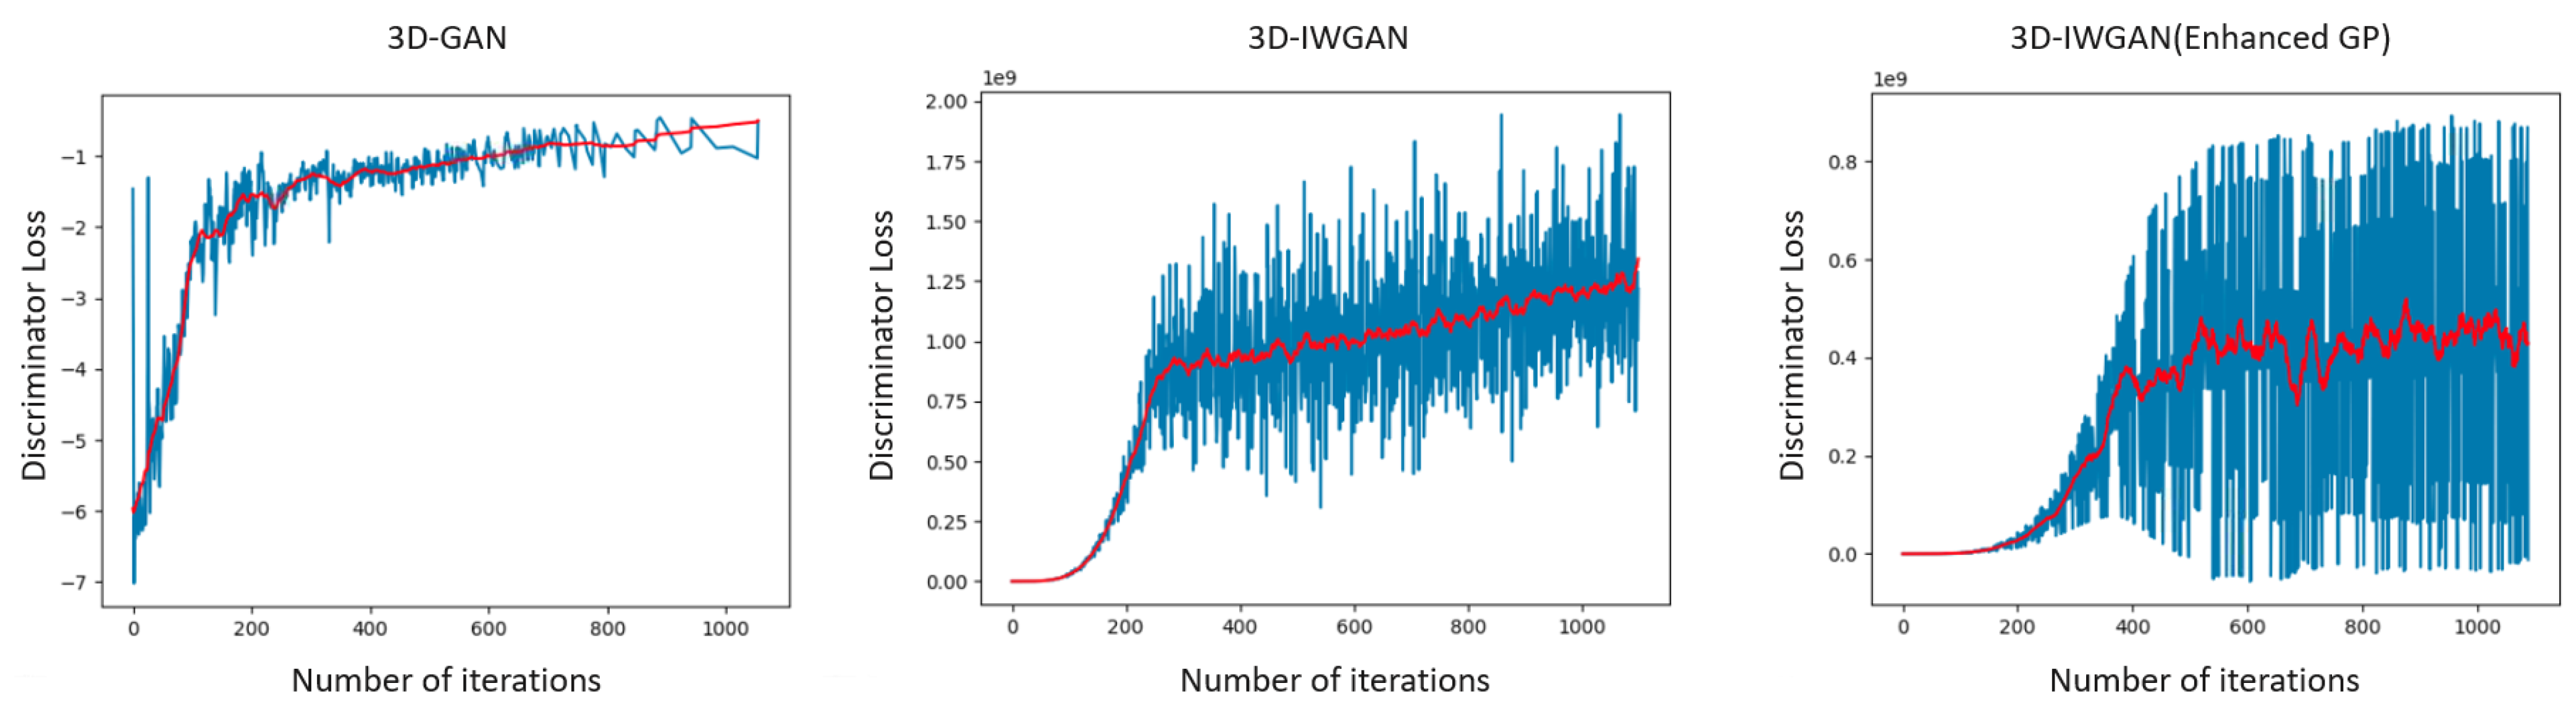
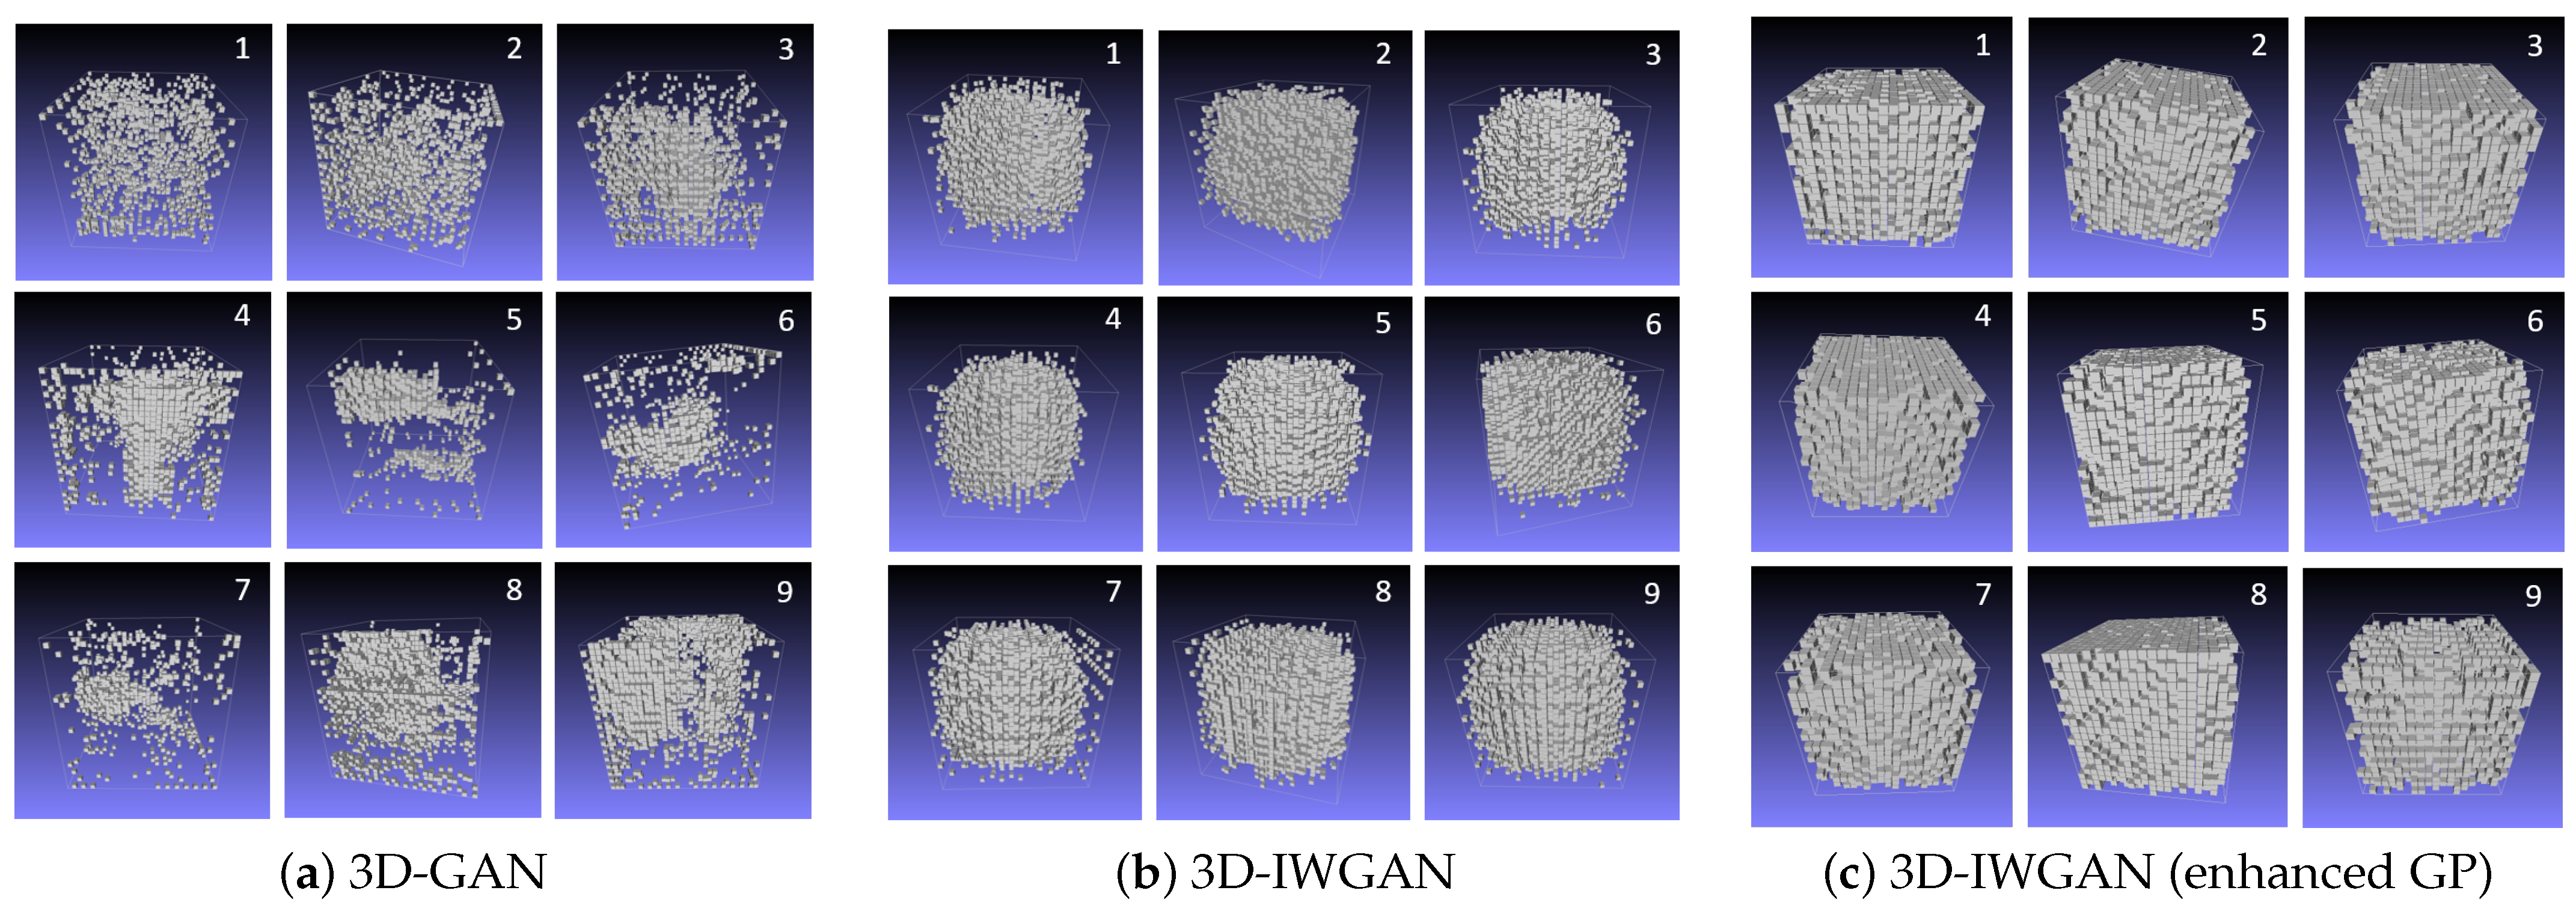
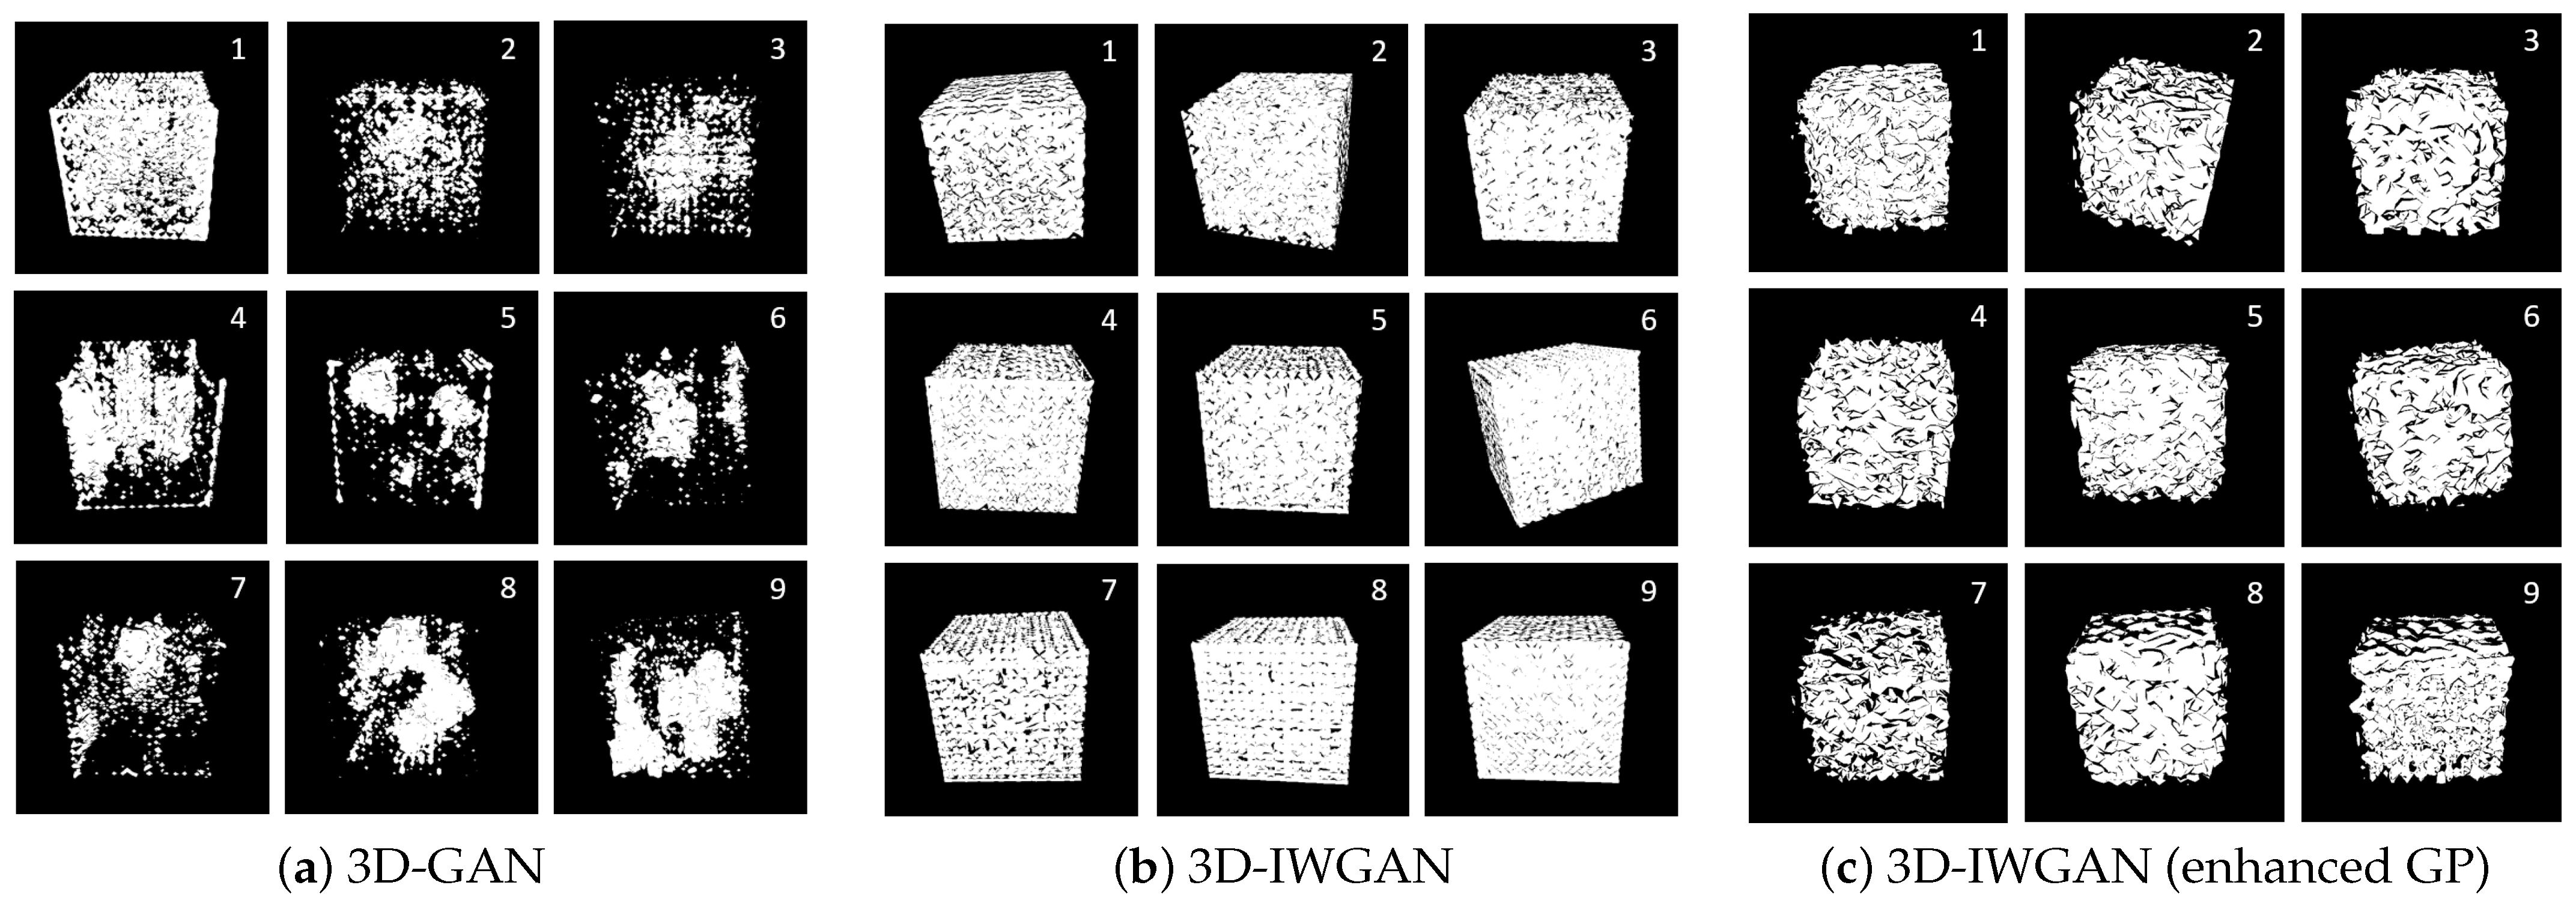
- In comparison to other generative adversarial network methods, we obtained more realistic 3D microstructure images of porous pavements and stable outputs. This stability is the main result of using 3D-IWGAN with an enhanced gradient penalty.
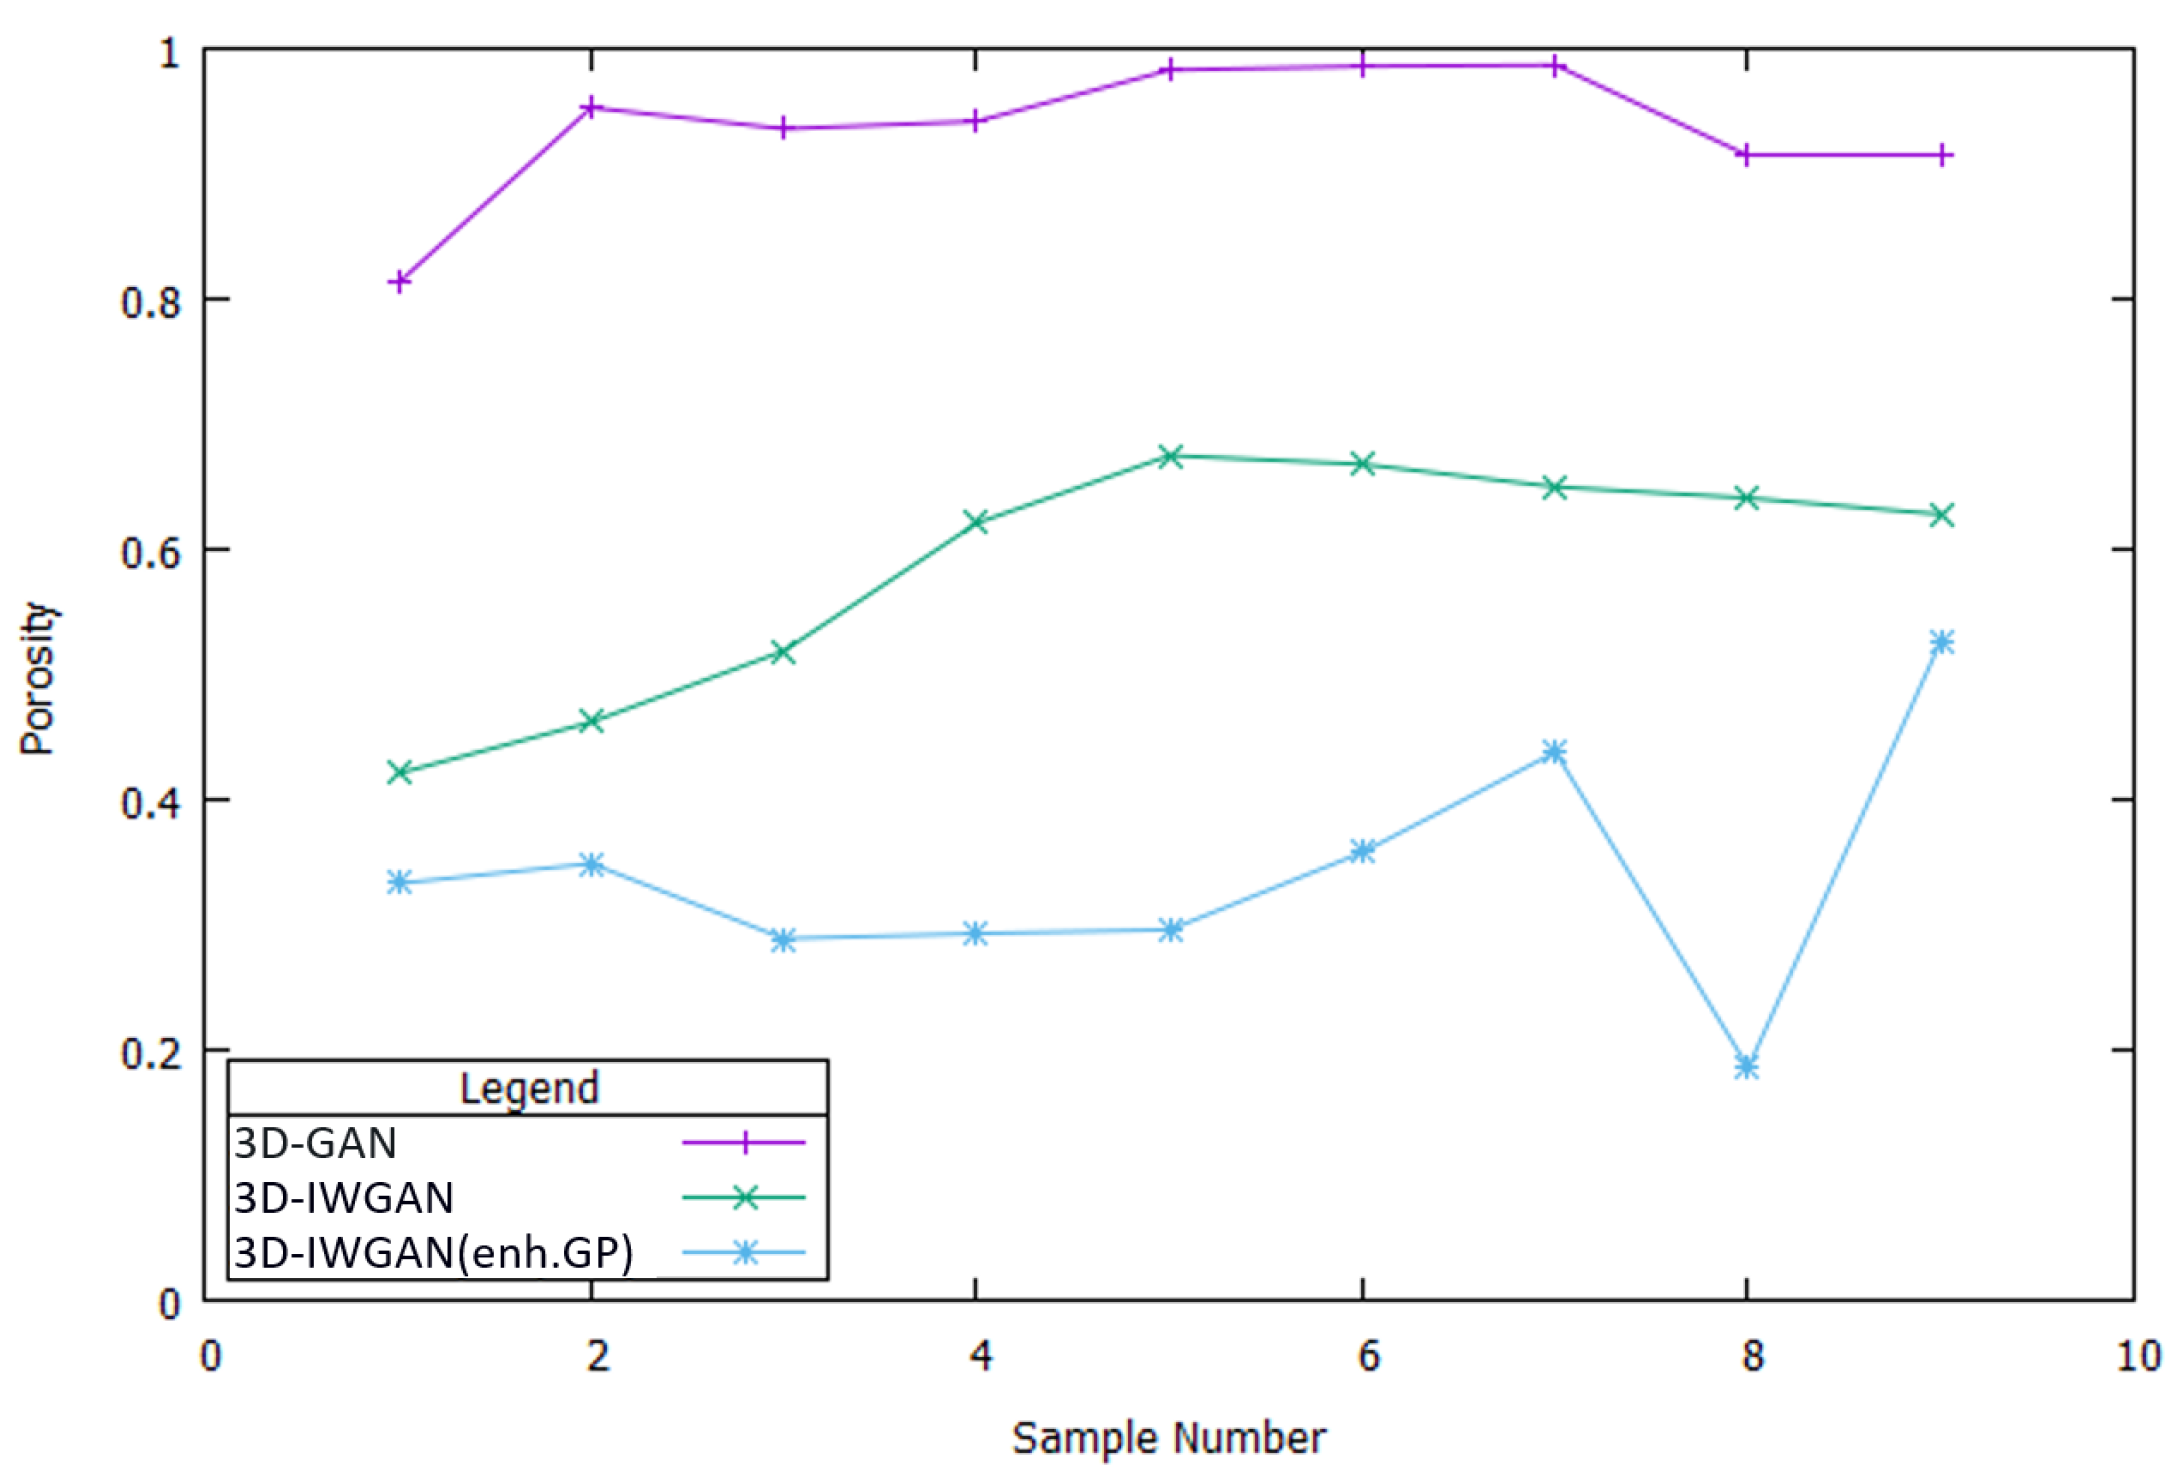
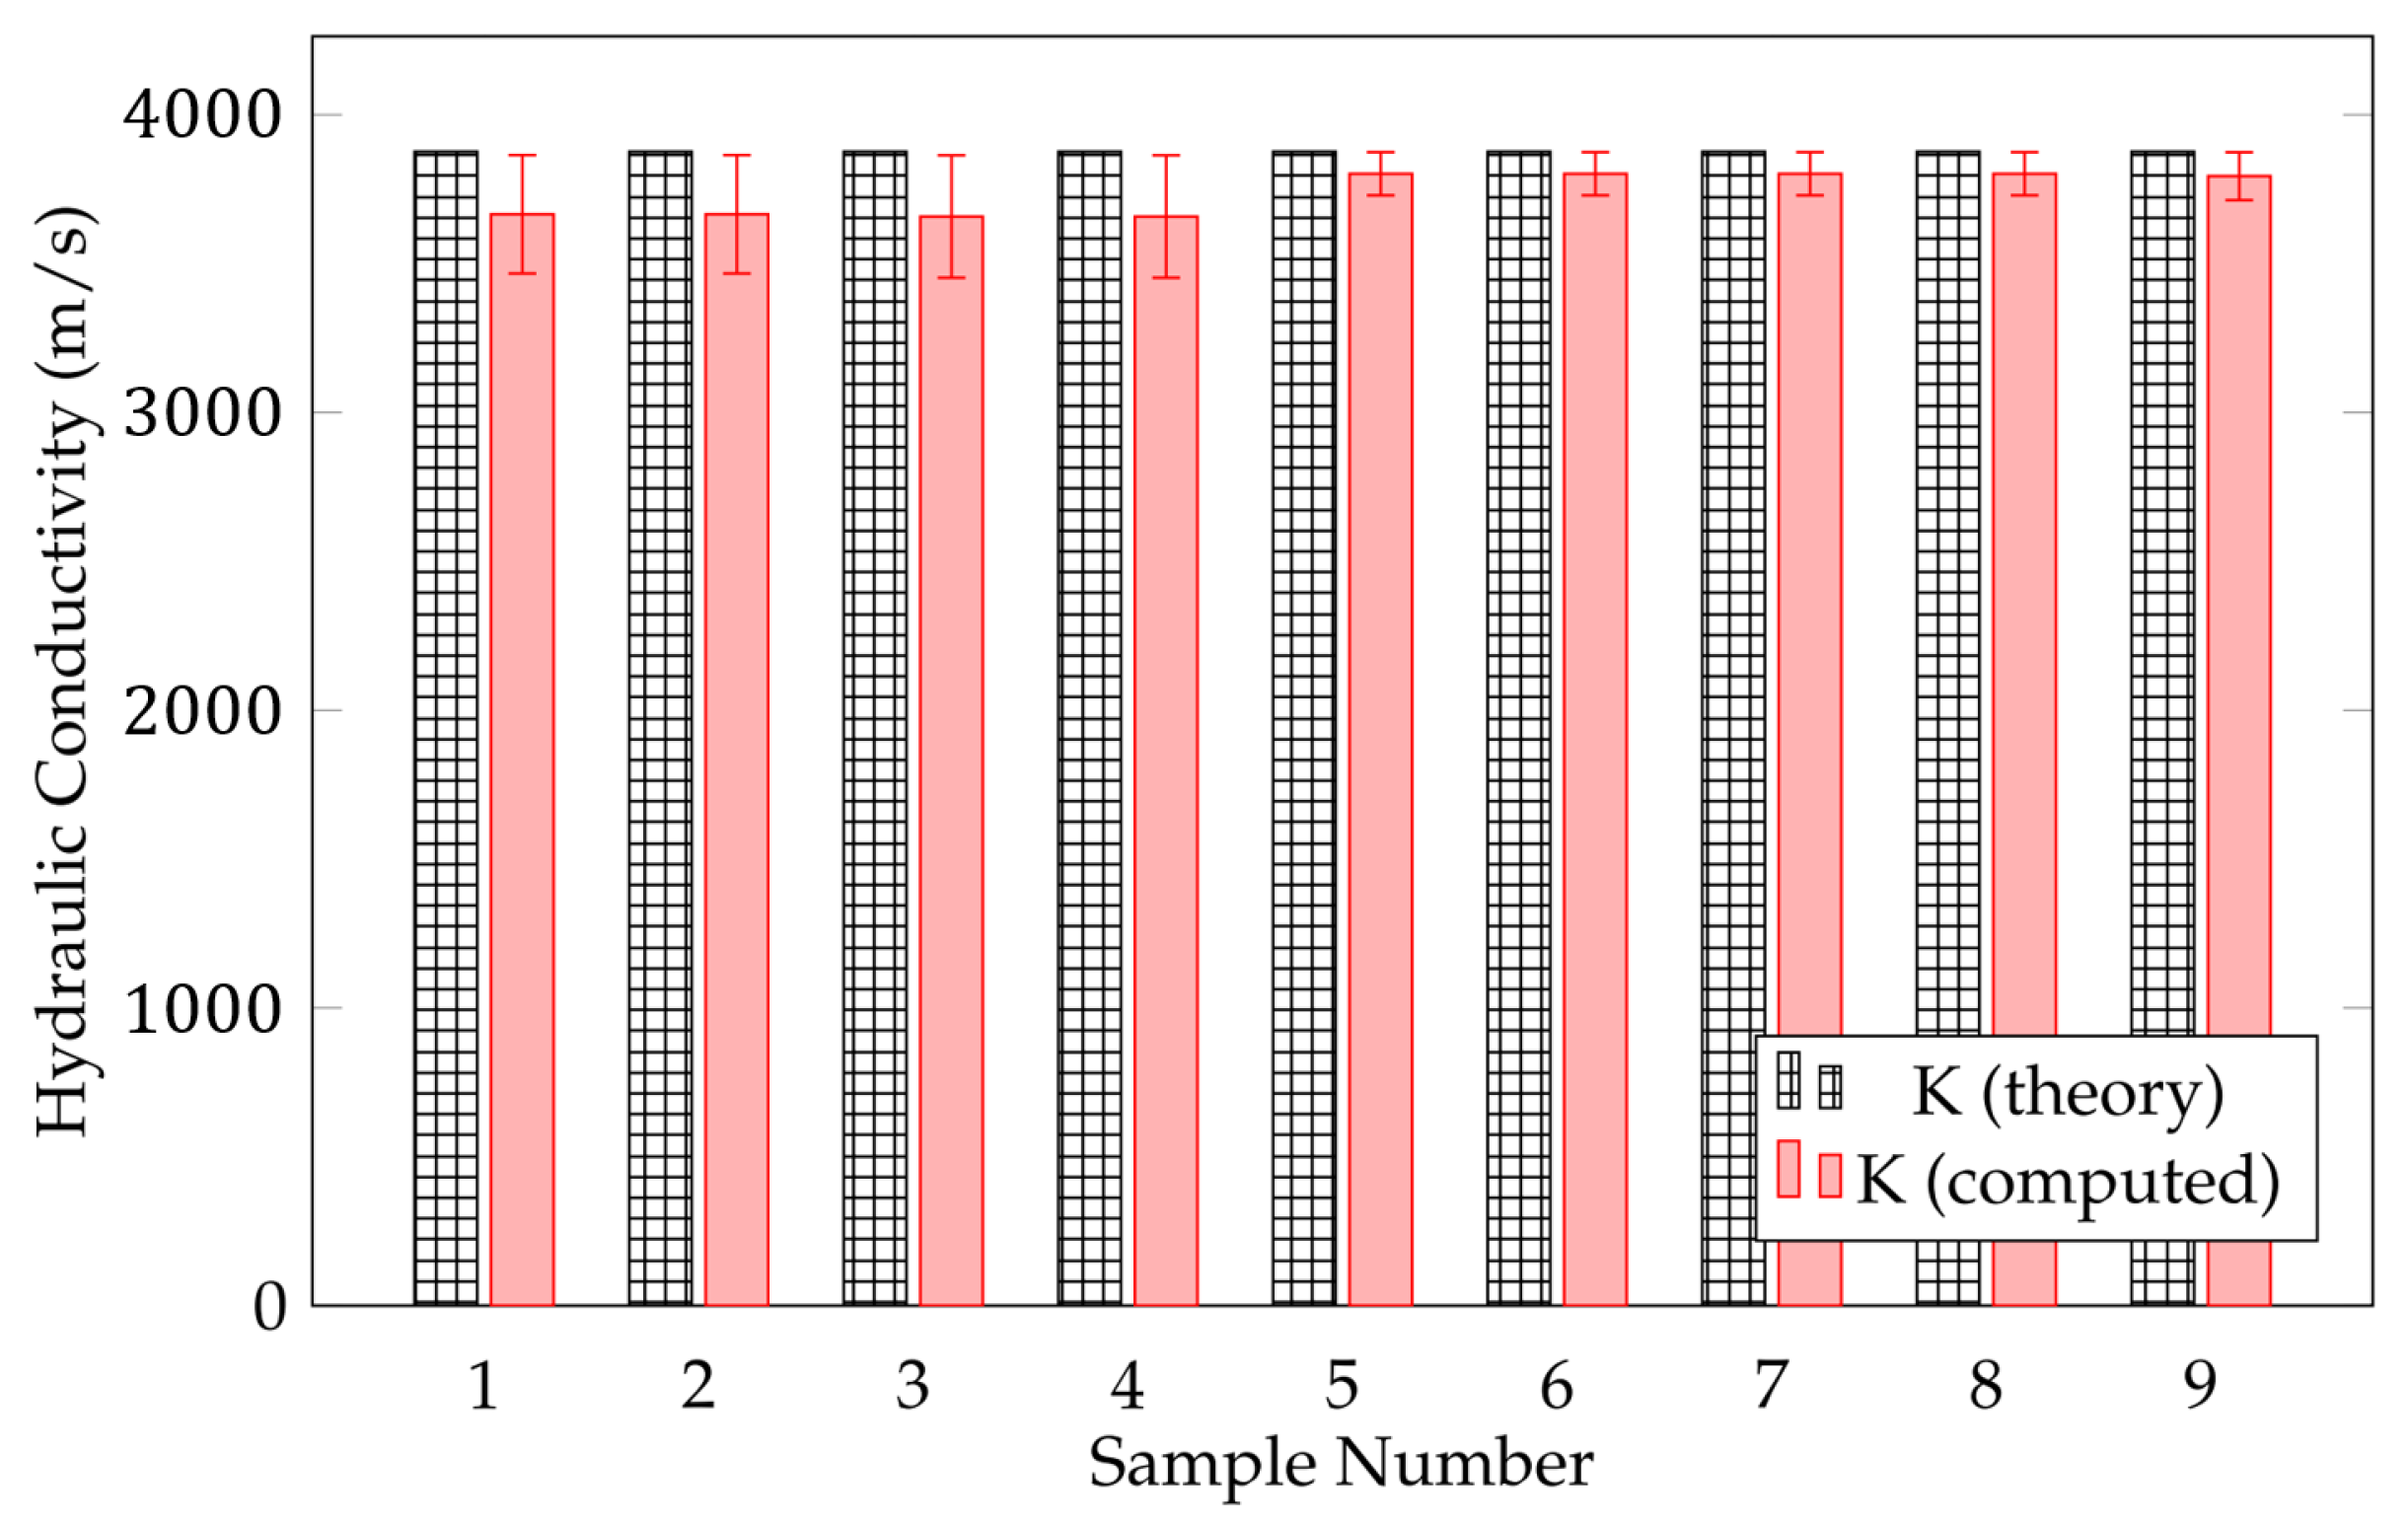
- The accuracy of our results has been verified by evaluating some physical properties extracted from the generated 3D samples. On observing nine different output samples, the average error difference in hydraulic computation was found to be less than 5%.
2. Related Work
2.1. Microstructure Reconstruction
2.2. General 2D/3D Object Reconstruction
2.3. Deep-Learning-Based Microstructure Reconstruction
3. Preliminaries
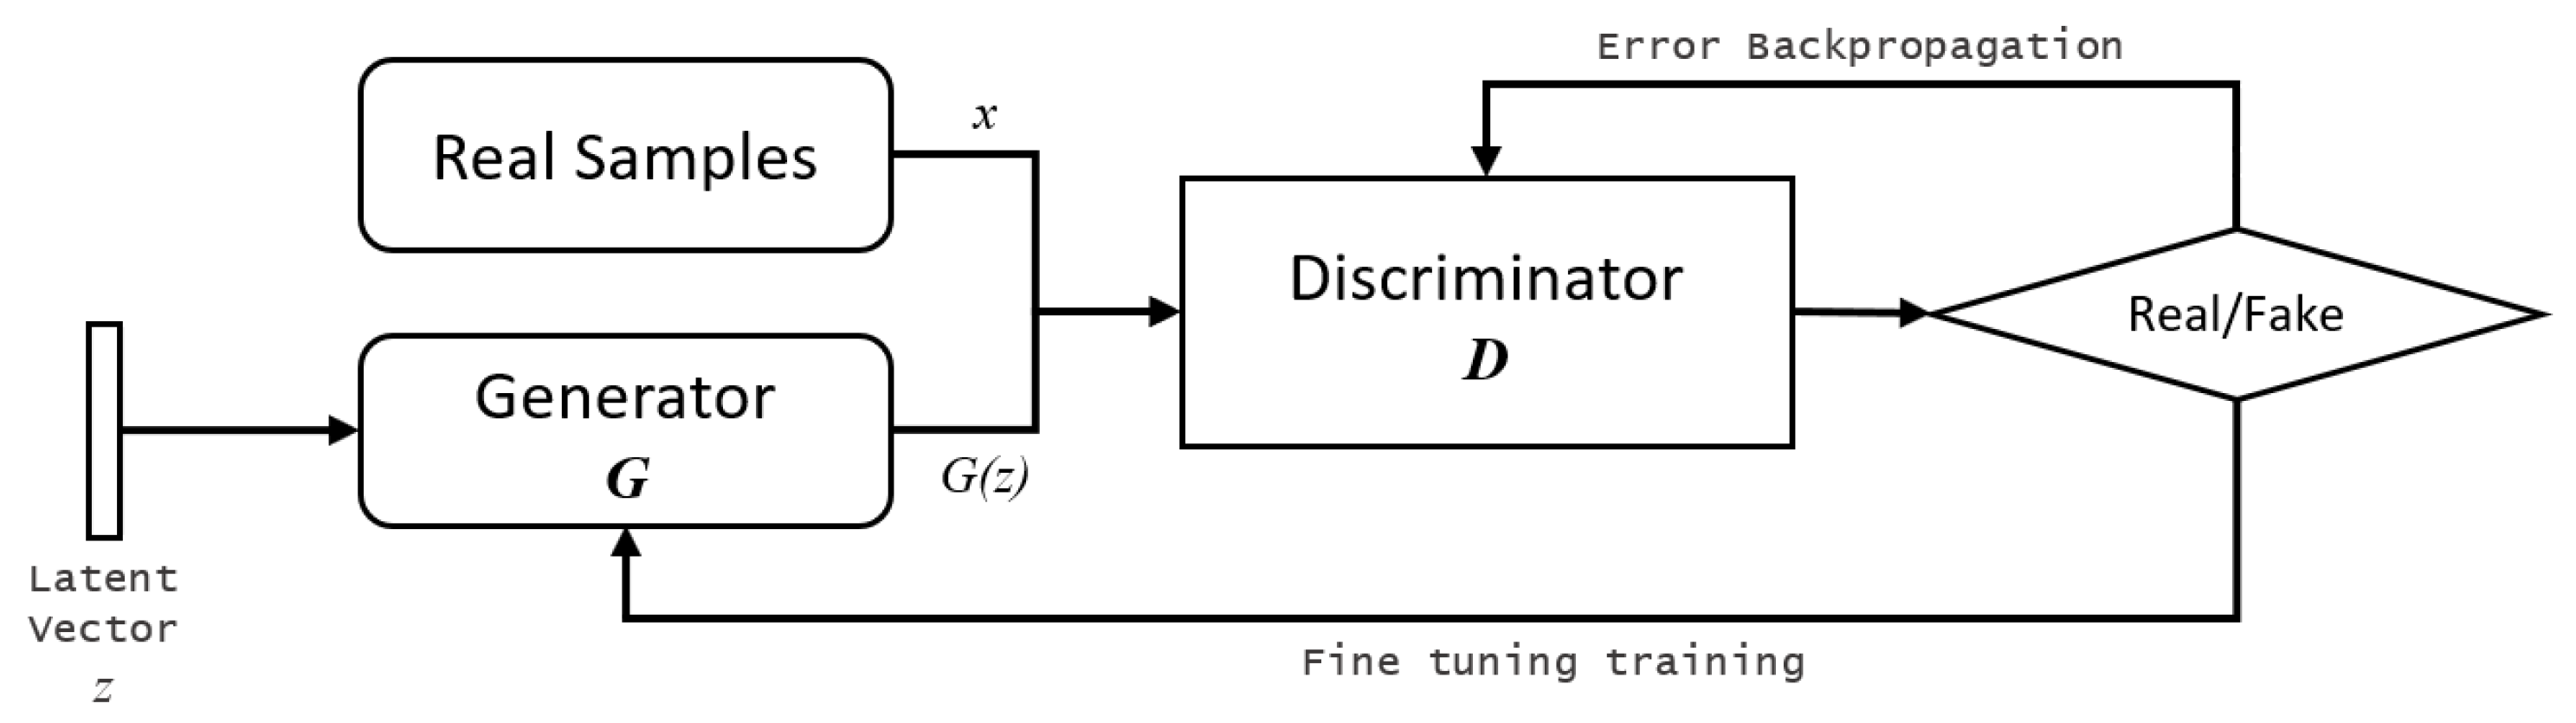
3.1. GAN
3.2. 3D-IWGAN
4. Proposed System
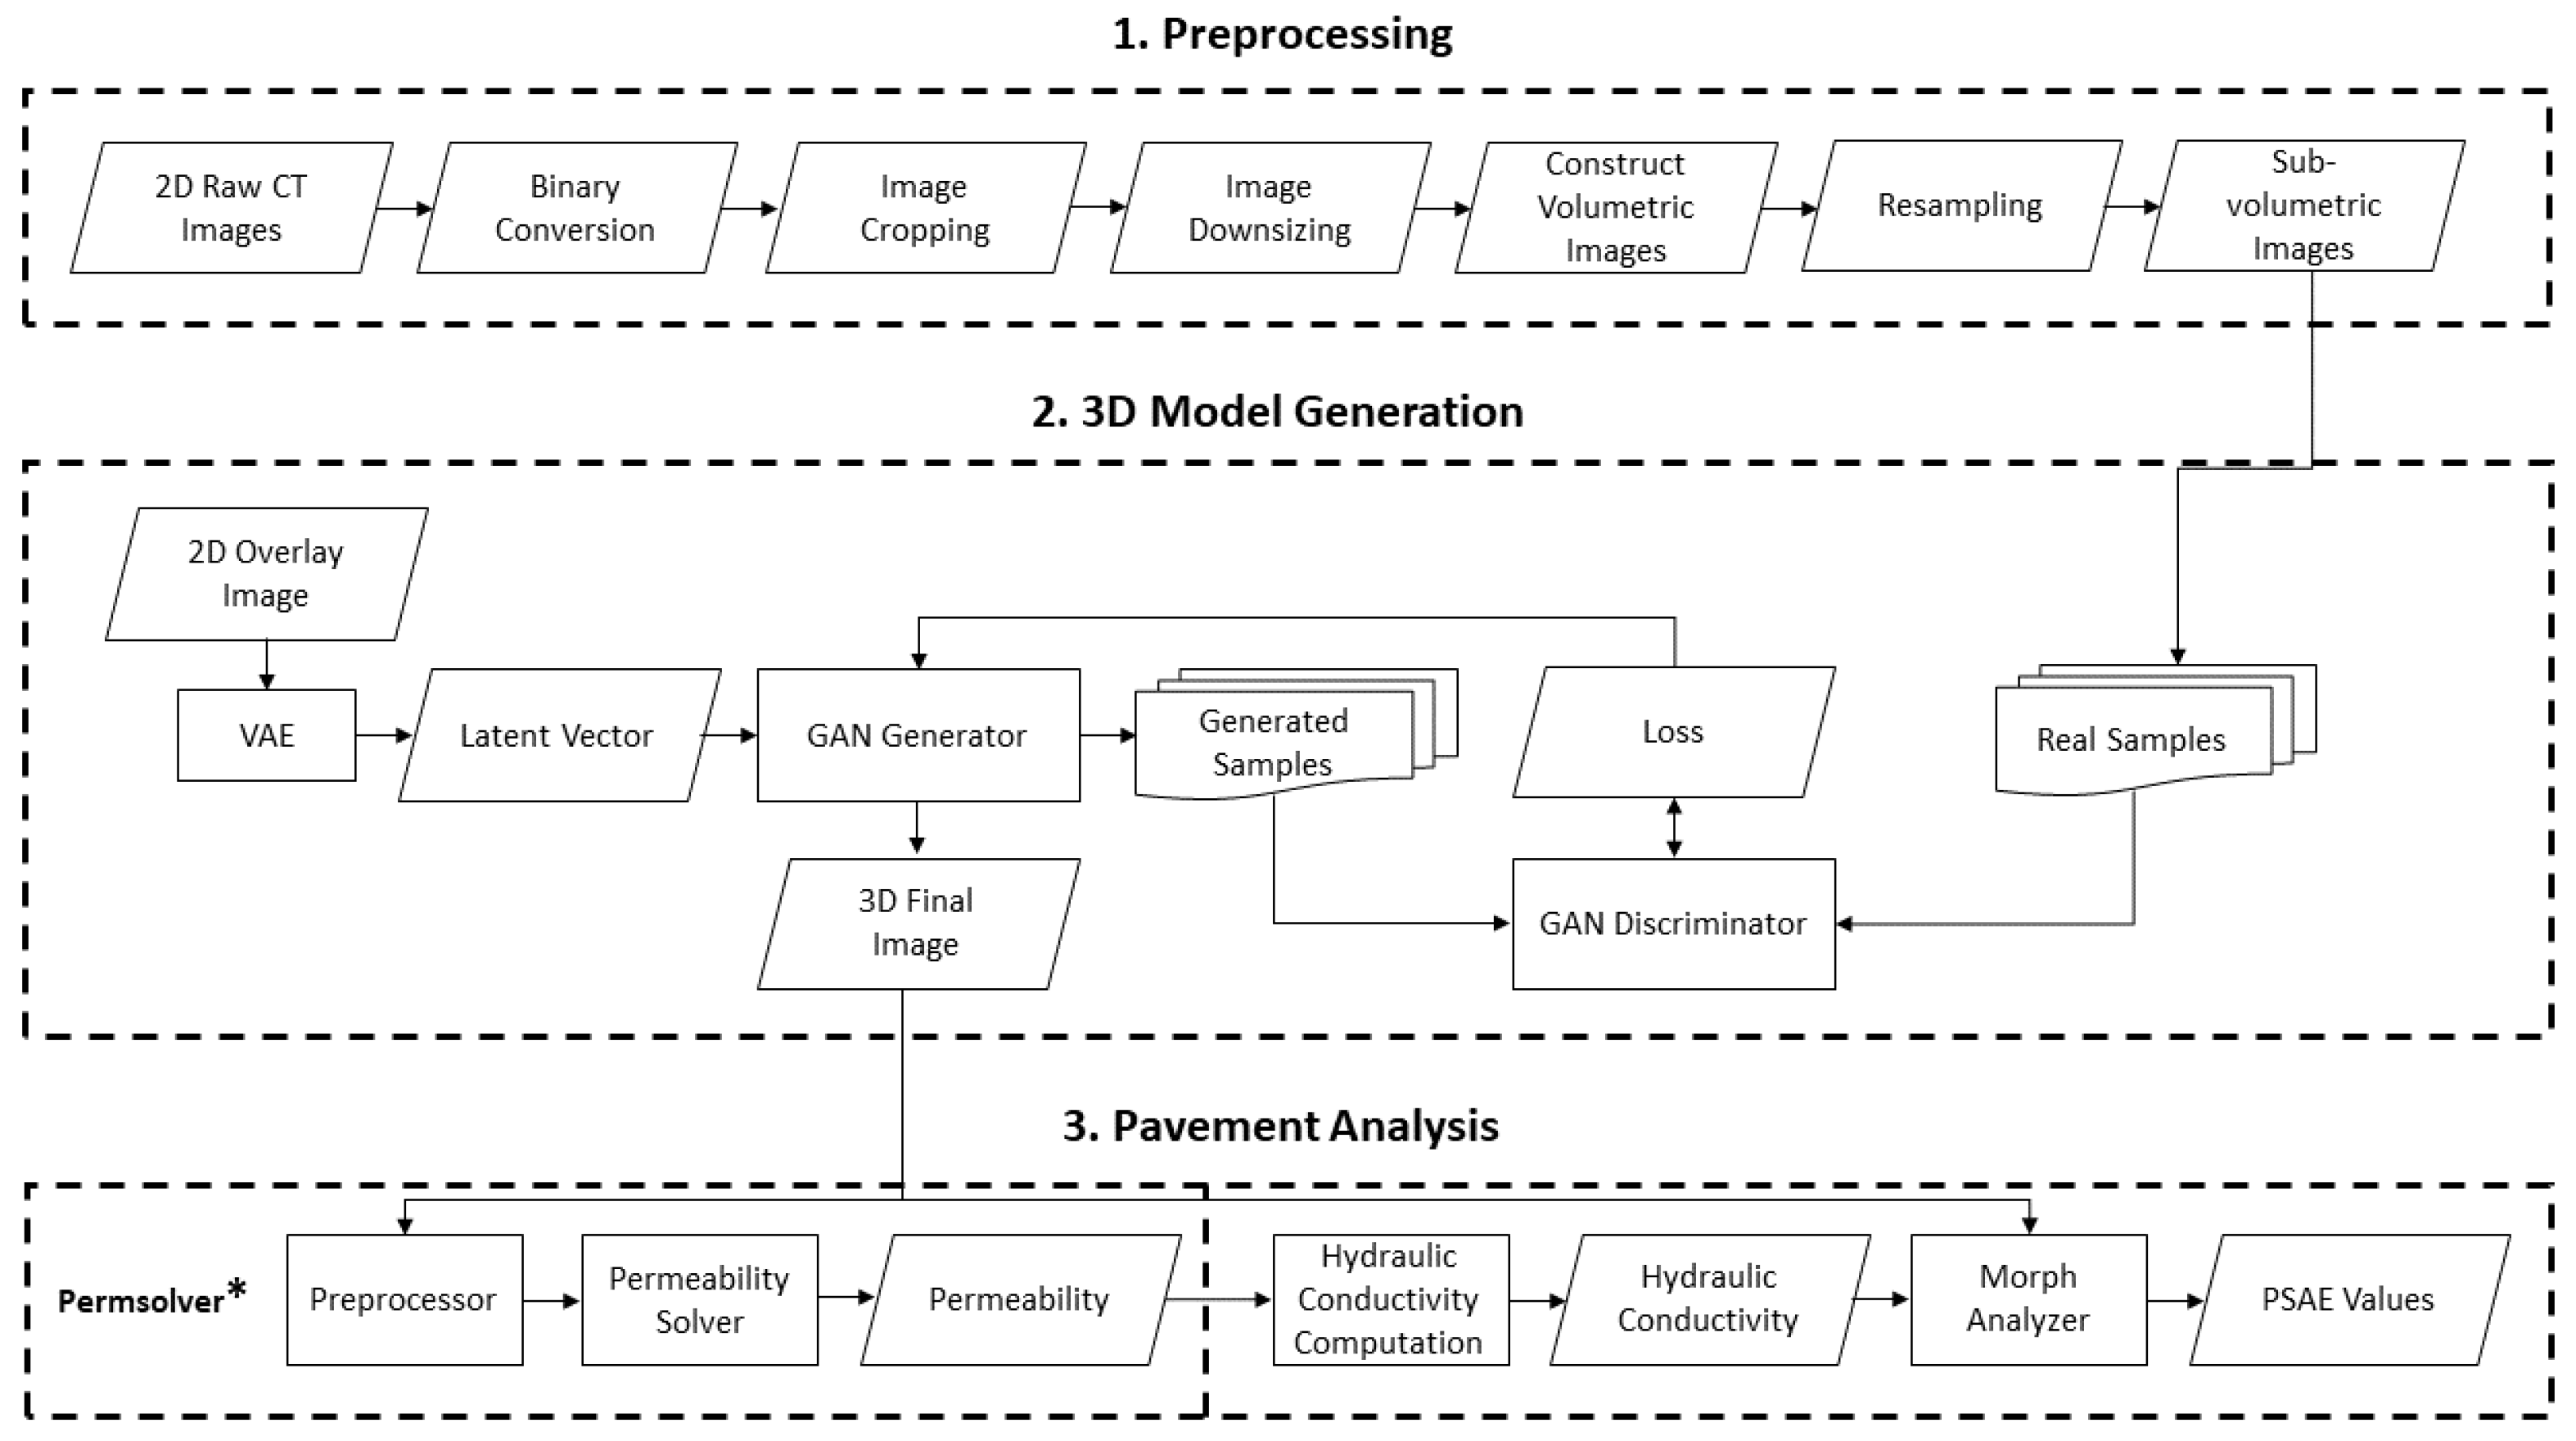
4.1. System Architecture
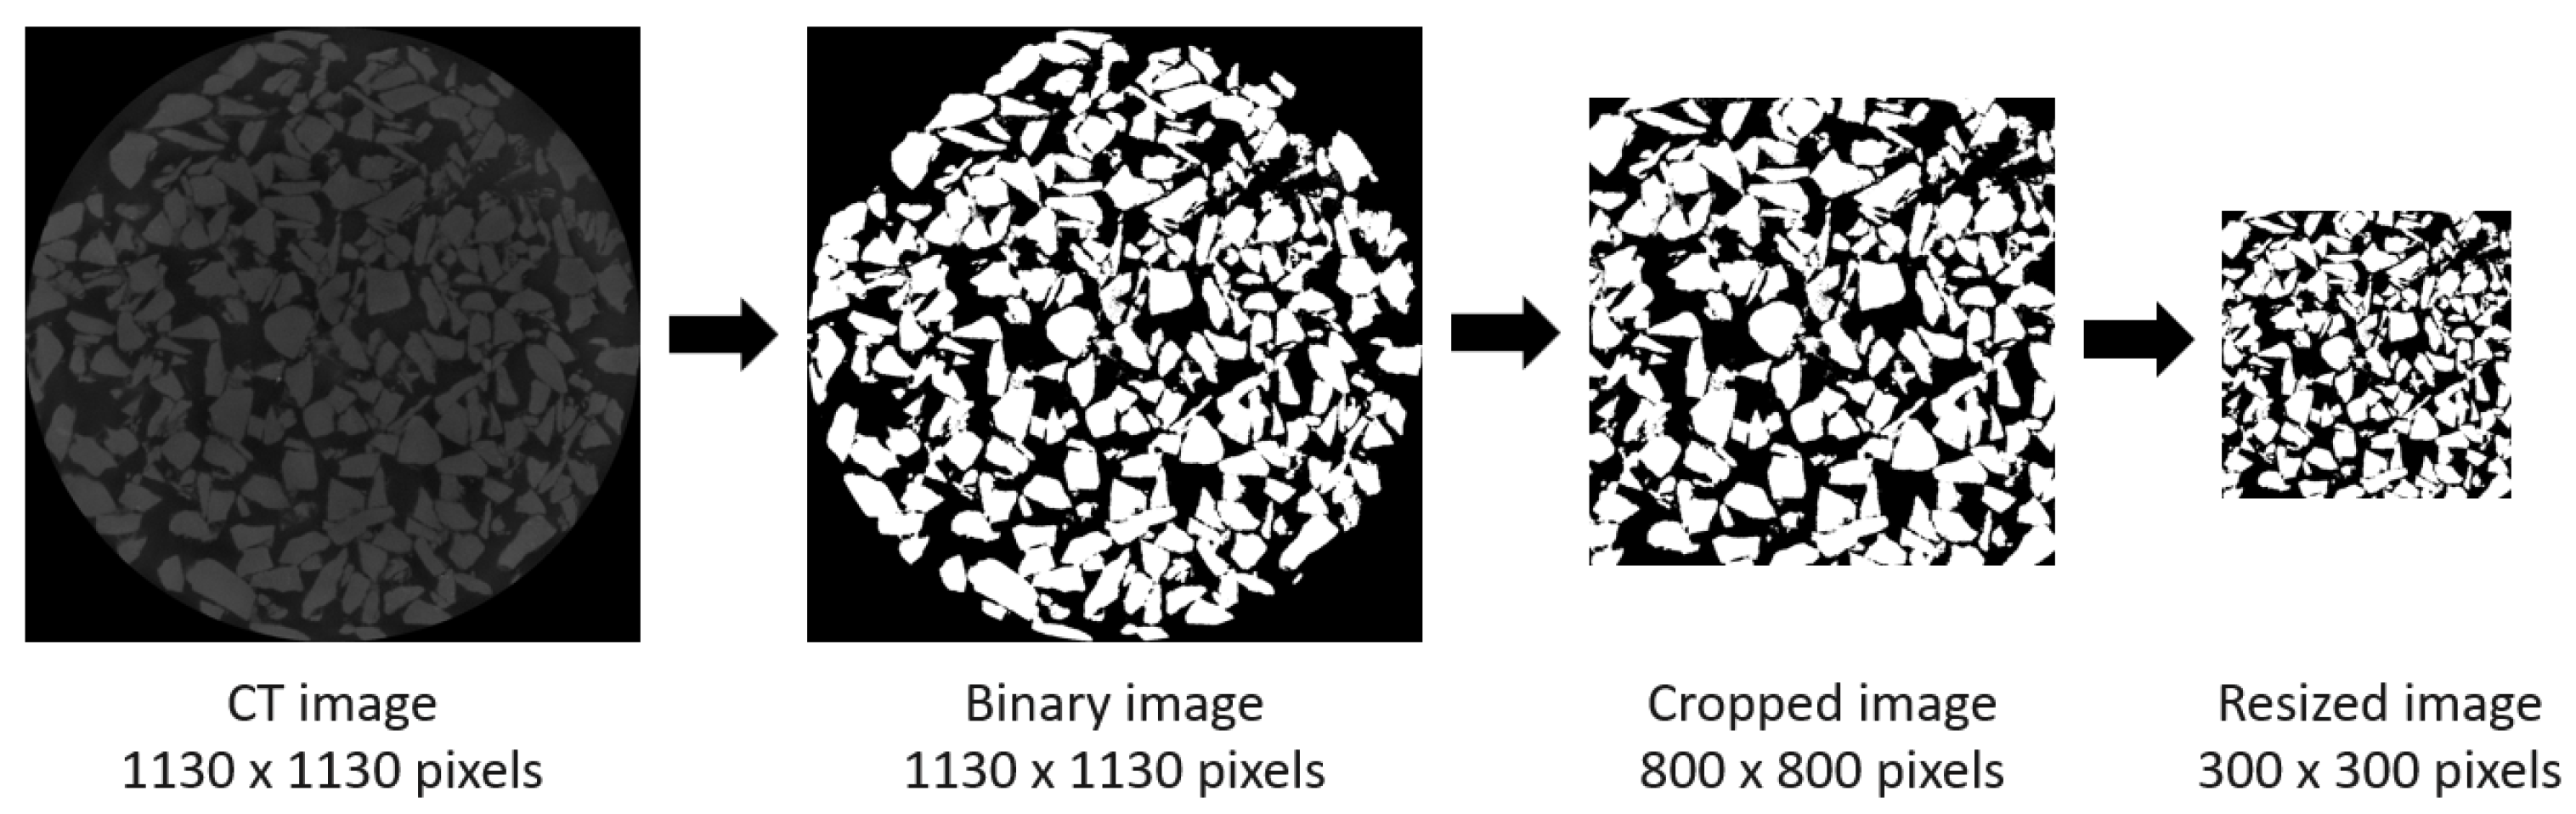
4.2. Preprocessing
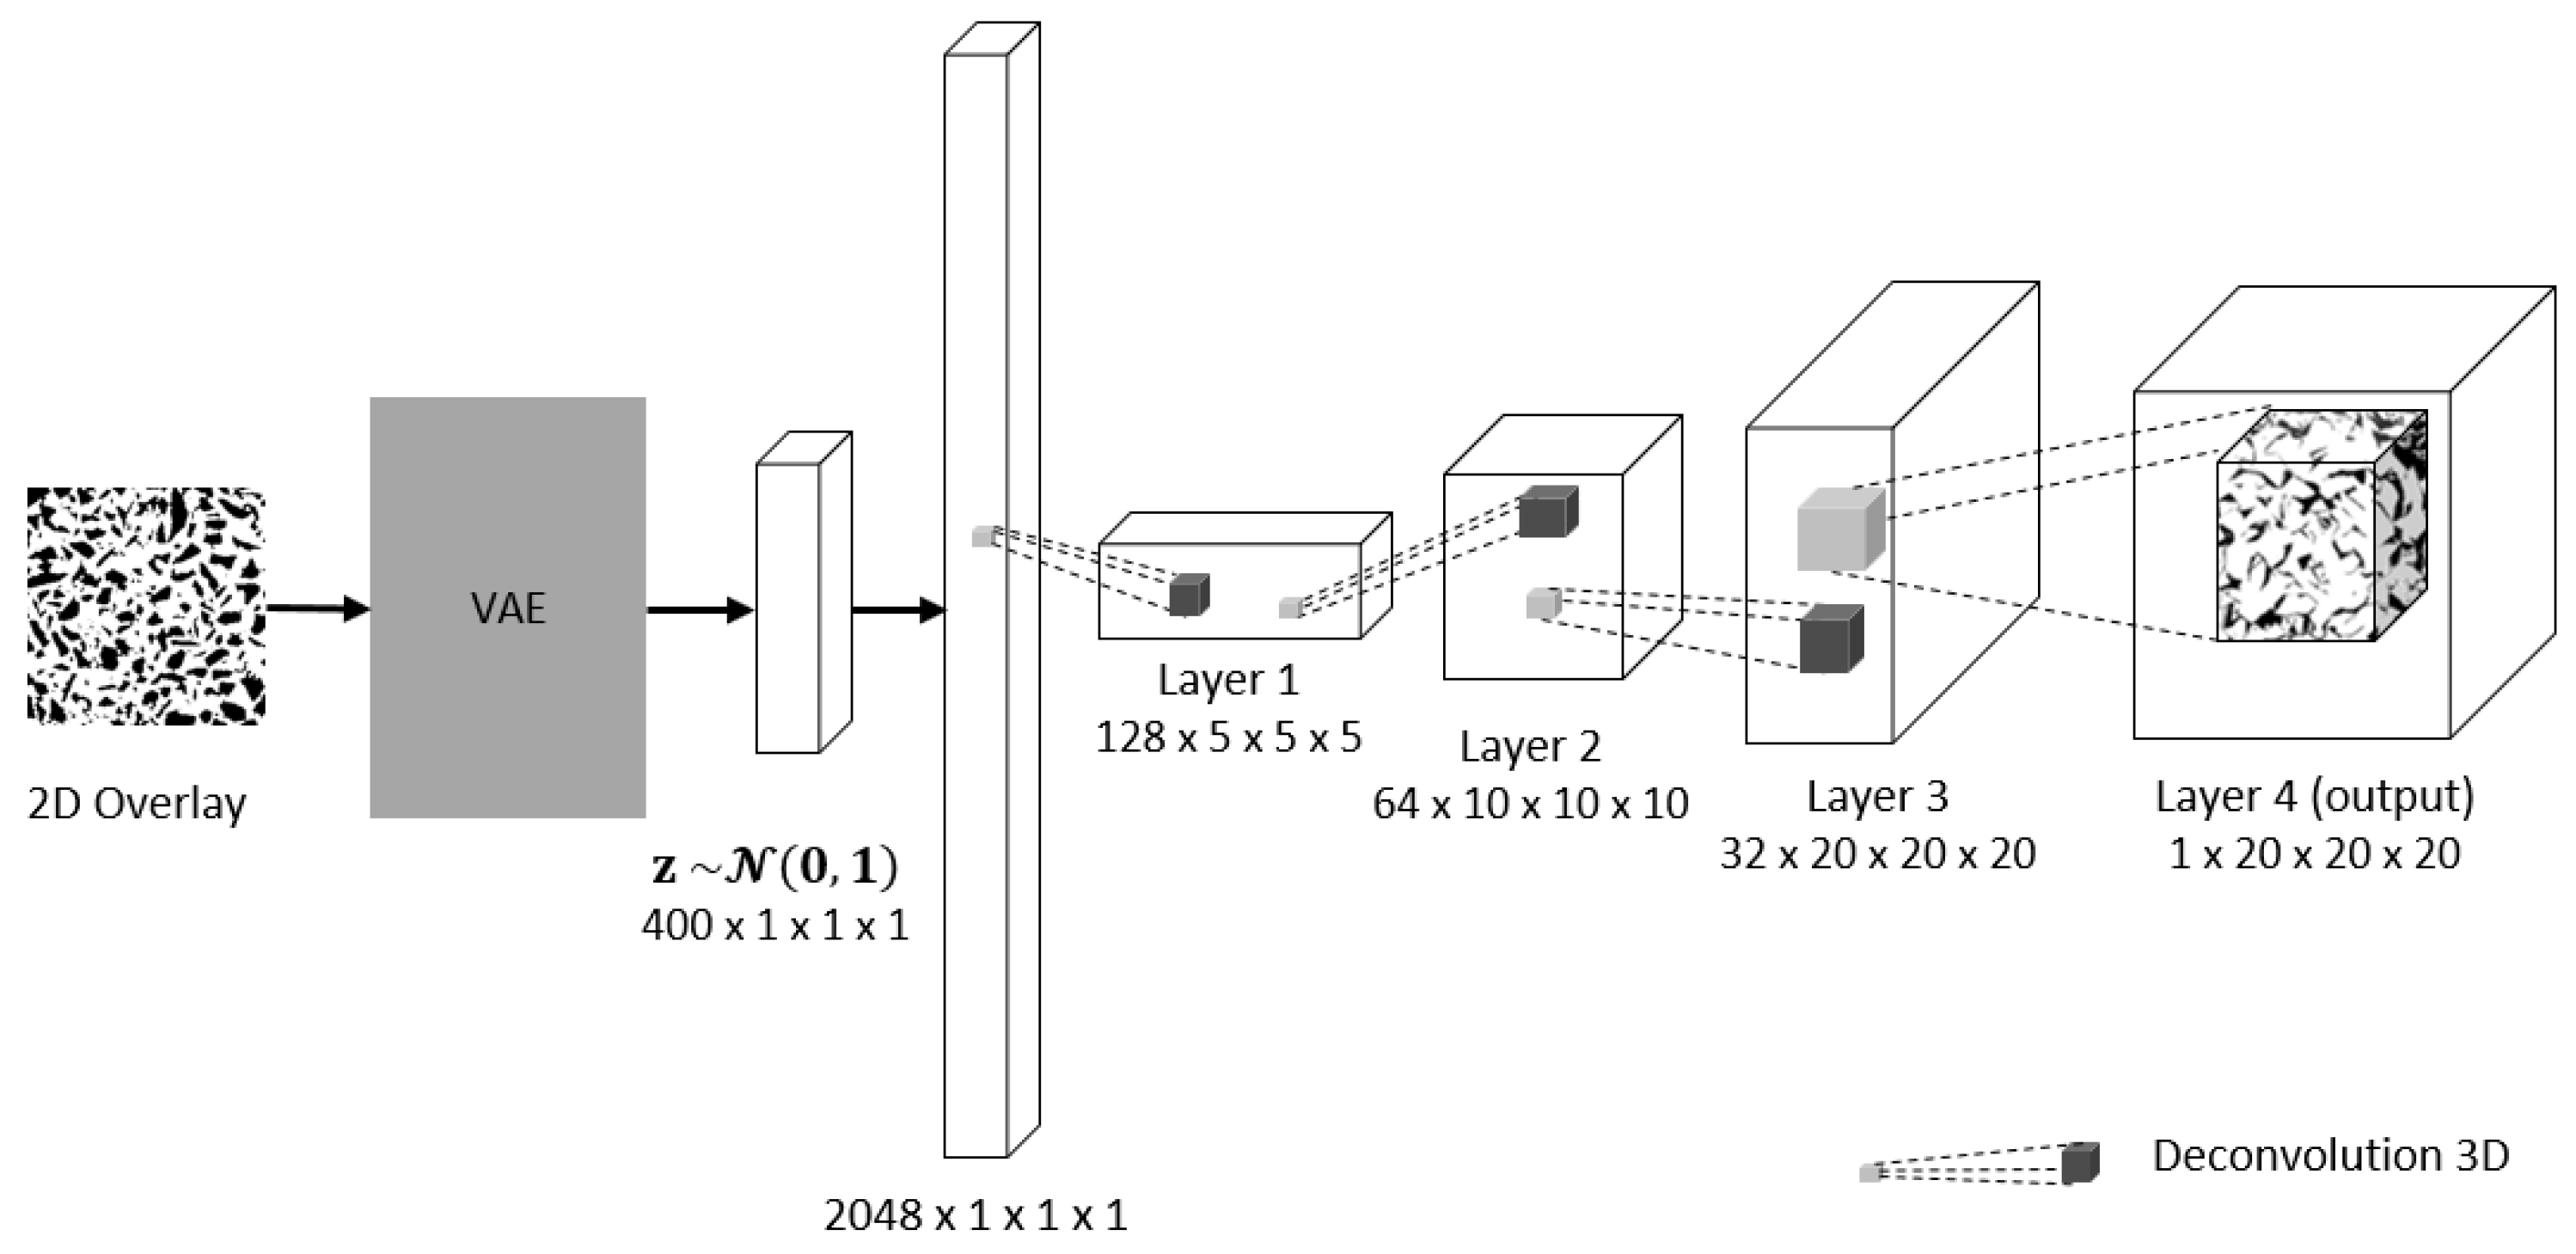
4.3. 3D Model Generation
4.3.1. 3D-IWGAN
4.3.2. Enhanced Gradient Penalty
4.4. Pavement Analysis
5. Implementation and Evaluation
5.1. Experimental Setup
5.1.1. Hardware and Software
5.1.2. Dataset
5.2. Experimental Results
5.2.1. 3D Pavement Reconstruction
5.2.2. Permeable Pavement Analysis
5.3. Discussion
6. Conclusions
Author Contributions
Funding
Institutional Review Board Statement
Informed Consent Statement
Acknowledgments
Conflicts of Interest
References
- Dietz, M.E. Low impact development practices: A review of current research and recommendations for future directions. Water Air Soil Pollut. 2007, 186, 351–363. [Google Scholar] [CrossRef]
- Boogaard, F.; Lucke, T. Long-Term Infiltration Performance Evaluation of Dutch Permeable Pavements Using the Full-Scale Infiltration Method. Water 2019, 11, 320. [Google Scholar] [CrossRef] [Green Version]
- Ahn, J.; Jung, J.; Kim, S.; Han, S.I. X-ray image analysis of porosity of pervious concretes. Int. J. GEOMATE: Geotech. Constr. Mater. Environ. 2014, 6, 796–799. [Google Scholar] [CrossRef]
- Scholz, M.; Grabowiecki, P. Review of permeable pavement systems. Build. Environ. 2007, 42, 3830–3836. [Google Scholar] [CrossRef]
- Deo, O.; Sumanasooriya, M.; Neithalath, N. Permeability reduction in pervious concretes due to clogging: Experiments and modeling. J. Mater. Civ. Eng. 2010, 22, 741–751. [Google Scholar] [CrossRef]
- Pezzaniti, D.; Beecham, S.; Kandasamy, J. Influence of clogging on the effective life of permeable pavements. Proc. Inst. Civ. Eng. Water Manag. 2009, 162, 211–220. [Google Scholar] [CrossRef] [Green Version]
- Lucke, T.; Beecham, S. Field investigation of clogging in a permeable pavement system. Build. Res. Inf. 2011, 39, 603–615. [Google Scholar] [CrossRef]
- Yong, C.; McCarthy, D.; Deletic, A. Predicting physical clogging of porous and permeable pavements. J. Hydrol. 2013, 481, 48–55. [Google Scholar] [CrossRef]
- Yong, C.F.; Deletic, A.; Fletcher, T.; Grace, M. The clogging behaviour and treatment efficiency of a range of porous pavements. In Proceedings of the 11th International Conference on Urban Drainage, Edinburgh, Scotland, UK, 31 August–5 September 2008. [Google Scholar]
- Kia, A.; Wong, H.S.; Cheeseman, C.R. Clogging in permeable concrete: A review. J. Environ. Manag. 2017, 193, 221–233. [Google Scholar] [CrossRef]
- Şen, Z. Basic Porous Medium Concepts. In Practical and Applied Hydrogeology; Şen, Z., Ed.; Elsevier: Oxford, UK, 2015; Chapter 2; pp. 43–97. [Google Scholar]
- Mays, D.C.; Hunt, J.R. Hydrodynamic aspects of particle clogging in porous media. Environ. Sci. Technol. 2005, 39, 577–584. [Google Scholar] [CrossRef] [Green Version]
- Bean, E.Z.; Hunt, W.F.; Bidelspach, D.A. Field Survey of Permeable Pavement Surface Infiltration Rates. J. Irrig. Drain. Eng. 2007, 133, 249–255. [Google Scholar] [CrossRef]
- Bentz, D.P. Virtual pervious concrete: Microstructure, percolation, and permeability. ACI Mater. J. 2008, 105, 297. [Google Scholar]
- Manahiloh, K.N.; Muhunthan, B.; Kayhanian, M.; Gebremariam, S.Y. X-ray Computed Tomography and Nondestructive Evaluation of Clogging in Porous Concrete Field Samples. J. Mater. Civ. Eng. 2012, 24, 1103–1109. [Google Scholar] [CrossRef]
- Sundararaghavan, V.; Zabaras, N. Classification and reconstruction of three-dimensional microstructures using support vector machines. Comput. Mater. Sci. 2005, 32, 223–239. [Google Scholar] [CrossRef]
- Basanta, D.; Miodownik, M.A.; Holm, E.A.; Bentley, P.J. Using genetic algorithms to evolve three-dimensional microstructures from two-dimensional micrographs. Metall. Mater. Trans. A 2005, 36, 1643–1652. [Google Scholar] [CrossRef]
- Jiang, Z.; Chen, W.; Burkhart, C. Efficient 3D porous microstructure reconstruction via Gaussian random field and hybrid optimization. J. Microsc. 2013, 252, 135–148. [Google Scholar] [CrossRef]
- Quiblier, J.A. A new three-dimensional modeling technique for studying porous media. J. Colloid Interface Sci. 1984, 98, 84–102. [Google Scholar] [CrossRef]
- Roberts, A.P. Statistical reconstruction of three-dimensional porous media from two-dimensional images. Phys. Rev. E 1997, 56, 3203. [Google Scholar] [CrossRef] [Green Version]
- Yeong, C.; Torquato, S. Reconstructing random media. Phys. Rev. E 1998, 57, 495. [Google Scholar] [CrossRef] [Green Version]
- Goodfellow, I.J.; Pouget-Abadie, J.; Mirza, M.; Xu, B.; Warde-Farley, D.; Ozair, S.; Courville, A.C.; Bengio, Y. Generative adversarial nets. In Proceedings of the 27th International Conference on Neural Information Processing Systems, Montreal, QC, Canada, 8–13 December 2014; pp. 2672–2680. [Google Scholar]
- Goodfellow, I.J.; Bengio, Y.; Courville, A.C. Deep Learning; MIT Press: Cambridge, UK, 2016; Volume 1. [Google Scholar]
- Gulrajani, I.; Ahmed, F.; Arjovsky, M.; Dumoulin, V.; Courville, A.C. Improved Training of Wasserstein GANs. In Proceedings of the Advances in Neural Information Processing Systems 30: Annual Conference on Neural Information Processing Systems 2017, Long Beach, CA, USA, 4–9 December 2017; pp. 5767–5777. [Google Scholar]
- Smith, E.J.; Meger, D. Improved Adversarial Systems for 3D Object Generation and Reconstruction. In Proceedings of the 1st Annual Conference on Robot Learning, CoRL 2017, Mountain View, CA, USA, 13–15 November 2017; Volume 78, pp. 87–96. [Google Scholar]
- Wu, J.; Zhang, C.; Xue, T.; Freeman, B.; Tenenbaum, J. Learning a probabilistic latent space of object shapes via 3d generative-adversarial modeling. In Proceedings of the Advances in Neural Information Processing Systems 29: Annual Conference on Neural Information Processing Systems 2016, Barcelona, Spain, 5–10 December 2016; pp. 82–90. [Google Scholar]
- Arjovsky, M.; Chintala, S.; Bottou, L. Wasserstein Generative Adversarial Networks. In Proceedings of the 34th International Conference on Machine Learning, ICML 2017, Sydney, NSW, Australia, 6–11 August 2017; Volume 70, pp. 214–223. [Google Scholar]
- Cang, R.; Xu, Y.; Chen, S.; Liu, Y.; Jiao, Y.; Ren, M.Y. Microstructure representation and reconstruction of heterogeneous materials via deep belief network for computational material design. J. Mech. Des. 2017, 139, 071404. [Google Scholar] [CrossRef]
- Tran, A.; Tran, H. Data-driven high-fidelity 2D microstructure reconstruction via non-local patch-based image inpainting. Acta Mater. 2019, 178, 207–218. [Google Scholar] [CrossRef]
- Mosser, L.; Dubrule, O.; Blunt, M.J. Reconstruction of three-dimensional porous media using generative adversarial neural networks. Phys. Rev. E 2017, 96, 043309. [Google Scholar] [CrossRef] [PubMed] [Green Version]
- Feri, L.E.; Joonho Kwon, J.A. 3D microstructure reconstruction of Permeable Pavement using 3D-IWGAN. Database Res. 2014, 34, 22–33. [Google Scholar]
- Feng, J.; Teng, Q.; Li, B.; He, X.; Chen, H.; Li, Y. An end-to-end three-dimensional reconstruction framework of porous media from a single two-dimensional image based on deep learning. Comput. Methods Appl. Mech. Eng. 2020, 368, 113043. [Google Scholar] [CrossRef]
- Shams, R.; Masihi, M.; Boozarjomehry, R.B.; Blunt, M.J. Coupled generative adversarial and auto-encoder neural networks to reconstruct three-dimensional multi-scale porous media. J. Pet. Sci. Eng. 2020, 186, 106794. [Google Scholar] [CrossRef]
- Bhaduri, A.; Gupta, A.; Olivier, A.; Graham-Brady, L. An efficient optimization based microstructure reconstruction approach with multiple loss functions. arXiv 2021, arXiv:2102.02407. [Google Scholar]
- Zhu, J.; Zhang, R.; Pathak, D.; Darrell, T.; Efros, A.A.; Wang, O.; Shechtman, E. Toward Multimodal Image-to-Image Translation. In Proceedings of the Advances in Neural Information Processing Systems 30: Annual Conference on Neural Information Processing Systems 2017, Long Beach, CA, USA, 4–9 December 2017; pp. 465–476. [Google Scholar]
- Kingma, D.P.; Welling, M. Auto-Encoding Variational Bayes. arXiv 2014, arXiv:1312.6114. [Google Scholar]
- Bentz, D.P.; Martys, N.S. A Stokes Permeability Solver for Three-Dimensional Porous Media; U.S. Department of Commerce, Technology Administration, National Institute of Standards and Technology: Gaithersburg, MD, USA, 2007.
- Rasband, W. ImageJ; US National Institutes of Health: Bethesda, MD, USA, 1997.


| Approach | Method | Application | Output |
|---|---|---|---|
| Statistics | Two-point Correlation | geometry reconstruction, analysis | 2D/3D microstructure |
| Deep Learning | CDBN | 2D microstructure reconstruction | 2D microstructure |
| Deep Learning | 3DGAN | 3D object reconstruction | 3D objects (non-microstructure) |
| Deep Learning | DCGAN | 2D object reconstruction | 2D microstructure |
| Deep Learning | IWGAN | 2D/3D object reconstruction | 2D/3D objects (non-microstructure) |
| Deep Learning | 3D-IWGAN (enhanced GP) | 3D microstructure reconstruction | 3D microstructure |
| Method | Gradient Penalty | Objective Function |
|---|---|---|
| 3DGAN | none | |
| 3D-IWGAN (1-GP) | ||
| 3D-IWGAN (enhanced-GP) |
| Layer | Type | Filters | Stride | Padding | Batchnorm | Activation Function |
|---|---|---|---|---|---|---|
| 1 | Deconvolution 3D | 128 | 1 | 0 | Yes | ReLU |
| 2 | Deconvolution 3D | 64 | 2 | 1 | Yes | ReLU |
| 3 | Deconvolution 3D | 20 | 2 | 1 | Yes | ReLU |
| 4 | Deconvolution 3D | 1 | 1 | 1 | No | Tanh |
| Layer | Type | Filters | Stride | Padding | Batchnorm | Activation Function |
|---|---|---|---|---|---|---|
| 1 | Convolution 3D | 1 | 1 | 1 | No | LeakyReLU |
| 2 | Convolution 3D | 32 | 2 | 1 | No | LeakyReLU |
| 3 | Convolution 3D | 64 | 2 | 1 | No | LeakyReLU |
| 4 | Convolution 3D | 128 | 1 | 0 | No | LeakyReLU |
| Sample | Specific Surface Area | Euler Number |
|---|---|---|
| 1 | 7.37% | −1.27 × |
| 2 | 8.93% | −4.53 × |
| 3 | 9.45% | −3.21 × |
| 4 | 8.77% | −5.25 × |
| 5 | 10.93% | −2.19 × |
| 6 | 8.65% | −4.16 × |
| 7 | 7.91% | −5.98 × |
| 8 | 14.26% | −1.09 × |
| 9 | 6.17% | −6.26 × |
Publisher’s Note: MDPI stays neutral with regard to jurisdictional claims in published maps and institutional affiliations. |
© 2021 by the authors. Licensee MDPI, Basel, Switzerland. This article is an open access article distributed under the terms and conditions of the Creative Commons Attribution (CC BY) license (https://creativecommons.org/licenses/by/4.0/).
Share and Cite
Feri, L.E.; Ahn, J.; Lutfillohonov, S.; Kwon, J. A Three-Dimensional Microstructure Reconstruction Framework for Permeable Pavement Analysis Based on 3D-IWGAN with Enhanced Gradient Penalty. Sensors 2021, 21, 3603. https://doi.org/10.3390/s21113603
Feri LE, Ahn J, Lutfillohonov S, Kwon J. A Three-Dimensional Microstructure Reconstruction Framework for Permeable Pavement Analysis Based on 3D-IWGAN with Enhanced Gradient Penalty. Sensors. 2021; 21(11):3603. https://doi.org/10.3390/s21113603
Chicago/Turabian StyleFeri, Ludia Eka, Jaehun Ahn, Shahrullohon Lutfillohonov, and Joonho Kwon. 2021. "A Three-Dimensional Microstructure Reconstruction Framework for Permeable Pavement Analysis Based on 3D-IWGAN with Enhanced Gradient Penalty" Sensors 21, no. 11: 3603. https://doi.org/10.3390/s21113603