Monitoring of Interfacial Debonding of Concrete Filled Pultrusion-GFRP Tubular Column Based on Piezoelectric Smart Aggregate and Wavelet Analysis


Abstract
:1. Introduction
2. Rationale
2.1. Wave Propagation Analysis Based on Piezoelectric Transducers
2.2. Wavelet Packet Energy
2.3. Definition of Damage Index Based on Wavelet Packet Energy
3. Test Introduction
3.1. Specimen Design
3.2. Design of Interfacial Debonding Damage
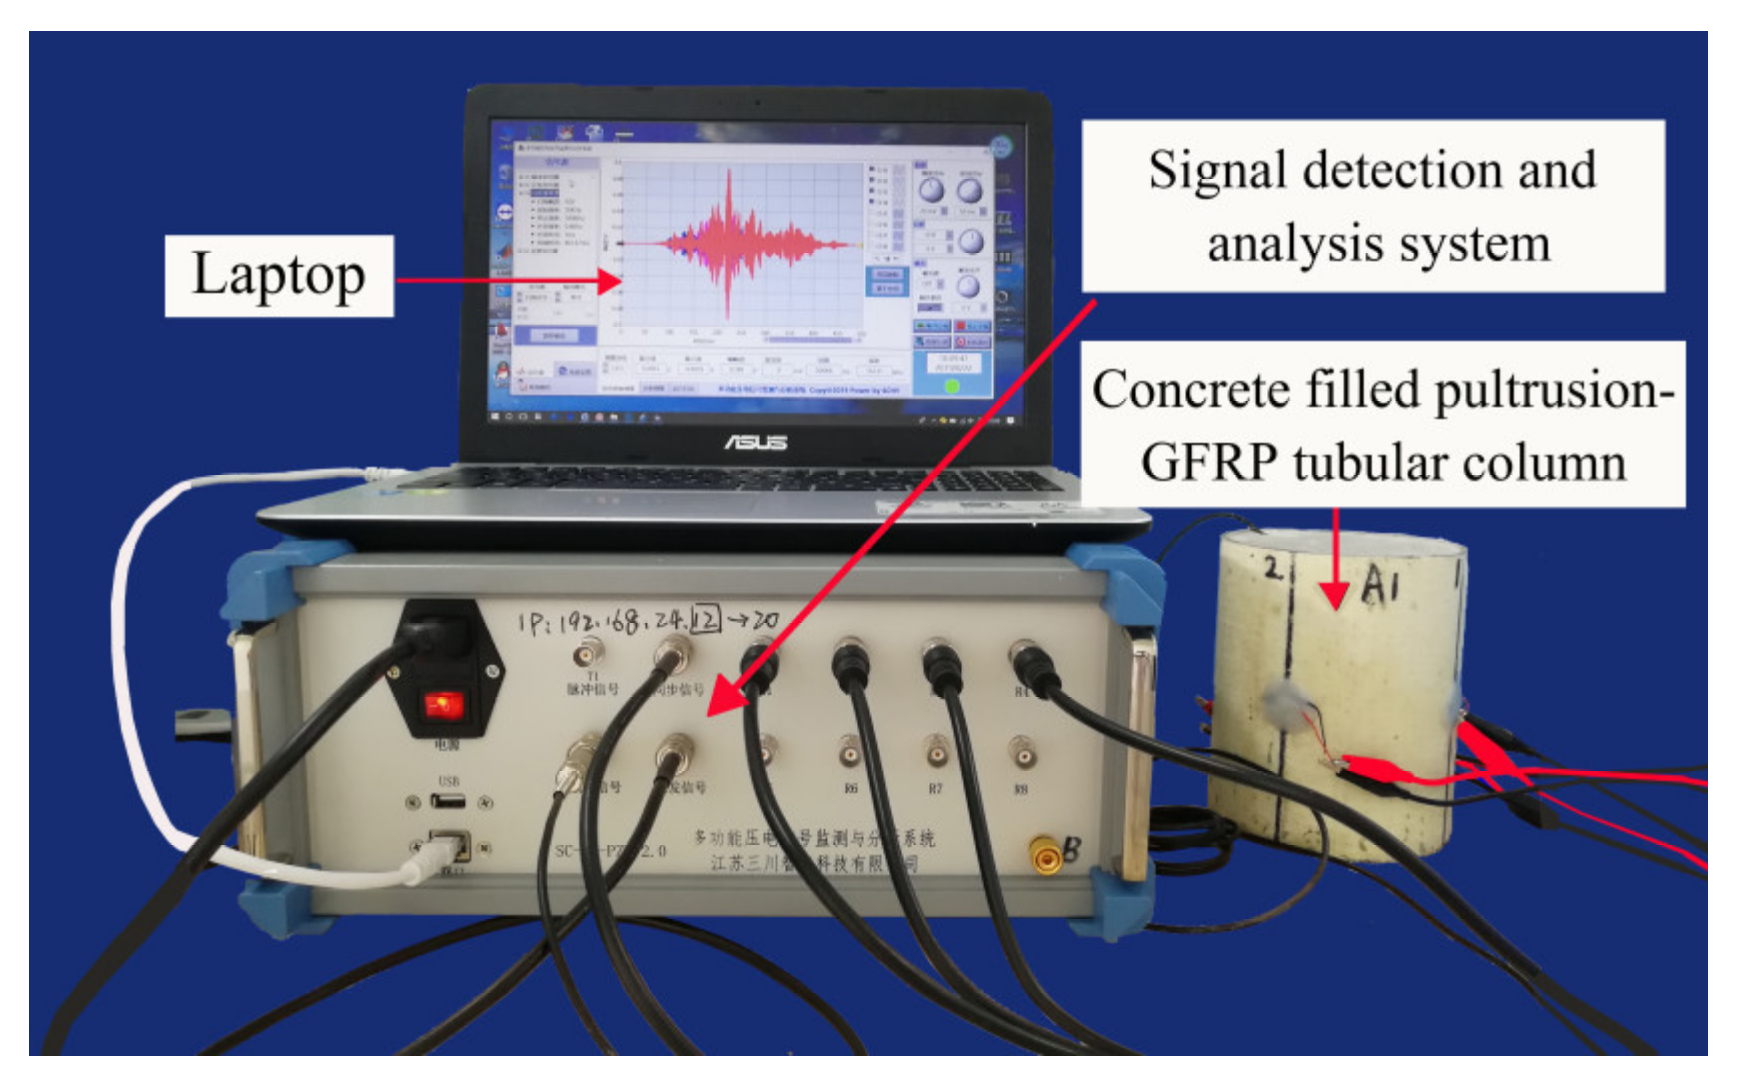
3.3. Data Collection System
4. Analysis of Experimental Process and Results
4.1. Experimental Procedure
4.2. Analysis of Test Results
4.2.1. Test of Different Debonding Area Identification
- (1)
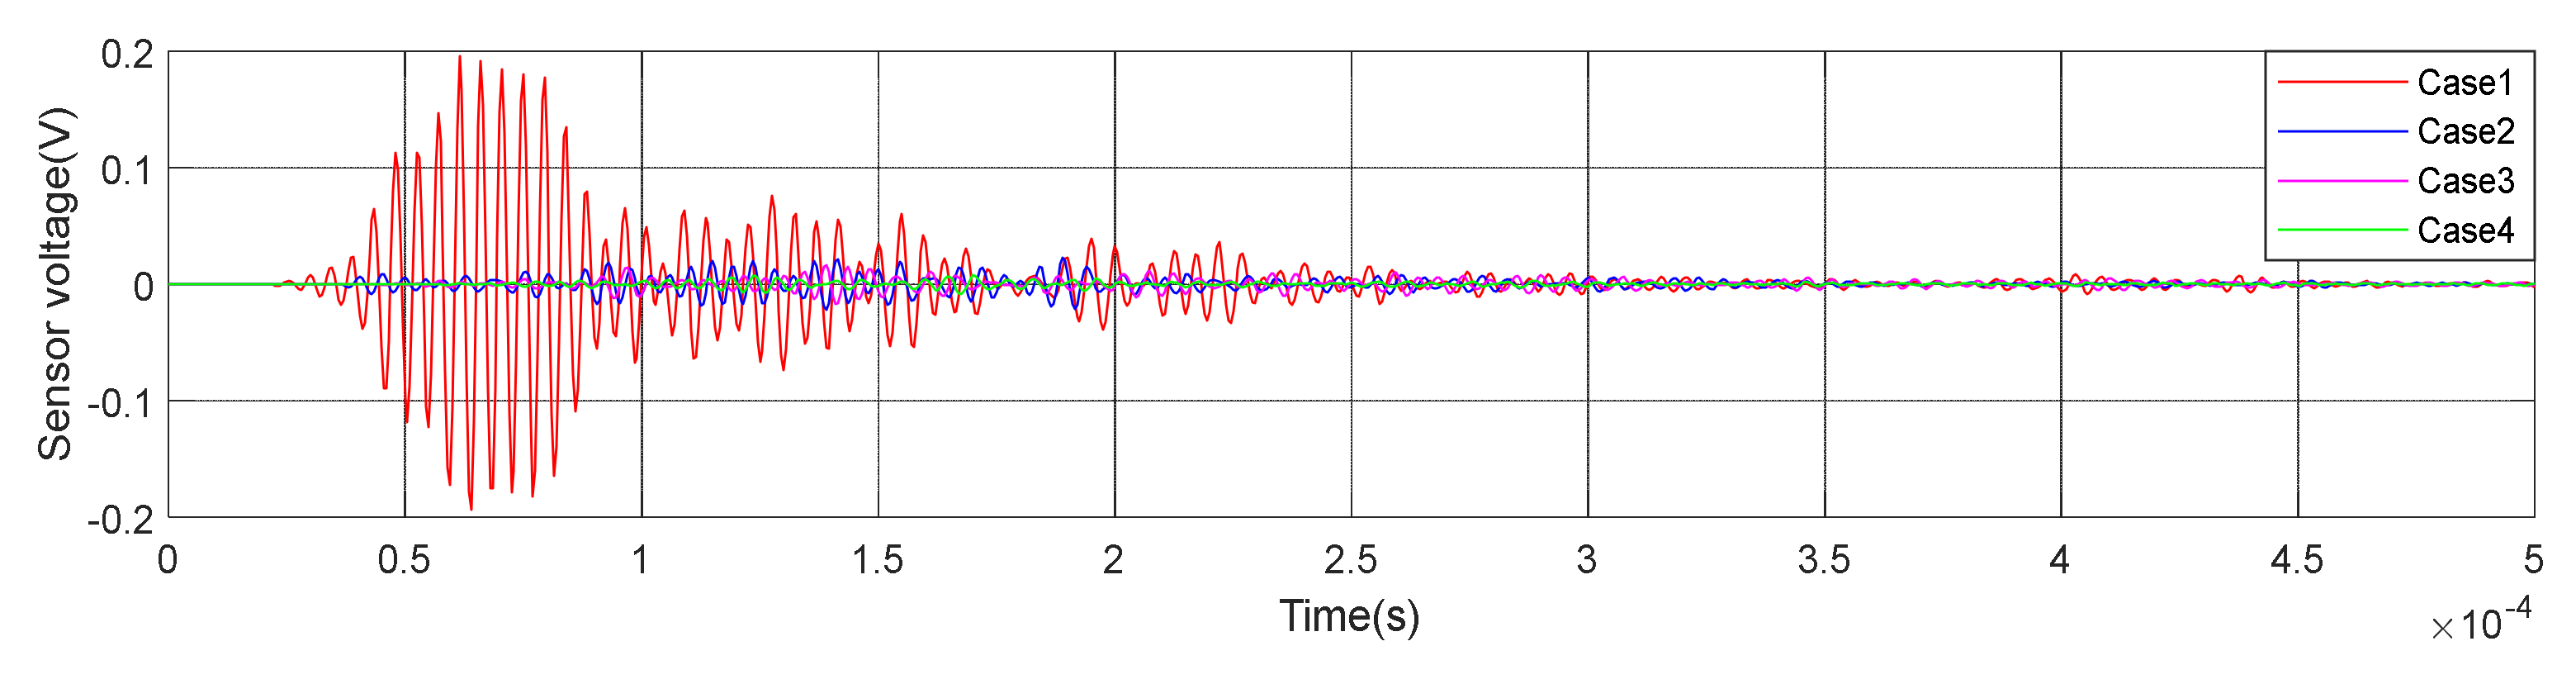
- Time Domain Analysis of Sweep SignalThe time domain of signal under the excitation of sweep was shown in Figure 8 of specimen A1. It can be seen from the Figure 8 that the amplitude of the signal received by PZT patches was obviously attenuated with the increases of debonding area. Moreover, the signal amplitude of the damage region was quite different from the healthy region. The attenuation of wave in air is much greater than that in concrete. That is the reason why the amplitude was attenuated after the interfacial debonding occurred. Therefore, it can be preliminarily indicated that the detection method can effectively identify the interfacial damage of CFGC. Based on the acquired sweep signal, we calculated the wavelet packet energy of the signal under different debonding area. As shown in Figure 9a, with the increase of the debonding area, the wavelet packet energy decreased greatly. Figure 9b is a comparison of the damage coefficient of A1 based on wavelet packet energy. It can be seen from Figure 9b that the damage index DI was sensitive to the damage of different debonding area. Thus, this method can effectively identify the damage of different debonding area.
- (2)
- Analysis for Delay of PulseIn order to further verify the effectiveness of the active detection method based on piezoelectric transducers in the damage identification of interfacial debonding on CFGC. The pulse was applied to excite the SA1 of specimen A1, and the acquired waveform is shown in Figure 10. The arrival time of pulse under four kinds of damage condition was extracted, as shown in Figure 11a. It can be seen from Figure 11a that the arrival time of pulse was delayed with the increases of the damage area. The pulse delay was calculated based on the health state referenced. It can be speculated that the propagation path of waves was forced to change with the occurrence of damage, which may cause a detour propagation of waves. Moreover, the larger the damage area was, the larger wave detour distances, and the delays were more obvious. The regression analysis in Figure 11b showed that when the damage area was less than or equal to 6000 mm2, the debonding area was linear with the delay of the pulse wave, and the fitting curve was in good agreement with the test results.
4.2.2. Test of Different Debonding Thickness Identification
- (1)
- Time Domain Analysis of Sweep SignalThe time domain of signal under the sweep excitation is shown in Figure 12 of specimen A2. It can be seen from the Figure 12 that the amplitude of the signal received by PZT patches was significantly attenuated with the increases of debonding thickness. Moreover, the signal amplitude of the damaged region was very different from the healthy region. It can be preliminarily indicated that the detection method can effectively identify the interfacial damage with different debonding thicknesses of CFGC. Figure 13a was a comparison for the wavelet packet energy under different damage thicknesses. It can be seen from Figure 13a and Table 4 that the energy value was decreasing with the transformation of the interface condition of CFGC from health to damage. Compared with healthy status, when the debonding thicknesses were 5 mm and 10 mm, the wavelet packet energy was respectively decreased by 61.7% and 75.0%. When the debonding thickness was 15 mm, the energy of signal was greatly attenuated, and the value almost closed to 0, which can prove that the wavelet packet energy was sensitive to the change of debonding thickness. The DI based on wavelet packet energy was also calculated, as shown in Figure 13b. Combined with Table 4, it can be seen that the damage index DI was sensitive to the change of debonding thickness, and DI can better characterize the damage level of specimens with different debonding thicknesses.
- (2)
- Analysis for Delay of PulseIn order to further verify the sensitivity of the detection method in the different debonding thicknesses of CFGC, the pulse was used to excite the SA2, and the acquired waveform was shown in Figure 14. The arrival times of pulse under four kinds of damage conditions were extracted, as shown in Figure 15a. It can be seen from the Figure 15b that the arrival time of pulse was delayed with the increase of damage thickness. It can be speculated that the wave propagation path was forced to change with the occurrence of damage, which caused a detour of wave. Further, the bigger the damage thickness was, the more the obvious delay. The delay of pulse wave was calculated based on case 1. As shown in Figure 15b, we performed a regression analysis on the pulse delay - debonding thickness relationship, which is a straight line, and the fitting curve was in good agreement with the test results. Therefore, we can speculate that when the debonding thickness is 15 mm or less, there is a linear relationship between the pulse delay and the debonding thickness.
5. Discussion
6. Conclusions
- (1)
- The monitoring method can effectively identify the debonding damage region of CFGC, and the damage index proposed in the paper was sensitive to the damage level.
- (2)
- The test results showed that both sweep excitation and pulse excitation can effectively identify the debonding regions of CFGC with different area and thicknesses. In addition to the wavelet packet energy based on sweep, the arrival time based on pulse was sensitive to the damage degree.
- (3)
- It was found that there was a linear relationship between the debonding area (or thickness) and the delay of pulse by regression analysis. Therefore, it can be inferred that the occurrence of damage caused the pulse detour during the process of wave propagation, and the delay of pulse was more obvious with the increase of damage.
Author Contributions
Funding
Acknowledgments
Conflicts of Interest
References
- Karimi, K.; Tait, M.J.; El-Dakhakhni, W.W. Testing and modeling of a novel FRP-encased steel–concrete composite column. Compos. Struct. 2011, 93, 1463–1473. [Google Scholar] [CrossRef]
- Teng, J.G.; Yu, T.; Wong, Y.L.; Dong, S.L. Hybrid FRP–concrete–steel tubular columns: Concept and behavior. Constr. Build. Mater. 2007, 21, 846–854. [Google Scholar] [CrossRef]
- Yu, T.; Teng, J.G.; Wong, Y.L.; Dong, S.L. Stress-strain behavior of concrete in hybrid FRP-concrete-steel double-skin tubular columns. J. Struct. Eng. 2010, 136, 379–389. [Google Scholar] [CrossRef]
- Shi, C. Behavior of Hybrid Columns of Concrete-Filled Square Steel Tube with FRP-Confined Concrete Core under Axial Compression and Seismic Loading; Tsinghua University: Beijing, China, 2016. [Google Scholar]
- Yan, Y. Test of GFRP-Concrete-Steel Double Skin Tubular Short Columns under Axial Compression; Huaqiao University: Xiamen, China, 2017. [Google Scholar]
- Liu, Y. The Experimental Study on GFRP-Concrete-Steel-Concrete Double-Skin Tubular Hybrid Columns under Axial Compression; Dalian University of Technology: Dalian, China, 2014. [Google Scholar]
- Peng, Y.P.; Liu, Z.X.; Xu, X.S.; Chu, F.R. Application form of GFRP in civil engineering structure. High Technol. Fibers Appl. 2002, 27, 21–24. [Google Scholar]
- Peng, J.; Hu, S.; Zhang, J.; Cai, C.S.; Li, L.Y. Influence of cracks on chloride diffusivity in concrete: A five-phase mesoscale model approach. Constr. Build. Mater. 2019, 197, 587–596. [Google Scholar] [CrossRef]
- Xue, J.Q.; Briseghella, B.; Chen, B.C. Effects of debonding on circular CFST stub columns. J. Constr. Steel Res. 2003, 69, 64–76. [Google Scholar] [CrossRef]
- Han, L.H.; Yao, G.H. Influence of concrete compaction on the strength of concrete-filled steel RHS columns. J. Constr. Steel Res. 2012, 59, 751–767. [Google Scholar] [CrossRef]
- Xue, J.; Chen, B.; Briseghella, B. Experimental research on debonding in concrete-filled steel tubes columns subjected to eccentric loading. IABSE Symp. Rep. 2010, 97, 40–47. [Google Scholar] [CrossRef]
- Liu, X.P.; Sun, Z.; Huang, H.Y.; Tang, S. Research on Mechanical Properties of Separation Concrete-Filled Steel Tubes Subjected to Eccentric Compression on Non-Separation Side. Appl. Mech. Mater. 2011, 117–119, 887–892. [Google Scholar] [CrossRef]
- Han, L.H.; Ye, Y.; Liao, F.Y. Effects of Core Concrete Initial Imperfection on Performance of Eccentrically Loaded CFST Columns. J. Struct. Eng. 2016, 142, 04016132. [Google Scholar] [CrossRef]
- Kundu, T. Ultrasonic and Electromagnetic Waves for Nondestructive Evaluation and Structural Health Monitoring. Procedia Eng. 2014, 86, 395–405. [Google Scholar] [CrossRef] [Green Version]
- Nojavan, S.; Yuan, F.G. Damage imaging of reinforced concrete structures using electromagnetic migration algorithm. Int. J. Solids Struct. 2006, 43, 5886–5908. [Google Scholar] [CrossRef] [Green Version]
- Dhapekar, N.K.; Chopkar, D.M. Structural health monitoring of ordinary portland cement concrete structures using X-ray diffraction. Int. J. Appl. Eng. Res. 2016, 11, 6128–6131. [Google Scholar]
- Li, W.; Xu, C.; Ho, S.C.M.; Wang, B.; Song, G. Monitoring Concrete Deterioration Due to Reinforcement Corrosion by Integrating Acoustic Emission and FBG Strain Measurements. Sensors 2017, 17, 657. [Google Scholar] [CrossRef] [Green Version]
- Venugopal, V.P.; Wang, G. Modeling and analysis of Lamb wave propagation in a beam under lead zirconate titanate actuation and sensing. J. Intell. Mater. Syst. Struct. 2015, 26, 1679–1698. [Google Scholar] [CrossRef]
- Luo, M.; Li, W.; Hei, C.; Song, G. Concrete infill monitoring in concrete-filled FRP tubes using a PZT-based ultrasonic time-of-flight method. Sensors 2016, 16, 2083. [Google Scholar] [CrossRef]
- Lin, B.; Giurgiutiu, V. Development of optical equipment for ultrasonic guided wave structural health monitoring. Int. Soc. Opt. Photonics 2014, 9062, 90620R. [Google Scholar]
- Hiasa, S.; Birgul, R.; Catbas, F.N. Infrared thermography for civil structural assessment: Demonstrations with laboratory and field studies. J. Civ. Struct. Health Monit. 2016, 6, 619–636. [Google Scholar] [CrossRef]
- Ho, S.C.M.; Li, W.; Wang, B.; Song, G. A load measuring anchor plate for rock bolt using fiber optic sensor. Smart Mater. Struct. 2017, 26, 057003. [Google Scholar] [CrossRef]
- Gu, C.; Wang, G.; Rice, J.A.; Li, C. Interferometric Radar Sensor with Active Transponders for Signal Boosting and Clutter Rejection in Structural Health Monitoring; IMS: Montreal, QC, Canada, 2012; pp. 1–3. [Google Scholar]
- Yu, T.Y.; Büyüköztürk, O. A far-field airborne radar NDT technique for detecting debonding in GFRP–retrofitted concrete structures. NDT E Int. 2008, 41, 10–24. [Google Scholar] [CrossRef]
- Li, X.; Luo, M.; Hei, C.; Song, G. Quantitative Evaluation of Debond in Concrete-Filled Steel Tubular Member (CFSTM) Using Piezoceramic Transducers and Ultrasonic Head Wave Amplitude. Smart Mater. Struct. 2019, 28, 75033. [Google Scholar] [CrossRef]
- Sohn, H.; Park, G.; Wait, J.R.; Limback, N.P.; Farrar, C.R. Wavelet-based active sensing for delamination detection in composite structures. Smart Mater. Struct. 2003, 13, 153. [Google Scholar] [CrossRef]
- Krawczuk, M.; Palacz, M.; Ostachowicz, W. Wave propagation in plate structures for crack detection. Finite Elem. Anal. Des. 2004, 40, 991–1004. [Google Scholar] [CrossRef]
- Lammering, R.; Mesecke-Rischmann, S. Multi-field variational formulations and related finite elements for piezoelectric shells. Smart Mater. Struct. 2003, 12, 904. [Google Scholar] [CrossRef]
- Lammering, R.; Jia, J.; Rogers, C.A. Optimal placement of piezoelectric actuators in adaptive truss structures. J. Sound Vib. 1994, 171, 67–85. [Google Scholar] [CrossRef]
- Glushkov, E.V.; Glushkova, N.V.; Kvasha, O.V.; Lammering, R. Selective Lamb mode excitation by piezoelectric coaxial ring actuators. Smart Mater. Struct. 2010, 19, 035018. [Google Scholar] [CrossRef]
- Han, B.; Wang, Y.; Dong, S.; Zhang, L.; Ding, S.; Yu, X.; Ou, J. Smart concretes and structures: A review. J. Intell. Mater. Syst. Struct. 2015, 26, 1303–1345. [Google Scholar] [CrossRef]
- Liu, T.; Huang, Y.; Zou, D.; Teng, J.; Li, B. Exploratory study on water seepage monitoring of concrete structures using piezoceramic based smart aggregates. Smart Mater. Struct. 2013, 22, 065002. [Google Scholar] [CrossRef]
- Bhalla, S.; Soh, C.K. Structural impedance-based damage diagnosis by piezo-transducers. Earthq. Eng. Struct. Dyn. 2003, 32, 1897–1916. [Google Scholar] [CrossRef]
- Yang, Y.; Hu, Y.; Lu, Y. Sensitivity of PZT Impedance Sensors for Damage Detection of Concrete Structures. Sensors 2008, 8, 327–346. [Google Scholar] [CrossRef] [Green Version]
- Park, S.; Kim, J.W.; Lee, C. Impedance-based wireless debonding condition monitoring of CFRP laminated concrete structures. NDT E Int. 2011, 44, 232–238. [Google Scholar] [CrossRef]
- Chen, M. Research on Large Multi-Cavity Irregular Steel Pipe Column Defect Detection Based on Piezoelectric Impedance; Hunan University: Changsha, China, 2014. [Google Scholar]
- Zhou, H.; Yan, S.; Sun, W. Identification of damage to concrete structures using piezoelectric intelligent aggregates. Concrete 2009, 6, 20–23. [Google Scholar]
- Zhao, X. Structural Health Monitoring and Damage Diagnosis Based on Piezoelectric Transducers; Dalian University of Technology: Dalian, China, 2008. [Google Scholar]
- Lim, Y.Y.; Smith, S.T.; Soh, C.K. Wave propagation based monitoring of concrete curing using piezoelectric materials: Review and path forward. NDT E Int. 2018, 99, 50–63. [Google Scholar] [CrossRef]
- Bhalla, S.; Kaur, N. Prognosis of low-strain fatigue induced damage in reinforced concrete structures using embedded piezo-transducers. Int. J. Fatigue 2018, 113, 98–112. [Google Scholar] [CrossRef]
- Kaur, N.; Bhalla, S. Numerical investigations on energy harvesting potential of thin PZT patches adhesively bonded on RC structures. Sens. Actuators A 2016, 241, 44–59. [Google Scholar] [CrossRef]
- Cahill, P.; Hazra, B.; Karoumi, R.; Mathewson, A.; Pakrashi, V. Vibration Energy Harvesting Based Monitoring of an Operational Bridge Undergoing Forced Vibration and Train Passage. Mech. Syst. Signal Process. 2018, 106, 265–283. [Google Scholar] [CrossRef] [Green Version]
- Song, G.; Gu, H.; Mo, Y.L.; Hsu, T.; Dhonde, H.; Zhu, R.R.H. Health monitoring of a concrete structure using piezoceramic materials//Smart Structures and Materials 2005: Sensors and Smart Structures Technologies for Civil, Mechanical, and Aerospace Systems. Int. Soc. Opt. Photonics 2005, 5765, 108–119. [Google Scholar]
- Song, G.; Mo, Y.L.; Otero, K. Health monitoring and rehabilitation of a concrete structure using intelligent materials. Smart Mater. Struct. 2006, 15, 309–314. [Google Scholar] [CrossRef] [Green Version]
- Gu, H.; Song, G.; Dhonde, H. Concrete early-age strength monitoring using embedded piezoelectric transducers. Smart Mater. Struct. 2006, 15, 1837–1845. [Google Scholar] [CrossRef]
- Gu, H.; Song, G.; Dhonde, H.; Mo, Y.L.; Yan, S. Early age strength monitoring of concrete structures using embedded smart piezoelectric transducers. Proc. SPIE 2006, 6179, 117–128. [Google Scholar]
- Song, G.; Gu, H.; Mo, Y.L. Concrete structural health monitoring using embedded piezoceramic transducers. Smart Mater. Struct. 2007, 16, 959–968. [Google Scholar] [CrossRef] [Green Version]
- Song, G.; Gu, H.; Mo, Y.L. Smart aggregates: Multi-functional sensors for concrete structures—A tutorial and a review. Smart Mater. Struct. 2008, 17, 033001. [Google Scholar] [CrossRef]
- Shi, Y.; Luzhe, M. Experimental study on peeling damage identification of CFRP reinforced concrete structures. J. Civ. Eng. and Management 2011, 03, 69–74. [Google Scholar]
- Xu, B.; Zhang, T.; Song, G.; Gu, H. Active interface debonding detection of a concrete-filled steel tube with piezoelectric technologies using wavelet packet analysis. Mech. Syst. Signal Process. 2013, 36, 7–17. [Google Scholar] [CrossRef]
- Feng, Q.; Kong, Q.; Tan, J.; Song, G. Grouting compactness monitoring of concrete-filled steel tube arch bridge model using piezoceramic-based transducers. Smart Struct. Syst. 2017, 20, 175–180. [Google Scholar]
- Yang, W.; Kong, Q.; Ho, S.C.M.; Mo, Y.-L.; Song, G. Real-Time Monitoring of Soil Compaction Using Piezoceramic-Based Embeddable Transducers and Wavelet Packet Analysis. IEEE Access 2018, 6, 5208–5214. [Google Scholar] [CrossRef]
- Zhang, J.; Huang, Y.; Zheng, Y. A Feasibility Study on Timber Damage Detection Using Piezoceramic-Transducer-Enabled Active Sensing. Sensors 2018, 18, 1563. [Google Scholar] [CrossRef] [Green Version]
- Zhang, J.; Li, Y.; Huang, Y.; Jiang, J.; Ho, S.-C.M. A Feasibility Study on Timber Moisture Monitoring Using Piezoceramic Transducer-Enabled Active Sensing. Sensors 2018, 18, 3100. [Google Scholar] [CrossRef] [Green Version]
- Li, H.; Zhao, X. Research and application of piezoelectric intelligent sensing structure in civil engineering. Earthq. Eng. Eng. Vib. 2004, 24, 165–172. [Google Scholar]
- Yan, L. Research on Damage Monitoring of Multi-Cavity CFST Columns Based on Piezoelectric Transducers; Hunan University: Hunan, China, 2013. [Google Scholar]
- Feng, Z.; Liang, M.; Chu, F. Recent advances in time–frequency analysis methods for machinery fault diagnosis: A review with application examples. Mech. Syst. Signal Process. 2013, 38, 165–205. [Google Scholar] [CrossRef]
- Mallat, S.G. A theory for multiresolution signal decomposition: The wavelet representation. IEEE Trans. Pattern Anal. Mach. Intell. 1989, 11, 674–693. [Google Scholar] [CrossRef] [Green Version]
- Venkatasubramanian, V.; Rengaswamy, R.; Yin, K.; Kavuri, S.N. A review of process fault detection and diagnosis: Part I: Quantitative model-based methods. Comput. Chem. Eng. 2003, 27, 293–311. [Google Scholar] [CrossRef]
- Taha, M.M.R.; Noureldin, A.; Lucero, J.L.; Baca, T.J. Wavelet transform for structural health monitoring: A compendium of uses and features. Struct. Health Monit. 2006, 5, 267–295. [Google Scholar] [CrossRef]
- Sun, W.; Yan, S.; Meng, Y.; Zhou, H. Experimental study on stress wave attenuation characteristics of piezoelectric transducer concrete structures. J. Shenyang Jianzhu Univ. Nat. Sci. Ed. 2010, 26, 833–837. [Google Scholar]
- Giurgiutiu, V.; Rogers, C.A. Recent Advancements in the Electro-Mechanical (E/M) Impedance Method for Structural Health Monitoring and NDE. Proc. SPIE Int. Soc. Opt. Eng. 2000, 3329, 536–547. [Google Scholar]


| Incentive Method and Parameters | Acquisition Parameter | Filtering Parameter | ||||
|---|---|---|---|---|---|---|
| Sweep | Amplitude | 10 V | Frequency | 1 MHz | Filter | Butterworth |
| Range | 50 kHz–350 kHz | Length | 512 k | Type | Bandpass | |
| Frequency | 0.6 kHz | Sampling time | 524 ms | Order | 5 | |
| Step size | 1 ms | Trigger mode | Normal | Range | 30 kHz–350 kHz | |
| Pulse | Amplitude | 100 V | Frequency | 2 MHz | Filter | Butterworth |
| Width | 2 μs | Length | 1 k | Type | Bandpass | |
| Number of coded bits | 20 | Sampling time | 512 ms | Order | 5 | |
| Duration | 40 μs | Trigger mode | Normal | Range | 150 kHz–500 kHz | |
| Incentive Method and Parameters | Acquisition Parameter | Filtering Parameter | ||||
|---|---|---|---|---|---|---|
| Sweep | Sweep amplitude | 10 V | frequency | 1 MHz | Filter | Butterworth |
| Sweep range | 30 kHz–230 kHz | length | 512 k | Type | Bandpass | |
| Step frequency | 0.4 kHz | Sampling time | 524 ms | Order | 5 | |
| Step size | 1 ms | Trigger mode | Normal | Range | 10 kHz–230 kHz | |
| Pulse | amplitude | 100 V | frequency | 2 MHz | Filter | Butterworth |
| Width | 2 μs | length | 1 k | Type | Bandpass | |
| Number of coded bits | 20 | Sampling time | 512 ms | Order | 5 | |
| Duration | 4 μs | Trigger mode | Normal | Range | 150 kHz–400 kHz | |
| Specimen A1 | Debonding Area | Wavelet Packet Energy Value/V2 | Damage Index DI | The Arrival Time of Pulse/μs | Delay of Pulse/μs |
|---|---|---|---|---|---|
| Case 1 | 0 mm2 | 57.7876 | 0 | 21.5 | 0 |
| Case 2 | 2000 mm2 | 16.5961 | 0.6965 | 36.0 | 14.5 |
| Case 3 | 4000 mm2 | 12.8845 | 0.7809 | 44.5 | 23.0 |
| Case 4 | 6000 mm2 | 5.0520 | 0.9084 | 57.5 | 36.0 |
| Specimen A2 | Debonding Thickness | Wavelet Packet Energy Value/V2 | Damage Index DI | The Arrival Time of Pulse/μs | Delay of Pulse/μs |
|---|---|---|---|---|---|
| Case 1 | 0 mm | 13.5495 | 0 | 19 | 0 |
| Case 2 | 5 mm | 5.1830 | 0.6608 | 26 | 7 |
| Case 3 | 10 mm | 3.3962 | 0.7997 | 42 | 23 |
| Case 4 | 15 mm | 0.0983 | 0.9931 | 60.5 | 41.5 |
© 2020 by the authors. Licensee MDPI, Basel, Switzerland. This article is an open access article distributed under the terms and conditions of the Creative Commons Attribution (CC BY) license (http://creativecommons.org/licenses/by/4.0/).
Share and Cite
Yang, W.; Yang, X.; Li, S. Monitoring of Interfacial Debonding of Concrete Filled Pultrusion-GFRP Tubular Column Based on Piezoelectric Smart Aggregate and Wavelet Analysis. Sensors 2020, 20, 2149. https://doi.org/10.3390/s20072149
Yang W, Yang X, Li S. Monitoring of Interfacial Debonding of Concrete Filled Pultrusion-GFRP Tubular Column Based on Piezoelectric Smart Aggregate and Wavelet Analysis. Sensors. 2020; 20(7):2149. https://doi.org/10.3390/s20072149
Chicago/Turabian StyleYang, Wenwei, Xia Yang, and Shuntao Li. 2020. "Monitoring of Interfacial Debonding of Concrete Filled Pultrusion-GFRP Tubular Column Based on Piezoelectric Smart Aggregate and Wavelet Analysis" Sensors 20, no. 7: 2149. https://doi.org/10.3390/s20072149