1. Introduction
The evolution of wireless communication has led to their adoption in a wide range of applications, including utilities and administrative authorities. In addition, the growth in population, as well as in the services offered in cities, has led, in some cases, to the construction of underground tunnels in order to reduce the visual impact within the city center, as well as facilitating maintenance and operation works of utilities. In recent years, the underground sector has seen the use of wireless networking for certain projects, i.e., tunneling construction [
1], but they do not make full use of the benefits offered by wireless communications. The utilization of wireless networking in the underground environment offers the potential for major benefits in productivity and safety. Currently, most of the communications infrastructure in operational tunnels such as transport tunnels are provided by cables. However, if it is an infrequently accessed tunnel, a wired communication infrastructure will not generally be available; therefore, the maintenance, upgrade and inspection of those tunnels will rely on wireless communications [
2]. Nevertheless, one of the issues that local authorities have considered is the fact that, inherently, underground service tunnels lack coverage from exterior wireless systems, such as mobile networks or municipal wireless local area networks (WLAN), which can lead to potentially dangerous situations for maintenance personnel working within the tunnel. Therefore, wireless coverage should be deployed within the underground installation in order to guarantee real-time connectivity.
In emergency situations, such as fires, explosions or earthquakes, the normal wired communication infrastructure of an underground environment could be inoperable. Due to that, sometimes, it is necessary for the emergency services to have a wireless communication infrastructure following a serious incident. Rescue services normally are equipped with very high-frequency (VHF) or ultra-high-frequency (UHF) radio equipment, which is effective aboveground, but such radios have a very poor range in tunnels. The use of leaky feeder cables [
3] is usually used to extend the coverage of VHF and UHF systems. However, the use of microwave frequencies provides a much greater range, without expensive leaky feeder systems, in such environments, and, also, they offer greater bandwidths. In addition, leaky feeders are also susceptible to damage during a fall or explosion. In [
4], a system including both wired and wireless communications was described that enabled voice communication, as well as the exchange of photographs, video streams or other data, inside the tunnel. In [
5], a wireless-based personnel tracking system to track people in an underground environment was presented, showing that the system can reduce the time taken for rescuers to reach any casualties.
The characterization of wireless channel behavior within complex heterogenous underground environments, such as utility tunnel systems, enables to perform link-balance estimations, which lead to coverage/capacity estimations. In this sense, an adequate estimation of losses is relevant in order to characterize the complex operation conditions, such as those given by high-obstacle density, with a high percentage of non-line-of-sight conditions and multipath propagation buildup owing to scatterers distributions within the scenarios under test or the effect of diffuse scattering, among others. This information is relevant in order to perform radio-planning tasks, which are required in order to design the network topology, node configuration and device-related parameters, such as antenna location/type. A radio-planning analysis was studied for different types of wireless networks (e.g., broadcasting systems, trunk radios, public land mobile systems, microwave transport links, etc.), considering aspects such as multi-variable optimization (energy consumption, node density and transmission rate as a function of the coverage area under analysis) and the impact of elements such as user density variation, estimation of cell edge conditions or interference background levels [
6,
7,
8,
9,
10,
11].
With the progressive adoption of wireless sensor networks, radio-planning tasks have been adapted to optimize network configuration [
12,
13,
14,
15,
16,
17,
18]. In this case, the specific considerations given by the wireless sensor network (WSN) operation have to be taken into account, such as the random node location, the existence of predominant non-line-of-sight operation conditions or the inherent energy consumption and processing constraints, among others. In this way, a wireless channel analysis can be effectively employed in order to assess elements such as cooperative MAC schemes, optimized routing protocols or specific data aggregator policies in order to optimize the overall system operation. One of the main challenges in this case is to consider accurate radio channel conditions, given the large variability of node location and configuration within the wireless network layout, usually leading to the use of empirical/analytical-based channel estimation models. Radio propagation has been studied for different wireless systems within the interiors of galleries and tunnels [
19,
20,
21,
22], as well as for different tunnel geometries [
23]. Other approaches have developed diffraction-based models, such as the alternate direction implicit parabolic equation method [
24], boundary element method [
25], numerical calculation of a vector parabolic equation [
26] or application of the perturbation theory, among others. Another approach is based on the use of deterministic methods, such as ray launching (RL) or ray tracing (RT). One of the main issues of these approaches is the inherent divergence within the RL calculation as the distance increases between the transmit and receive antenna. In this case, solutions in scaled frequency models have been given by reconstructing the initial wave front of the source, achieved by ray density normalization [
27]. One of the approaches adopted to perform wireless characterization within tunnels has been the adoption of dielectric waveguide models, in which the tunnel is emulated by a waveguide with dielectric walls [
28]. These models, however, do not take into account the additional complexities, which appear in underground service tunnels, such as ducts, walkways or distribution trays, among others. Complete modeling can be achieved by employing full-wave electromagnetic simulation techniques, such as the finite difference time domain (FDTD) or frequency domain finite element techniques [
29,
30]. However, the computational cost of these techniques can be very high, due to the large size of the tunnel structures as compared to the wavelengths considered in conventional wireless communication systems. Moreover, the tunnels analyzed are usually devoted to road traffic or trains, with inherently larger cross-sections and lower structural complexity as compared with utility tunnels, with dense obstacle distributions.
In this paper, an in-house developed three-dimensional ray-launching (3D-RL) code is employed to analyze the wireless propagation in a real urban utility tunnel scenario at 868-MHz operation frequency. The aim of the article is a thorough analysis of the real results of measurements in the tunnels in order to obtain the optimal parameters for the simulation’s 3D-RL algorithm, so that, after their application, the simulated and experimental results show good agreement. By adequately modeling the tunnel gallery structure, a precise characterization for the complete extension of the tunnel system can be obtained, which can aid in the deployment of wireless communication and monitoring systems. Furthermore, a complete radio wave propagation analysis is performed, and a WSN deployment is proposed for the considered real underground utility tunnel system gallery. Finally, an infrastructure security and a work safety monitoring application prototype is developed in order to warrant work safety legislation.
The paper is organized as follows: the 3D-RL deterministic employed technique, as well as the considered real and simulated underground scenario are described in
Section 2.
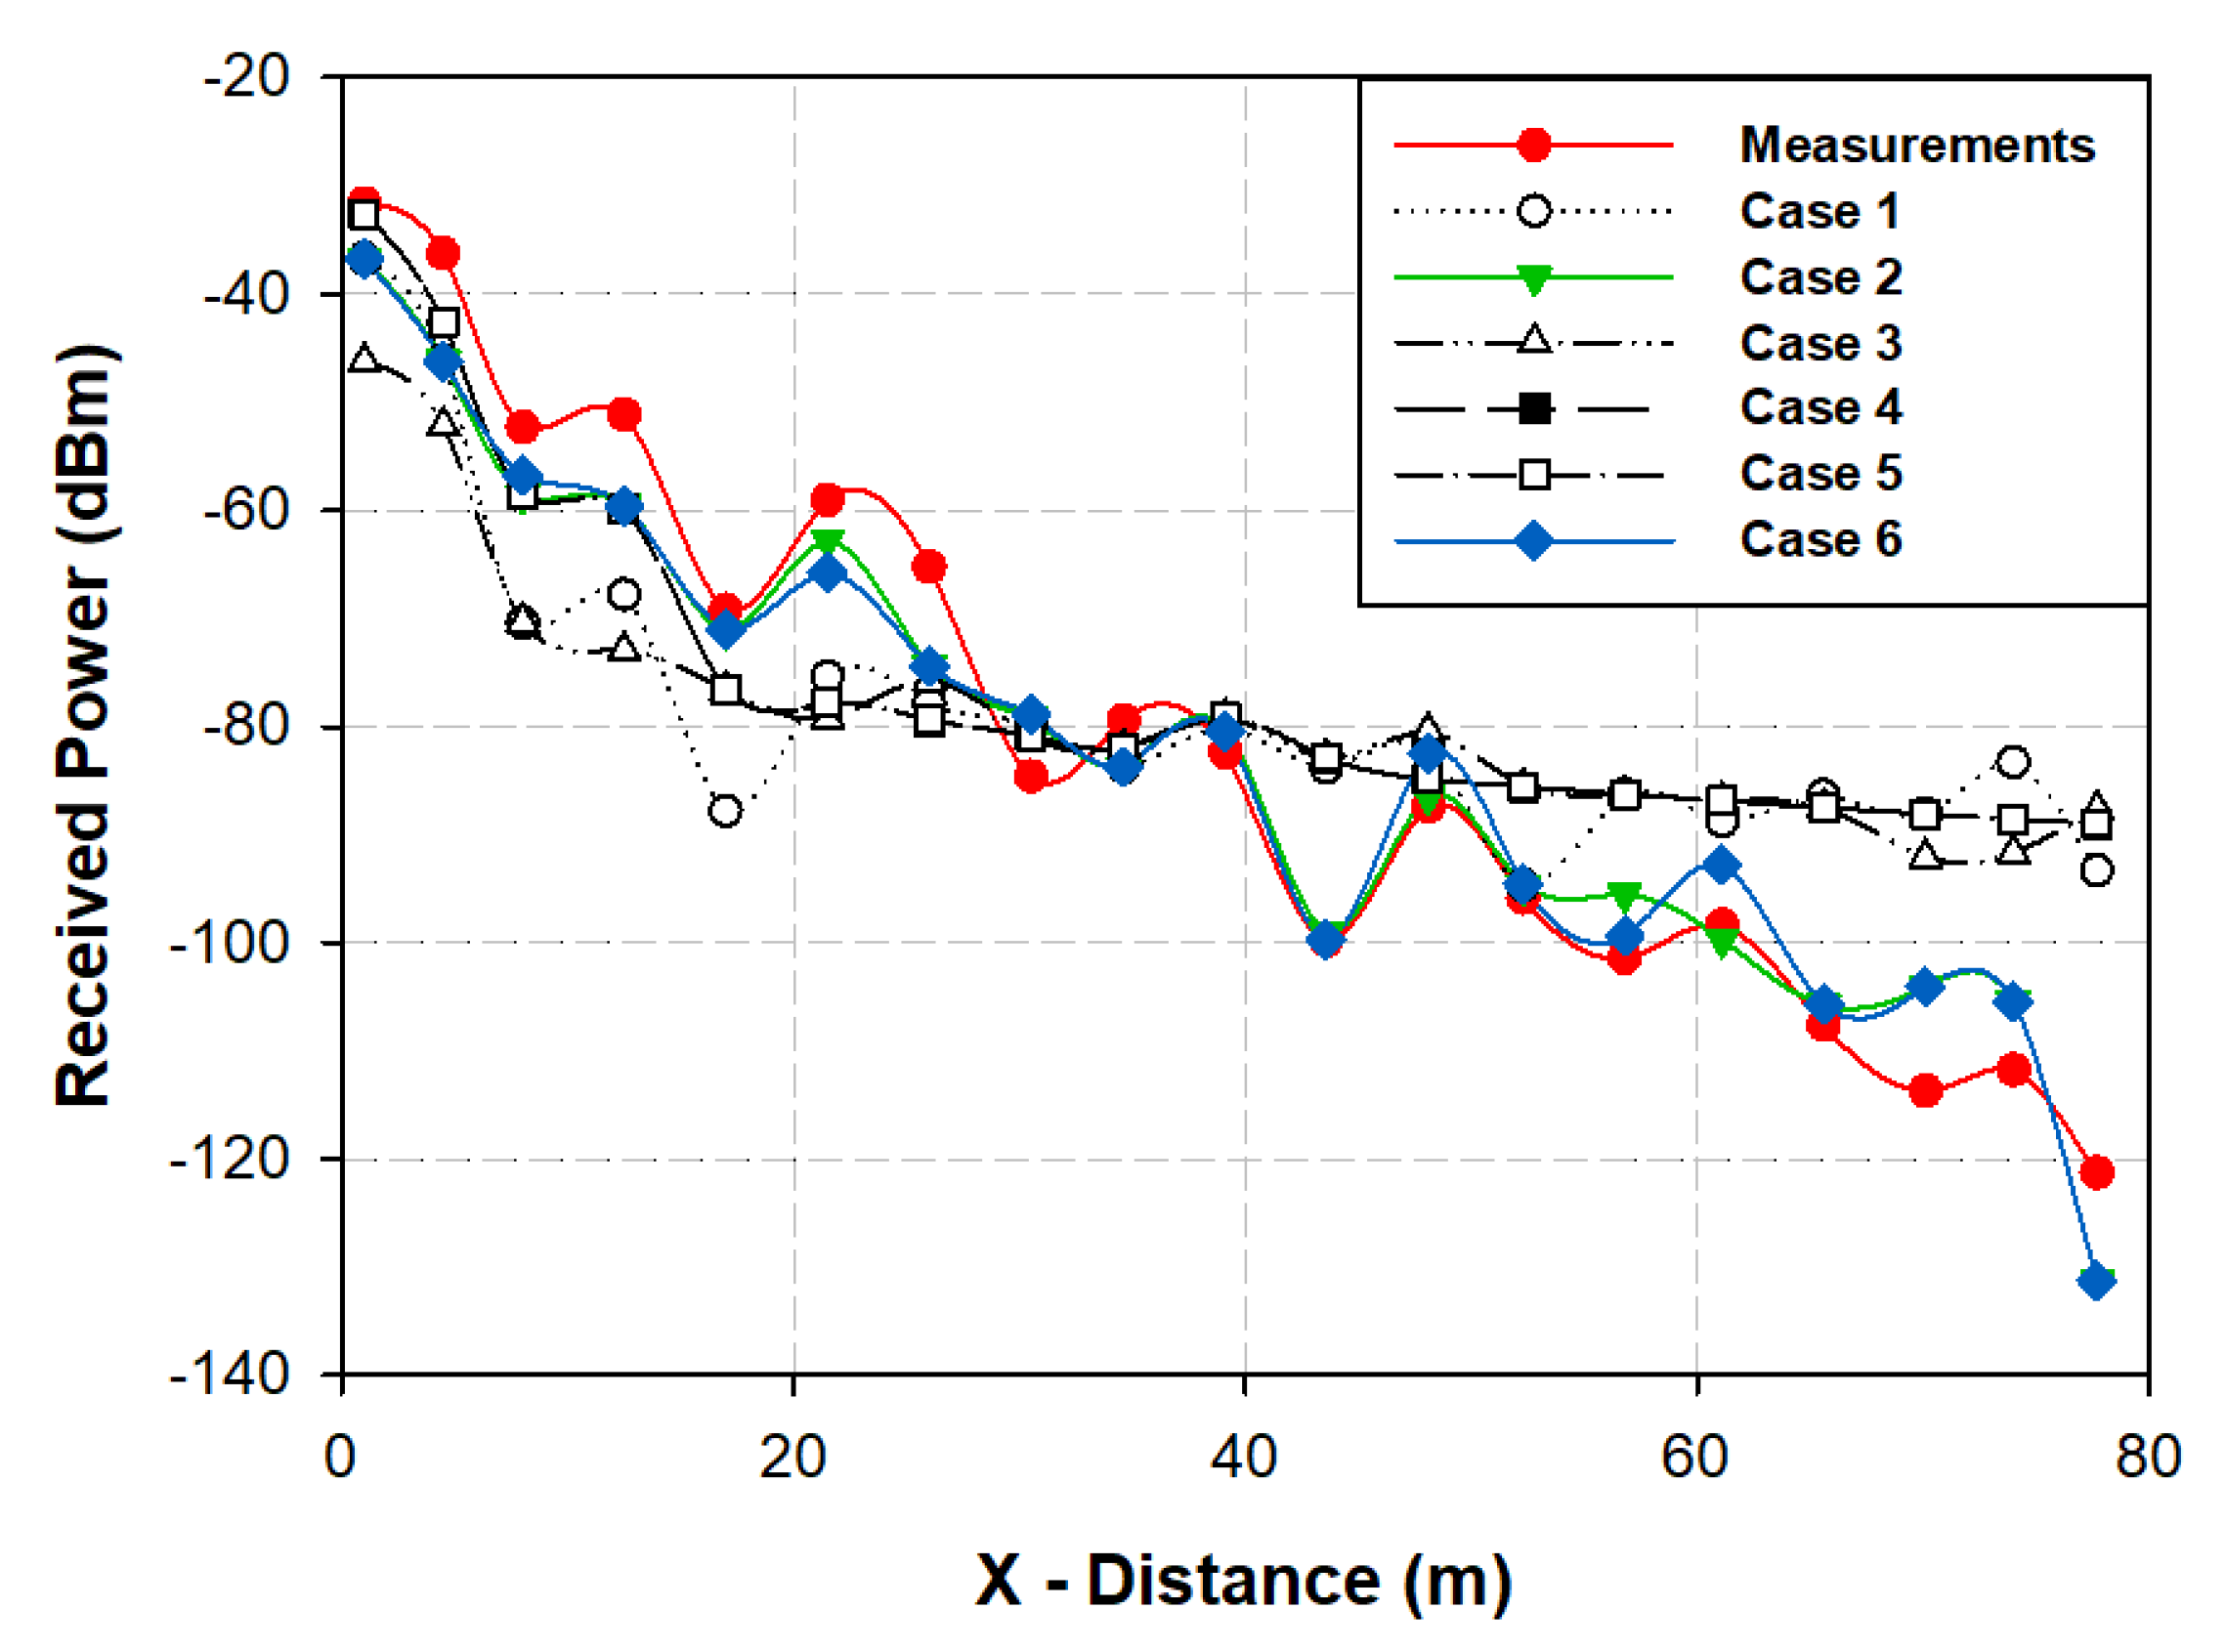
Section 3 presents the radio channel analysis and the required convergence analysis due to the particular characteristics of the scenario. This analysis was performed compared with experimental measurements in the real utility tunnel in order to obtain the optimal simulation parameters. Once the optimal parameters were obtained, large- and small-scale simulation results within the tunnel were presented in order to characterize the radio wave propagation within this particular environment. In
Section 4, the WSN deployment issues are discussed, and the infrastructure security and work safety monitoring application prototype are presented. Finally, the conclusions are given in
Section 5. A schematic view of the structure of this paper is presented in
Figure 1.
2. Materials and Methods
In this section, the in-house deterministic technique based on the 3D-RL approach is described, as well as the considered real and simulated underground utility tunnel scenario used for this analysis.
2.1. 3D Ray-Launching Technique
The in-house implemented RL algorithm, based on MATLAB programming environment, was used to analyze radio wave propagation in the considered underground tunnel scenario. The main difference between RL and classical RT methods is that, in the RL technique, the principle is that rays are launched in a solid angle and the rays arriving at the receiver are considered the true path. However, in classical RT techniques, the image of the transmitter or of the receiver is calculated, to be used to find the reflected and refracted paths.
The RL algorithm is based on geometrical optics (GO) and the geometrical theory of diffraction (GTD). To avoid the nonfield regions predicted by GO in the shadow areas, the diffracted rays are considered with the GTD and its uniform extension, called the uniform GTD (UTD). These diffracted rays are introduced to avoid the abrupt field changes and consider the proper field corrections. Electromagnetic phenomena such as reflection, refraction and diffraction are considered. The principle of the algorithm is that hundreds or thousands of rays are launched for a fixed position of the transmitter, which is an input parameter of the algorithm. The radiation pattern of the transmitter and receiver antennas can be introduced, with the aid of the elevation angle θ and the azimuth angle φ, considering the spherical coordinate system. Each ray has a different path in the considered scenario, and all the parameters related with its path are stored in a matrix. All the rays that achieve the receiver are considered in the calculation of the electromagnetic field at that point. The whole scenario is divided into a three-dimensional array of cuboids, with a different spatial resolution in the
x-axis,
y-axis and
z-axis, depending on the specific characteristics and dimensions of the considered scenario. The basis is that, when a ray impacts an obstacle or a wall in the scenario under analysis, reflected and refracted rays are created, following Snell’s law. When a ray hits an edge, a new family of diffracted rays are created, according to the UTD. The methodology is shown in
Figure 2.
As input parameters of the algorithm, the frequency of operation, number of multipath reflections and spatial and angular resolution are considered. In the simulations, the material properties of all the obstacles within the scenario are also considered, taking into account the conductivity and relative permittivity at the frequency range of operation of the system under analysis. The in-house implemented 3D-RL algorithm has already been validated in the literature for different complex scenarios for frequencies up to 6 GHz. Some scenarios that have been considered have been typical office scenarios [
31,
32], sports environments [
33], vehicular communications [
34] or WSNs in smart cities [
35]. The detailed description of the algorithm can be found in [
36].
2.2. Scenario Description
In order to perform the radio wave propagation analysis within the tunnel, two scenarios were considered for the 3D-RL simulations: a real underground utility tunnel scenario located in the Old Town of Pamplona (Pamplona, Navarre, Spain) and a tunnel recreation of one of its gallery sections. The distribution of the considered experimental underground utility tunnels gallery is presented in
Figure 3a with green lines on the map. As it can be seen from the figure, the tunnels have different sections, where the most remarkable characteristics are the different straight section lengths connected to one section with some intersections and slight curves. The dashed yellow line in the figure represents the straight tunnel section of 80-m-long where the experimental measurements were performed in order to calibrate the 3D-RL algorithm, as it is explained in
Section 3. These tunnels were built in the early 2000s, under some specific streets, with the aim of easing maintenance operations. The tunnels consist of an outer layer of connected cement rings, with the inner part allocating several metallic trays for the corresponding utilities. The longest straight tunnel section is 327 m. A metallic hallway was also installed in order to provide access to the maintenance personnel, as can be seen in
Figure 3b. Currently, they provide a route for the electrical connections, telephone connections, waste disposal and water distribution systems of the neighborhood. It is worth noting that slightly different utility tunnels have been built in newer neighborhoods of Pamplona, as can be seen in
Figure 3c. Specifically, this picture corresponds to a recently repaired tunnel located in the suburb of Lezkairu, which began being built in 2008, and it has a total length of tunnels of 5600 m, plus 2300 m of sub-tunnels.
Regarding security and safety, the utility tunnels include common intrusion detection and antifire systems, with their corresponding local alarms. However, one of the main problems of these types of tunnels is the lack of wireless coverage within the tunnel, which initially was planned to be provided by external infrastructures, such as municipal Wi-Fi or mobile networks (3G/4G). However, in reality, these technologies are unable to provide coverage to all tunnel sections, as signal attenuation can be very high in some sections due to the different tunnel depths. In this sense, one of the main concerns of municipal authorities has been this lack of wireless coverage within the tunnels, as coverage is needed in order to provide security and safety to the maintenance staff. Thus, a specific indoor coverage system is required, and therefore, a complete radio planning analysis before the deployment of the wireless system is needed in order to secure coverage and provide good performance at an affordable cost.
As stated before, in order to characterize the variations of received power within the proposed utility tunnel, simulations by means of a 3D-RL code were performed. Material parameters were considered; basically, cement walls, aluminum trays and PVC tubes of different dimensions. A section of the simulation scenario is depicted in
Figure 4, which corresponds with the same section where the experimental measurements were performed (see yellow dashed line in
Figure 3a). The dimensions of the tunnel section are the following: width 2 m, height 3 m and length 80 m. Simulation results can be extended in length; however, due to measurement limitations, they will be considered up to the previously stated distance. The complete topological and morphological characteristics of this scenario were taken into account, prior visual inspection and measurement of dimensions within the tunnels. A schematic view of the employed simulation scenario is shown in
Figure 4.
One of the particular aspects of this scenario is the fact that the tunnel is not a conventional tunnel (i.e., free hallway with walls that can be smooth or can present a certain degree of surface roughness and, hence, diffuse scattering), due to the fact that there is a set of service trays placed inside the tunnel. This leads to new interactions with the electromagnetic waves launched by the source, with strong multipath component generation given the large ratio between the length of the tunnel in comparison with the width of the tunnels, tray dimension and inter-tray distance. This condition implies the need for including more precise topological information of the scenario in order to consider the interaction, specifically for launched rays within a RL algorithm, such as the one employed and described in next subsection.
4. WSN Deployment
In this section, a generic WSN deployment case for complex heterogeneous utility tunnels is presented considering environmental and propagation conditions by means of a calibrated 3D-RL simulation tool. A complete WSN deployment feasibility study is introduced focusing on the reliability of wireless communications technologies (Zigbee and LoRaWAN) within the considered scenario and, particularly, in terms of security management, assessing the human presence propagation impact over the system. Finally, an optimized WSN deployment is presented considering the morphology and topology of the real case study underground tunnel system environment and an infrastructure and work safety monitoring application prototype.
4.1. Safety Management and Occupational Risk Control
One of the main problems of working in tunnels and service galleries, which is aggravated by their length and narrowness, is the safety management and the occupational risks control. The health of the working environment of the maintenance staff must always be guaranteed. This includes monitoring temperature and humidity levels but, also, monitoring CO and CO2 levels; the presence of flammable or toxic gases and compounds and the presence of animals (rats, snakes, etc.), among others. In addition, mobility within the tunnel, the absence of obstacles or elements that hinder movement must be guaranteed. It should be borne in mind that employees, on many occasions, must move tools to carry out their maintenance, repair and installation tasks.
Current regulations related to labor risk prevention state that work must be done at least in pairs and desirable in work teams to minimize risks and prevent accidents. In addition, workers must notify the coordination center of the task to be performed; the starting time; the estimated duration; the working conditions (lighting, power supply cut, etc.); the possible risks and any other information that may help to ensure safety at work during the job performance. Hence, personnel monitoring implies that the staff will carry their own sensors (located in the inhalation zone and at head height) and must be able to interconnect to the monitoring network. Thus, the use of a wireless network is particularly advantageous in the latter case, as it offers a greater ease of work (hands-free) and greater mobility for workers. However, the presence of human beings within the tunnels can affect the radio propagation, even more considering their narrowness. Therefore, an adequate RF characterization and a complete risk control assessment must be performed in order to warrant compliance with occupational safety management within the utility tunnels.
4.2. Technology Analysis: ZigBee 868 MHz vs. LoRaWAN Range within the Tunnels
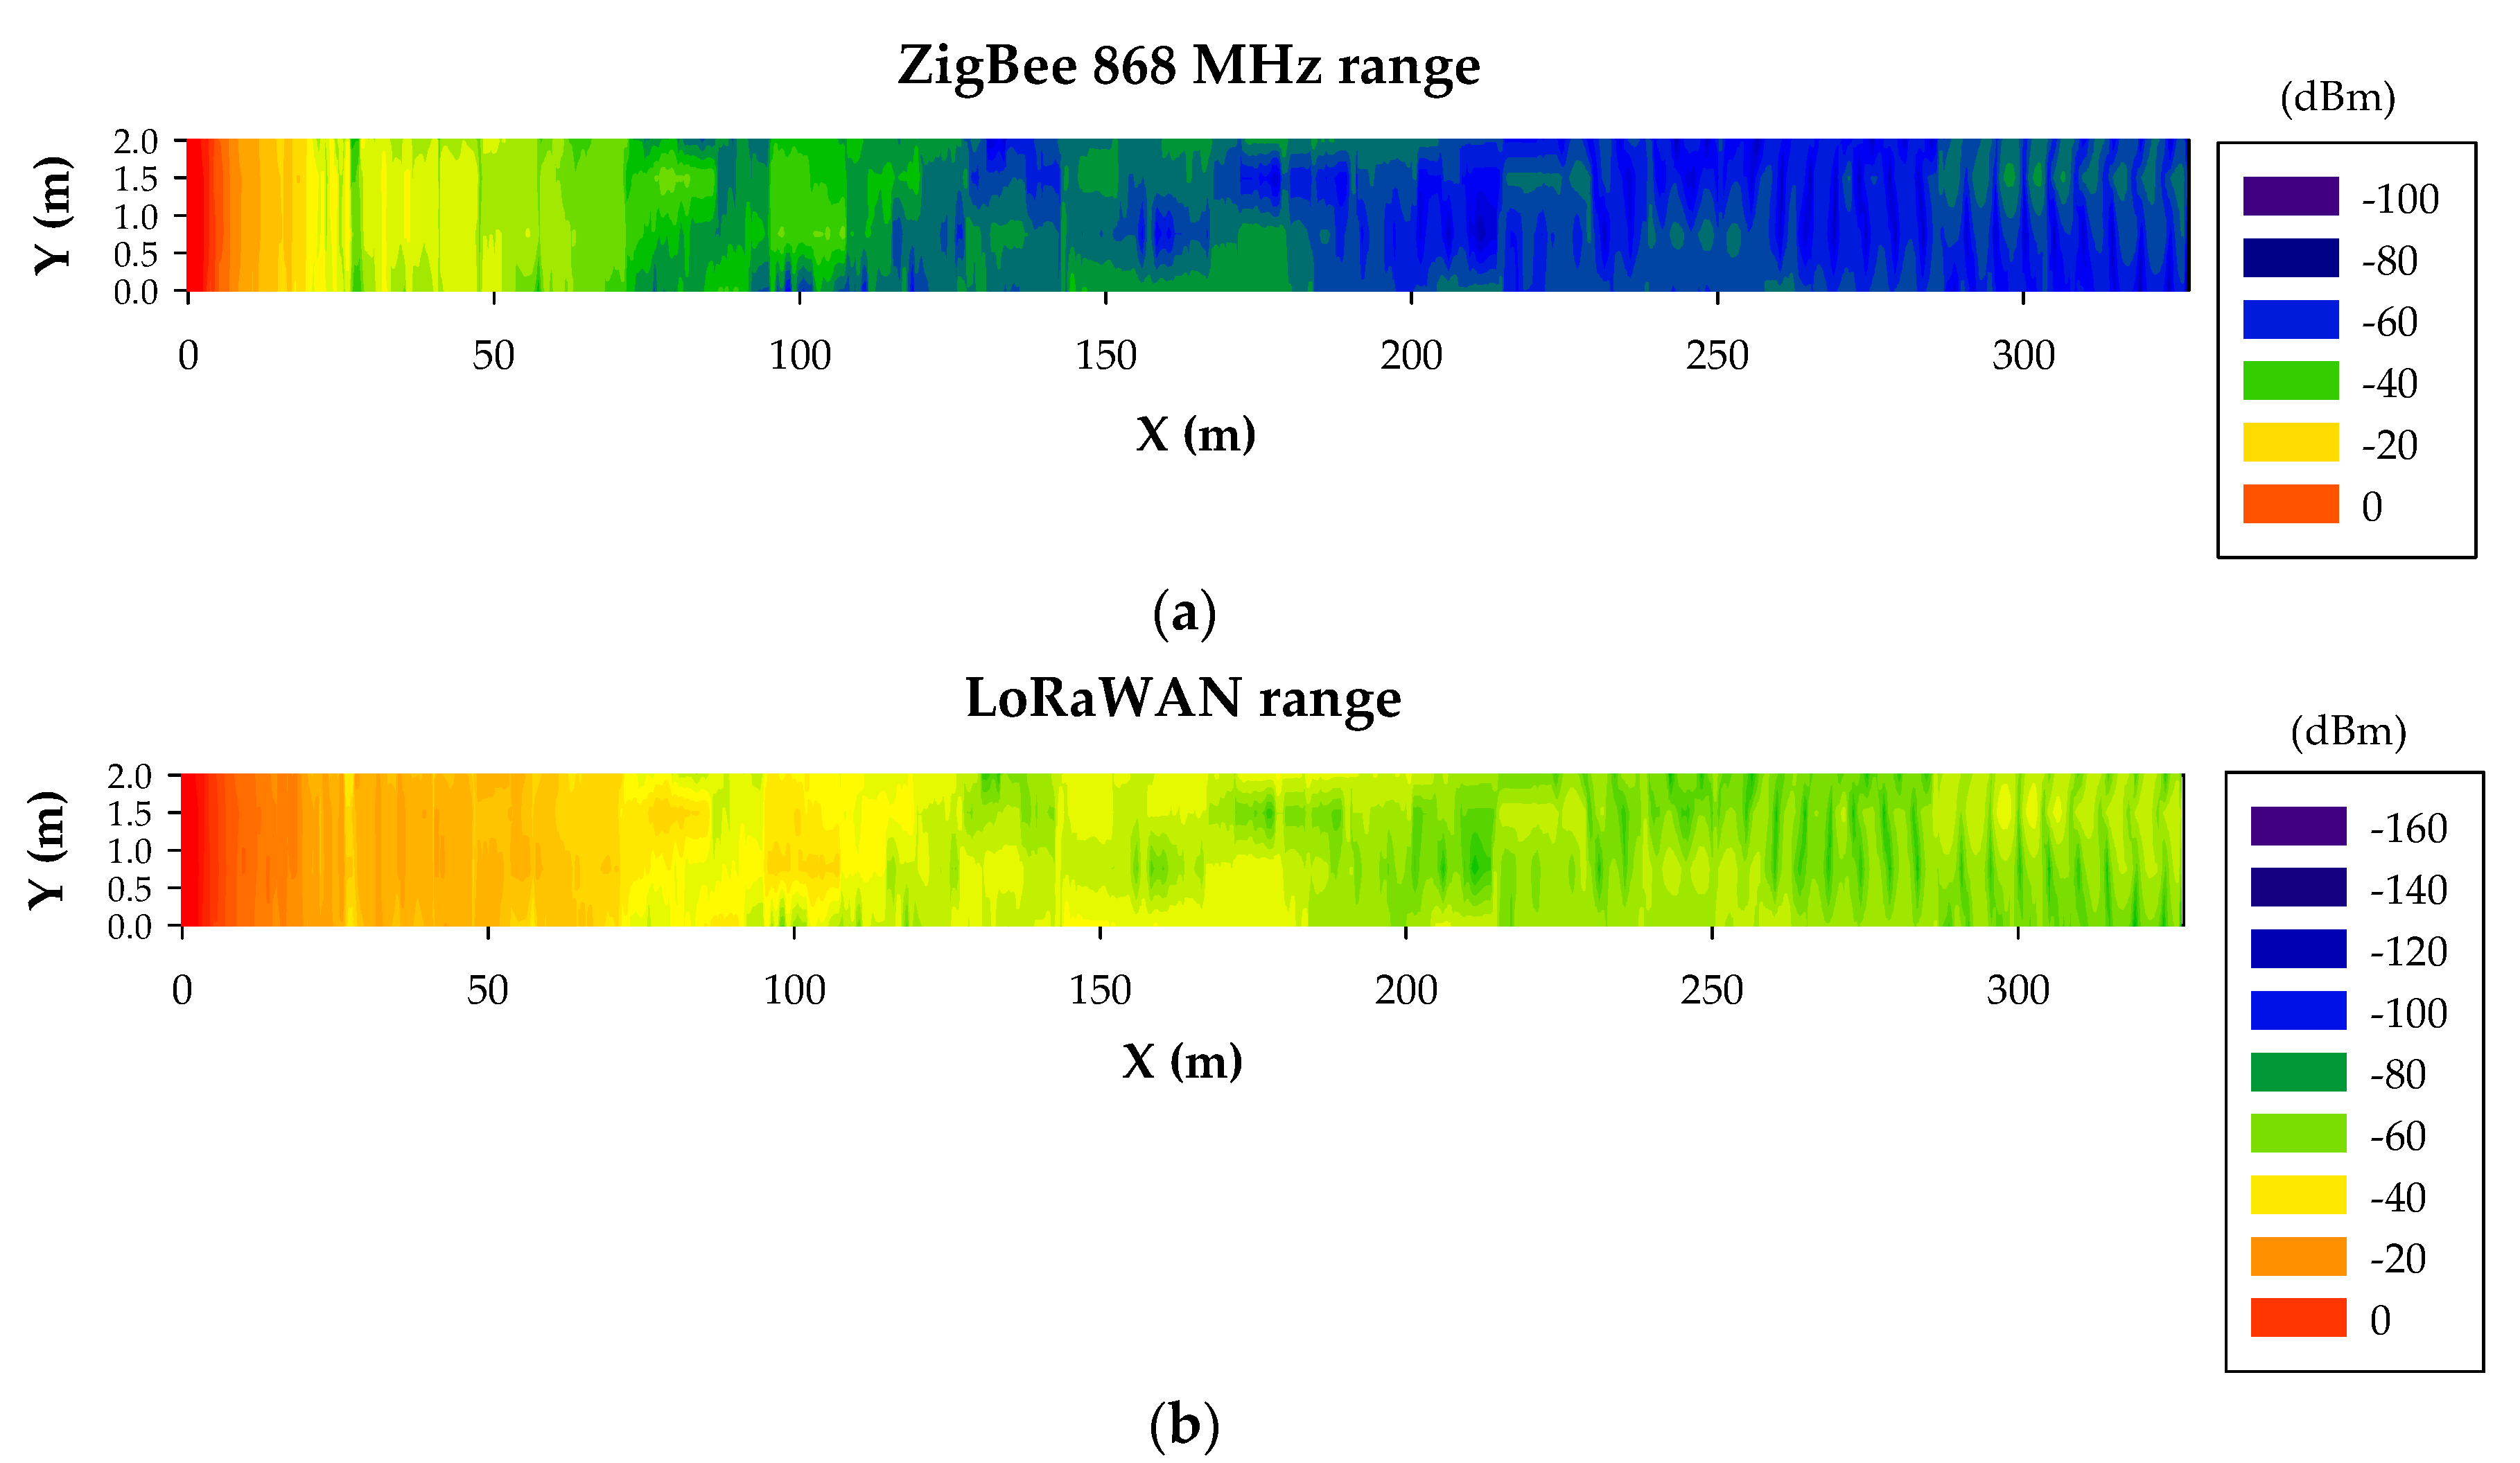
3D-RL simulations were shown to be accurate for an optimized radio-planning analysis in this complex and particular underground environment. Based on these preliminary results, the coverage for both Zigbee and LoRaWAN wireless devices can be estimated (i.e., the number of wireless nodes required for the whole tunnel) considering their corresponding device sensitivities, which are around −100 dBm and −148 dBm, respectively. In order to provide clear insight, range estimations within the tunnel for both wireless technologies were obtained. For that purpose, a transmitter was placed on the ceiling at the beginning of the tunnel with a length equal to the longest tunnel section of the scenario under analysis (327 m, as it is presented in
Figure 3a). The transmitted powers were set to 13 dBm and 14 dBm for ZigBee and LoRaWAN, respectively. As can be concluded from the results depicted in
Figure 10, both wireless technologies covered the entire length of the tunnel, although LoRaWAN presented better results due to its better sensitivity (−148 dBm) compared to ZigBee (−100 dBm). Thus, in terms of wireless link distance within a straight tunnel of these characteristics, both wireless technologies could be employed.
Nevertheless, in the real environment, different phenomena can lead to channel impairments, such as the presence of people within the tunnels or worsening the radio propagation conditions. Therefore, a further study is required in order to provide safe, robust, reliable and efficient WSN deployment.
4.3. Scatterers Analysis: Human Presence within the Tunnel
An important factor that has to be assessed in terms of radio propagation in small cross-section utility tunnels is the presence of human beings. It is a well-known fact that human bodies create a shadowing effect [
42], and in such a narrow environment like the underground tunnels presented in this work, this effect was expected to be especially significant. In order to have insight into this phenomenon, different simulations were performed using the calibrated 3D-RL simulation tool. Human body models are included in the 3D-RL software, emulating occupational personnel at the location of interest. This human body model was implemented for the simulation, considering the dimensions of a standard person and all the dispersive material properties of its different body parts (i.e., skin, bones, muscles, blood, different organs, etc.). A further description of the considered human body model, as well as a signal attenuation analysis for different parts of the human body, can be found in reference [
43]. By including computational human body models within the considered scenario, the results of the human presence effect were obtained, allowing analysis and comparison. In the context of the utility tunnel, teams of up to three workers are generally sent into the tunnels for performing different security and maintenance tasks, in order to minimize the risks and prevent accidents due to municipal authorities’ requirements regarding occupational risk prevention legislation. Therefore, a complete analysis of the human presence within the tunnel was carried out considering different densities of human body models in different locations.
First of all, the received power results of a specific scenario with no humans is presented in
Figure 11, considering a transmitter located on the tunnel ceiling at
x-axis = 20 m for reference and comparison purposes.
Then, a single human body model was included in the scenario at different
x-axis locations in order to analyze the influence of the surrounding environment and the transmitter distance along the tunnel. The considered locations were the following: 20 m, 27 m, 34 m, 41 m and 48 m. In
Figure 12, the corresponding RF power levels distribution results at 1.5-m height are presented. As expected, the major RF distribution changes are mainly in the area behind the location of the human body, due to the shielding effect.
In order to gain more insights into these results,
Figure 13 shows the differences between the case without human presence (i.e.,
Figure 11) and the different case studies considering a single human body model at distinct locations (i.e.,
Figure 12). As can be clearly observed from
Figure 13, the presence of a single worker within the tunnel in different locations leads to RF power level differences up to 18 dB. Although this difference is lower the higher the distance from the transmitter is, it has to be taken into account for an accurate range estimation. Thus, a margin of about 20 extra dBs should be added to the wireless communication range estimated in the previous subsection both for ZigBee and LoRaWAN technologies.
Finally, extra simulations were carried out in order to assess if the obtained 20 dBs are enough when work teams of three people are within the utility tunnel. In
Figure 14, a rendered view of the inclusion of the three human body models within the created tunnel scenario for the 3D-RL simulation is presented.
Figure 15 presents the obtained estimation results in terms of the RF power level distribution differences between the case without a human presence and the case study with a three-worker team at different locations along the tunnel. From the results, a mild growth variation can be observed when comparing the three-worker team case study with the single-worker case study, and therefore, it can be stated that the previous estimated 20-dB margin is enough for a proper RF planification when considering teams of up to three workers within the tunnel.
In general, the obtained results regarding the study of the human presence within the tunnel show that a margin of about approximately 20 extra dBs is required in order to preserve the received RF power level above the sensitivity level, thus ensuring the wireless communication links between nodes, even when up to a three-worker team is considered within the tunnel. This extra margin corresponds to no need of extra range reduction estimated in the previous subsection analysis, as can be seen in
Figure 16. However, since the sensitivity value of ZigBee is −100 dBm, in this case, a reduction of the distance between nodes is desirable in order to assure reliable wireless communication at every circumstance. This restriction was applied for the design of the WSN presented in the following subsection.
4.4. Proposed WSN Deployment
In this section, an optimized WSN deployment is proposed considering the morphology and topology of the real underground utility tunnel system. In general, the network topology gains a great importance for an adequate deployment and infrastructure design in this type of complex underground environments, since their particular morphology (for instance, tunnels in the presented case) could limit the use of the star topology (the typical one for LoRaWAN). From the previous results, it can be concluded that LoRaWAN technology presents a much higher range in terms of distance and better robustness with human presence due to its better sensitivity. Besides, it provides a high tolerance for interference, which is highly relevant in a confined scenario with the presence of tubes, grids and metal trays. However, considering the wireless system technologies’ capabilities and constraints, and the real utility tunnel system conditions in terms of connections, intersections and infrastructure location possibilities, there are several key factors that lead to the election of ZigBee technology to be deployed within the considered scenario. The first LoRaWAN limitation is the reduced transfer capacity (up to 242 bytes), but the most critical one is the network topology and its deployment in underground conditions. While the mesh topology provided by ZigBee gives the option of deploying one single gateway, the star topology of LoRaWAN leads to the deployment of several gateways due to the morphology of the tunnels. Furthermore, taking into account that the considered tunnels lack of communication systems infrastructure and coverage of external systems (such as the mobile network), the deployment of gateways presents serious difficulties, since they need external communication links in order to send the data of the underground tunnel network to the cloud. Therefore, the possibility of deploying a unique gateway is very advantageous.
For the proposed WSN deployment, a Digi International’s XBee Zigbee Gateway was selected, allowing GPRS communications. The gateway was designed to be installed in the center of the tunnel system for network performance optimization and located under a sewer, with the aim of facilitating the wireless communication with the mobile network. An efficient node of deployment was implemented with specific nodes located in key corners and intersections, considering the particular morphology of the tunnels and the maximum distance between the nodes obtained in the previous subsection analysis. Digi’s XBee SX 868 RF Modules were employed for the sensor nodes. A schematic view of the WSN deployment is depicted in
Figure 17 representing the location of the ZigBee nodes and the gateway over the real utility tunnel system map.
4.5. Infrastructure and Work Safety Monitoring Application
In order to guarantee the security and protection of the infrastructure against unauthorized access, vandalism or sabotage, as well as to ensure occupational safety at work, a surveillance and monitoring system prototype was developed to allow infrastructure and work safety remote monitoring. In general, these types of systems usually include WSN, closed-circuit television (CCTV) and an antifire system, each of them with its own independent communication network. Although they could share the same communication network, for security and fault tolerance reasons, normally, three different communication networks are deployed, both wired and wireless. Adequate precautions, such as the use of shielded cables or fiber optics, should be incorporated when installing the complete wiring system to ensure the immunity to the effects of electromagnetic interference. However, sometimes, due to cost or deployment reasons, a wired network is not available, requiring a wireless communication network. In the analyzed real case, a fiber-optic network was available for the city’s security cameras, although no cameras were included inside the underground utility tunnel systems. If they were included, they could be connected to the fiber-optic network without further complications. Nevertheless, either special infrared cameras or visible spectrum cameras, in conjunction with presence sensors that activate the lighting system, should be included as well. This second option is more efficient in terms of infrastructure installation costs due to the difference in price of the cameras, but it has a higher probability of failure because it involves more elements (sensors and actuators). While, currently, no CCTV cameras are available in the galleries of the underground utility tunnel system, a wireless infrastructure and work safety monitoring application is proposed.
Regarding infrastructure security and work safety monitoring, WSN are devoted to monitoring possible leaks, zones or areas and personnel. When monitoring leaks (mainly water and gases), sensors should be installed as close as possible of the possible leakage in order to facilitate that the detection of the leak, if any, be as quick as possible. When monitoring zones/areas, detectors are regularly distributed throughout the area according to the potential risk (and its assessment) of leakage. On the one hand, some combustible gases, such as hydrogen or methane, are lighter than air, so the detector should be placed above the possible leak origin point or on the ceiling, where there is a high probability of accumulations of these gases. On the other hand, other gases such as propane or butane tend to move through the lower parts and can cover large areas. Therefore, in order to detect this type of gas in the fastest possible way, it is necessary to place the detectors in the lower parts of the installation, avoiding the contact with water. Finally, personnel monitoring is pivotal in order to provide work safety conditions, especially in underground environments. By means of a wireless network, surveillance and maintenance teamwork can be controlled and monitored along the galleries using wearables or worn body sensors, allowing free mobility and work service.
The development of an infrastructure-monitoring tool implies an adequate analysis and design of the whole system but, also, an adequate choice of the types of sensors, their locations, their configurations and their communication frequencies. In addition, the tool must allow the definition of alarm levels and the processes and procedures to be activated in case of alarm confirmation. Infrastructure monitoring will focus on both temperature and humidity control to prevent mold and bacteria buildup and to control potential sources of contamination. To do this, the humidity must be kept below 50% (desired values 30–50%). The same applies to dangerously high levels of carbon monoxide or dioxide in the air or nitrogen compounds (monoxide, dioxide and other nitrogen oxides) to prevent poisoning of the maintenance staff.
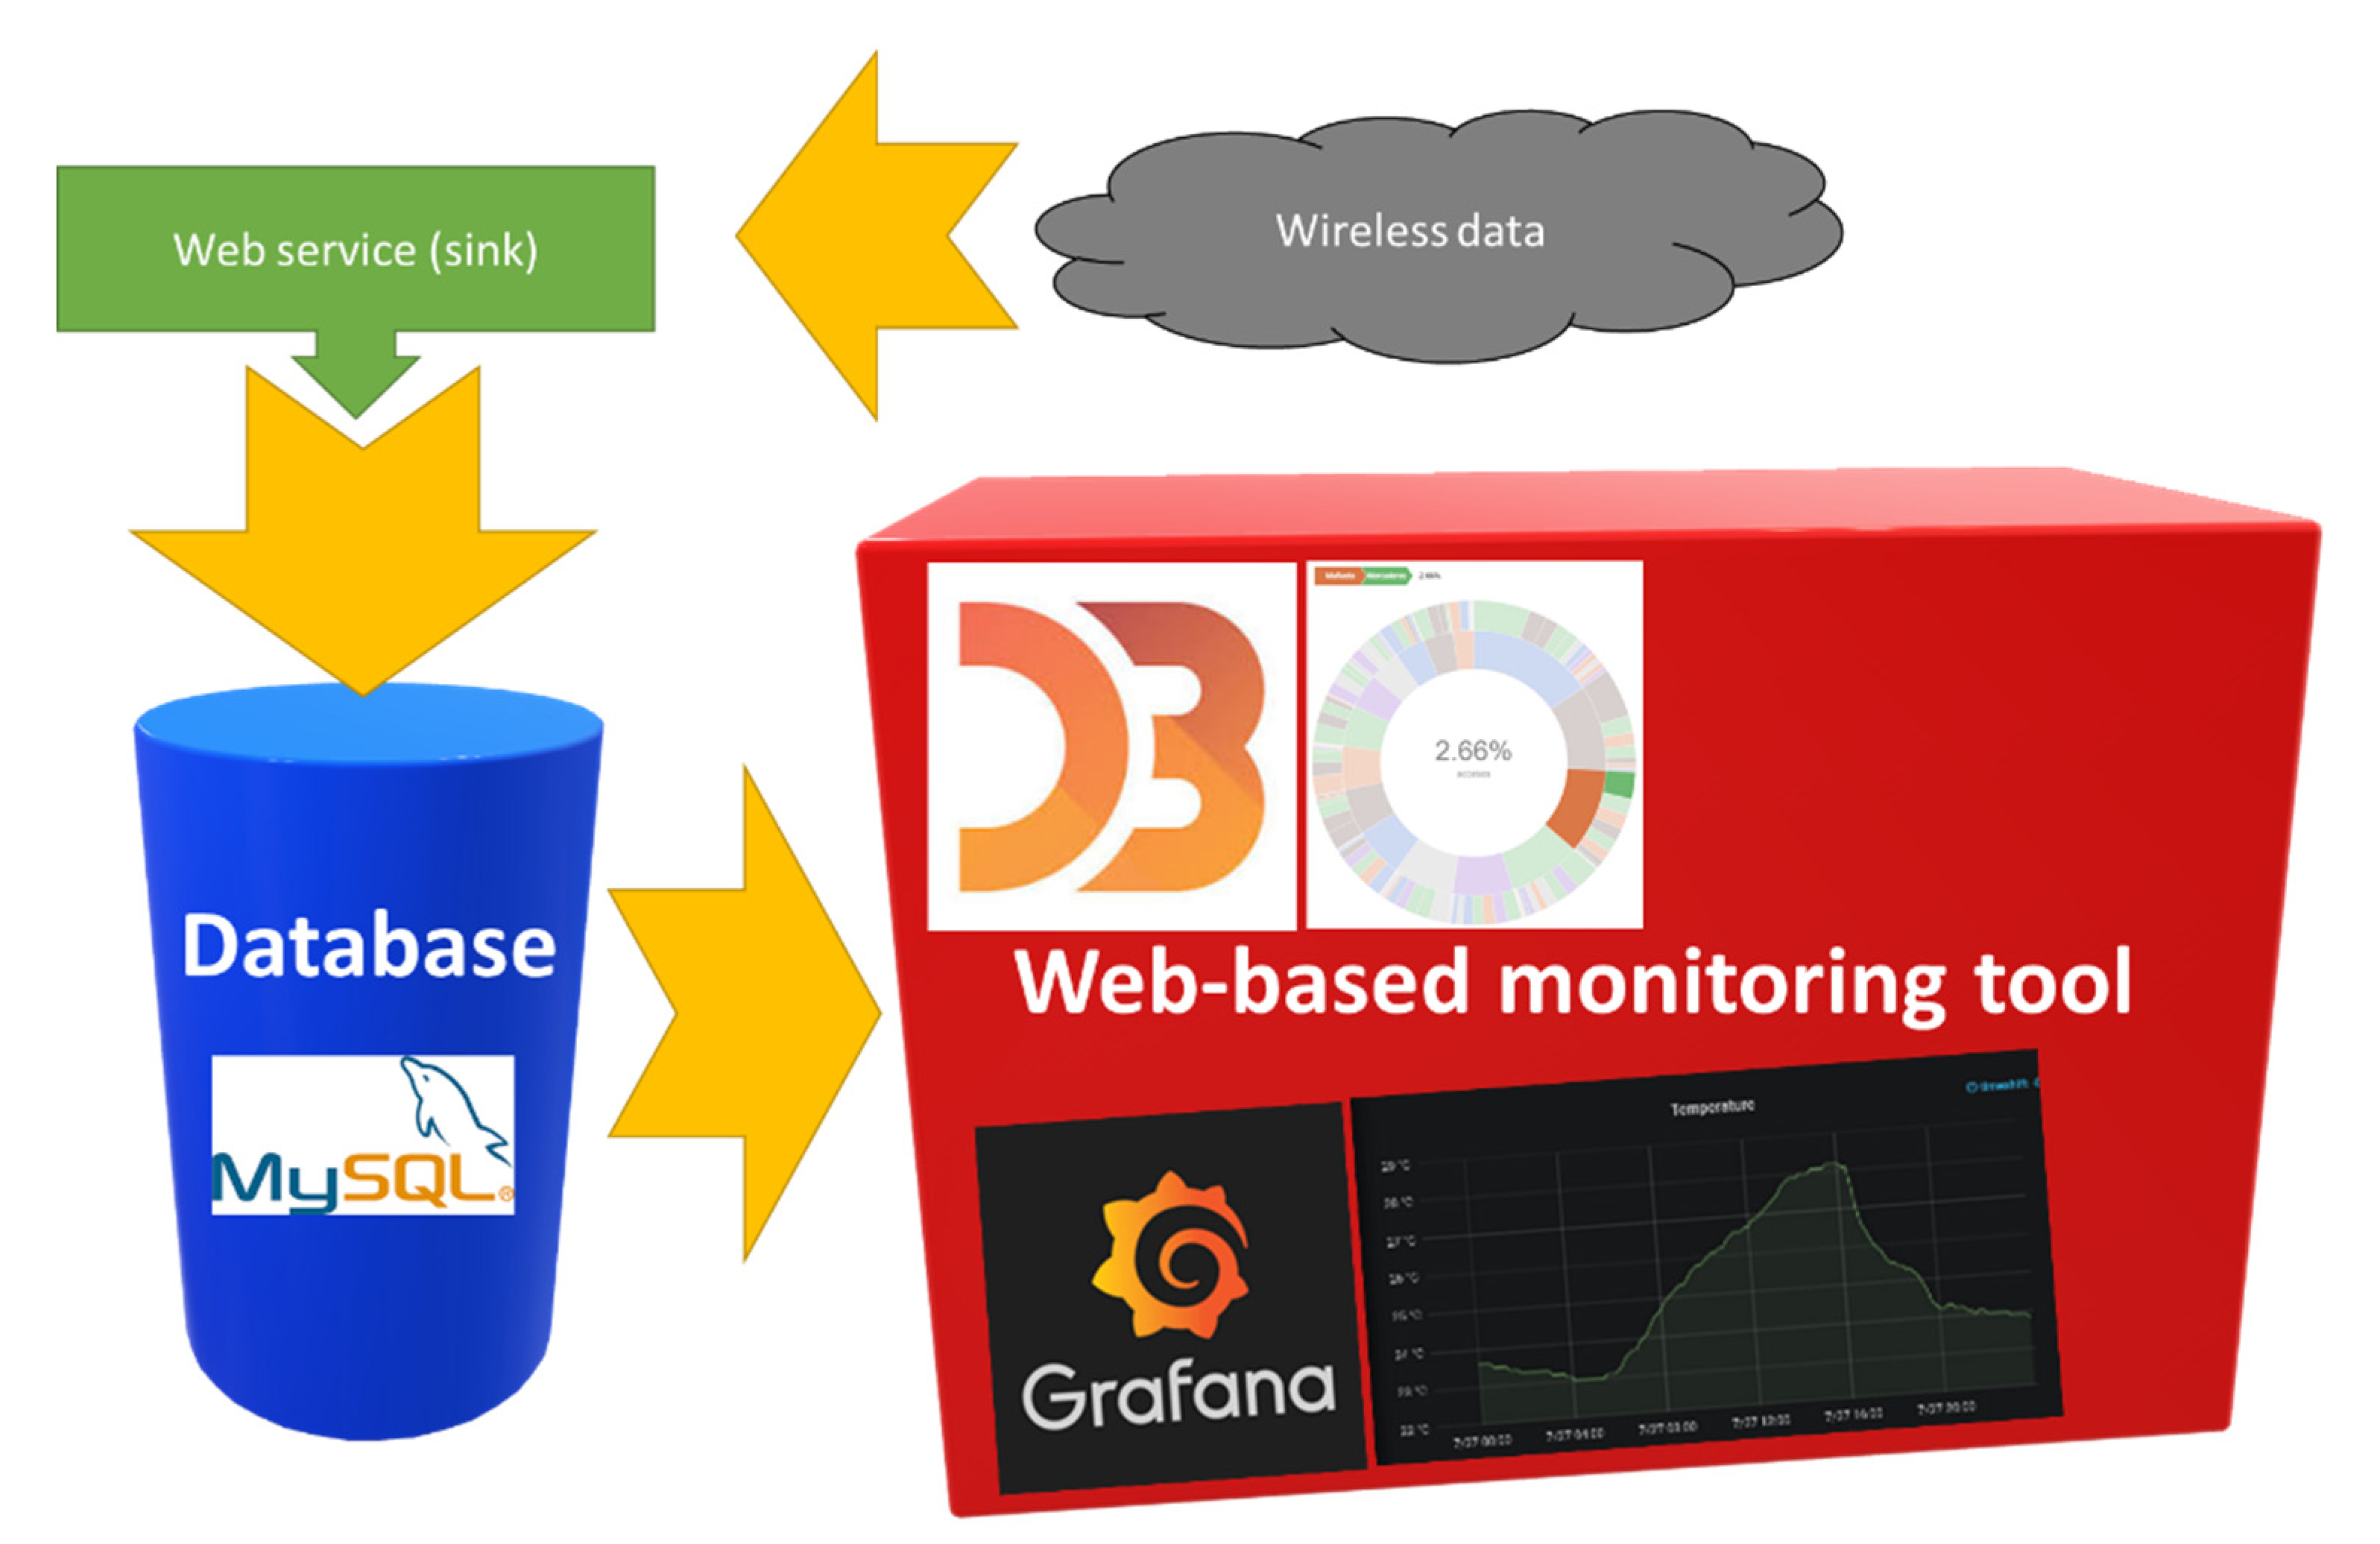
Considering the real case utility tunnel system and the proposed WSN deployment presented in the previous subsection, an infrastructure and work safety monitoring application prototype was developed in order to collect the data obtained by the sensors located in the gallery in real time and store them in a database allowing cloud computing. A schematic view of the monitoring tool architecture is depicted in
Figure 18. The prototype was developed using open-source tools such as the Bootstrap framework [
44] for the development of the web application Grafana [
45] for the analytics and interactive visualization and the D3.js [
46] JavaScript library for the production of dynamic and interactive data visualizations in web browsers. The system also includes a web service in charge of data collection, developed in Java, and a relational database (MySQL) [
47].
The design premises are security and use simplicity. The monitoring tool is responsive, which allows its use on mobile devices (smartphones and tablets), workstations or video walls. It embeds Grafana’s panels using iframes. On the one hand, there is a Grafana dashboard for the direct monitoring of the gallery’s health parameters, which allows the visualization of the data provided by the tunnel’s sensor network, which is depicted in
Figure 19. On the other hand, the monitoring tool (see
Figure 20), in addition to integrating the information provided by Grafana, includes the monitoring of the activities performed inside the gallery. These activities include dead man functionalities, monitoring of the task progress, access and exit points of the gallery, evacuation protocol and instructions in case of emergency, emergency acoustic and light signals activation, etc. The tool includes tree-based and sunburst visualization to describe the workflows.
The data collected by the WSN is stored, processed and analyzed in a private cloud. For that purpose, an Apache CloudStack was implemented over hypervisors VMware ESXI managed by a VMware vSphere. The resulting infrastructure allows the agile and easy deployment and management of the services. Besides, it allows computing orchestration, user and account management and provides data storage and data analytics. The proposed computing cloud is easily scalable and allows hot migrations according to the availability of the servers.

 ,
, 


