Next Issue
Volume 20, December-2
Previous Issue
Volume 20, November-2
 
 
sensors-logo

Journal Browser

Journal Browser

Sensors, Volume 20, Issue 23 (December-1 2020) – 295 articles

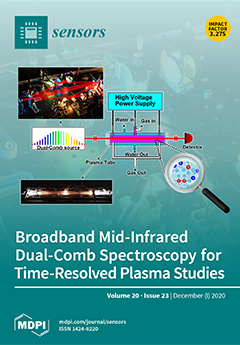
Cover Story (view full-size image): Conventional mechanical Fourier transform spectrometers (FTSs) measure absorption and dispersion spectra of gas-phase samples with very long measurement times to obtain time-resolved spectra with a good spectral resolution. Here, we present a mid-infrared dual-comb-based FTS providing broadband absorption and dispersion spectra with a spectral resolution of 5 GHz, a temporal resolution of 20 μs, and a wavelength coverage of 300 cm−1 in a measurement time of a few minutes. The spectrometer is used to monitor the reaction dynamics of methane and ethane in an electrical plasma discharge in dynamic conditions. The results demonstrate a new analytical approach for measuring rapid molecular changes in chemical reactions. This approach is interesting for chemical kinetic research, in particular for the combustion and plasma analysis community. View this paper
  • Issues are regarded as officially published after their release is announced to the table of contents alert mailing list.
  • You may sign up for e-mail alerts to receive table of contents of newly released issues.
  • PDF is the official format for papers published in both, html and pdf forms. To view the papers in pdf format, click on the "PDF Full-text" link, and use the free Adobe Reader to open them.
Order results
Result details
Section
Select all
Export citation of selected articles as:
17 pages, 6208 KiB  
Article
Hydraulic Conductivity of Saturated Soil Medium through Time-Domain Reflectometry
by Seungjae Lee and Hyung-Koo Yoon
Sensors 2020, 20(23), 7001; https://doi.org/10.3390/s20237001 - 07 Dec 2020
Cited by 9 | Viewed by 2273
Abstract
Time-domain reflectometry (TDR) has been extensively used to study soil behaviors. The objective of this study is to propose a method for measuring hydraulic conductivity using TDR. The dielectric constant deduced from TDR is influenced by the electrical resistance of the medium, and [...] Read more.
Time-domain reflectometry (TDR) has been extensively used to study soil behaviors. The objective of this study is to propose a method for measuring hydraulic conductivity using TDR. The dielectric constant deduced from TDR is influenced by the electrical resistance of the medium, and it can be converted into the electrical resistivity of the material. Thus, the theoretical relationship between the dielectric constant and hydraulic conductivity is established because electrical resistivity is a function of hydraulic conductivity. A cell is developed for measuring both the dielectric constant and hydraulic conductivity simultaneously. Three electrodes are used to measure the reflected waveform by using the principle of TDR. The following specimens are used to verify the proposed technique: glass beads, Jumunjin sand, and soil extracted from a field. The dielectric constant is converted into hydraulic conductivity, and it is compared with the value determined by a constant-head experiment for reference. The comparison shows a high similarity. Verification is also carried out through field experiments. This study demonstrates that the proposed method is an alternative method to find the hydraulic conductivity through TDR. Full article
(This article belongs to the Section Chemical Sensors)
Show Figures

Figure 1

20 pages, 3881 KiB  
Article
City Data Hub: Implementation of Standard-Based Smart City Data Platform for Interoperability
by Seungmyeong Jeong, Seongyun Kim and Jaeho Kim
Sensors 2020, 20(23), 7000; https://doi.org/10.3390/s20237000 - 07 Dec 2020
Cited by 30 | Viewed by 5635
Abstract
Like what happened to the Internet of Things (IoT), smart cities have become abundant in our lives as well. One of the smart city definitions commonly used is that smart cities solve city problems to enhance citizens’ life quality and make cities sustainable. [...] Read more.
Like what happened to the Internet of Things (IoT), smart cities have become abundant in our lives as well. One of the smart city definitions commonly used is that smart cities solve city problems to enhance citizens’ life quality and make cities sustainable. From the perspective of information and communication technologies (ICT), we think this can be done by collecting and analyzing data to generate insights. The City Data Hub, which is a standard-based city data platform that has been developed, and a couple of problem-solving examples have been demonstrated. The key elements for smart city platforms have been chosen and they have been included in the core architecture principles and implemented as a platform. It has been proven that standard application programming interfaces (APIs) and common data models with data marketplaces, which are the keys, increase interoperability and guarantee ecosystem extensibility. Full article
(This article belongs to the Special Issue IoT-Enabled Smart Cities)
Show Figures

Figure 1

19 pages, 8695 KiB  
Article
Hierarchical Optimization of 3D Point Cloud Registration
by Huikai Liu, Yue Zhang, Linjian Lei, Hui Xie, Yan Li and Shengli Sun
Sensors 2020, 20(23), 6999; https://doi.org/10.3390/s20236999 - 07 Dec 2020
Cited by 12 | Viewed by 3943
Abstract
Rigid registration of 3D point clouds is the key technology in robotics and computer vision. Most commonly, the iterative closest point (ICP) and its variants are employed for this task. These methods assume that the closest point is the corresponding point and lead [...] Read more.
Rigid registration of 3D point clouds is the key technology in robotics and computer vision. Most commonly, the iterative closest point (ICP) and its variants are employed for this task. These methods assume that the closest point is the corresponding point and lead to sensitivity to the outlier and initial pose, while they have poor computational efficiency due to the closest point computation. Most implementations of the ICP algorithm attempt to deal with this issue by modifying correspondence or adding coarse registration. However, this leads to sacrificing the accuracy rate or adding the algorithm complexity. This paper proposes a hierarchical optimization approach that includes improved voxel filter and Multi-Scale Voxelized Generalized-ICP (MVGICP) for 3D point cloud registration. By combining traditional voxel sampling with point density, the outlier filtering and downsample are successfully realized. Through multi-scale iteration and avoiding closest point computation, MVGICP solves the local minimum problem and optimizes the operation efficiency. The experimental results demonstrate that the proposed algorithm is superior to the current algorithms in terms of outlier filtering and registration performance. Full article
(This article belongs to the Section Remote Sensors)
Show Figures

Figure 1

15 pages, 11400 KiB  
Article
Supersensitive Detector of Hydrosphere Pressure Variations
by Grigory Dolgikh, Sergey Budrin, Stanislav Dolgikh and Aleksandr Plotnikov
Sensors 2020, 20(23), 6998; https://doi.org/10.3390/s20236998 - 07 Dec 2020
Cited by 9 | Viewed by 2603
Abstract
This paper presents an instrument based on an equal-arm Michelson interferometer and a frequency-stabilized helium-neon laser. It is designed to record hydrosphere pressure variations in the frequency range from 0 (conventionally) to 1000 Hz, with accuracy of 0.24 mPa at sea depths of [...] Read more.
This paper presents an instrument based on an equal-arm Michelson interferometer and a frequency-stabilized helium-neon laser. It is designed to record hydrosphere pressure variations in the frequency range from 0 (conventionally) to 1000 Hz, with accuracy of 0.24 mPa at sea depths of up to 50 m. The operating range of the instrument can be increased by order of magnitude by improving the registration system speed, and accuracy can be enhanced by using larger diameter membranes and/or their smaller thickness. The paper demonstrates some experimental results obtained on the supersensitive detector of hydrosphere pressure variations, confirming its high performance in the infrasonic and sonic ranges. Full article
(This article belongs to the Special Issue Sensors and Methods for Dynamic Measurement)
Show Figures

Figure 1

18 pages, 5662 KiB  
Article
A Bronchoscope Localization Method Using an Augmented Reality Co-Display of Real Bronchoscopy Images with a Virtual 3D Bronchial Tree Model
by Jong-Chih Chien, Jiann-Der Lee, Ellen Su and Shih-Hong Li
Sensors 2020, 20(23), 6997; https://doi.org/10.3390/s20236997 - 07 Dec 2020
Cited by 6 | Viewed by 2939
Abstract
In recent years, Image-Guide Navigation Systems (IGNS) have become an important tool for various surgical operations. In the preparations for planning a surgical path, verifying the location of a lesion, etc., it is an essential tool; in operations such as bronchoscopy, which is [...] Read more.
In recent years, Image-Guide Navigation Systems (IGNS) have become an important tool for various surgical operations. In the preparations for planning a surgical path, verifying the location of a lesion, etc., it is an essential tool; in operations such as bronchoscopy, which is the procedure for the inspection and retrieval of diagnostic samples for lung-related surgeries, it is even more so. The IGNS for bronchoscopy uses 2D-based images from a flexible bronchoscope to navigate through the bronchial airways in order to reach the targeted location. In this procedure, the accurate localization of the scope becomes very important, because incorrect information could potentially cause a surgeon to mistakenly direct the scope down the wrong passage. It would be a great aid for the surgeon to be able to visualize the bronchoscope images alongside the current location of the bronchoscope. For this purpose, in this paper, we propose a novel registration method to match real bronchoscopy images with virtual bronchoscope images from a 3D bronchial tree model built using computed tomography (CT) image stacks in order to obtain the current 3D position of the bronchoscope in the airways. This method is a combination of a novel position-tracking method using the current frames from the bronchoscope and the verification of the position of the real bronchoscope image against an image extracted from the 3D model using an adaptive-network-based fuzzy inference system (ANFIS)-based image matching method. Experimental results show that the proposed method performs better than the other methods used in the comparison. Full article
Show Figures

Figure 1

14 pages, 12027 KiB  
Letter
An Optical Fiber Sensor Coated with Electrospinning Polyvinyl Alcohol/Carbon Nanotubes Composite Film
by Jinze Li, Xin Liu, Hao Sun, Liming Wang, Jianqi Zhang, Li Deng and Tianhong Ma
Sensors 2020, 20(23), 6996; https://doi.org/10.3390/s20236996 - 07 Dec 2020
Cited by 24 | Viewed by 3181
Abstract
A fiber-optics tapered sensor that is covered by an electrospinning polyvinyl alcohol (PVA) nanofiber film, is demonstrated to measure humidity and temperature simultaneously. A section multi-mode fiber (MMF) was sandwiched between two leading-in and out single mode fibers (SMFs), which was further tapered [...] Read more.
A fiber-optics tapered sensor that is covered by an electrospinning polyvinyl alcohol (PVA) nanofiber film, is demonstrated to measure humidity and temperature simultaneously. A section multi-mode fiber (MMF) was sandwiched between two leading-in and out single mode fibers (SMFs), which was further tapered down to 29 μm to promote the humidity sensitivity of the sensor. A thin layer of electrospinning PVA nanofiber film was uniformly coated on the MMF taper region by electrospinning technology. In order to promote the humidity sensitivity and mechanical strength of electrospinning nanofibers, the carbon nanotubes (CNTs) were mixed into PVA to formed PVA/CNTs composite nanofiber film. A Fiber Bragg Grating (FBG) was cascaded with the humidity sensing fiber to monitor the ambient temperature simultaneously. The addition of CNTs effectively eliminated the cracks on the electrospinning nanofiber and made it more uniform and smoother. As experimental results show, the humidity sensitivity of the sensor with PVA/CNTs film was 0.0484 dB/%RH, an improvement of 31.16% compared to that of the sensor with PVA film, for which sensitivity is 0.0369 dB/%RH. The nanofiber humidity-sensitive film constructed using electrospinning had a satisfactory humidity response, special 3D structure and extensive application prospect. Full article
(This article belongs to the Section Optical Sensors)
Show Figures

Figure 1

20 pages, 6026 KiB  
Article
Enhancing Classification Performance of fNIRS-BCI by Identifying Cortically Active Channels Using the z-Score Method
by Hammad Nazeer, Noman Naseer, Aakif Mehboob, Muhammad Jawad Khan, Rayyan Azam Khan, Umar Shahbaz Khan and Yasar Ayaz
Sensors 2020, 20(23), 6995; https://doi.org/10.3390/s20236995 - 07 Dec 2020
Cited by 17 | Viewed by 3742
Abstract
A state-of-the-art brain–computer interface (BCI) system includes brain signal acquisition, noise removal, channel selection, feature extraction, classification, and an application interface. In functional near-infrared spectroscopy-based BCI (fNIRS-BCI) channel selection may enhance classification performance by identifying suitable brain regions that contain brain activity. In [...] Read more.
A state-of-the-art brain–computer interface (BCI) system includes brain signal acquisition, noise removal, channel selection, feature extraction, classification, and an application interface. In functional near-infrared spectroscopy-based BCI (fNIRS-BCI) channel selection may enhance classification performance by identifying suitable brain regions that contain brain activity. In this study, the z-score method for channel selection is proposed to improve fNIRS-BCI performance. The proposed method uses cross-correlation to match the similarity between desired and recorded brain activity signals, followed by forming a vector of each channel’s correlation coefficients’ maximum values. After that, the z-score is calculated for each value of that vector. A channel is selected based on a positive z-score value. The proposed method is applied to an open-access dataset containing mental arithmetic (MA) and motor imagery (MI) tasks for twenty-nine subjects. The proposed method is compared with the conventional t-value method and with no channel selected, i.e., using all channels. The z-score method yielded significantly improved (p < 0.0167) classification accuracies of 87.2 ± 7.0%, 88.4 ± 6.2%, and 88.1 ± 6.9% for left motor imagery (LMI) vs. rest, right motor imagery (RMI) vs. rest, and mental arithmetic (MA) vs. rest, respectively. The proposed method is also validated on an open-access database of 17 subjects, containing right-hand finger tapping (RFT), left-hand finger tapping (LFT), and dominant side foot tapping (FT) tasks.The study shows an enhanced performance of the z-score method over the t-value method as an advancement in efforts to improve state-of-the-art fNIRS-BCI systems’ performance. Full article
(This article belongs to the Special Issue Signal Processing Using Non-invasive Physiological Sensors)
Show Figures

Figure 1

21 pages, 1443 KiB  
Article
Transfer Learning for Wireless Fingerprinting Localization Based on Optimal Transport
by Siqi Bai, Yongjie Luo and Qun Wan
Sensors 2020, 20(23), 6994; https://doi.org/10.3390/s20236994 - 07 Dec 2020
Cited by 6 | Viewed by 2162
Abstract
Wireless fingerprinting localization (FL) systems identify locations by building radio fingerprint maps, aiming to provide satisfactory location solutions for the complex environment. However, the radio map is easy to change, and the cost of building a new one is high. One research focus [...] Read more.
Wireless fingerprinting localization (FL) systems identify locations by building radio fingerprint maps, aiming to provide satisfactory location solutions for the complex environment. However, the radio map is easy to change, and the cost of building a new one is high. One research focus is to transfer knowledge from the old radio maps to a new one. Feature-based transfer learning methods help by mapping the source fingerprint and the target fingerprint to a common hidden domain, then minimize the maximum mean difference (MMD) distance between the empirical distributions in the latent domain. In this paper, the optimal transport (OT)-based transfer learning is adopted to directly map the fingerprint from the source domain to the target domain by minimizing the Wasserstein distance so that the data distribution of the two domains can be better matched and the positioning performance in the target domain is improved. Two channel-models are used to simulate the transfer scenarios, and the public measured data test further verifies that the transfer learning based on OT has better accuracy and performance when the radio map changes in FL, indicating the importance of the method in this field. Full article
(This article belongs to the Special Issue Indoor Wi-Fi Positioning: Techniques and Systems)
Show Figures

Figure 1

15 pages, 2791 KiB  
Article
Defect Classification of Green Plums Based on Deep Learning
by Haiyan Zhou, Zilong Zhuang, Ying Liu, Yang Liu and Xiao Zhang
Sensors 2020, 20(23), 6993; https://doi.org/10.3390/s20236993 - 07 Dec 2020
Cited by 37 | Viewed by 3741
Abstract
The green plum is rich in amino acids, lipids, inorganic salts, vitamins, and trace elements. It has high nutritional value and medicinal value and is very popular among Chinese people. However, green plums are susceptible to collisions and pests during growth, picking, storage, [...] Read more.
The green plum is rich in amino acids, lipids, inorganic salts, vitamins, and trace elements. It has high nutritional value and medicinal value and is very popular among Chinese people. However, green plums are susceptible to collisions and pests during growth, picking, storage, and transportation, causing surface defects, affecting the quality of green plums and their products and reducing their economic value. In China, defect detection and grading of green plum products are still performed manually. Traditional manual classification has low accuracy and high cost, which is far from meeting the production needs of green plum products. In order to improve the economic value of green plums and their products and improve the automation and intelligence level of the product production process, this study adopted deep learning methods based on a convolutional neural network and cost-effective computer vision technology to achieve efficient classification of green plum defects. First, a camera and LEDs were used to collect 1240 green plum images of RGB, and the green plum experimental classification standard was formulated and divided into five categories, namely, rot, spot, scar, crack, and normal. Images were randomly divided into a training set and test set, and the number of images of the training set was expanded. Then, the stochastic weight averaging (SWA) optimizer and w-softmax loss function were used to improve the VGG network, which was trained and tested to generate a green plum defect detection network model. The average recognition accuracy of green plum defects was 93.8%, the test time for each picture was 84.69 ms, the recognition rate of decay defect was 99.25%, and the recognition rate of normal green plum was 95.65%. The results were compared with the source VGG network, resnet18 network, and green lemon network. The results show that for the classification of green plum defects, the recognition accuracy of the green plum defect detection network increased by 9.8% and 16.6%, and the test speed is increased by 1.87 and 6.21 ms, respectively, which has certain advantages. Full article
(This article belongs to the Section Intelligent Sensors)
Show Figures

Figure 1

18 pages, 1771 KiB  
Article
Gait Analysis with Wearables Can Accurately Classify Fallers from Non-Fallers: A Step toward Better Management of Neurological Disorders
by Rana Zia Ur Rehman, Yuhan Zhou, Silvia Del Din, Lisa Alcock, Clint Hansen, Yu Guan, Tibor Hortobágyi, Walter Maetzler, Lynn Rochester and Claudine J. C. Lamoth
Sensors 2020, 20(23), 6992; https://doi.org/10.3390/s20236992 - 07 Dec 2020
Cited by 22 | Viewed by 4448
Abstract
Falls are the leading cause of mortality, morbidity and poor quality of life in older adults with or without neurological conditions. Applying machine learning (ML) models to gait analysis outcomes offers the opportunity to identify individuals at risk of future falls. The aim [...] Read more.
Falls are the leading cause of mortality, morbidity and poor quality of life in older adults with or without neurological conditions. Applying machine learning (ML) models to gait analysis outcomes offers the opportunity to identify individuals at risk of future falls. The aim of this study was to determine the effect of different data pre-processing methods on the performance of ML models to classify neurological patients who have fallen from those who have not for future fall risk assessment. Gait was assessed using wearables in clinic while walking 20 m at a self-selected comfortable pace in 349 (159 fallers, 190 non-fallers) neurological patients. Six different ML models were trained on data pre-processed with three techniques such as standardisation, principal component analysis (PCA) and path signature method. Fallers walked more slowly, with shorter strides and longer stride duration compared to non-fallers. Overall, model accuracy ranged between 48% and 98% with 43–99% sensitivity and 48–98% specificity. A random forest (RF) classifier trained on data pre-processed with the path signature method gave optimal classification accuracy of 98% with 99% sensitivity and 98% specificity. Data pre-processing directly influences the accuracy of ML models for the accurate classification of fallers. Using gait analysis with trained ML models can act as a tool for the proactive assessment of fall risk and support clinical decision-making. Full article
(This article belongs to the Special Issue Wearable Sensors for Movement Analysis)
Show Figures

Figure 1

36 pages, 15330 KiB  
Article
Biomedical Signal Acquisition Using Sensors under the Paradigm of Parallel Computing
by Jesús Jaime Moreno Escobar, Oswaldo Morales Matamoros, Ricardo Tejeida Padilla, Liliana Chanona Hernández, Juan Pablo Francisco Posadas Durán, Ana Karen Pérez Martínez, Ixchel Lina Reyes and Hugo Quintana Espinosa
Sensors 2020, 20(23), 6991; https://doi.org/10.3390/s20236991 - 07 Dec 2020
Cited by 7 | Viewed by 3583
Abstract
There are several pathologies attacking the central nervous system and diverse therapies for each specific disease. These therapies seek as far as possible to minimize or offset the consequences caused by these types of pathologies and disorders in the patient. Therefore, comprehensive neurological [...] Read more.
There are several pathologies attacking the central nervous system and diverse therapies for each specific disease. These therapies seek as far as possible to minimize or offset the consequences caused by these types of pathologies and disorders in the patient. Therefore, comprehensive neurological care has been performed by neurorehabilitation therapies, to improve the patients’ life quality and facilitating their performance in society. One way to know how the neurorehabilitation therapies contribute to help patients is by measuring changes in their brain activity by means of electroencephalograms (EEG). EEG data-processing applications have been used in neuroscience research to be highly computing- and data-intensive. Our proposal is an integrated system of Electroencephalographic, Electrocardiographic, Bioacoustic, and Digital Image Acquisition Analysis to provide neuroscience experts with tools to estimate the efficiency of a great variety of therapies. The three main axes of this proposal are: parallel or distributed capture, filtering and adaptation of biomedical signals, and synchronization in real epochs of sampling. Thus, the present proposal underlies a general system, whose main objective is to be a wireless benchmark in the field. In this way, this proposal could acquire and give some analysis tools for biomedical signals used for measuring brain interactions when it is stimulated by an external system during therapies, for example. Therefore, this system supports extreme environmental conditions, when necessary, which broadens the spectrum of its applications. In addition, in this proposal sensors could be added or eliminated depending on the needs of the research, generating a wide range of configuration limited by the number of CPU cores, i.e., the more biosensors, the more CPU cores will be required. To validate the proposed integrated system, it is used in a Dolphin-Assisted Therapy in patients with Infantile Cerebral Palsy and Obsessive–Compulsive Disorder, as well as with a neurotypical one. Event synchronization of sample periods helped isolate the same therapy stimulus and allowed it to be analyzed by tools such as the Power Spectrum or the Fractal Geometry. Full article
(This article belongs to the Special Issue Biomedical Signal Acquisition and Processing Using Sensors)
Show Figures

Figure 1

17 pages, 2562 KiB  
Article
A Robust Feature Extraction Model for Human Activity Characterization Using 3-Axis Accelerometer and Gyroscope Data
by Rasel Ahmed Bhuiyan, Nadeem Ahmed, Md Amiruzzaman and Md Rashedul Islam
Sensors 2020, 20(23), 6990; https://doi.org/10.3390/s20236990 - 07 Dec 2020
Cited by 21 | Viewed by 5368
Abstract
Human Activity Recognition (HAR) using embedded sensors in smartphones and smartwatch has gained popularity in extensive applications in health care monitoring of elderly people, security purpose, robotics, monitoring employees in the industry, and others. However, human behavior analysis using the accelerometer and gyroscope [...] Read more.
Human Activity Recognition (HAR) using embedded sensors in smartphones and smartwatch has gained popularity in extensive applications in health care monitoring of elderly people, security purpose, robotics, monitoring employees in the industry, and others. However, human behavior analysis using the accelerometer and gyroscope data are typically grounded on supervised classification techniques, where models are showing sub-optimal performance for qualitative and quantitative features. Considering this factor, this paper proposes an efficient and reduce dimension feature extraction model for human activity recognition. In this feature extraction technique, the Enveloped Power Spectrum (EPS) is used for extracting impulse components of the signal using frequency domain analysis which is more robust and noise insensitive. The Linear Discriminant Analysis (LDA) is used as dimensionality reduction procedure to extract the minimum number of discriminant features from envelop spectrum for human activity recognition (HAR). The extracted features are used for human activity recognition using Multi-class Support Vector Machine (MCSVM). The proposed model was evaluated by using two benchmark datasets, i.e., the UCI-HAR and DU-MD datasets. This model is compared with other state-of-the-art methods and the model is outperformed. Full article
(This article belongs to the Special Issue Selected Papers from IEEE ICKII 2020)
Show Figures

Figure 1

15 pages, 4857 KiB  
Article
Design of a Planar Array of Low Profile Horns at 28 GHz
by Jou-Yi Wang, Malcolm Ng Mou Kehn and Eva Rajo-Iglesias
Sensors 2020, 20(23), 6989; https://doi.org/10.3390/s20236989 - 07 Dec 2020
Cited by 1 | Viewed by 2383
Abstract
A planar array of low profile horns fed by a transverse slotted waveguide array in the low millimeter-wave regime (28 GHz) is presented. The array of transverse slots cannot be directly used as antenna as it has grating lobes due to the fact [...] Read more.
A planar array of low profile horns fed by a transverse slotted waveguide array in the low millimeter-wave regime (28 GHz) is presented. The array of transverse slots cannot be directly used as antenna as it has grating lobes due to the fact that slot elements must be spaced a guided wavelength. However, these slots can be transformed into low profile horns that with their radiation patterns attenuate the grating lobes. To this aim, low profile horns with less than 0.6λ0 height were designed. The horns include a couple of chips that contribute to further reduce the grating lobes especially in the H-plane. The good performance of the designed array was demonstrated by both simulations and experiments performed on a manufactured prototype. A 5 × 5 array was designed that has a measured realized gain of 26.6 dBi with a bandwidth below 2%, still useful for some applications such as some radar systems. The total electrical size of the array is 6.63λ0× 6.63λ0. The radiation efficiency is very high and the aperture efficiency is above 80%. This all-metal solution is advantageous for millimeter-wave applications where losses sustained by dielectric materials become severe and it can be easily scaled to higher frequencies. Full article
(This article belongs to the Section Physical Sensors)
Show Figures

Figure 1

20 pages, 1606 KiB  
Review
A Review on Map-Merging Methods for Typical Map Types in Multiple-Ground-Robot SLAM Solutions
by Shuien Yu, Chunyun Fu, Amirali K. Gostar and Minghui Hu
Sensors 2020, 20(23), 6988; https://doi.org/10.3390/s20236988 - 07 Dec 2020
Cited by 28 | Viewed by 6392
Abstract
When multiple robots are involved in the process of simultaneous localization and mapping (SLAM), a global map should be constructed by merging the local maps built by individual robots, so as to provide a better representation of the environment. Hence, the map-merging methods [...] Read more.
When multiple robots are involved in the process of simultaneous localization and mapping (SLAM), a global map should be constructed by merging the local maps built by individual robots, so as to provide a better representation of the environment. Hence, the map-merging methods play a crucial rule in multi-robot systems and determine the performance of multi-robot SLAM. This paper looks into the key problem of map merging for multiple-ground-robot SLAM and reviews the typical map-merging methods for several important types of maps in SLAM applications: occupancy grid maps, feature-based maps, and topological maps. These map-merging approaches are classified based on their working mechanism or the type of features they deal with. The concepts and characteristics of these map-merging methods are elaborated in this review. The contents summarized in this paper provide insights and guidance for future multiple-ground-robot SLAM solutions. Full article
(This article belongs to the Special Issue Sensors and Computer Vision Techniques for 3D Object Modeling)
Show Figures

Figure 1

14 pages, 614 KiB  
Article
Deep Learning Based Antenna Selection for MIMO SDR System
by Shida Zhong, Haogang Feng, Peichang Zhang, Jiajun Xu, Huancong Luo, Jihong Zhang, Tao Yuan and Lei Huang
Sensors 2020, 20(23), 6987; https://doi.org/10.3390/s20236987 - 07 Dec 2020
Cited by 10 | Viewed by 3848
Abstract
In this paper, we propose and implement a novel framework of deep learning based antenna selection (DLBAS)-aided multiple-input–multiple-output (MIMO) software defined radio (SDR) system. The system is constructed with the following three steps: (1) a MIMO SDR communication platform is first constructed, which [...] Read more.
In this paper, we propose and implement a novel framework of deep learning based antenna selection (DLBAS)-aided multiple-input–multiple-output (MIMO) software defined radio (SDR) system. The system is constructed with the following three steps: (1) a MIMO SDR communication platform is first constructed, which is capable of achieving uplink communication from users to the base station via time division duplex (TDD); (2) we use the deep neural network (DNN) from our previous work to construct a deep learning decision server to assist the MIMO SDR platform for making intelligent decision for antenna selection, which transforms the optimization-driven decision making method into a data-driven decision making method; and (3) we set up the deep learning decision server as a multithreading server to improve the resource utilization ratio. To evaluate the performance of the DLBAS-aided MIMO SDR system, a norm-based antenna selection (NBAS) scheme is selected for comparison. The results show that the proposed DLBAS scheme performed equally to the NBAS scheme in real-time and out-performed the MIMO system without AS with up to 53% improvement on average channel capacity gain. Full article
(This article belongs to the Special Issue Multi-Antenna Techniques for 5G and beyond 5G Communications)
Show Figures

Figure 1

14 pages, 4793 KiB  
Letter
Low-Temperature Properties of the Magnetic Sensor with Amorphous Wire
by Dongfeng He, Kensei Umemori, Ryuichi Ueki, Takeshi Dohmae, Takafumi Okada, Minoru Tachiki, Shuuichi Ooi and Makoto Watanabe
Sensors 2020, 20(23), 6986; https://doi.org/10.3390/s20236986 - 07 Dec 2020
Cited by 2 | Viewed by 2495
Abstract
We found that a magnetic sensor made of a coil wound around a 5 f0.1 mm (Fe0.06Co0.94)72.5Si2.5B15 (FeCoSiB) amorphous wire could operate in a wide temperature range from room temperature to liquid helium temperature [...] Read more.
We found that a magnetic sensor made of a coil wound around a 5 f0.1 mm (Fe0.06Co0.94)72.5Si2.5B15 (FeCoSiB) amorphous wire could operate in a wide temperature range from room temperature to liquid helium temperature (4.2 K). The low-temperature sensing element of the sensor was connected to the room-temperature driving circuit by only one coaxial cable with a diameter of 1 mm. The one-cable design of the magnetic sensor reduced the heat transferring through the cable to the liquid helium. To develop a magnetic sensing system capable of operating at liquid helium temperature, we evaluated the low-temperature properties of the FeCoSiB magnetic sensor. Full article
(This article belongs to the Section Electronic Sensors)
Show Figures

Figure 1

17 pages, 3592 KiB  
Article
3D Human Pose Estimation with a Catadioptric Sensor in Unconstrained Environments Using an Annealed Particle Filter
by Fakhreddine Ababsa, Hicham Hadj-Abdelkader and Marouane Boui
Sensors 2020, 20(23), 6985; https://doi.org/10.3390/s20236985 - 07 Dec 2020
Cited by 3 | Viewed by 2730
Abstract
The purpose of this paper is to investigate the problem of 3D human tracking in complex environments using a particle filter with images captured by a catadioptric vision system. This issue has been widely studied in the literature on RGB images acquired from [...] Read more.
The purpose of this paper is to investigate the problem of 3D human tracking in complex environments using a particle filter with images captured by a catadioptric vision system. This issue has been widely studied in the literature on RGB images acquired from conventional perspective cameras, while omnidirectional images have seldom been used and published research works in this field remains limited. In this study, the Riemannian varieties was considered in order to compute the gradient on spherical images and generate a robust descriptor used along with an SVM classifier for human detection. Original likelihood functions associated with the particle filter are proposed, using both geodesic distances and overlapping regions between the silhouette detected in the images and the projected 3D human model. Our approach was experimentally evaluated on real data and showed favorable results compared to machine learning based techniques about the 3D pose accuracy. Thus, the Root Mean Square Error (RMSE) was measured by comparing estimated 3D poses and truth data, resulting in a mean error of 0.065 m when walking action was applied. Full article
(This article belongs to the Special Issue Human Activity Recognition Based on Image Sensors and Deep Learning)
Show Figures

Figure 1

19 pages, 2974 KiB  
Article
A Framework of Combining Short-Term Spatial/Frequency Feature Extraction and Long-Term IndRNN for Activity Recognition
by Beidi Zhao, Shuai Li, Yanbo Gao, Chuankun Li and Wanqing Li
Sensors 2020, 20(23), 6984; https://doi.org/10.3390/s20236984 - 07 Dec 2020
Cited by 9 | Viewed by 2296
Abstract
Smartphone-sensors-based human activity recognition is attracting increasing interest due to the popularization of smartphones. It is a difficult long-range temporal recognition problem, especially with large intraclass distances such as carrying smartphones at different locations and small interclass distances such as taking a train [...] Read more.
Smartphone-sensors-based human activity recognition is attracting increasing interest due to the popularization of smartphones. It is a difficult long-range temporal recognition problem, especially with large intraclass distances such as carrying smartphones at different locations and small interclass distances such as taking a train or subway. To address this problem, we propose a new framework of combining short-term spatial/frequency feature extraction and a long-term independently recurrent neural network (IndRNN) for activity recognition. Considering the periodic characteristics of the sensor data, short-term temporal features are first extracted in the spatial and frequency domains. Then, the IndRNN, which can capture long-term patterns, is used to further obtain the long-term features for classification. Given the large differences when the smartphone is carried at different locations, a group-based location recognition is first developed to pinpoint the location of the smartphone. The Sussex-Huawei Locomotion (SHL) dataset from the SHL Challenge is used for evaluation. An earlier version of the proposed method won the second place award in the SHL Challenge 2020 (first place if not considering the multiple models fusion approach). The proposed method is further improved in this paper and achieves 80.72% accuracy, better than the existing methods using a single model. Full article
(This article belongs to the Special Issue New Frontiers in Sensor-Based Activity Recognition)
Show Figures

Figure 1

12 pages, 2555 KiB  
Letter
Identifying Fatigue Indicators Using Gait Variability Measures: A Longitudinal Study on Elderly Brisk Walking
by Guoxin Zhang, Ivy Kwan-Kei Wong, Tony Lin-Wei Chen, Tommy Tung-Ho Hong, Duo Wai-Chi Wong, Yinghu Peng, Fei Yan, Yan Wang, Qitao Tan and Ming Zhang
Sensors 2020, 20(23), 6983; https://doi.org/10.3390/s20236983 - 07 Dec 2020
Cited by 8 | Viewed by 2436
Abstract
Real-time detection of fatigue in the elderly during physical exercises can help identify the stability and thus falling risks which are commonly achieved by the investigation of kinematic parameters. In this study, we aimed to identify the change in gait variability parameters from [...] Read more.
Real-time detection of fatigue in the elderly during physical exercises can help identify the stability and thus falling risks which are commonly achieved by the investigation of kinematic parameters. In this study, we aimed to identify the change in gait variability parameters from inertial measurement units (IMU) during a course of 60 min brisk walking which could lay the foundation for the development of fatigue-detecting wearable sensors. Eighteen elderly people were invited to participate in the brisk walking trials for 60 min with a single IMU attached to the posterior heel region of the dominant side. Nine sets of signals, including the accelerations, angular velocities, and rotation angles of the heel in three anatomical axes, were measured and extracted at the three walking times (baseline, 30th min, and 60th min) of the trial for analysis. Sixteen of eighteen participants reported fatigue after walking, and there were significant differences in the median acceleration (p = 0.001), variability of angular velocity (p = 0.025), and range of angle rotation (p = 0.0011), in the medial–lateral direction. In addition, there were also significant differences in the heel pronation angle (p = 0.005) and variability and energy consumption of the angles in the anterior–posterior axis (p = 0.028, p = 0.028), medial–lateral axis (p = 0.014, p = 0.014), and vertical axis (p = 0.002, p < 0.001). Our study demonstrated that a single IMU on the posterior heel of the dominant side can address the variability of kinematics parameters for elderly performing prolonged brisk walking and could serve as an indicator for walking instability, and thus fatigue. Full article
(This article belongs to the Special Issue Wearable Sensors for Movement Analysis)
Show Figures

Figure 1

42 pages, 773 KiB  
Review
QCM Sensor Arrays, Electroanalytical Techniques and NIR Spectroscopy Coupled to Multivariate Analysis for Quality Assessment of Food Products, Raw Materials, Ingredients and Foodborne Pathogen Detection: Challenges and Breakthroughs
by David K. Bwambok, Noureen Siraj, Samantha Macchi, Nathaniel E. Larm, Gary A. Baker, Rocío L. Pérez, Caitlan E. Ayala, Charuksha Walgama, David Pollard, Jason D. Rodriguez, Souvik Banerjee, Brianda Elzey, Isiah M. Warner and Sayo O. Fakayode
Sensors 2020, 20(23), 6982; https://doi.org/10.3390/s20236982 - 07 Dec 2020
Cited by 18 | Viewed by 5526
Abstract
Quality checks, assessments, and the assurance of food products, raw materials, and food ingredients is critically important to ensure the safeguard of foods of high quality for safety and public health. Nevertheless, quality checks, assessments, and the assurance of food products along distribution [...] Read more.
Quality checks, assessments, and the assurance of food products, raw materials, and food ingredients is critically important to ensure the safeguard of foods of high quality for safety and public health. Nevertheless, quality checks, assessments, and the assurance of food products along distribution and supply chains is impacted by various challenges. For instance, the development of portable, sensitive, low-cost, and robust instrumentation that is capable of real-time, accurate, and sensitive analysis, quality checks, assessments, and the assurance of food products in the field and/or in the production line in a food manufacturing industry is a major technological and analytical challenge. Other significant challenges include analytical method development, method validation strategies, and the non-availability of reference materials and/or standards for emerging food contaminants. The simplicity, portability, non-invasive, non-destructive properties, and low-cost of NIR spectrometers, make them appealing and desirable instruments of choice for rapid quality checks, assessments and assurances of food products, raw materials, and ingredients. This review article surveys literature and examines current challenges and breakthroughs in quality checks and the assessment of a variety of food products, raw materials, and ingredients. Specifically, recent technological innovations and notable advances in quartz crystal microbalances (QCM), electroanalytical techniques, and near infrared (NIR) spectroscopic instrument development in the quality assessment of selected food products, and the analysis of food raw materials and ingredients for foodborne pathogen detection between January 2019 and July 2020 are highlighted. In addition, chemometric approaches and multivariate analyses of spectral data for NIR instrumental calibration and sample analyses for quality assessments and assurances of selected food products and electrochemical methods for foodborne pathogen detection are discussed. Moreover, this review provides insight into the future trajectory of innovative technological developments in QCM, electroanalytical techniques, NIR spectroscopy, and multivariate analyses relating to general applications for the quality assessment of food products. Full article
Show Figures

Figure 1

11 pages, 3290 KiB  
Letter
Optimization of Cost-Effective and Reproducible Flexible Humidity Sensors Based on Metal-Organic Frameworks
by Victor Toral, Florin C. Loghin, Antonio Rodríguez-Diéguez, Alejandro Lapresta-Fernández, Diego P. Morales, Almudena Rivadeneyra and Alfonso Salinas-Castillo
Sensors 2020, 20(23), 6981; https://doi.org/10.3390/s20236981 - 07 Dec 2020
Cited by 3 | Viewed by 2369
Abstract
In this letter, we present the extension of a previous work on a cost-effective method for fabricating highly sensitive humidity sensors on flexible substrates with a reversible response, allowing precise monitoring of the humidity threshold. In that work we demonstrated the use of [...] Read more.
In this letter, we present the extension of a previous work on a cost-effective method for fabricating highly sensitive humidity sensors on flexible substrates with a reversible response, allowing precise monitoring of the humidity threshold. In that work we demonstrated the use of three-dimensional metal-organic framework (MOF) film deposition based on the perylene-3,4,9,10-tetracarboxylate linker, potassium as metallic center and the interspacing of silver interdigitated electrodes (IDEs) as humidity sensors. In this work, we study one of the most important issues in efficient and reproducible mass production, which is to optimize the most important processes’ parameters in their fabrication, such as controlling the thickness of the sensor’s layers. We demonstrate this method not only allows for the creation of humidity sensors, but it also is possible to change the humidity value that changes the actuator state. Full article
(This article belongs to the Special Issue 2D/3D Printed Sensors and Electronics)
Show Figures

Figure 1

12 pages, 3233 KiB  
Letter
Nondestructive Classification of Soybean Seed Varieties by Hyperspectral Imaging and Ensemble Machine Learning Algorithms
by Yanlin Wei, Xiaofeng Li, Xin Pan and Lei Li
Sensors 2020, 20(23), 6980; https://doi.org/10.3390/s20236980 - 07 Dec 2020
Cited by 18 | Viewed by 3263
Abstract
During the processing and planting of soybeans, it is greatly significant that a reliable, rapid, and accurate technique is used to detect soybean varieties. Traditional chemical analysis methods of soybean variety sampling (e.g., mass spectrometry and high-performance liquid chromatography) are destructive and time-consuming. [...] Read more.
During the processing and planting of soybeans, it is greatly significant that a reliable, rapid, and accurate technique is used to detect soybean varieties. Traditional chemical analysis methods of soybean variety sampling (e.g., mass spectrometry and high-performance liquid chromatography) are destructive and time-consuming. In this paper, a robust and accurate method for nondestructive soybean classification is developed through hyperspectral imaging and ensemble machine learning algorithms. Image acquisition, preprocessing, and feature selection are used to obtain different types of soybean hyperspectral features. Based on these features, one of ensemble classifiers-random subspace linear discriminant (RSLD) algorithm is used to classify soybean seeds. Compared with the linear discrimination (LD) and linear support vector machine (LSVM) methods, the results show that the RSLD algorithm in this paper is more stable and reliable. In classifying soybeans in 10, 15, 20, and 25 categories, the RSLD method achieves the highest classification accuracy. When 155 features are used to classify 15 types of soybeans, the classification accuracy of the RSLD method reaches 99.2%, while the classification accuracies of the LD and LSVM methods are only 98.6% and 69.7%, respectively. Therefore, the ensemble classification algorithm RSLD can maintain high classification accuracy when different types and different classification features are used. Full article
Show Figures

Figure 1

18 pages, 2879 KiB  
Article
Responsiveness of the Sensor Network to Alarm Events Based on the Potts Model
by Andrzej Paszkiewicz and Jan Węgrzyn
Sensors 2020, 20(23), 6979; https://doi.org/10.3390/s20236979 - 06 Dec 2020
Cited by 6 | Viewed by 2257
Abstract
The paper aims to present modelling the sensor network operation based on the Potts model. The authors presented own approach based on three states in which each node can be. The change in the state of a given node depends on its current [...] Read more.
The paper aims to present modelling the sensor network operation based on the Potts model. The authors presented own approach based on three states in which each node can be. The change in the state of a given node depends on its current state, the impact of surrounding nodes on it, but also values of the parameters measured. Therefore, the Hamiltonian was introduced as a dependence of both exceeding the limit value of a measured parameter (corresponding to an alarm event), and the state of the battery powering a given node of a sensor. The simulations of the implemented algorithm based on the adopted model presented in the paper relate to the measurement of temperature by a network of sensors. However, this model is universal and can be applied to examine the behaviour of the sensor infrastructure performing various measurements. Moreover, it may simulate the functioning of the critical network infrastructure or sensor networks and industrial sensors supporting the functioning of Industry 4.0. Full article
(This article belongs to the Special Issue Damage Detection with Wireless Sensor Networks)
Show Figures

Figure 1

16 pages, 17611 KiB  
Letter
Application of Siamese Networks to the Recognition of the Drill Wear State Based on Images of Drilled Holes
by Jarosław Kurek, Izabella Antoniuk, Bartosz Świderski, Albina Jegorowa and Michał Bukowski
Sensors 2020, 20(23), 6978; https://doi.org/10.3390/s20236978 - 06 Dec 2020
Cited by 12 | Viewed by 2029
Abstract
In this article, a Siamese network is applied to the drill wear classification problem. For furniture companies, one of the main problems that occurs during the production process is finding the exact moment when the drill should be replaced. When the drill is [...] Read more.
In this article, a Siamese network is applied to the drill wear classification problem. For furniture companies, one of the main problems that occurs during the production process is finding the exact moment when the drill should be replaced. When the drill is not sharp enough, it can result in a poor quality product and therefore generate some financial loss for the company. In various approaches to this problem, usually, three classes are considered: green for a drill that is sharp, red for the opposite, and yellow for a tool that is suspected of being worn out, requiring additional evaluation by a human expert. In the above problem, it is especially important that the green and the red classes not be mistaken, since such errors have the highest probability of generating financial loss for the manufacturer. Most of the solutions analysing this problem are too complex, requiring specialized equipment, high financial investment, or both, without guaranteeing that the obtained results will be satisfactory. In the approach presented in this paper, images of drilled holes are used as the training data for the Siamese network. The presented solution is much simpler in terms of the data collection methodology, does not require a large financial investment for the initial equipment, and can accurately qualify drill wear based on the chosen input. It also takes into consideration additional manufacturer requirements, like no green-red misclassifications, that are usually omitted in existing solutions. Full article
Show Figures

Figure 1

10 pages, 2309 KiB  
Letter
Industry 4.0 Quantum Strategic Organizational Design Configurations. The Case of Two Qubits: One Reports to One
by Javier Villalba-Diez, Rosa María Benito and Juan Carlos Losada
Sensors 2020, 20(23), 6977; https://doi.org/10.3390/s20236977 - 06 Dec 2020
Cited by 5 | Viewed by 2151
Abstract
In this paper we investigate how the relationship with a subordinate who reports to him influences the alignment of an Industry 4.0 leader. We do this through the implementation of quantum circuits that represent decision networks. In fact, through the quantum simulation of [...] Read more.
In this paper we investigate how the relationship with a subordinate who reports to him influences the alignment of an Industry 4.0 leader. We do this through the implementation of quantum circuits that represent decision networks. In fact, through the quantum simulation of strategic organizational design configurations (QSOD) through five hundred simulations of quantum circuits, we conclude that there is an influence of the subordinate on the leader that resembles that of a harmonic under-damped oscillator around the value of 50% probability of alignment for the leader. Likewise, we have observed a fractal behavior in this type of relationship, which seems to conjecture that there is an exchange of energy between the two agents that oscillates with greater or lesser amplitude depending on certain parameters of interdependence. Fractality in this QSOD context allows for a quantification of these complex dynamics and its pervasive effect offers robustness and resilience to the two-qubit interaction. Full article
Show Figures

Figure 1

18 pages, 2035 KiB  
Article
Relationship between Plantar Pressure and Sensory Disturbance in Patients with Hansen’s Disease—Preliminary Research and Review of the Literature
by Syoichi Tashiro, Naoki Gotou, Yuki Oku, Takahiro Sugano, Takuya Nakamura, Hiromi Suzuki, Nao Otomo, Shin Yamada, Tetsuya Tsuji, Yutaka Asato and Norihisa Ishii
Sensors 2020, 20(23), 6976; https://doi.org/10.3390/s20236976 - 06 Dec 2020
Cited by 7 | Viewed by 2770
Abstract
Orthoses and insoles are among the primary treatments and prevention methods of refractory plantar ulcers in patients with Hansen’s disease. While dynamic plantar pressure and tactile sensory disturbance are the critical pathological factors, few studies have investigated whether a relationship exists between these [...] Read more.
Orthoses and insoles are among the primary treatments and prevention methods of refractory plantar ulcers in patients with Hansen’s disease. While dynamic plantar pressure and tactile sensory disturbance are the critical pathological factors, few studies have investigated whether a relationship exists between these two factors. In this study, dynamic pressure measured using F-scan system and tactile sensory threshold evaluated with monofilament testing were determined for 12 areas of 20 feet in patients with chronic Hansen’s disease. The correlation between these two factors was calculated for each foot, for each clinical category of the foot (0–IV) and across all feet. A significant correlation was found between dynamic pressure and tactile sensation in Category II feet (n = 8, p = 0.016, r2 = 0.246, Spearman’s rank test). In contrast, no significant correlation was detected for the entire foot or within the subgroups for the remainder of the clinical categories. However, the clinical manifestation of lesion areas showed high variability: (1) pressure concentrated, sensation lost; (2) margin of pressure concentration, sensation lost; (3) pressure concentrated, sensation severely disturbed but not lost; and (4) tip of the toe. These results may indicate that, even though there was a weak relationship between dynamic pressure and tactile sensation, it is important to assess both, in addition to the basics of orthotic treatment in patients with Hansen’s disease presenting with refractory plantar ulceration. Full article
(This article belongs to the Collection Sensors in Biomechanics)
Show Figures

Figure 1

16 pages, 3722 KiB  
Article
A Machining State-Based Approach to Tool Remaining Useful Life Adaptive Prediction
by Yiming Li, Xiangmin Meng, Zhongchao Zhang and Guiqiu Song
Sensors 2020, 20(23), 6975; https://doi.org/10.3390/s20236975 - 06 Dec 2020
Cited by 3 | Viewed by 1977
Abstract
The traditional predictive model for remaining useful life predictions cannot achieve adaptiveness, which is one of the main problems of said predictions. This paper proposes a LightGBM-based Remaining useful life (RUL) prediction method which considers the process and machining state. Firstly, a multi-information [...] Read more.
The traditional predictive model for remaining useful life predictions cannot achieve adaptiveness, which is one of the main problems of said predictions. This paper proposes a LightGBM-based Remaining useful life (RUL) prediction method which considers the process and machining state. Firstly, a multi-information fusion strategy that can effectively reduce the model error and improve the generalization ability of the model is proposed. Secondly, a preprocessing method for improving the time precision and small-time granularity of feature extraction while avoiding dimensional explosion is proposed. Thirdly, an importance coefficient and a custom loss function related to the process and machining state are proposed. Finally, using the processing data of actual tool life cycle, through five evaluation indexes and 25 sets of contrast experiments, the superiority and effectiveness of the proposed method are verified. Full article
(This article belongs to the Section Physical Sensors)
Show Figures

Figure 1

11 pages, 1518 KiB  
Article
Application of a Small Unmanned Aerial System to Measure Ammonia Emissions from a Pilot Amine-CO2 Capture System
by Travis J. Schuyler, Bradley Irvin, Keemia Abad, Jesse G. Thompson, Kunlei Liu and Marcelo I. Guzman
Sensors 2020, 20(23), 6974; https://doi.org/10.3390/s20236974 - 06 Dec 2020
Cited by 1 | Viewed by 4180
Abstract
The quantification of atmospheric gases with small unmanned aerial systems (sUAS) is expanding the ability to safely perform environmental monitoring tasks and quickly evaluate the impact of technologies. In this work, a calibrated sUAS is used to quantify the emissions of ammonia (NH [...] Read more.
The quantification of atmospheric gases with small unmanned aerial systems (sUAS) is expanding the ability to safely perform environmental monitoring tasks and quickly evaluate the impact of technologies. In this work, a calibrated sUAS is used to quantify the emissions of ammonia (NH3) gas from the exit stack a 0.1 MWth pilot-scale carbon capture system (CCS) employing a 5 M monoethanolamine (MEA) solvent to scrub CO2 from coal combustion flue gas. A comparison of the results using the sUAS against the ion chromatography technique with the EPA CTM-027 method for the standard emission sampling of NH3 shows good agreement. Therefore, the work demonstrates the usefulness of sUAS as an alternative method of emission measurement, supporting its application in lieu of traditional sampling techniques to collect real time emission data. Full article
(This article belongs to the Special Issue Sensors for Unmanned Aircraft Systems and Related Technologies)
Show Figures

Figure 1

29 pages, 27753 KiB  
Article
TensorMoG: A Tensor-Driven Gaussian Mixture Model with Dynamic Scene Adaptation for Background Modelling
by Synh Viet-Uyen Ha, Nhat Minh Chung, Hung Ngoc Phan and Cuong Tien Nguyen
Sensors 2020, 20(23), 6973; https://doi.org/10.3390/s20236973 - 06 Dec 2020
Cited by 7 | Viewed by 3474
Abstract
Decades of ongoing research have shown that background modelling is a very powerful technique, which is used in intelligent surveillance systems, in order to extract features of interest, known as foregrounds. In order to work with the dynamic nature of different scenes, many [...] Read more.
Decades of ongoing research have shown that background modelling is a very powerful technique, which is used in intelligent surveillance systems, in order to extract features of interest, known as foregrounds. In order to work with the dynamic nature of different scenes, many techniques of background modelling adopted the unsupervised approach of Gaussian Mixture Model with an iterative paradigm. Although the technique has had much success, a problem occurs in cases of sudden scene changes with high variation (e.g., illumination changes, camera jittering) that the model unknowingly and unnecessarily takes into account those effects and distorts the results. Therefore, this paper proposes an unsupervised, parallelized, and tensor-based approach that algorithmically works with entropy estimations. These entropy estimations are used in order to assess the uncertainty level of a constructed background, which predicts both the present and future variations from the inputs, thereby opting to use either the incoming frames to update the background or simply discard them. Our experiments suggest that this method is highly integrable into a surveillance system that consists of other functions and can be competitive with state-of-the-art methods in terms of processing speed. Full article
(This article belongs to the Special Issue Object Tracking and Motion Analysis)
Show Figures

Figure 1

15 pages, 4301 KiB  
Letter
Discrimination Improvement of a Gas Sensors’ Array Using High-Frequency Quartz Crystal Microbalance Coated with Polymeric Films
by Marcos Rodríguez-Torres, Víctor Altuzar, Claudia Mendoza-Barrera, Georgina Beltrán-Pérez, Juan Castillo-Mixcóatl and Severino Muñoz-Aguirre
Sensors 2020, 20(23), 6972; https://doi.org/10.3390/s20236972 - 06 Dec 2020
Cited by 8 | Viewed by 2419
Abstract
The discrimination improvement of an array of four highly sensitive 30 MHz gas quartz crystal microbalance (QCM) sensors was performed and compared to a similar system based on a 12-MHz QCM. The sensing polymeric films were ethyl cellulose (EC), poly-methyl methacrylate (PMMA), Apiezon [...] Read more.
The discrimination improvement of an array of four highly sensitive 30 MHz gas quartz crystal microbalance (QCM) sensors was performed and compared to a similar system based on a 12-MHz QCM. The sensing polymeric films were ethyl cellulose (EC), poly-methyl methacrylate (PMMA), Apiezon L (ApL), and Apiezon T (ApT) and they were coated over the AT-cut QCM devices by the drop casting technique. All the sensors had almost the same film thickness (0.2 μm). The fabricated QCM sensor arrays were exposed to three different concentrations, corresponding to 5, 10, and 15 μL, of ethanol, ethyl acetate, and heptane vapors. The steady state sensor responses were measured in a static system at a temperature of 20 °C and relative humidity of 22%. Our results showed that the 30-MHz sensors have a higher sensitivity than 12-MHz ones (around 5.73 times), independently of the sensing film and measured sample. On the other hand, principal component analysis and discriminant analysis were performed using the raw data of the responses. An improvement of the classification percentage between 12 MHz and 30 MHz sensors was found. However, it was not sufficient, especially for low concentrations. Furthermore, using partition coefficient and discriminant analysis (DA), an improvement of 100% classification of the three samples was achieved for the case of the 30-MHz sensor array. Full article
(This article belongs to the Section Chemical Sensors)
Show Figures

Figure 1

Previous Issue
Back to TopTop