Nonintrusive Fine-Grained Home Care Monitoring: Characterizing Quality of In-Home Postural Changes Using Bone-Based Human Sensing


Abstract
:1. Introduction
2. Related Work
3. Methodology
3.1. Preliminary Study
- Step 1-1: Receiving images by time seriesWe first install a device that can capture images (e.g., USB camera) in a room where the person requiring care is located. Then, we connect the device to a laptop or desktop computer. Next, we use the computer to create HTML and JavaScript files as in [50,51] for embedding live video to the computer browser (we recommend using Google Chrome).
- Step 1-2: Extracting feature data with a PoseNet modelWe first extend the functions of Step 1-1 to receive every image of the live video for definite time intervals (e.g., one second), and draw it on a canvas with a fixed resolution (refer to [52]). Then, we extract the feature data of each canvas using a PoseNet model that can be called with the browser [22,53]. In recent years, other pose estimate models such as the ones described in [54,55,56] have demonstrated potential for use in smart homes. To improve the process of continuously extracting feature data, we introduce a method to implement an offline PoseNet model. For this, we obtain the calling link of an online PoseNet model and download the related model files, including two algorithms with “MobileNet” and “ResNet50” [22], by inspecting the network activity of the browser (refer to [57]) when running a process of extracting the feature data. Finally, to convert the paths of the model files to a local link that can be used instead of the original calling online link, we create a local web server using the live-server of Node.js [58]. In this manner, we realize a local process of extracting the feature data of the person requiring care.
- Step 1-3: Accumulating feature data in a local databaseWe first create a local database (refer to [59,60]) that can accumulate feature data, such as MongoDB [61] and MySQL [62]. Then, we post each extracted feature data as a time series to the local database using an Ajax technique [63] in the related Javascript file. Moreover, we use the Javascript code to draw each extracted feature data in the canvas (refer to [22]) that can represent and automatically update each pose map, shown in Figure 3.
- Step 2-1: Defining parameters to be evaluatedWe define m parameters as , to evaluate specific cases for users. For example, to characterize the quality of in-home postural changes for a person requiring care, it is possible to firstly define the changes in the current pose, including the conversion among standing up, sitting down, and walking at home, the parameters to be evaluated.
- Step 2-2: Designing algorithms to obtain the evaluated dataWe first set a time period to accumulate the feature data. Then, for each parameter (, 1 ≤ j ≤ m) to be evaluated, we manually analyze and extract the required data from the local database of Step 1-3. Then, we calculate data with tools such as Microsoft Excel. We aim to characterize the quality of in-home postural changes by providing the evaluating data. These are usually included in fine-grained variables of the body, such as the pose conversion, body movement, and positional changes. We consider that these parameters are linked with the changes in the shape and the positional changes of the pose bounding box. Our key idea is to use the feature values of the pose bounding box to calculate changes in the width, height, and distance (e.i. Height, Width, and Distance in Figure 4) for different poses.
- Step 2-3: Evaluating data by the visual chartsWe combine the data calculated in Step 2-2 with the timeline, and generate the related charts to analyze each evaluation parameter within the period. Specifically, for each parameter (, 1 ) to be evaluated, we regard the average value of the changes per minute as the evaluating data on the time series. Then, we generate charts with tools such as Microsoft Excel. In this manner, we can offer timely advice to the user by evaluating the defined parameters within the period.
3.2. Proposed Method
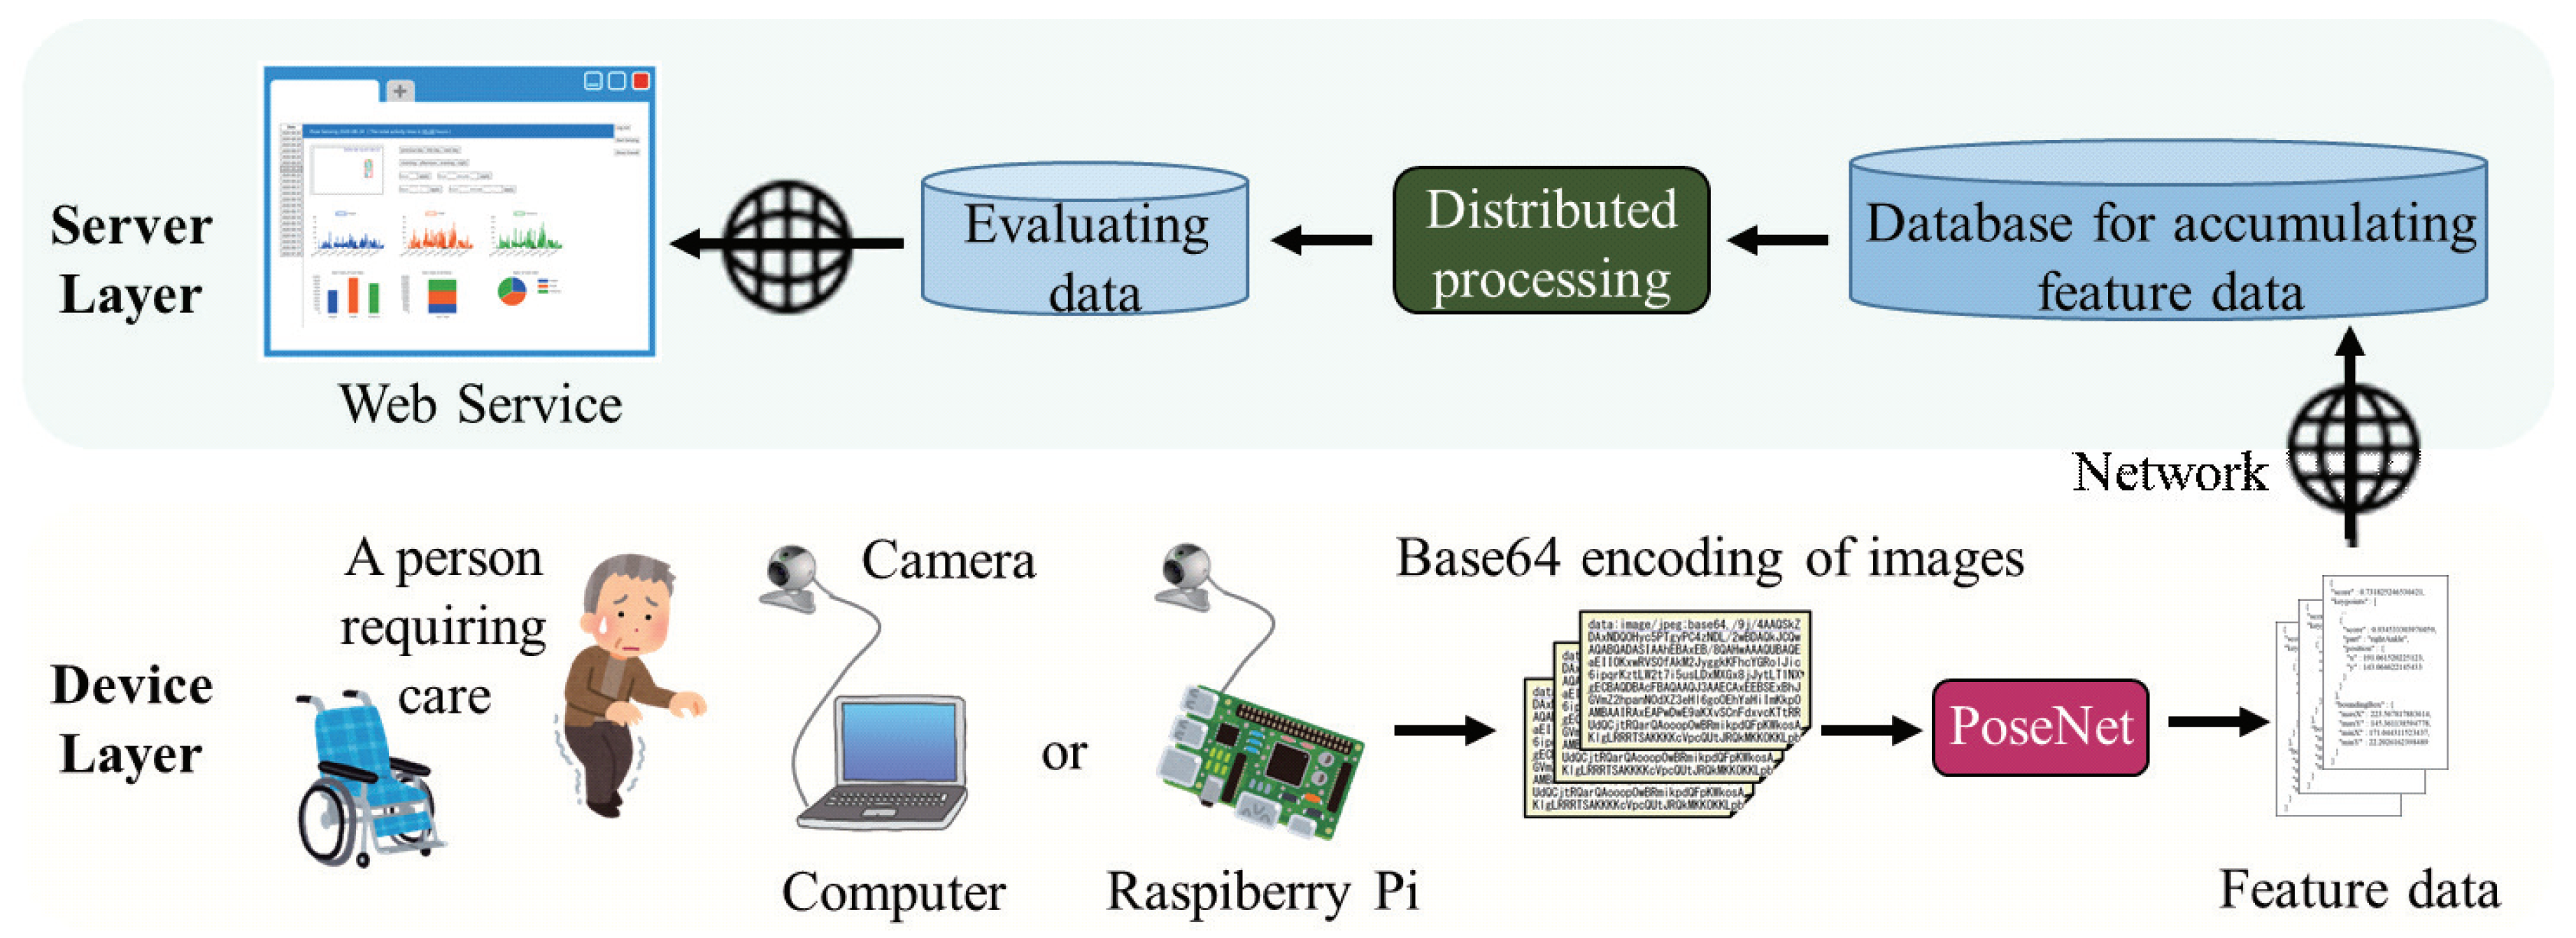
- Step 3-1: Running a loop for receiving image Base64 encodingWe first connect a camera device to a Raspberry Pi [27], preferably above version two, to ensure optimum performance in this step. Then, we create a separate javascript (i.e., Node.js [64]) file. To run a loop for receiving image Base64 encoding once every second, we use the package “OpenCV” (refer to [65]). A new process can be run at each time step key to maintaining the loop function continuously.
- Step 3-2: Drawing the image Base64 encoding on a canvasWe first extend the functions of Step 3-1 to receive every image Base64 encoding once every time interval (e.g., one second), and draw it on a canvas (the package refer to [66]). Please note that we maintain the same resolution for the image Base64 encoding and the created canvas.
- Step 3-3: Extracting feature data and disposing memoryWe first extract feature data from each canvas using the packages in “@tensorflow”, including “@tensorflow/tfjs-node” [67] and “@tensorflow-models/posenet” [22]. Listing 1 shows an example of extracting feature data and disposing memory with Node.js. To ensure accuracy of the PoseNet model, the related parameters and algorithms (e.g., “architecture”, “outputStride”, and “multiplier”) can be flexibly chosen and as per individual requirements (refer to [53]). Furthermore, we can also set a threshold value to exclude a part of data that overall low accuracy.
- Step 4-1: Transferring feature data to specified database by HTTP requestWe apply the database client package into a standalone server, such as in [68,69,70], to post feature data at each time interval. Specifically, we first set the host IP address of the database to the specific URL. Then, we use a package called “express” to build a REST API, which is linked with the database (refer to [71,72]).
- Step 4-2: Extracting specified feature data by respective HTTP requestsWe apply the same database client package as in Step 4-1 to a different server to obtain feature data at any time. We employ this step due to the post data caused by devices, and to obtain data from web service calling (refer to Step 5).
- Step 4-3: Calculating activity data by automatically designed algorithmsWe apply the feature data from Step 4-2 to the designed algorithms (refer to Figure 4). Specifically, each algorithm is developed as a function into the related files to calculate the activity data automatically.
- Step 5-1: Creating a web interface to search and access the activity dataWe organize the responses of the distributing process to create the web user interface (UI) with the corresponding embedded JavaScript (EJS) templates [73], to implement functions that include searching data from specific time points to generate pose maps and visual charts (refer to [74,75]). Moreover, the total time hours of postural changes for each day can be calculated based on the amount of posting data.
- Step 5-2: Managing devices and maintaining serversTo avoid ambiguities in interpreting data and ensure continued data access for all users, we first monitor and manage the continuity of the posting data by each device. Then, we check if the device is online, by comparing the time of the latest data with the current time. To avoid errors in the program, we incorporate exception handling in each process. Then, we bind a URL to each server separately. In this manner, we set a server dedicated to monitoring the status, and use the package “url-exist” [76], to monitor the validity of the URLs of each server in real time.
3.3. Discussion
4. System Evaluation
4.1. Accuracy of Evaluating Data
4.2. Usage Status of System Memory and CPU
5. Actual Experiment
5.1. Experimental Setup
5.2. Results
5.3. Discussion
6. Conclusions
Author Contributions
Funding
Acknowledgments
Conflicts of Interest
References
- The Ministry of Internal Affairs and Communications, Japan. Elderly People in Japan from the Statistical Perspective. Available online: https://www.stat.go.jp/data/topics/topi1210.html (accessed on 25 August 2020). (In Japanese).
- The Ministry of Health, Labour and Welfare, Japan. Overview of Patients’Investigation in 2017. Available online: https://www.mhlw.go.jp/toukei/saikin/hw/kanja/17/dl/01.pdf (accessed on 25 August 2020). (In Japanese).
- Schutzer, K.A.; Graves, B.S. Barriers and motivations to exercise in older adults. Prev. Med. 2004, 39, 1056–1061. [Google Scholar] [CrossRef]
- Takae, R.; Hatamoto, Y.; Yasukata, J.; Kose, Y.; Komiyama, T.; Ikenaga, M.; Yoshimura, E.; Yamada, Y.; Ebine, N.; Higaki, Y.; et al. Association of Lower-Extremity Muscle Performance and Physical Activity Level and Intensity in Middle-Aged and Older Adults: A Doubly Labeled Water and Accelerometer Study. J. Nutr. Health Aging 2020, 1–8. [Google Scholar] [CrossRef]
- Yamada, Y.; Sagayama, H.; Itoi, A.; Nishimura, M.; Fujisawa, K.; Higaki, Y.; Kimura, M.; Aoki, Y. Total Energy Expenditure, Body Composition, Physical Activity, and Step Count in Japanese Preschool Children: A Study Based on Doubly Labeled Water. Nutrients 2020, 12, 1223. [Google Scholar] [CrossRef] [PubMed]
- Vadakkedath Prasad, S. Wearable Devices for Jaw Activity Monitoring. Ph.D Thesis, University of Otago, Otago, New Zealand, 2020. [Google Scholar]
- Xu, Z.; Wang, G.; Guo, X. Sensor-based activity recognition of solitary elderly via stigmergy and two-layer framework. Eng. Appl. Artif. Intell. 2020, 95, 103859. [Google Scholar] [CrossRef]
- Fellger, A.; Sprint, G.; Weeks, D.; Crooks, E.; Cook, D.J. Wearable Device-Independent Next Day Activity and Next Night Sleep Prediction for Rehabilitation Populations. IEEE J. Transl. Eng. Health Med. 2020, 8, 1–9. [Google Scholar] [CrossRef] [PubMed]
- Sharifzadeh, M.; Bagheri, M.; Speakman, J.R.; Djafarian, K. Comparison of total and activity energy expenditure estimates from physical activity questionnaires and doubly labeled water: A systematic review and meta-analysis. Br. J. Nutr. 2020, 1–33. [Google Scholar] [CrossRef]
- Bacelis-Rivero, A.P.; Vázquez-Rodríguez, A.; Carrasco-Legleu, C.E.; De León, L.G.; Reza-López, S.A. Assessment of Physical Activity in Adults: A Review of Validated Questionnaires From a Nutritionist’s Point of View. Eval. Health Prof. 2020, 43, 235–254. [Google Scholar] [CrossRef]
- Thomas, K.S.; Magal, M. How does physical activity impact postural stability. J. Nov. Physiother 2014, 4, 2. [Google Scholar]
- Skelton, D.A. Effects of physical activity on postural stability. Age Ageing 2001, 30, 33–39. [Google Scholar] [CrossRef]
- An End-to-End Open Source Machine Learning Platform. Available online: https://www.tensorflow.org/ (accessed on 25 August 2020).
- Image Classification. Available online: https://www.tensorflow.org/lite/models/image_classification/overview (accessed on 25 August 2020).
- Seetala, K.; Birdsong, W.; Reddy, Y.B. Image classification using tensorflow. In Proceedings of the 16th International Conference on Information Technology-New Generations (ITNG 2019), Las Vagas, Navada, USA, 1–3 April 2019; Springer: Cham, Switzerland, 2019; pp. 485–488. [Google Scholar]
- Object Detection. Available online: https://www.tensorflow.org/lite/models/object_detection/overview (accessed on 25 August 2020).
- Phadnis, R.; Mishra, J.; Bendale, S. Objects Talk-Object Detection and Pattern Tracking Using TensorFlow. In Proceedings of the 2018 Second IEEE International Conference on Inventive Communication and Computational Technologies (ICICCT), Coimbatore, India, 20–21 April 2018; pp. 1216–1219. [Google Scholar]
- Pose Estimation. Available online: https://www.tensorflow.org/lite/models/pose_estimation/overview (accessed on 25 August 2020).
- Lakshmi, V.S.S.; Sujatha, P.; Swathi, M.; Premadevi, M.P. Smart garbage alert system using machine learning. Int. J. Eng. Appl. Sci. Technol. 2020, 5, 487–489. [Google Scholar]
- Tausen, M. Genetic Analysis and Image-Based Phenotyping of White Clover. Ph.D Thesis, Aarhus University, Aarhus, Denmark, 2020. [Google Scholar]
- Shah, K.; Pandey, M.; Patki, S.; Shankarmani, R. A Virtual Trial Room using Pose Estimation and Homography. In Proceedings of the 2020 4th IEEE International Conference on Intelligent Computing and Control Systems (ICICCS), Madurai, India, 13–15 May 2020; pp. 685–691. [Google Scholar]
- Pose Detection in the Browser: PoseNet Model. Available online: https://github.com/tensorflow/tfjs-models/tree/master/posenet (accessed on 25 August 2020).
- Crockford, D. Introducing JSON. Available online: https://www.json.org/json-en.html (accessed on 25 August 2020).
- Jlidi, N.; Snoun, A.; Bouchrika, T.; Jemai, O.; Zaied, M. PTLHAR: PoseNet and transfer learning for human activities recognition based on body articulations. In Proceedings of the Twelfth International Conference on Machine Vision (ICMV 2019), Amsterdam, The Netherlands, 16–18 November 2019; International Society for Optics and Photonics: BellingHam, WA, USA, 2020; Volume 11433, p. 114330. [Google Scholar] [CrossRef]
- Lin, W.; Yu, J. Beyond 2D: Fusion of Monocular 3D Pose, Motion and Appearance for Human Action Recognition. In Proceedings of the IEEE 2019 22th International Conference on Information Fusion (FUSION), Ottawa, ON, Canada, 2–5 July 2019; pp. 1–8. [Google Scholar]
- Guwalani, P.; Kala, M.; Chandrashekar, R.; Shinde, J.; Mane, D. Image File Security using Base-64 Algorithm. Pooja Guwalani Int. Comput. Technol. Appl. 2014, 5, 1892–1895. [Google Scholar]
- Teach, Learn, and Make with Raspberry Pi—Raspberry Pi. Available online: https://www.raspberrypi.org (accessed on 25 August 2020).
- Nilpanapan, T.; Kerdcharoen, T. Social data shoes for gait monitoring of elderly people in smart home. In Proceedings of the 2016 9th IEEE Biomedical Engineering International Conference (BMEiCON), Luang Prabang, Laos, 7–9 December 2016; IEEE: New York, NY, USA, 2016; pp. 1–5. [Google Scholar]
- Hossain, M.S. Patient status monitoring for smart home healthcare. In Proceedings of the 2016 IEEE International Conference on Multimedia & Expo Workshops (ICMEW), Seattle, WA, USA, 11–15 July 2016; pp. 1–6. [Google Scholar]
- Guan, K.; Shao, M.; Wu, S. A remote health monitoring system for the elderly based on smart home gateway. J. Healthc. Eng. 2017, 2017, 5843504. [Google Scholar] [CrossRef]
- Chiridza, T.; Wesson, J.; Vogts, D. A Smart Home environment to support risk monitoring for the elderly living independently. S. Afr. Comput. J. 2019, 31, 1–23. [Google Scholar] [CrossRef] [Green Version]
- Maswadi, K.; Ghani, N.B.A.; Hamid, S.B. Systematic Literature Review of Smart Home Monitoring Technologies Based on IoT for the Elderly. IEEE Access 2020, 8, 92244–92261. [Google Scholar] [CrossRef]
- Lupiani, E.; Juarez, J.M.; Palma, J.; Marin, R. Monitoring elderly people at home with temporal case-based reasoning. Knowl.-Based Syst. 2017, 134, 116–134. [Google Scholar] [CrossRef]
- Chen, S.; Saiki, S.; Nakamura, M. Toward Affordable and Practical Home Context Recognition: –Framework and Implementation with Image-based Cognitive API–. Int. J. Networked. Distrib. Comput. 2019, 8, 16–24. [Google Scholar] [CrossRef] [Green Version]
- Chen, S.; Saiki, S.; Nakamura, M. Integrating Multiple Models Using Image-as-Documents Approach for Recognizing Fine-Grained Home Contexts. Sensors 2020, 20, 666. [Google Scholar] [CrossRef] [PubMed] [Green Version]
- Chen, S.; Saiki, S.; Nakamura, M. Toward Flexible and Efficient Home Context Sensing: Capability Evaluation and Verification of Image-Based Cognitive APIs. Sensors 2020, 20, 1442. [Google Scholar] [CrossRef] [Green Version]
- Kim, K.; Jalal, A.; Mahmood, M. Vision-based Human Activity recognition system using depth silhouettes: A Smart home system for monitoring the residents. J. Electr. Eng. Technol. 2019, 14, 2567–2573. [Google Scholar] [CrossRef]
- Seo, D.; Yoo, B.; Ko, H. Data-driven smart home system for elderly people based on web technologies. In Proceedings of the International Conference on Distributed, Ambient, and Pervasive Interactions, Toronto, ON, Canada, 17–22 July 2016; Springer: Cham, Switzerland, 2016; pp. 122–131. [Google Scholar]
- Al-Khafajiy, M.; Baker, T.; Chalmers, C.; Asim, M.; Kolivand, H.; Fahim, M.; Waraich, A. Remote health monitoring of elderly through wearable sensors. Multimed. Tools Appl. 2019, 78, 24681–24706. [Google Scholar] [CrossRef] [Green Version]
- Almarashdeh, I.; Alsmadi, M.; Hanafy, T.; Albahussain, A.; Altuwaijri, N.; Almaimoni, H.; Asiry, F.; Alowaid, S.; Alshabanah, M.; Alrajhi, D.; et al. Real-time elderly healthcare monitoring expert system using wireless sensor network. Int. J. Appl. Eng. Res. 2018, 3517–3523. [Google Scholar] [CrossRef] [Green Version]
- Arshad, A.; Khan, S.; Midi, N.S.; Ismail, F.; Tasnim, R.; Islamic, I. Daily activity monitoring of an elderly Person for determining their wellness. Int. J. Smart Home 2016, 10, 339–346. [Google Scholar] [CrossRef]
- Yu, J.; An, N.; Hassan, T.; Kong, Q. A pilot study on a smart home for elders based on continuous in-home unobtrusive monitoring technology. Herd Health Environ. Res. Des. J. 2019, 12, 206–219. [Google Scholar] [CrossRef] [PubMed]
- Bassoli, M.; Bianchi, V.; Munari, I.D. A plug and play IoT Wi-Fi smart home system for human monitoring. Electronics 2018, 7, 200. [Google Scholar] [CrossRef] [Green Version]
- Tewell, J.; O’Sullivan, D.; Maiden, N.; Lockerbie, J.; Stumpf, S. Monitoring meaningful activities using small low-cost devices in a smart home. Pers. Ubiquitous Comput. 2019, 23, 339–357. [Google Scholar] [CrossRef]
- Lee, S.H.; Lee, J.Y.; Kim, J.S. Monitoring System for the Elderly Living Alone Using the RaspberryPi Sensor. J. Digit. Contents Soc. 2017, 18, 1661–1669. [Google Scholar]
- Ghasemi, F.; Rezaee, A.; Rahmani, A.M. Structural and behavioral reference model for IoT-based elderly health-care systems in smart home. Int. J. Commun. Syst. 2019, 32, e4002. [Google Scholar] [CrossRef]
- Sokullu, R.; Akkaş, M.A.; Demir, E. IoT Supported Smart Home for the Elderly. Internet Things 2020, 11, 100239. [Google Scholar] [CrossRef]
- Patil, K.; Laad, M.; Kamble, A.; Laad, S. A consumer-based smart home and health monitoring system. Int. J. Comput. Appl. Technol. 2018, 58, 45–54. [Google Scholar] [CrossRef]
- Talal, M.; Zaidan, A.; Zaidan, B.; Albahri, A.; Alamoodi, A.; Albahri, O.; Alsalem, M.; Lim, C.; Tan, K.L.; Shir, W.; et al. Smart home-based IoT for real-time and secure remote health monitoring of triage and priority system using body sensors: Multi-driven systematic review. J. Med. Syst. 2019, 43, 42. [Google Scholar] [CrossRef]
- MediaDevices.getUserMedia(). Available online: https://developer.mozilla.org/en-US/docs/Web/API/MediaDevices/getUserMedia (accessed on 25 August 2020).
- Media Capture and Streams API (Media Stream). Available online: https://developer.mozilla.org/en-US/docs/Web/API/Media_Streams_API (accessed on 25 August 2020).
- How to Display Video on Canvas. Available online: https://konvajs.org/docs/sandbox/Video_On_Canvas.html (accessed on 25 August 2020).
- Real-time Human Pose Estimation in the Browser with TensorFlow.js. Available online: https://medium.com/tensorflow/real-time-human-pose-estimation-in-the-browser-with-tensorflow-js-7dd0bc881cd5 (accessed on 25 August 2020).
- Iqbal, U.; Milan, A.; Gall, J. Posetrack: Joint multi-person pose estimation and tracking. In Proceedings of the IEEE Conference on Computer Vision and Pattern Recognition, Salt Lake City, UT, USA, 18–22 June 2017; pp. 2011–2020. [Google Scholar]
- Girdhar, R.; Gkioxari, G.; Torresani, L.; Paluri, M.; Tran, D. Detect-and-track: Efficient pose estimation in videos. In Proceedings of the IEEE Conference on Computer Vision and Pattern Recognition, Salt Lake City, UT, USA, 18–25 June 2018; pp. 350–359. [Google Scholar]
- Raaj, Y.; Idrees, H.; Hidalgo, G.; Sheikh, Y. Efficient online multi-person 2d pose tracking with recurrent spatio-temporal affinity fields. In Proceedings of the IEEE Conference on Computer Vision and Pattern Recognition, Long Beach, CA, USA, 16 November 2019; pp. 4620–4628. [Google Scholar]
- Basques, K. Inspect Network Activity in Chrome DevTools. Available online: https://developers.google.com/web/tools/chrome-devtools/network (accessed on 25 August 2020).
- Live Server. Available online: https://www.npmjs.com/package/live-server (accessed on 25 August 2020).
- MongoDB—Create Database. Available online: https://www.tutorialspoint.com/mongodb/mongodb_create_database.htm (accessed on 25 August 2020).
- Setup a Local MySQL Database. Available online: https://ladvien.com/data-analytics-mysql-localhost-setup/ (accessed on 25 August 2020).
- The Database for Modern Applications. Available online: https://www.mongodb.com/ (accessed on 25 August 2020).
- MySQL Database. Available online: https://www.mysql.com/ (accessed on 25 August 2020).
- jQuery—AJAX get() and post() Methods. Available online: https://www.w3schools.com/jquery/jquery_ajax_get_post.asp (accessed on 25 August 2020).
- About Node.js. Available online: https://nodejs.org/en/about/ (accessed on 25 August 2020).
- Node-Opencv. Available online: https://www.npmjs.com/package/opencv (accessed on 25 August 2020).
- Node-Canvas. Available online: https://www.npmjs.com/package/canvas (accessed on 25 August 2020).
- TensorFlow Backend for TensorFlow.js via Node.js. Available online: https://www.npmjs.com/package/@tensorflow/tfjs-node (accessed on 25 August 2020).
- MongoDB Node.JS Driver. Available online: https://www.npmjs.com/package/mongodb (accessed on 25 August 2020).
- Mongoose. Available online: https://www.npmjs.com/package/mongoose (accessed on 25 August 2020).
- Mysql. Available online: https://www.npmjs.com/package/mysql (accessed on 25 August 2020).
- Building a Simple CRUD app with Node, Express, and MongoDB. Available online: https://zellwk.com/blog/crud-express-mongodb/ (accessed on 25 August 2020).
- How to Build a REST API with Express and Mongoose. Available online: https://rahmanfadhil.com/express-rest-api/ (accessed on 25 August 2020).
- Master EJS Template Engine with Node.js and Expressjs. Available online: https://medium.com/swlh/master-ejs-template-engine-with-node-js-and-expressjs-979cc22b69be (accessed on 25 August 2020).
- Node.js MongoDB Find. Available online: https://www.w3schools.com/nodejs/nodejs_mongodb_find.asp (accessed on 25 August 2020).
- Simple Yet Flexible JavaScript Charting for Designers and Developers. Available online: https://www.chartjs.org/ (accessed on 25 August 2020).
- URL Exist. Available online: https://www.npmjs.com/package/url-exist (accessed on 25 August 2020).
- Herrera, F.; Niño, R.; Montenegro, C.; Gaona, P. FabRigo: Modelo informático para el monitoreo y control de rutinas de pausas activas en trabajadores de oficina por medio del modelo PoseNet. Rev. Ibérica Sist. Tecnol. Inf. 2020, E27, 273–285. [Google Scholar]
- Taeyong Ha, H.L. Implementation of Application for Smart Healthcare Exercise Management Based on Artificial Intelligence. IEIE J. Inst. Electron. Inf. Eng. 2020, 57, 44–51. [Google Scholar] [CrossRef]
- Herrera, F.; Niño, R.; Montenegro-Marín, C.E.; Gaona-García, P.A.; de Mendívil, I.S.M.; Crespo, R.G. Computational method for monitoring pauses exercises in office workers through a vision model. J. Ambient. Intell. Humaniz. Comput. 2020, 1–9. [Google Scholar] [CrossRef]
- Gavrilyuk, K.; Sanford, R.; Javan, M.; Snoek, C.G. Actor-transformers for group activity recognition. In Proceedings of the IEEE/CVF Conference on Computer Vision and Pattern Recognition, Seattle, WA, USA, 16–18 June 2020; pp. 839–848. [Google Scholar]
- Yang, L.; Jiang, H.; Huo, Z.; Xiao, J. Visual-GPS: Ego-Downward and Ambient Video Based Person Location Association. In Proceedings of the IEEE Conference on Computer Vision and Pattern Recognition Workshops, Long Beach, CA, USA, 15–21 June 2019. [Google Scholar]
- Moon, G.; Chang, J.Y.; Lee, K.M. Camera distance-aware top-down approach for 3d multi-person pose estimation from a single rgb image. In Proceedings of the IEEE International Conference on Computer Vision, Seoul, Korea, 27 October–3 November 2019; pp. 10133–10142. [Google Scholar]
- Gong, F.; Ma, Y.; Zheng, P.; Song, T. A deep model method for recognizing activities of workers on offshore drilling platform by multistage convolutional pose machine. J. Loss Prev. Process. Ind. 2020, 64, 104043. [Google Scholar] [CrossRef]
- Johnson, S.; Everingham, M. Clustered Pose and Nonlinear Appearance Models for Human Pose Estimation. In Proceedings of the British Machine Vision Conference, Aberystwyth, UK, 31 August–3 September 2010. [Google Scholar] [CrossRef] [Green Version]
- Johnson, S.; Everingham, M. Leeds Sports Pose Dataset. Available online: https://sam.johnson.io/research/lsp.html (accessed on 12 October 2020).
- Hansun, S. A new approach of moving average method in time series analysis. In Proceedings of the 2013 Conference on New Media Studies (CoNMedia), Tangerang, Indonesia, 27–28 November 2013; pp. 1–4. [Google Scholar]


| Research Authors (Year) | Monitoring Target | Materials and Methods | Intrusiveness | Time Intervals of Data Acquisition |
|---|---|---|---|---|
| Nilpanapan et al. [28] (2016) | The gait behaviors | Social data shoes that include five force sensitive resistors (FSRs) | Exist | One second |
| Hossain et al. [29] (2016) | The patient status | Video cameras and microphones, multimodal inputs, a dedicated cloud | Exist | None |
| Guan et al. [30] (2017) | The heart rate | Wearable smart clothing, home gateway, health care server | Exist | Six seconds |
| Chiridza et al. [31] (2019) | The risk and safety of the elderly living independently | A Raspberry Pi, a Microsoft Kinect sensor and an Aeotec 4-in-1 Multisensor | None | One hour |
| Our research in this paper (2020) | The postural changes | Camera Devices, bone-based human sensing technologies, web servers, a Raspberry Pi | None | One second |
| Difference Value (K) | PoseNet (MobileNet)–LSP Results | PoseNet (ResNet50)–LSP Results | ||||
|---|---|---|---|---|---|---|
| Height | Width | Distance | Height | Width | Distance | |
| K ≤ 10 | 62.55% | 56.45% | 65.80% | 71.50% | 69.40% | 77.60% |
| 10 < K ≤ 30 | 28.00% | 31.95% | 25.60% | 21.80% | 24.20% | 17.40% |
| K > 30 | 9.45% | 11.60% | 8.60% | 6.70% | 6.40% | 5.00% |
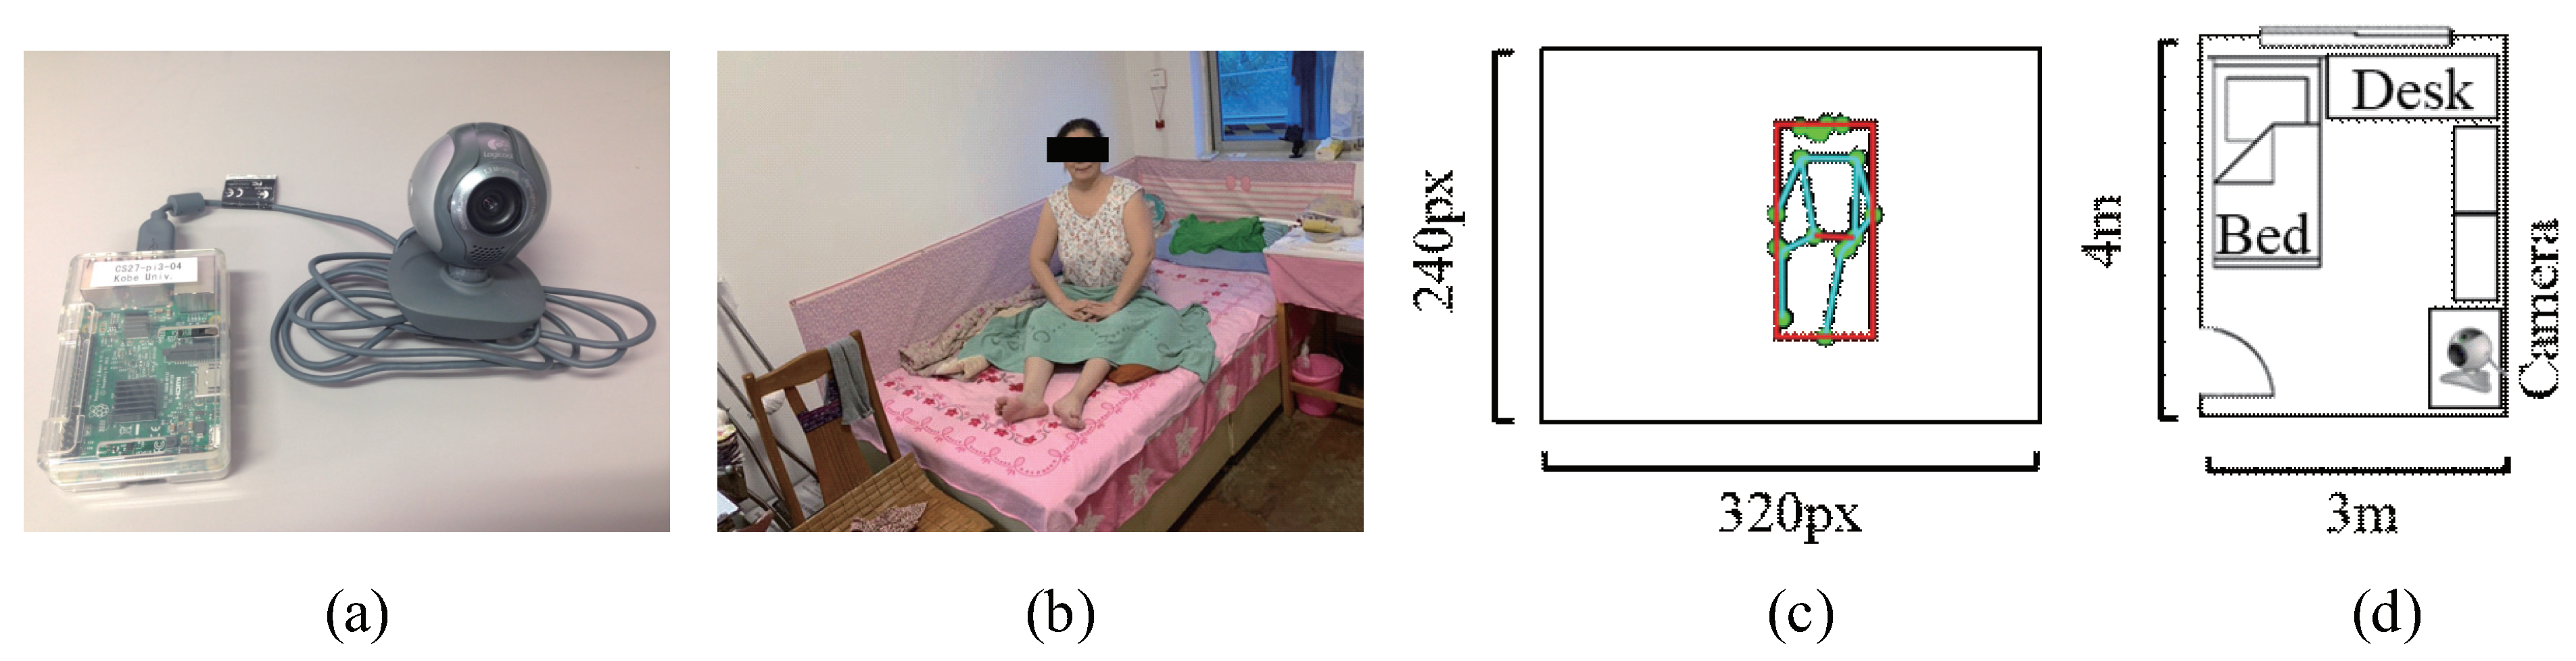
| Target space | Single-room (4 m × 3 m) |
| Experimental period | 10 days (17 to 26 August, 2020) |
| Evaluated subject | An aged woman (recovering from a broken leg) |
| Shooting device | USB camera (Logitech OEM B500) |
| Shooting position | In a corner of the room (Figure 8d) |
| Shooting interval | 1 s |
| Image resolution | 320 × 240 |
| Application device | Raspberry Pi 3 Model B |
| Pose estimation model | PoseNet model |
| Pose estimation type | Single-person pose estimation |
| Model architecture | ResNet50 |
| Pose estimation threshold | 0.5 |
| Number of defined parameters | 3 (refer to Figure 4) |
Publisher’s Note: MDPI stays neutral with regard to jurisdictional claims in published maps and institutional affiliations. |
© 2020 by the authors. Licensee MDPI, Basel, Switzerland. This article is an open access article distributed under the terms and conditions of the Creative Commons Attribution (CC BY) license (http://creativecommons.org/licenses/by/4.0/).
Share and Cite
Chen, S.; Saiki, S.; Nakamura, M. Nonintrusive Fine-Grained Home Care Monitoring: Characterizing Quality of In-Home Postural Changes Using Bone-Based Human Sensing. Sensors 2020, 20, 5894. https://doi.org/10.3390/s20205894
Chen S, Saiki S, Nakamura M. Nonintrusive Fine-Grained Home Care Monitoring: Characterizing Quality of In-Home Postural Changes Using Bone-Based Human Sensing. Sensors. 2020; 20(20):5894. https://doi.org/10.3390/s20205894
Chicago/Turabian StyleChen, Sinan, Sachio Saiki, and Masahide Nakamura. 2020. "Nonintrusive Fine-Grained Home Care Monitoring: Characterizing Quality of In-Home Postural Changes Using Bone-Based Human Sensing" Sensors 20, no. 20: 5894. https://doi.org/10.3390/s20205894