1. Introduction
White-light scanning interferometry (WLSI) is an established optical method for surface profile measurement by analyzing a series of interference patterns of low coherence light with known optical path differences among them. A typical Mirau interferometer setup can be used for a WLSI system with a microscope arrangement, as shown in
Figure 1a. In the imaging optical path with the broadband light source, a piezoelectric transducer (PZT) is used to vertically move the Mirau interference objective lens in the nanometer range to change the optical path difference between the sample and the beam splitter, and generate a series of moving interference fringes. The spatial distance between the surface measurement point and the equal optical path point can be obtained by collecting the interference fringes with charge coupled device (CCD) and calculating the position of the signal coherence peak, so as to realize the height recovery of the measurement surface with nanometer resolution [
1,
2]. Generally, the brightness of the light source in WLSI can easily affect the contrast of interference fringes, and its spectral width is related to the area where interference occurs. The wider the spectrum, the more information the measurement contains [
3]. For decades, LEDs or tungsten–halogen lamps have provided the low-coherence light and, as phosphor-based white LED promises greater power, longer lifetime, low heat dissipation and compactness, it is replacing the conventional light source in WLSI [
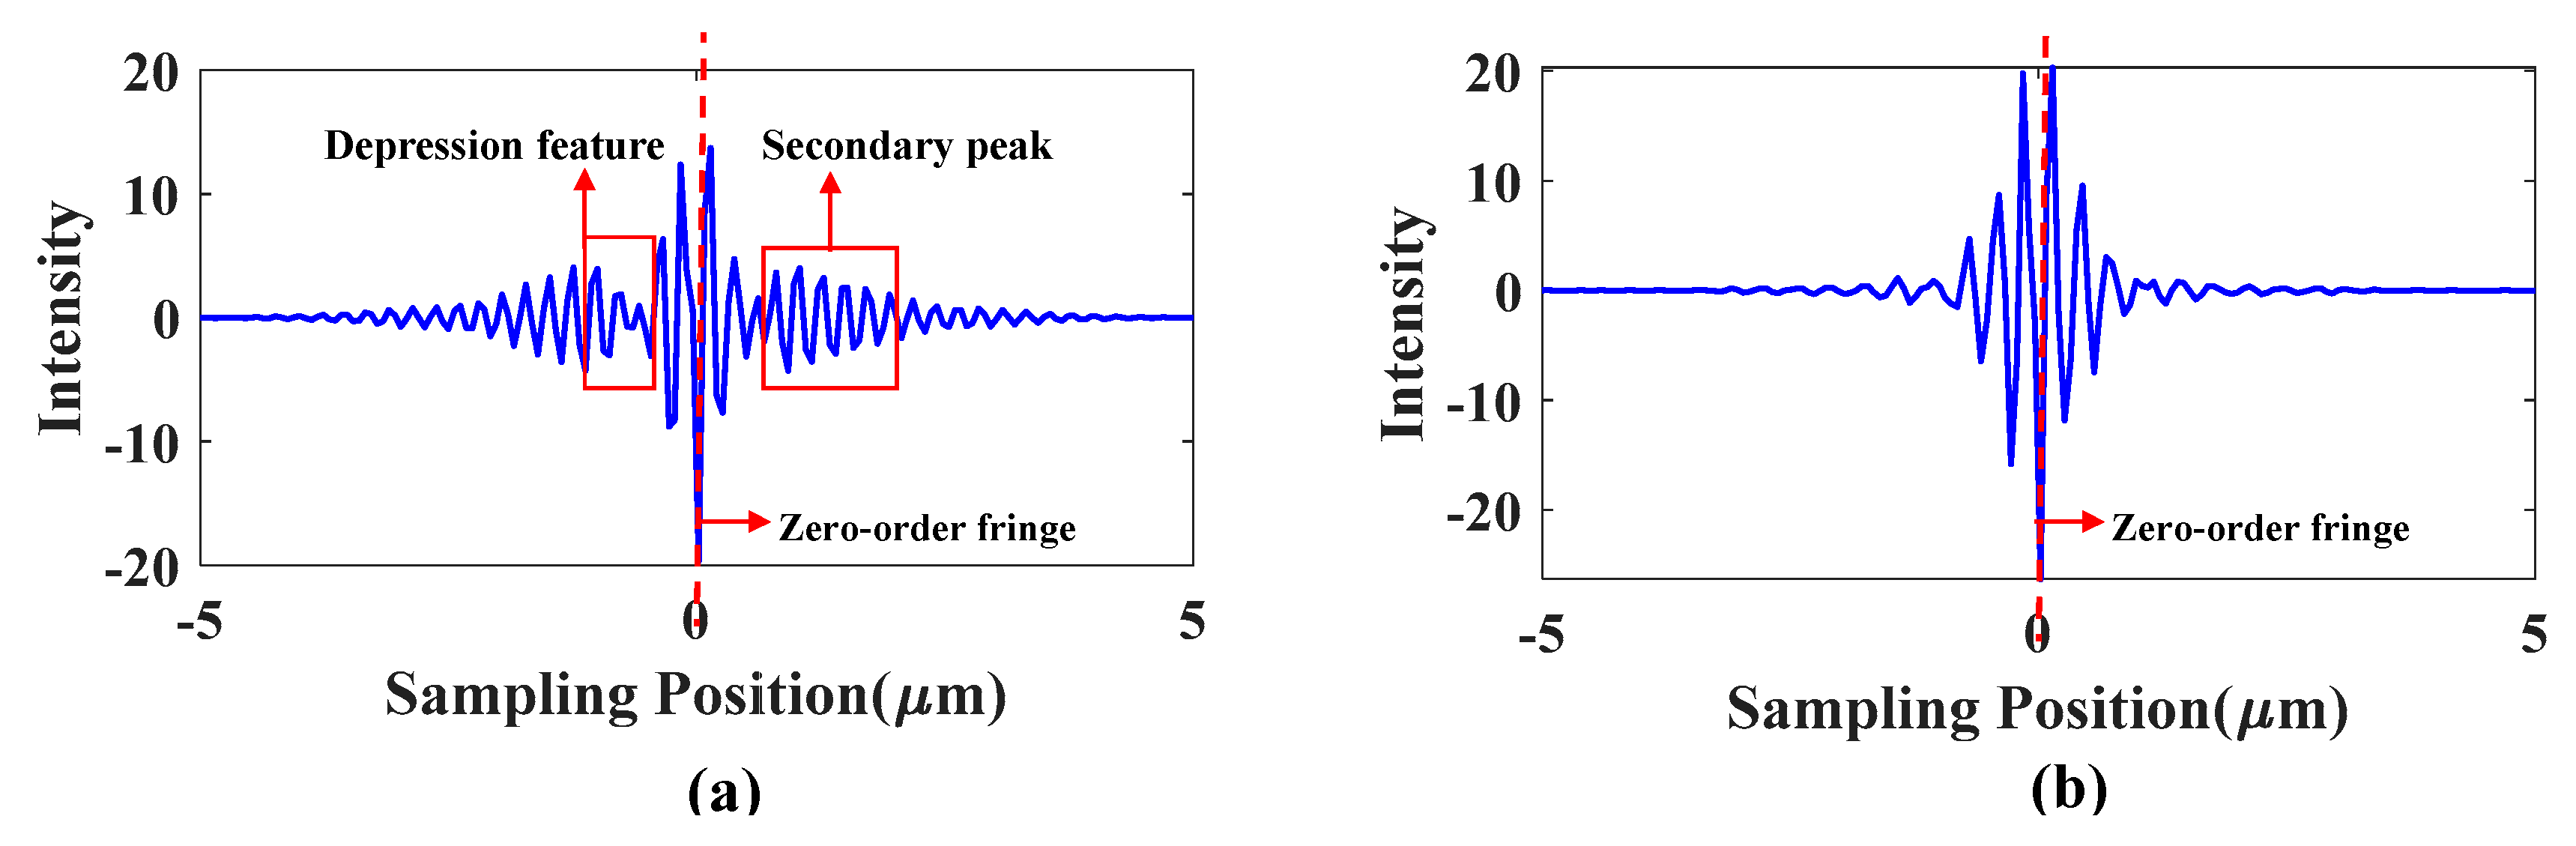
4]. However, white LEDs mainly synthesize white light by exciting yellow phosphors on blue or near ultraviolet LED chips, and its spectrum has dual wavelength characteristics of yellow and blue. As shown in
Figure 1b,c, the distinctive feature is defined as the discontinuities which make the fringe contrast function unable to be modeled as single Gaussian function [
5,
6]. The LED WLSI interference light intensity signal is affected by the double peak of the light source spectrum, which leads to the asymmetric distribution of interference signal, and the interference signal depression position has the phenomenon of jumping at different detection heights. This brings a great challenge to some coherent peak extraction algorithms which require that the central wavelength of white light source is stable or the interference signal is symmetrical. The effects of the distinctive feature to the reconstructed height profile vary depending on the working principle of the reconstruction algorithm, and it has been shown that the measurement repeatability will degrade and produce poor surface reconstruction quality if the spectral effects are not treated properly [
7].
At present, LED WLSI is still based on the existing conventional interference signal reconstruction method to obtain the morphology of the measured samples, which can be divided into two categories: the time domain modulation algorithm using interference signals or its envelope’s amplitude information [
8,
9] and frequency domain algorithm based on the signal’s spectrum phase analysis [
10,
11]. Among them, the time-domain modulation algorithm is used to find the position of maximum intensity (i.e. zero optical path difference) in the signal by extracting its envelope, and then determining the position of the signal’s coherent peak and restoring the surface topography. The second method is to extract the phase information of the white light interference signal through the phase shift algorithm or Fourier transform, and combine the envelope centroid algorithm to unwrap the wrapped phase to reconstruct the surface. However, the spectrum of the dual-wavelength white LED destroys the establishment conditions of the traditional interference signal envelope algorithm, and does not meet the assumptions adopted by each reconstruction algorithm. Due to the asymmetric interference signal characteristics and the problem of phase mutation, LED WLSI often has poor reconstruction quality. To solve this problem, Wee Keat Chong [
5,
12,
13] proposed a local Gaussian fitting method to reduce the impact of LED dual-wavelength, and then proposed to perform band-pass filtering on the two peaks after Fourier transform of the LED spectrum, and then obtain the phase information for each filter window. Finally, they found and calculated phase-crossing points to locate the zero phase. The study was valuable and instructive. It achieved high-precision surface reconstruction to a certain extent and reduced the adverse effects of white LED characteristics. However, this algorithm may have multiple solutions when the measured element is a cyclic structure. Therefore, it is necessary to improve and enhance various kinds of complex and smooth surface to be measured. Jorez [
14] studied the effect of the LED light source spectrum drift on the phase shift method. It is proposed that a correction factor can be calculated to compensate for the asymmetrical spectral shape to ensure the measurement accuracy of the sample contour. Unfortunately, the study of Kalle Hanhijärvi [
15] demonstrated that the uncertainty of the phase shift method decreases with the change of the light source spectrum. Experiments verify that the uncertainty of the five-sample-adaptive (FSA) envelope method [
16] is basically not affected by the change of the light source spectrum, but in terms of calculation effect, the phenomenon of rough surface and low reconstruction quality still exists.
In order to solve the influence of the dual-wavelength characteristics of white LED on interference reconstruction, we proposed a new recovery algorithm with good robustness and high reliability based on actual measurement experience to avoid false detection of coherent peak positions. The algorithm obtains the relative height of the initial solution of each surface point based on the Hilbert phase envelope. Then, the reference height of the adjacent phase reference point is calculated, and the difference between the initial solution height and the reference height is compared to optimize the surface reconstruction result. This algorithm effectively decreases the negative impact caused by double peaks characteristic of the light source spectrum in the surface reconstruction for the LED WLSI, and solve the problems of envelope peak extraction inaccuracy and the difficulty of solving the phase mutation in the traditional algorithm to a certain extent. Finally, the reliability of our algorithm is verified by experiments.
3. Surface Reconstruction Algorithm Proposed
The flow chart of VSI interference signal reconstruction algorithm proposed in this paper is shown in
Figure 7. In the first step, the Hilbert transform is applied to the interference signal. The Hilbert transform is a transform in the time domain. Compared with the Fourier transform, the calculation process of the Hilbert transforms and its inverse transform have a faster speed [
22,
23]. After preprocessing the interference signal, the phase of the interference signal is calculated using the 90° phase shift characteristic of Hilbert transform to obtain the wrapped phase [
24,
25]. The second step is to calculate the signal’s envelope and search the center position of zero-order fringe based on the centroid method to provide initial values for phase unwrapping. In the third step, a straight line is fitted to the unwrapped phase to obtain the minus one order, zero-order and one-order fringes’ center positions
z1,
z2, and
z3. After completing every data point’s signal reconstruction, then the height reconstruction result of every data point will be compared with that of its adjacent reference points to correct its height using the correction algorithm illustrated in detail later. The surface height is reconstructed and modulated, and finally the 3D surface morphology is restored.
We set the interference signal obtained by measurement as
g(
z). The interference signal
g(
z) is transformed by Hilbert transform, and the transformation result is
f(
z). The frequency spectrum of
g(
z) is
G(
k), and the frequency spectrum of
f(
z) is
F(
k). Then the negative frequency components of the phase spectrum are shifted by +90°, and the positive frequency components of the phase spectrum are shifted by −90°. The Hilbert transform relationship is Equation (4).
where
sgn(
k) is a symbolic function,
g(
z) and
f(
z) are used to calculate the envelope
M(
z) and phase function
φ(z) of the interference signal through Equations (5) and (6).
Then, the centroid method is used to calculate the position
P of maximum value of the envelope
M(
z). The formula of centroid method is shown in Equation (7).
As shown in
Figure 8, the zero point of the wrapped phase function
φ(
z) of the white light interference signal is located on the maximum value position P of the signal envelope
M(
z). So,
P is regarded as the reference zero point used to unwrap
φ(
z), and the unwrapped phase function
φu(
z) after unwrapping is obtained. Taking
P as the center,
φu(
z) is intercepted with
N as the radius through Equation (8).
where
ε(
P –
N) and
ε(
P +
N) are step functions.
N = (
λ0/2/
Δt) × 5,
λ0 is the central wavelength of the white LED,
Δt is the VSI step. In an ideal situation, the phase value at the center of the zero-order fringe (position
P) of WLSI is zero. The least square method is used to fit
φc(
z) in a straight line to obtain
φc(
z) =
kz +
b. The position of the zero-order fringe is
–b/k calculated by line fitting, and then the actual height of the measured surface corresponding to the zero-order fringe is calculated according to the phase shift of each step.
However, in the actual system measurement process, due to the influence of the spectrum characteristics of the white LED light source, the envelope curve of the interference signal at different surface heights will change greatly, which affects the accuracy of the reconstruction algorithm. This paper improves the algorithm for the problems existing in the LED WLSI. In the proposed algorithm, it is considered that the zero-order fringe position of the interference signal envelope obtained by the centroid method is relatively accurate. There will be no large deviation of the zero-order fringe positioning and the positioning deviation will not exceed the position of –1 and +1 order fringes. After the center position P is obtained by the centroid method, two phase values of two integer position points
zf and
zc close to
P are taken from the wrapped phase function
φ(
z) to determine whether the phase values of the two points are in the same [–π, π] period. If it is in the same period as shown in
Figure 9a, this paper considers that the surface calculation result of this point will be more accurate, and this point will be recorded as a stable point. If it is not in the same period as shown in
Figure 9b,c, the reconstruction result of this point will have a greater probability of having large deviation, and this point is recorded as an unstable point. The classification of points will be used as the determinant for the selection of starting point in the subsequent surface correction algorithm.
At the same time, the proposed algorithm calculates and records the values of three points
z1,
z2, and
z3 on the
φc(
z) line, and the three points, respectively, satisfy the condition of Equation (9)
The three points in the formula correspond to the positions of the −1, 0 and +1 fringes’ center of the interference signal, and –2π and 2π are the phase values of the −1 and +1 fringes’ center after unwrapping. z2 will be used as the initial value of the surface height reconstruction result z1 and z3 will be used as the reference heights for reconstruction, and will participate in the surface correction.
After completing the calculation of the interference signal of all pixels and obtaining the initial reconstruction result of surface, we proposed a Scan-Line correction algorithm to adjust the initial result to improve the surface reconstruction accuracy of the measured freeform surface, and reduce the adverse effect of the white LED light source on the surface reconstruction. The algorithm first finds a suitable point
S(
x0,
y0) near the coordinate midpoint of the surface data as the starting point of the algorithm, and the starting point needs to be a stable point. After the starting point is determined, take the starting point as the center and scan along the
X-axis positive direction,
X-axis negative direction,
Y-axis positive direction, and
Y-axis negative direction to adjust the surface profile on the two axes. The algorithm scan path is shown in
Figure 10. For continuous freeform surface measurement, according to the surface characteristics of freeform surface, it can be known that there does not exist sharp step change between two adjacent points, so a reasonable threshold can be set according to the actual measurement experience (300 nm is set in the algorithm in this paper). If the absolute value of the height difference between two adjacent points is greater than the threshold (the initial
z2 phase solution surface height deviation is large), it indicates that there exists large deviation with the reconstruction result of this point and needs to be adjusted. Compare the reference heights
z1 and
z3 of this point with the reconstruction height of its previous point and select the height value closest to the height of previous point between reference heights instead of this point’s initial height value
z2, to correct the surface reconstruction result.
Here, the scanning correction process in the
X-axis positive direction is taken as an example. The scanning point is set as (
x,
y0), and its former point (
x–1,
y0) is taken as the reference point, F(
x,
y) is the measured surface. If the absolute height difference |
F (
x,
y0)–
F (
x–1,
y0) | between two points is greater than the threshold, then the comparison of Equation (10) is performed and the height this point is corrected.
After finishing the correction of the surface on the
X-axis and
Y-axis with the starting point as the center, the data are divided into four parts according to the
X-axis and
Y-axis. According to the scan line path design strategies:
X-axis direction first and from the center to the edge, the algorithm generates the path to traverse all data points. According to the surface correction judgment shown in Equation (10), the initial reconstruction surface is corrected by traversing each data point. In
Figure 10, the data is divided into four areas, I, II, III and IV, with the starting point as the center. In each region, the region I algorithm corrects the initial surface along the scanning path from left to right, from top to bottom; in region II, it follows the scan path from right to left and top to bottom; and region III follows from left to right and bottom to top; lastly, region IV follows the scan surface path from right to left, and from bottom to top. The algorithm can complete the correction of the surface by only traversing all points one time, which ensures the calculation speed. At the same time, the data in the four regions can be calculated simultaneously by multiple threads without interfering with each other, which can further improve the operation speed of the algorithm.


