StressFoot: Uncovering the Potential of the Foot for Acute Stress Sensing in Sitting Posture


Abstract
:1. Introduction
- a novel way to discriminate acute stress and relaxation by four distinct foot movements and posture characteristics,
- ten mathematical features to train machine learning models,
- and design implications for future applications in ubiquitous computing.
1.1. Background
1.1.1. Physiological Responses
1.1.2. Facial Expressions
2. StressFoot
2.1. Concept
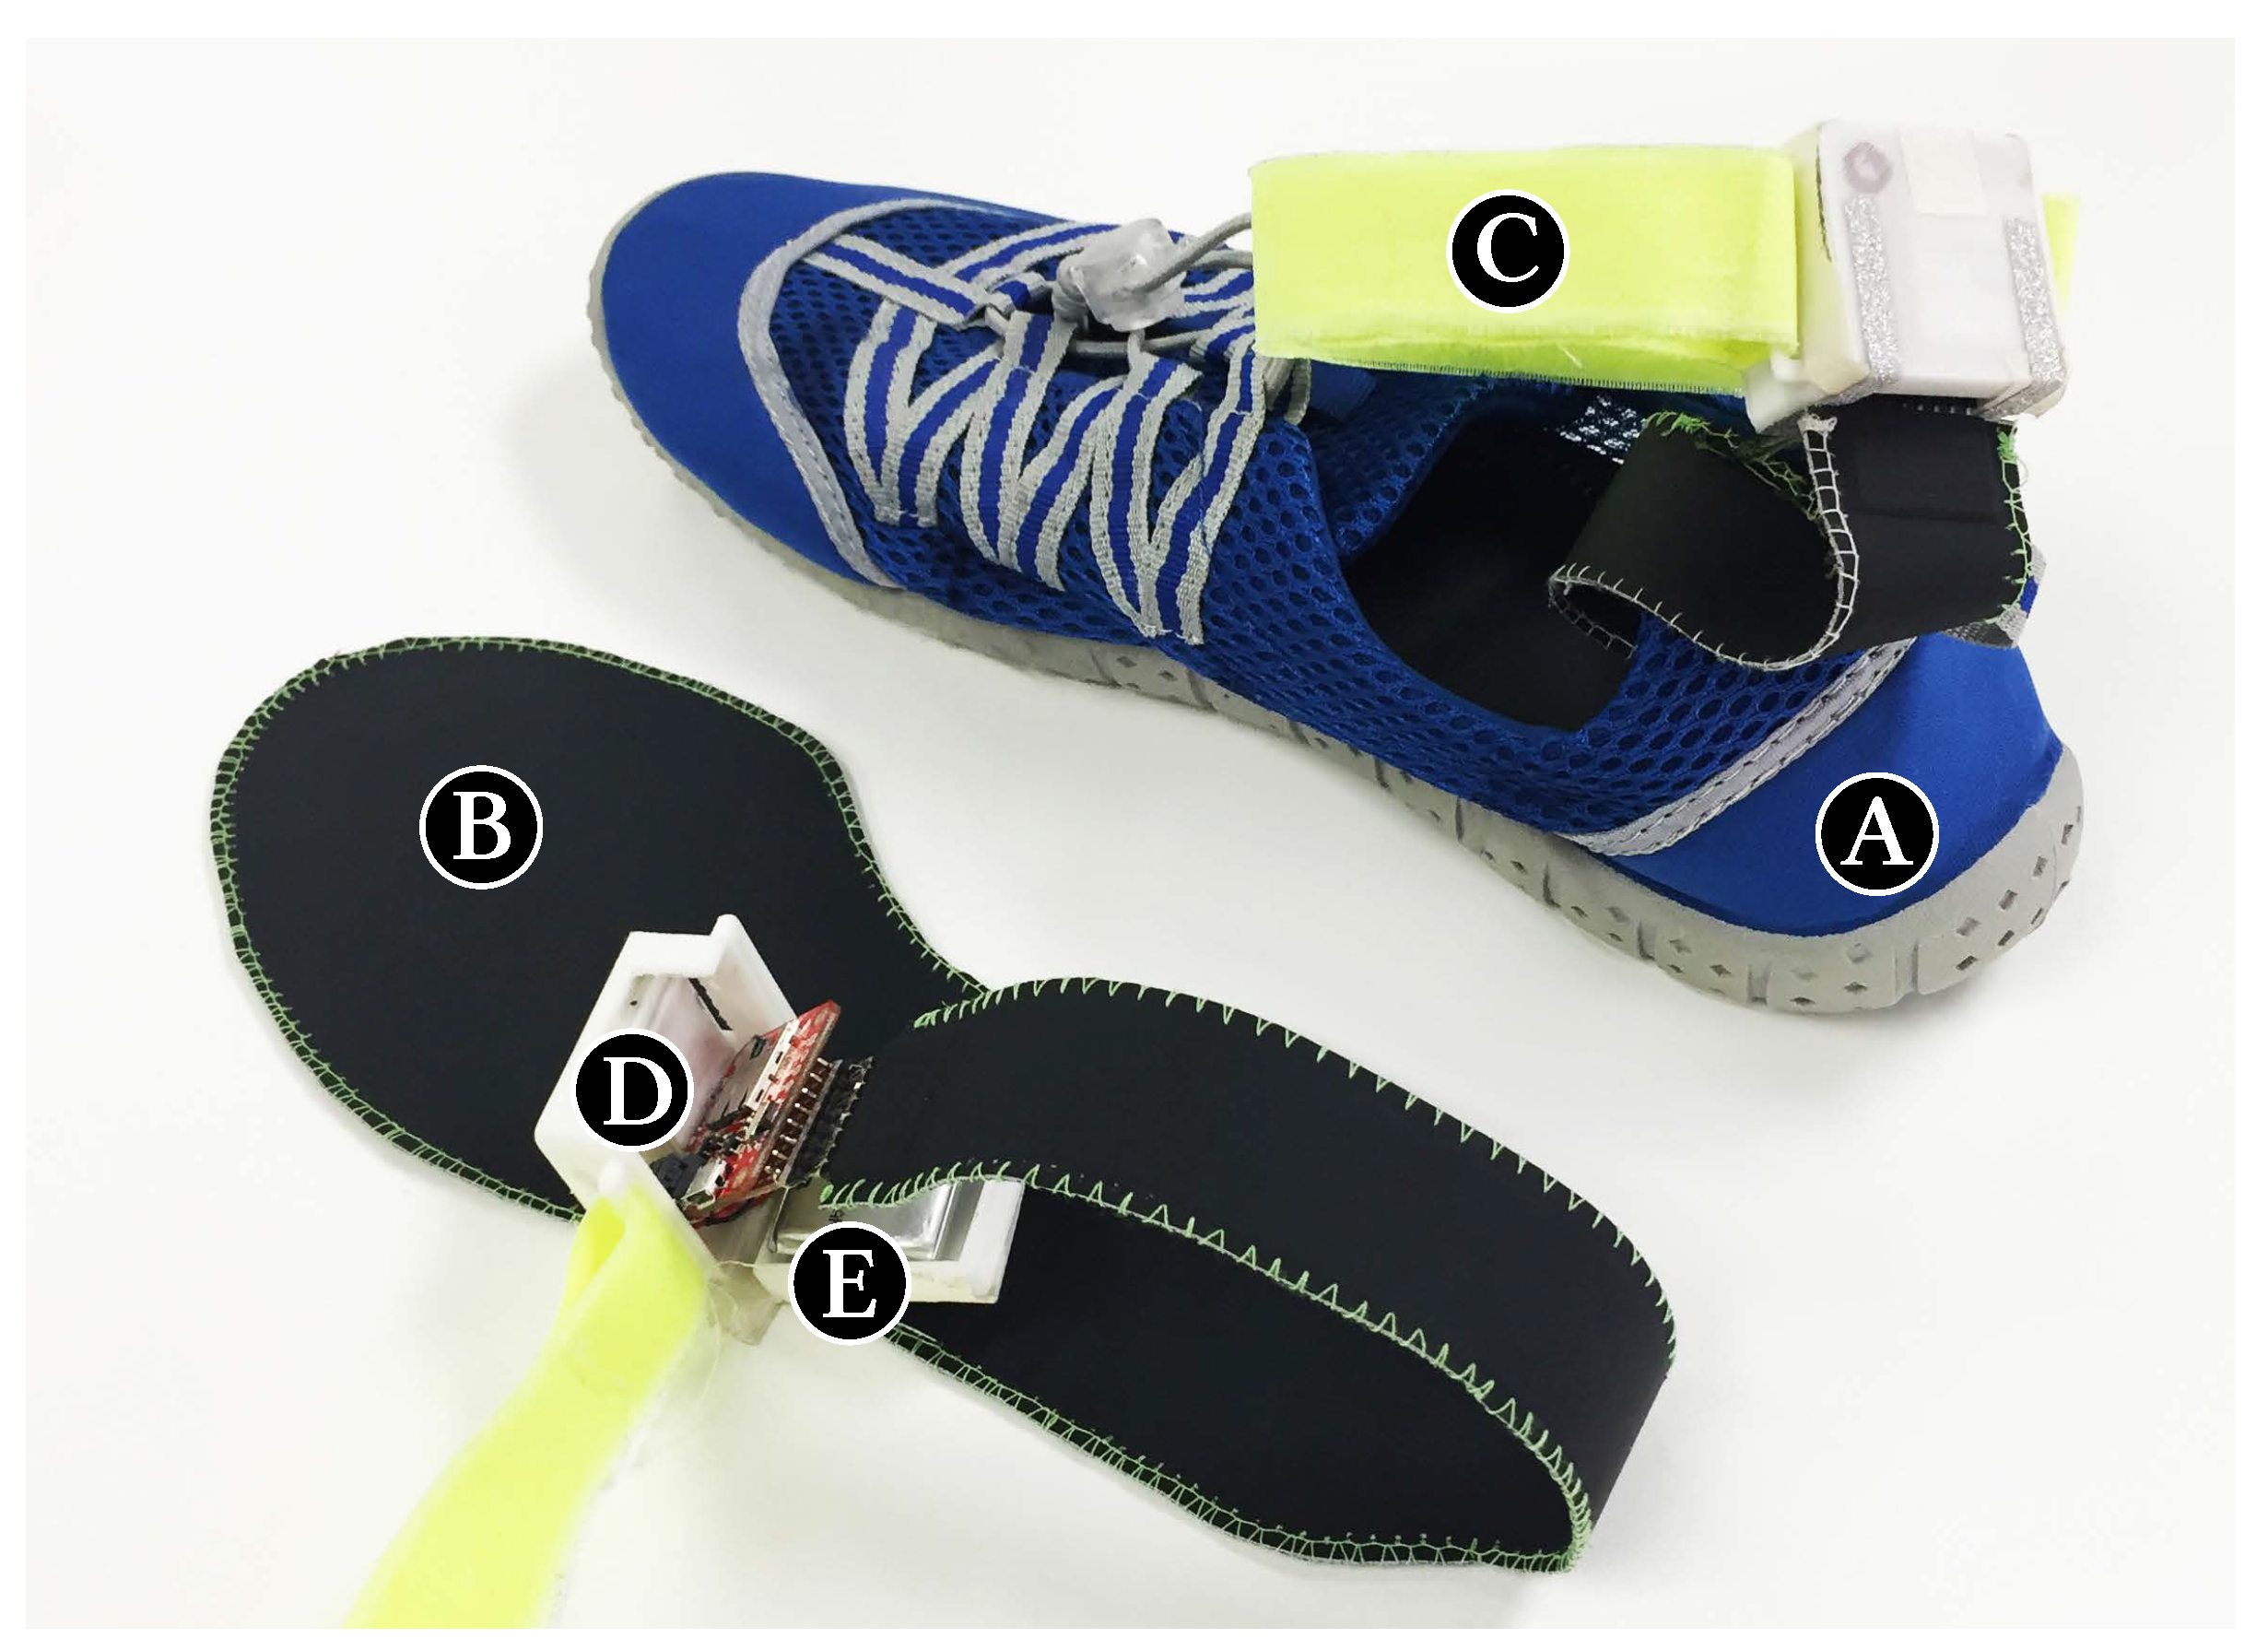
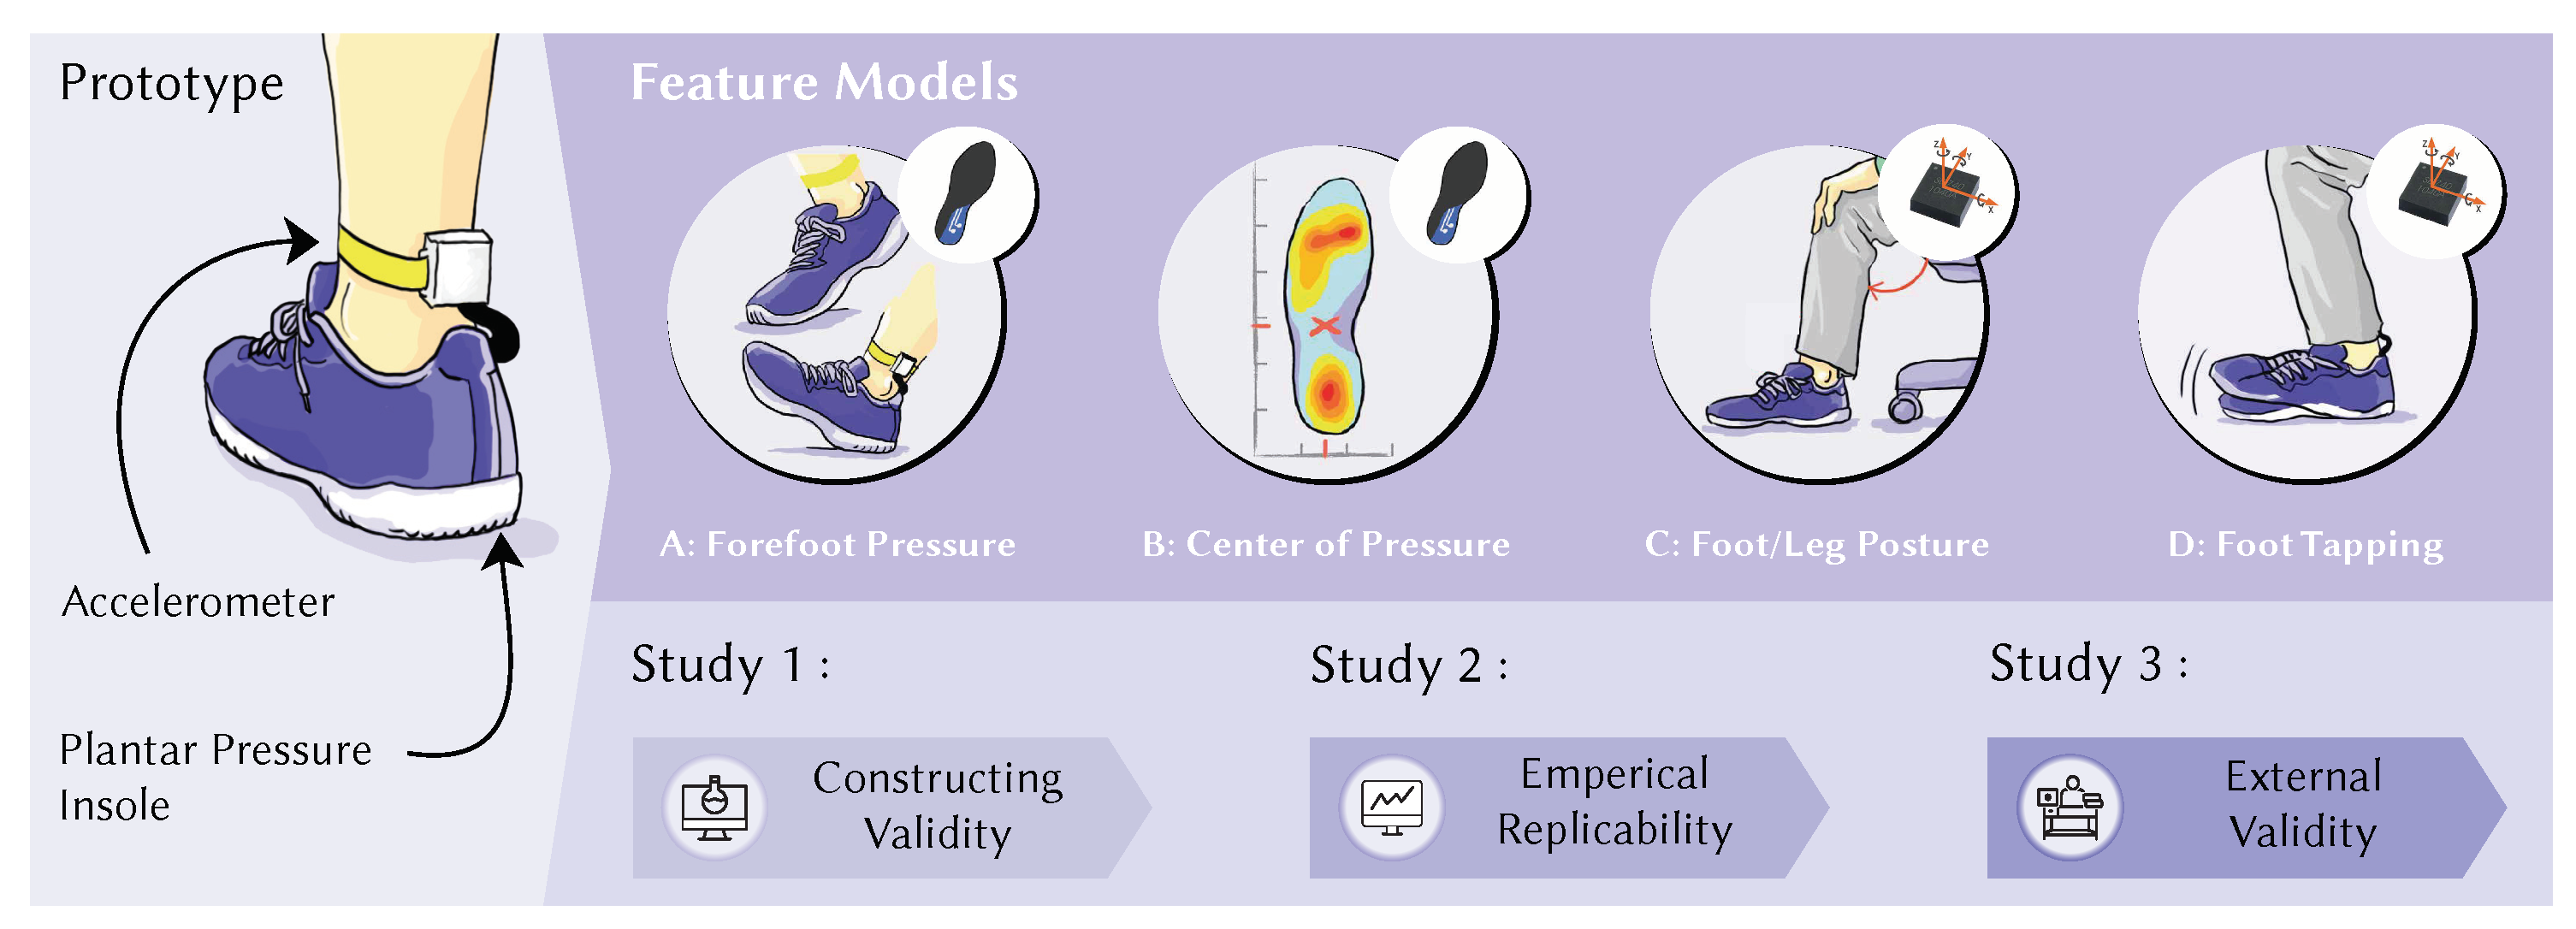
2.2. Prototype
2.3. Features
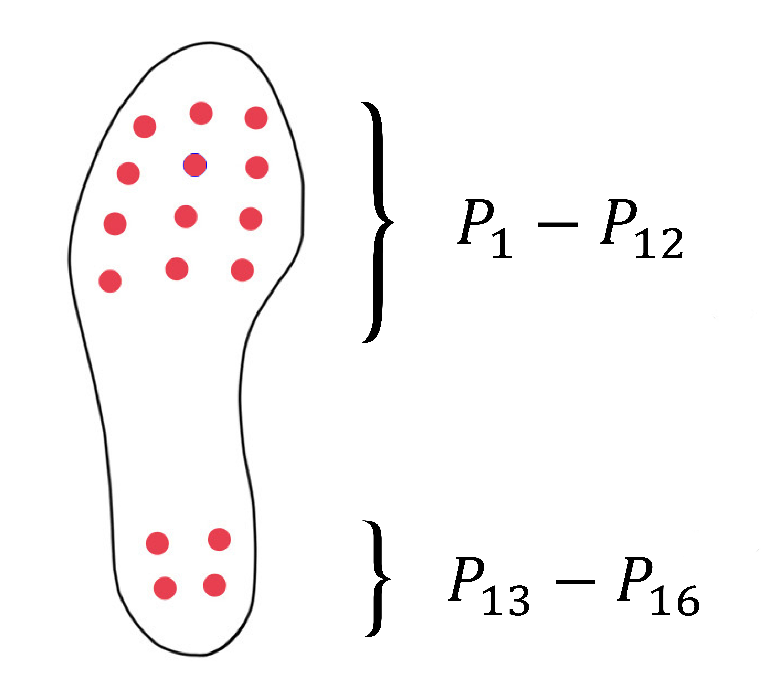
2.3.1. A: Foot Pressure
2.3.2. B: Centre of Pressure
2.3.3. C: Foot/Leg Posture
2.3.4. D: Foot Tapping
3. Construct Validity—Study 1
3.1. Participants
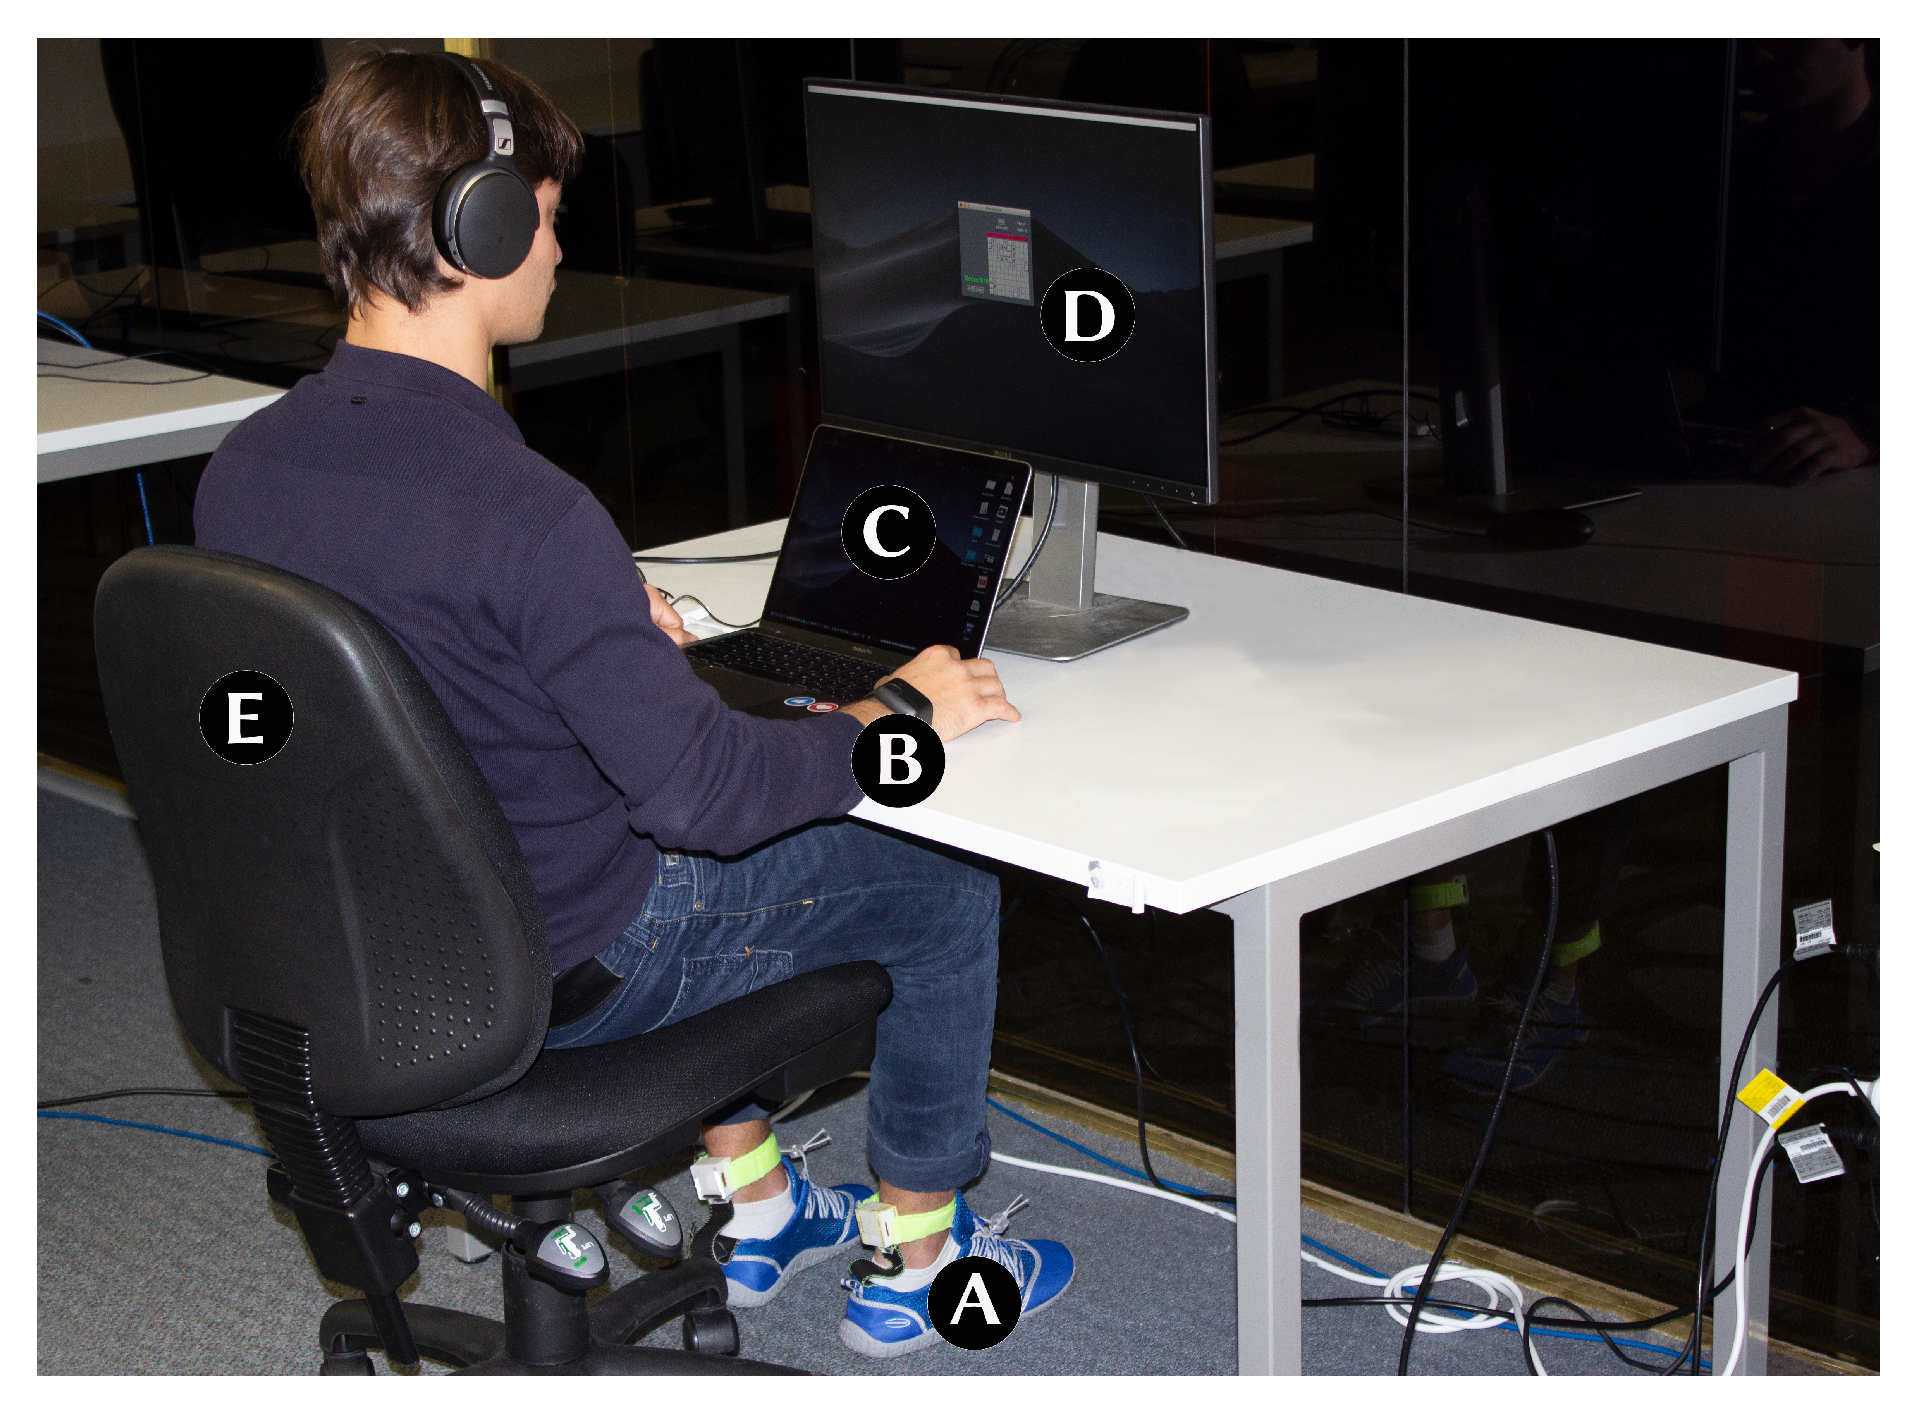
3.2. Apparatus
3.3. Procedure & Tasks
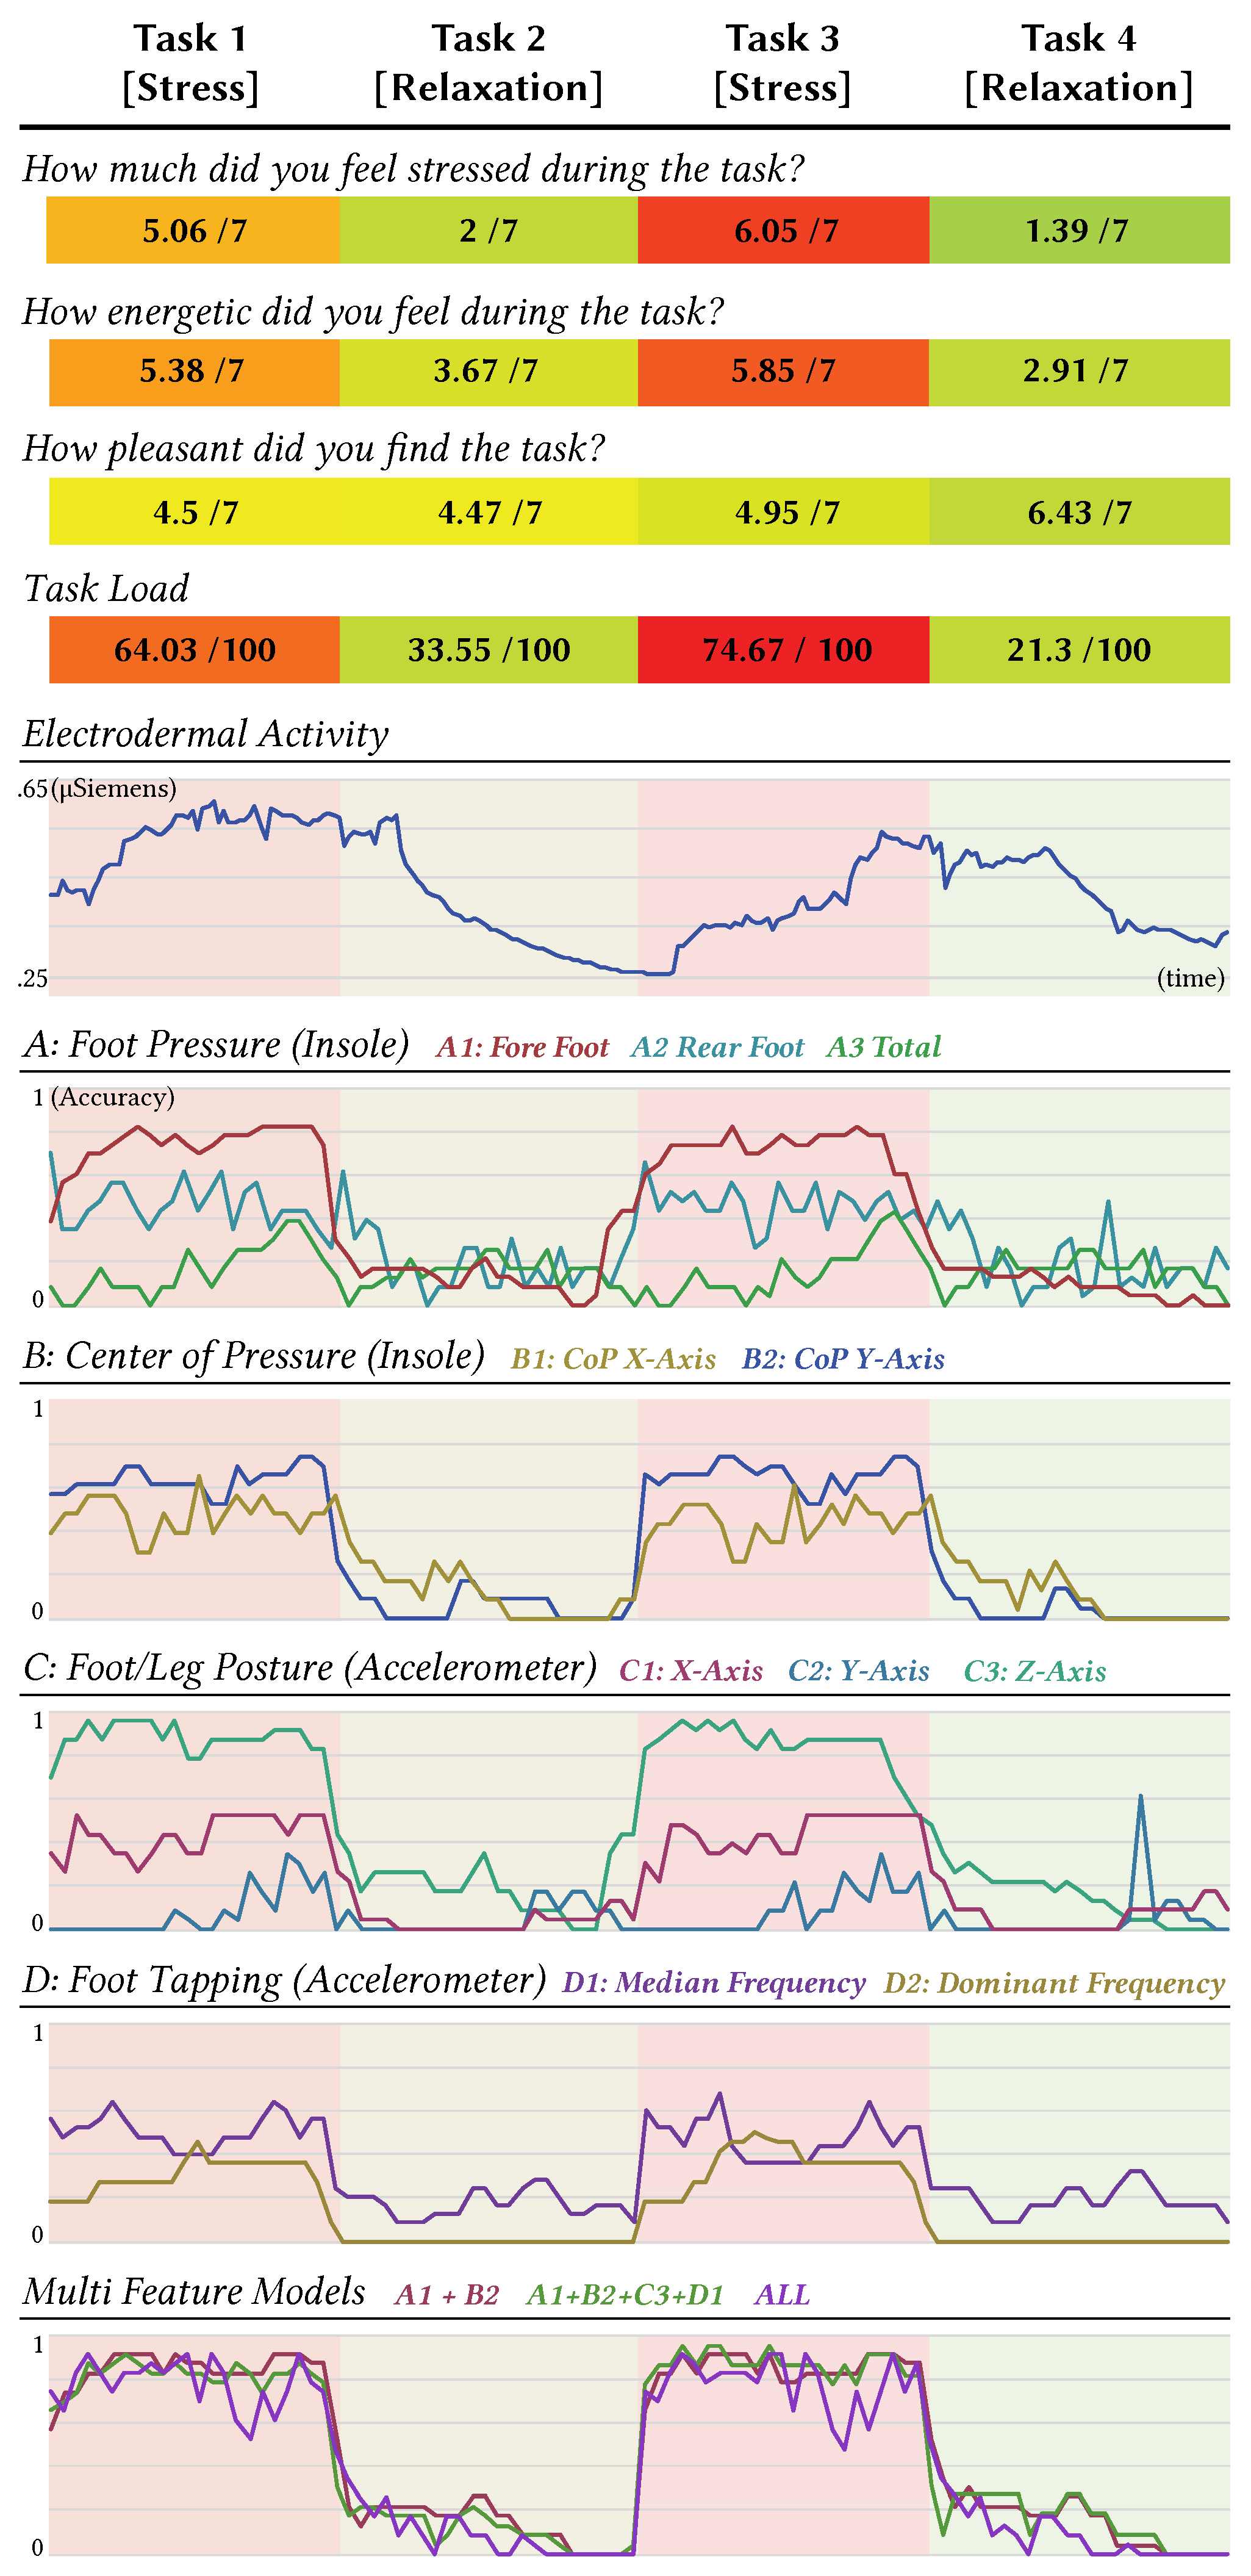
3.3.1. Task 1 [Stress]: Stroop Color and Word Test
3.3.2. Task 2 [Relaxation]: Minesweeper Introduction Video
3.3.3. Task 3 [Stress]: Minesweeper
3.3.4. Task 4 [Relaxation]: Nature Video
3.4. Data Gathering
3.5. Data Analysis
3.6. Results
3.6.1. Electrodermal Activity (EDA)
3.6.2. Model Training
3.6.3. Model Validation
4. Empirical Replicability—Study 2
4.1. Study Design
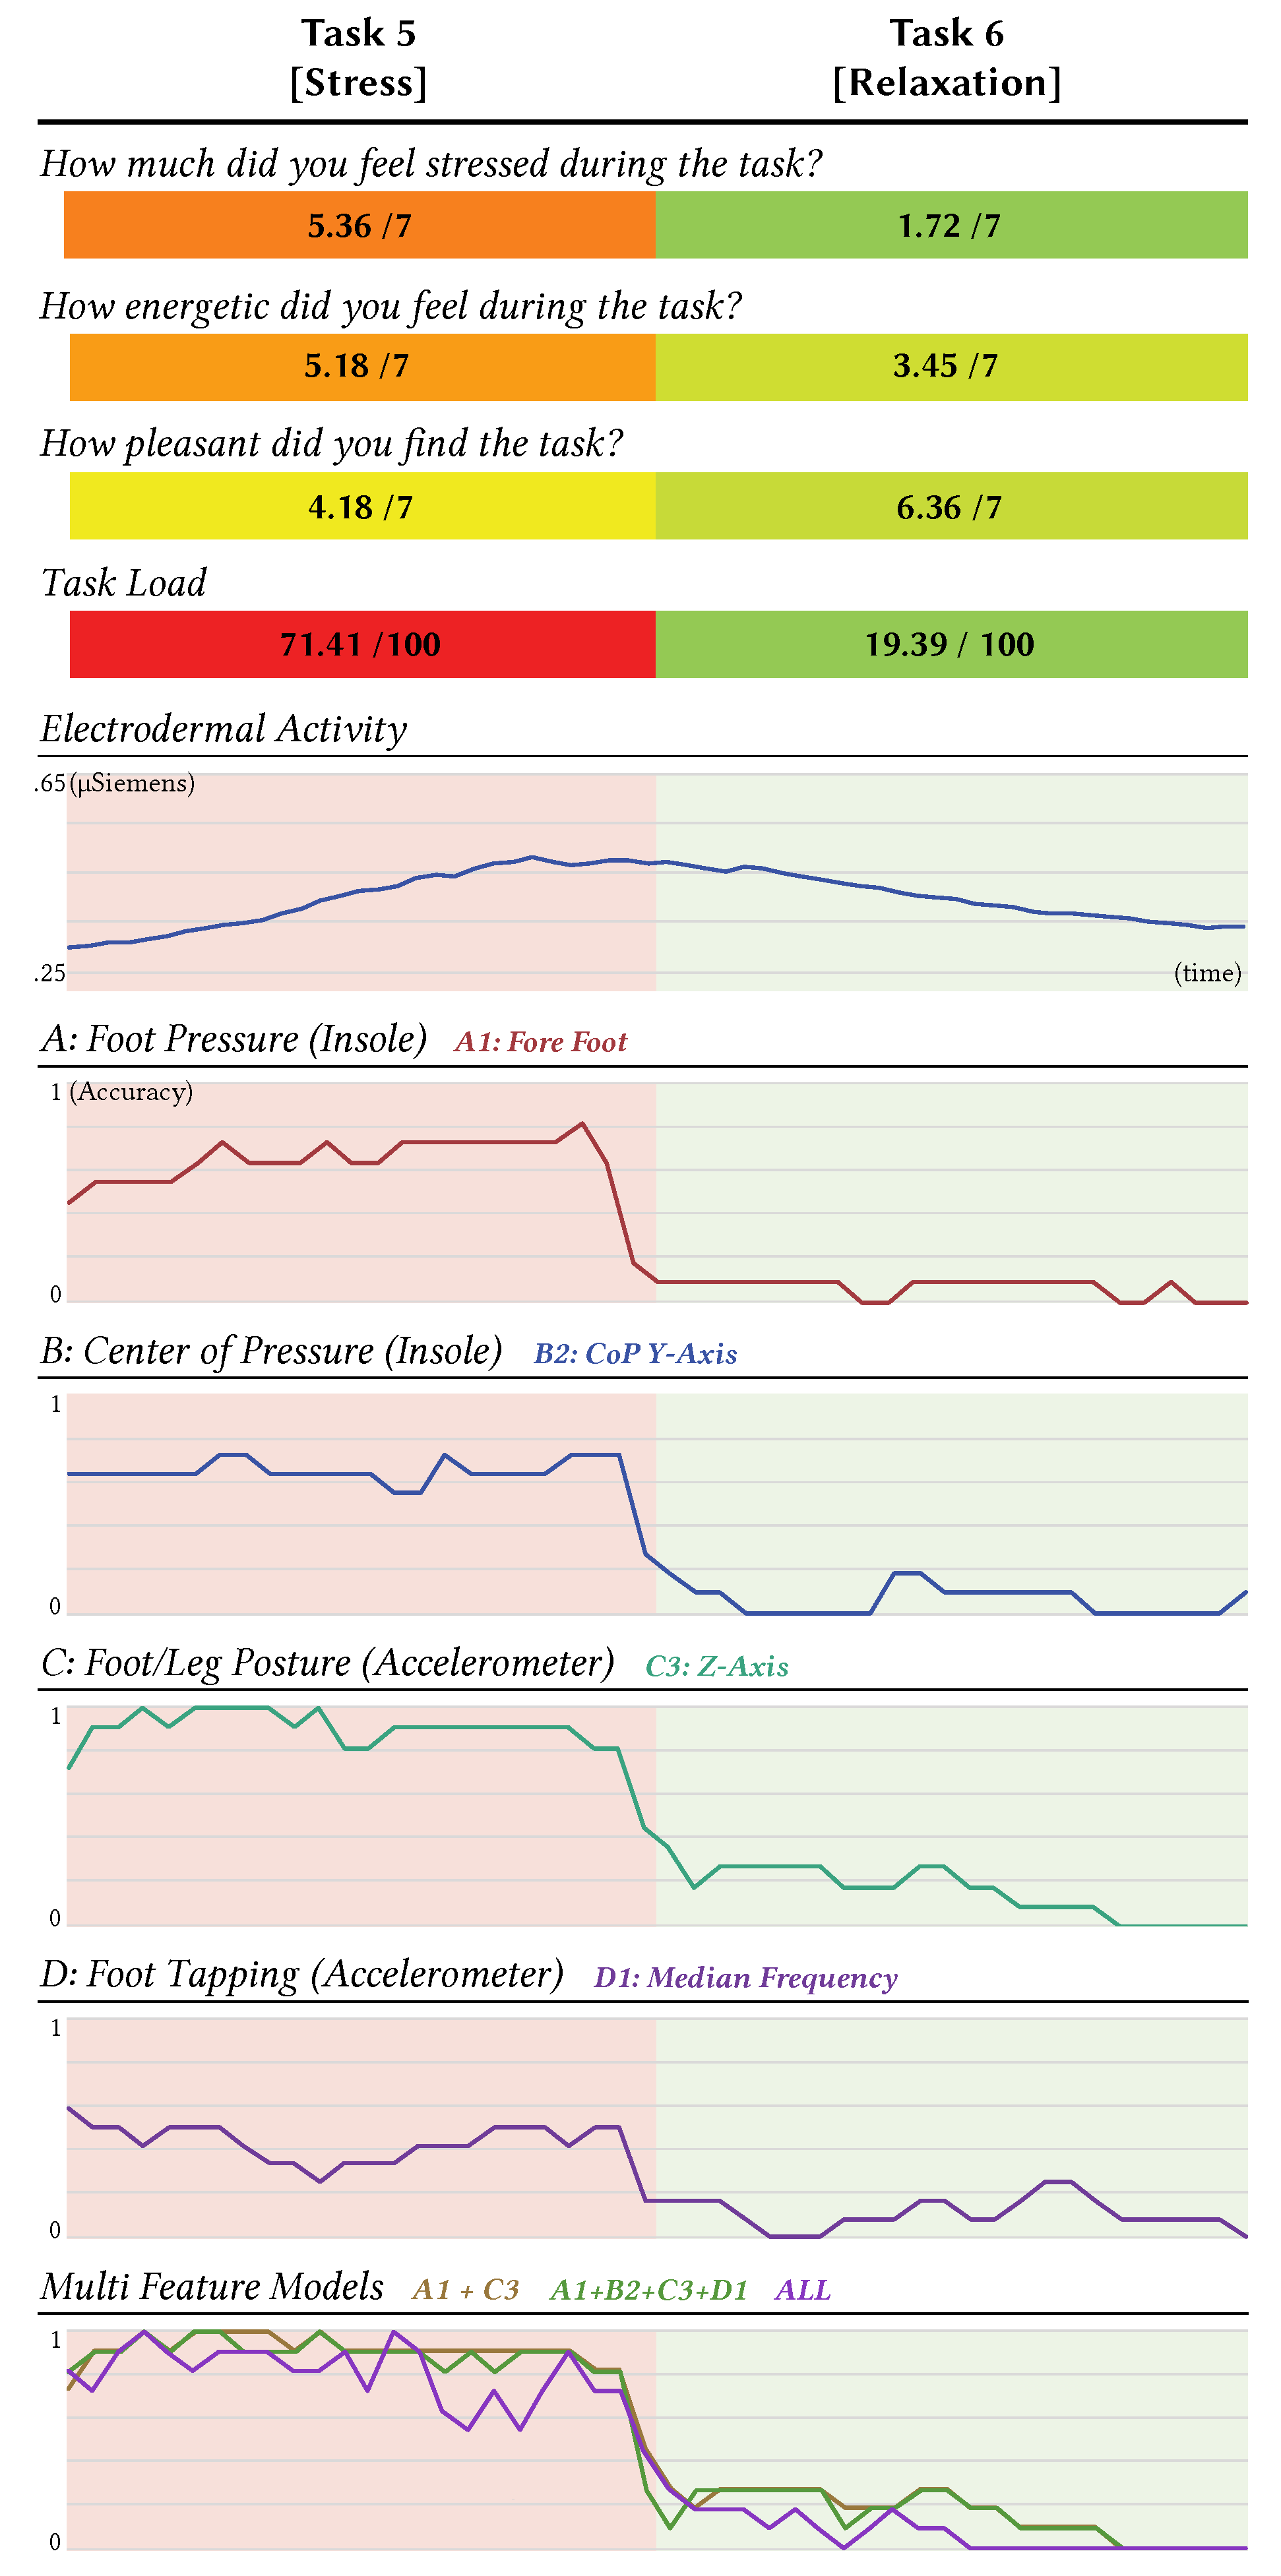
4.1.1. Task 5 [Stress]: Mental Arithmetic Test
4.1.2. Task 6 [Relaxation]: Nature Video
4.2. Results
4.2.1. Electrodermal Activity (EDA)
4.2.2. Overall Model Validation
5. External Validity—Study 3
5.1. Participants
5.2. Task and Procedure
5.3. Apparatus and Data Gathering
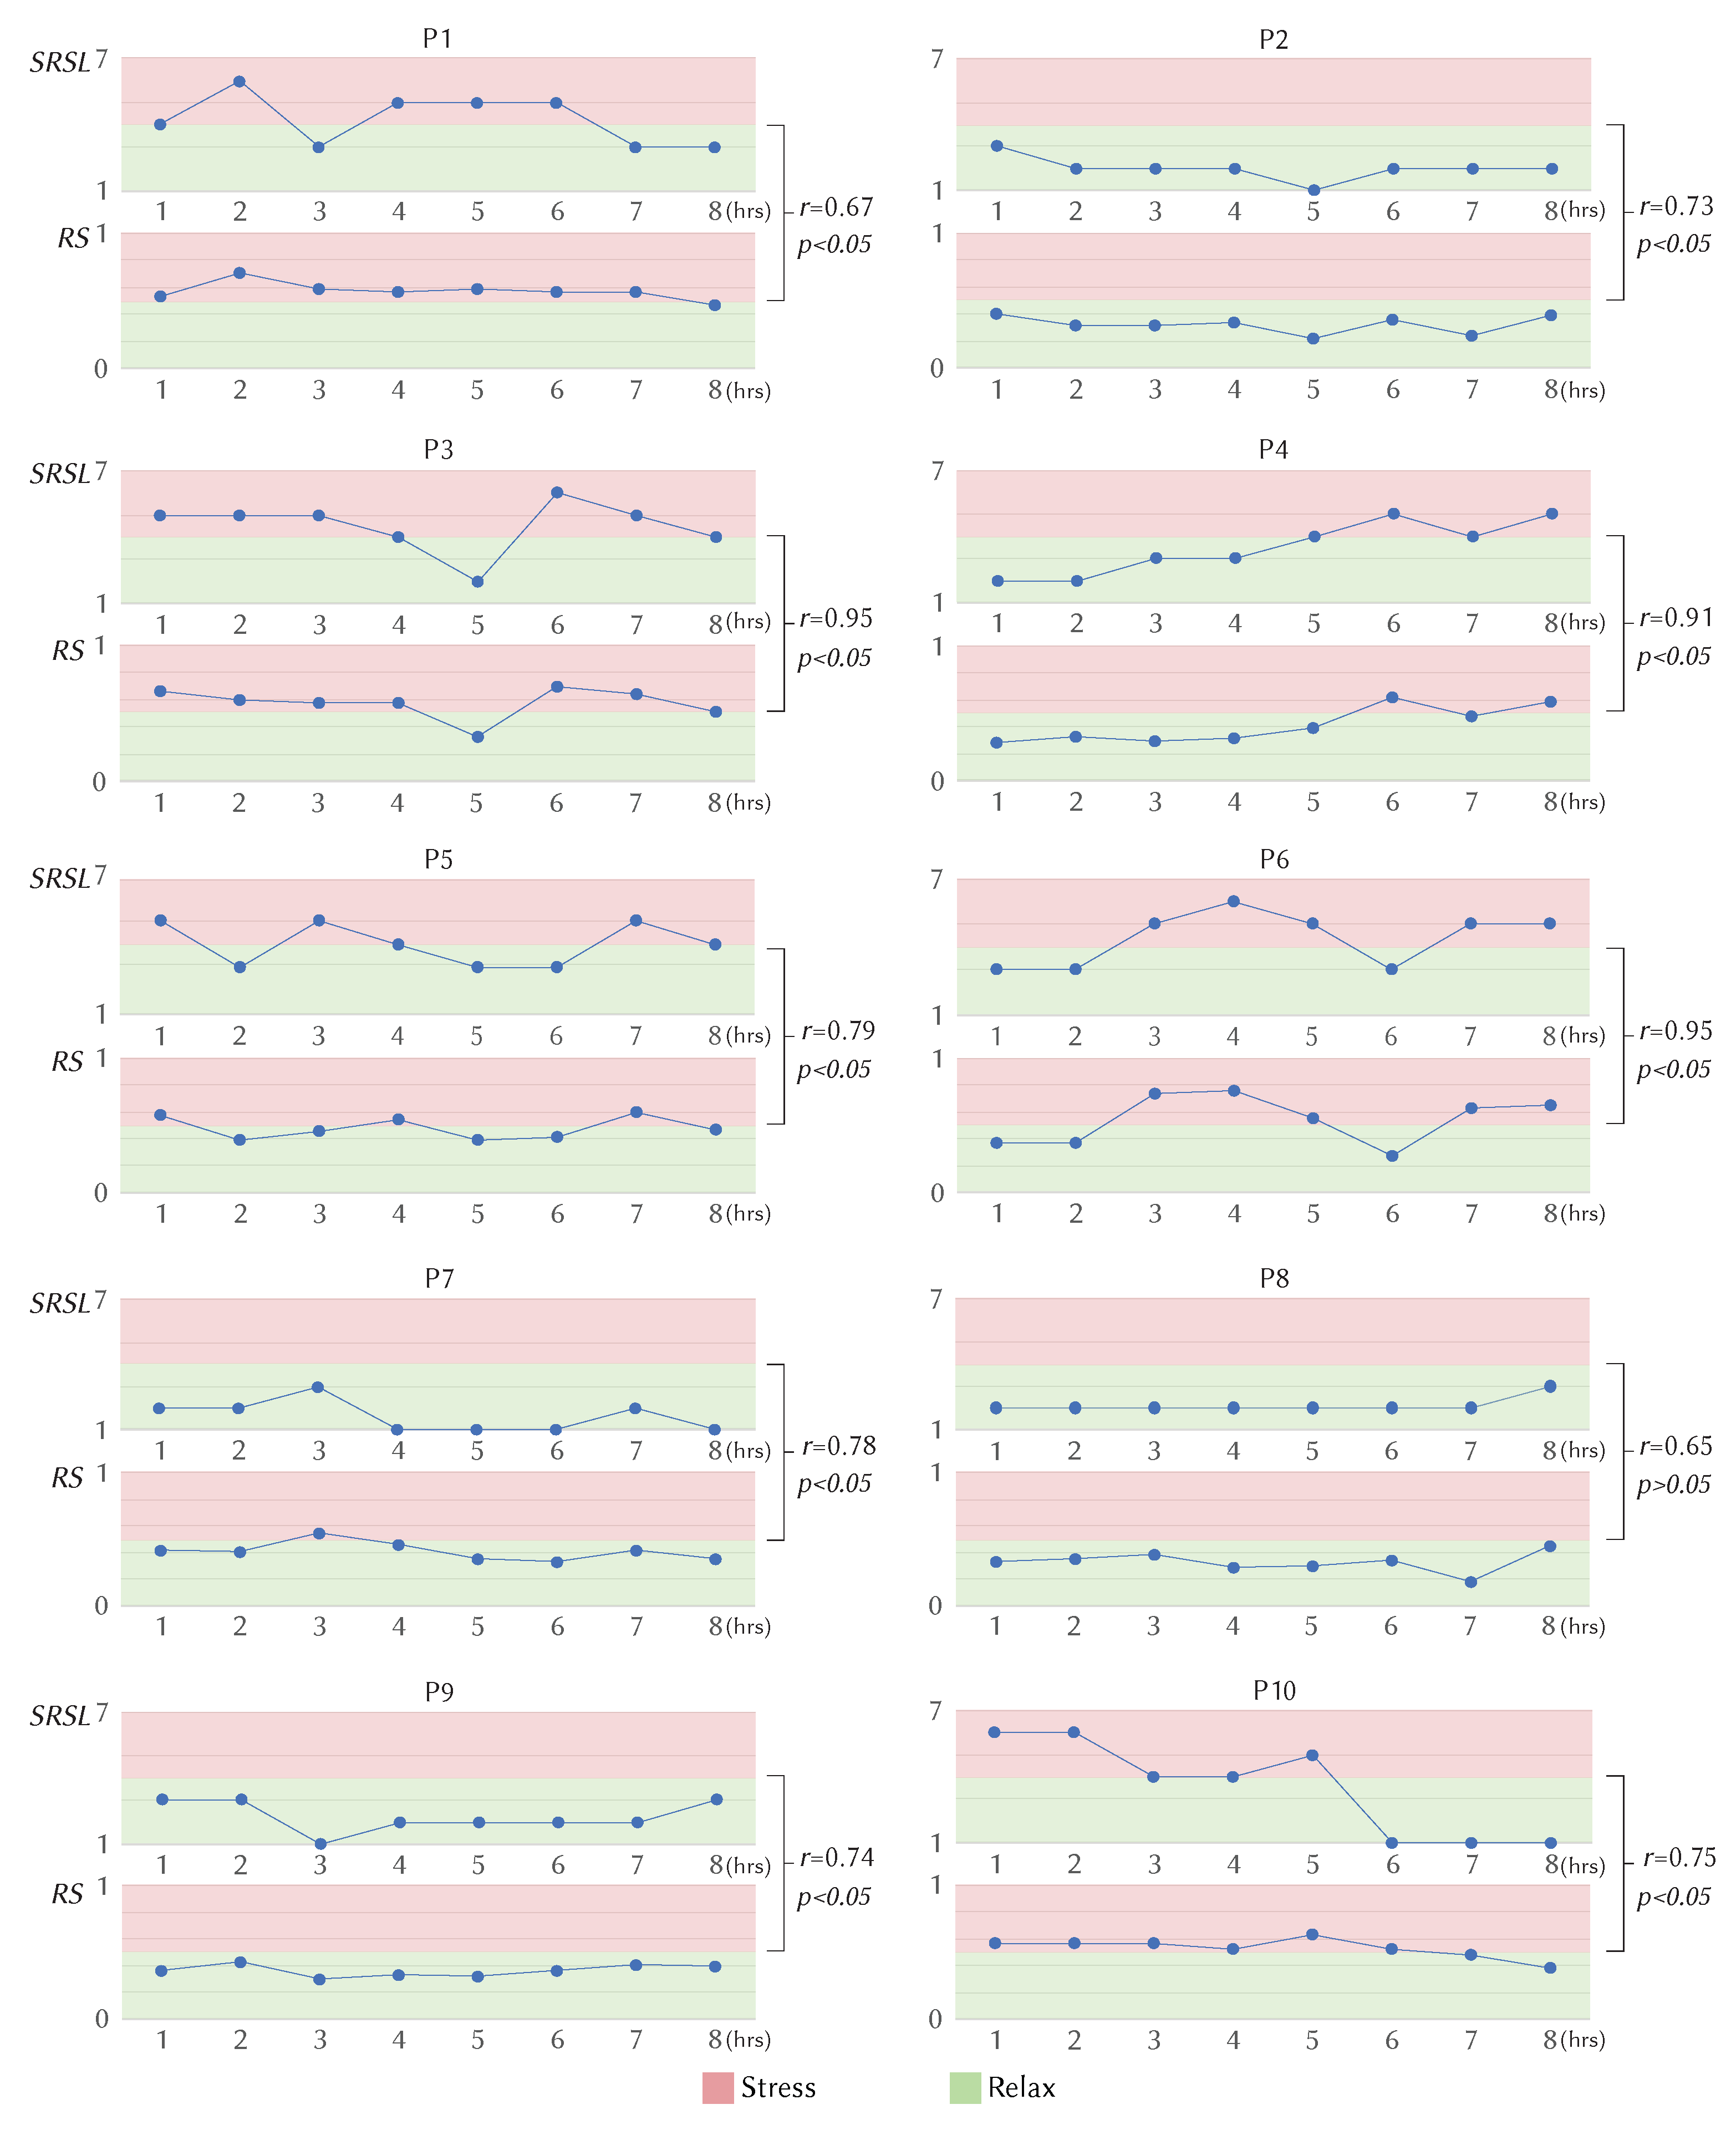
5.4. Results
5.4.1. Activities
5.4.2. Electrodermal Activity (EDA)
5.4.3. Overall in Field Validation
6. Discussion
6.1. Accuracy
6.2. Applications
6.2.1. Professional Environment
6.2.2. The Quantified Self
6.3. Limitations and Future Work
6.3.1. Quantifying Multiple Stress Levels
6.3.2. Stress Detection in Sitting Posture and Other Activities
6.3.3. Accuracy Boost with Personalised Models
6.3.4. Improved Hardware
7. Conclusions
Author Contributions
Funding
Acknowledgments
Conflicts of Interest
Abbreviations
| IMU | Inertial Measurement Units |
| CoP | Centre of Pressure |
| EDA | Electrodermal Activity |
| SRSL | Self-Reported Stress Level |
References
- Pugliesi, K. The consequences of emotional labor: Effects on work stress, job satisfaction, and well-being. Motiv. Emot. 1999, 23, 125–154. [Google Scholar] [CrossRef]
- Renneberg, B.; Hammelstein, P. Gesundheitspsychologie; Springer: Cham, Switzerland, 2006. [Google Scholar]
- Quick, J.D.; Horn, R.S.; Quick, J.C. Health consequences of stress. J. Organ. Behav. Manag. 1987, 8, 19–36. [Google Scholar] [CrossRef]
- Healey, J.; Picard, R.W. Detecting stress during real-world driving tasks using physiological sensors. IEEE Trans. Intell. Transp. Syst. 2005, 6, 156–166. [Google Scholar] [CrossRef] [Green Version]
- Villarejo, M.V.; Zapirain, B.G.; Zorrilla, A.M. A stress sensor based on Galvanic Skin Response (GSR) controlled by ZigBee. Sensors 2012, 12, 6075–6101. [Google Scholar] [PubMed] [Green Version]
- Hamid, N.H.A.; Sulaiman, N.; Aris, S.A.M.; Murat, Z.H.; Taib, M.N. Evaluation of human stress using EEG power spectrum. In Proceedings of the 2010 6th International Colloquium on Signal Processing & Its Applications, Mallaca City, Malaysia, 21–23 May 2010; pp. 1–4. [Google Scholar]
- Nagae, D.; Mase, A. Measurement of heart rate variability and stress evaluation by using microwave reflectometric vital signal sensing. Rev. Sci. Instrum. 2010, 81, 094301. [Google Scholar] [CrossRef] [Green Version]
- Subhani, A.R.; Xia, L.; Malik, A.S. EEG signals to measure mental stress. In Proceedings of the 2nd International Conference on Behavioral, Cognitive and Psychological Sciences, Maldives, 25–27 November 2011; pp. 84–88. [Google Scholar]
- Rohracher, H. Microvibration, permanent muscle-activity and constancy of body-temperature. Percept. Mot. Ski. 1964, 19, 198. [Google Scholar] [CrossRef]
- Lundberg, U.; Kadefors, R.; Melin, B.; Palmerud, G.; Hassmén, P.; Engström, M.; Dohns, I.E. Psychophysiological stress and EMG activity of the trapezius muscle. Int. J. Behav. Med. 1994, 1, 354–370. [Google Scholar] [CrossRef]
- Lerner, J.S.; Dahl, R.E.; Hariri, A.R.; Taylor, S.E. Facial expressions of emotion reveal neuroendocrine and cardiovascular stress responses. Biol. Psychiatry 2007, 61, 253–260. [Google Scholar] [CrossRef]
- Navarro, J.; Karlins, M. What Every Body is Saying; HarperCollins Publishers: New York, NY, USA, 2008. [Google Scholar]
- Kleinsmith, A.; Bianchi-Berthouze, N. Affective body expression perception and recognition: A survey. IEEE Trans. Affect. Comput. 2012, 4, 15–33. [Google Scholar] [CrossRef]
- Kim, D.; Seo, Y.; Cho, J.; Cho, C.H. Detection of subjects with higher self-reporting stress scores using heart rate variability patterns during the day. In Proceedings of the 2008 30th Annual International Conference of the IEEE Engineering in Medicine and Biology Society, Vancouver, BC, Canada, 20–25 August 2008; pp. 682–685. [Google Scholar]
- Macleod, J.; Smith, G.D.; Heslop, P.; Metcalfe, C.; Carroll, D.; Hart, C. Limitations of adjustment for reporting tendency in observational studies of stress and self reported coronary heart disease. J. Epidemiol. Community Health 2002, 56, 76–77. [Google Scholar]
- McDuff, D.J.; Hernandez, J.; Gontarek, S.; Picard, R.W. COGCAM: Contact-free Measurement of Cognitive Stress During Computer Tasks with a Digital Camera. In Proceedings of the 2016 CHI Conference on Human Factors in Computing Systems; ACM: New York, NY, USA, 2016; pp. 4000–4004. [Google Scholar] [CrossRef]
- McDuff, D.; Gontarek, S.; Picard, R.W. Improvements in remote cardiopulmonary measurement using a five band digital camera. IEEE Trans. Biomed. Eng. 2014, 61, 2593–2601. [Google Scholar] [CrossRef] [PubMed] [Green Version]
- Poh, M.Z.; McDuff, D.J.; Picard, R.W. Advancements in noncontact, multiparameter physiological measurements using a webcam. IEEE Trans. Biomed. Eng. 2010, 58, 7–11. [Google Scholar] [CrossRef] [PubMed] [Green Version]
- Gimpel, H.; Regal, C.; Schmidt, M. myStress: Unobtrusive Smartphone-Based Stress Detection. Available online: https://www.fim-rc.de/Paperbibliothek/Veroeffentlicht/494/wi-494.pdf (accessed on 19 May 2020).
- Sano, A.; Picard, R.W. Stress recognition using wearable sensors and mobile phones. In Proceedings of the 2013 Humaine Association Conference on Affective Computing and Intelligent Interaction, Geneva, Switzerland, 2–5 September 2013; pp. 671–676. [Google Scholar]
- Stütz, T.; Kowar, T.; Kager, M.; Tiefengrabner, M.; Stuppner, M.; Blechert, J.; Wilhelm, F.H.; Ginzinger, S. Smartphone based stress prediction. In International Conference on User Modeling, Adaptation, and Personalization; Springer: Cham, Switzerland, 2015; pp. 240–251. [Google Scholar]
- Martínez-Nova, A.; Cuevas-García, J.C.; Pascual-Huerta, J.; Sánchez-Rodríguez, R. BioFoot® in-shoe system: Normal values and assessment of the reliability and repeatability. Foot 2007, 17, 190–196. [Google Scholar] [CrossRef]
- Elvitigala, D.S.; Matthies, D.J.; David, L.; Weerasinghe, C.; Nanayakkara, S. GymSoles: Improving Squats and Dead-Lifts by Visualizing the User’s Center of Pressure. In Proceedings of the 2019 CHI Conference on Human Factors in Computing Systems; ACM: New York, NY, USA, 2019; pp. 174:1–174:12. [Google Scholar] [CrossRef]
- Haescher, M.; Matthies, D.J.; Bieber, G.; Urban, B. Capwalk: A capacitive recognition of walking-based activities as a wearable assistive technology. In Proceedings of the 8th ACM International Conference on PErvasive Technologies Related to Assistive Environments, Corfu, Greece, 1–3 July 2015; p. 35. [Google Scholar]
- Matthies, D.J.; Roumen, T.; Kuijper, A.; Urban, B. CapSoles: Who is walking on what kind of floor? In Proceedings of the 19th International Conference on Human-Computer Interaction with Mobile Devices and Services, Vienna, Austria, 4–7 September 2017; p. 9. [Google Scholar]
- Saunders, W.; Vogel, D. Tap-kick-click: Foot interaction for a standing desk. In Proceedings of the 2016 ACM Conference on Designing Interactive Systems, Brisbane, Australia, 4–8 June 2016; pp. 323–333. [Google Scholar]
- What the Feet and Legs Say about Us. Psychology Today. Available online: https://www.psychologytoday.com/nz/blog/spycatcher/200911/what-the-feet-and-legs-say-about-us?fbclid=IwAR2MVdwmirSc9GpOOAzl7wNwrkX5dHCxgfcvO0xky7uR46yANdAI-OLnaQY (accessed on 1 August 2019).
- Brewer, M.B.; Crano, W.D. Research design and issues of validity. In Handbook of Research Methods in Social and Personality Psychology; Reis, H.T., Judd, C.M., Eds.; Cambridge University Press: Cambridge, UK, 2014. [Google Scholar]
- Blain, S.; Mihailidis, A.; Chau, T. Assessing the potential of electrodermal activity as an alternative access pathway. Med. Eng. Phys. 2008, 30, 498–505. [Google Scholar] [CrossRef]
- Jerritta, S.; Murugappan, M.; Nagarajan, R.; Wan, K. Physiological signals based human emotion recognition: A review. In Proceedings of the 2011 IEEE 7th International Colloquium on Signal Processing and Its Applications, Penang, Malaysia, 4–6 March 2011; pp. 410–415. [Google Scholar]
- Bousefsaf, F.; Maaoui, C.; Pruski, A. Remote Assessment of the Heart Rate Variability to Detect Mental Stress. In Proceedings of the (Institute for Computer Sciences, Social-Informatics and Telecommunications Engineering): ICST, Brussels, Belgium, 5 May 2013; pp. 348–351. [Google Scholar] [CrossRef]
- Barreto, A.; Zhai, J.; Adjouadi, M. Non-intrusive physiological monitoring for automated stress detection in human-computer interaction. In International Workshop on Human-Computer Interaction; Springer: Berlin/Heidelberg, Germany, 2007; pp. 29–38. [Google Scholar]
- Herborn, K.A.; Graves, J.L.; Jerem, P.; Evans, N.P.; Nager, R.; McCafferty, D.J.; McKeegan, D.E. Skin temperature reveals the intensity of acute stress. Physiol. Behav. 2015, 152, 225–230. [Google Scholar] [CrossRef] [Green Version]
- Kataoka, H.; Kano, H.; Yoshida, H.; Saijo, A.; Yasuda, M.; Osumi, M. Development of a skin temperature measuring system for non-contact stress evaluation. In Proceedings of the 20th Annual International Conference of the IEEE Engineering in Medicine and Biology Society. Vol. 20 Biomedical Engineering Towards the Year 2000 and Beyond (Cat. No. 98CH36286), Hong Kong, China, 1 November 1998; Volume 2, pp. 940–943. [Google Scholar]
- Seo, S.H.; Lee, J.T. Stress and EEG. In Convergence and Hybrid Information Technologies; IntechOpen: London, UK, 2010; pp. 413–426. [Google Scholar]
- Ekberg, K.; Eklund, J.; Tuvesson, M.A.; Örtengren, R.; Odenrick, P.; Ericson, M. Psychological stress and muscle activity during data entry at visual display units. Work Stress 1995, 9, 475–490. [Google Scholar] [CrossRef]
- Andreassi, J.L. Psychophysiology: Human Behavior and Physiological Response; Psychology Press: London, UK, 2010. [Google Scholar]
- Choi, J.; Ahmed, B.; Gutierrez-Osuna, R. Development and evaluation of an ambulatory stress monitor based on wearable sensors. IEEE Trans. Inf. Technol. Biomed. 2011, 16, 279–286. [Google Scholar] [CrossRef] [Green Version]
- Hernandez, J.; Morris, R.R.; Picard, R.W. Call Center Stress Recognition with Person-specific Models. In International Conference on Affective Computing and Intelligent Interaction; Springer: Berlin/Heidelberg, Germany, 2011; pp. 125–134. [Google Scholar]
- Setz, C.; Arnrich, B.; Schumm, J.; La Marca, R.; Tröster, G.; Ehlert, U. Discriminating stress from cognitive load using a wearable EDA device. IEEE Trans. Inf. Technol. Biomed. 2009, 14, 410–417. [Google Scholar] [CrossRef]
- Hernandez, J.; Paredes, P.; Roseway, A.; Czerwinski, M. Under Pressure: Sensing Stress of Computer Users. In Proceedings of the SIGCHI Conference on Human Factors in Computing Systems; ACM: New York, NY, USA, 2014; pp. 51–60. [Google Scholar] [CrossRef]
- Boucsein, W. Electrodermal Activity; Springer Science & Business Media: Berlin/Heidelberg, Germany, 2012. [Google Scholar]
- Hjortskov, N.; Rissén, D.; Blangsted, A.K.; Fallentin, N.; Lundberg, U.; Søgaard, K. The effect of mental stress on heart rate variability and blood pressure during computer work. Eur. J. Appl. Physiol. 2004, 92, 84–89. [Google Scholar] [CrossRef]
- Moses, Z.B.; Luecken, L.J.; Eason, J.C. Measuring task-related changes in heart rate variability. In Proceedings of the 2007 29th Annual International Conference of the IEEE Engineering in Medicine and Biology Society, Lyon, France, 22–26 August 2007; pp. 644–647. [Google Scholar]
- Lee, H.B.; Kim, J.S.; Kim, Y.S.; Baek, H.J.; Ryu, M.S.; Park, K.S. The relationship between HRV parameters and stressful driving situation in the real road. In Proceedings of the 2007 6th International Special Topic Conference on Information Technology Applications in Biomedicine, Tokyo, Japan, 8–11 November 2007; pp. 198–200. [Google Scholar]
- Allen, J. Photoplethysmography and its application in clinical physiological measurement. Physiol. Meas. 2007, 28, R1. [Google Scholar] [CrossRef] [Green Version]
- Lyu, Y.; Luo, X.; Zhou, J.; Yu, C.; Miao, C.; Wang, T.; Shi, Y.; Kameyama, K.I. Measuring Photoplethysmogram- Based Stress-Induced Vascular Response Index to Assess Cognitive Load and Stress. In Proceedings of the 33rd Annual ACM Conference on Human Factors in Computing Systems; ACM: New York, NY, USA, 2015; pp. 857–866. [Google Scholar] [CrossRef]
- Hernandez, J.; McDuff, D.; Picard, R.W. BioWatch: Estimation of Heart and Breathing Rates from Wrist Motions. In Proceedings of the 2015 9th International Conference on Pervasive Computing Technologies for Healthcare (PervasiveHealth), Istanbul, Turkey, 20–23 May 2015; pp. 169–176. [Google Scholar]
- Hernandez, J.; Picard, R.W. SenseGlass: Using Google Glass to Sense Daily Emotions. In Proceedings of the Adjunct Publication of the 27th Annual ACM Symposium on User Interface Software and Technology; ACM: New York, NY, USA, 2014; pp. 77–78. [Google Scholar] [CrossRef] [Green Version]
- Haescher, M.; Matthies, D.J.; Trimpop, J.; Urban, B. SeismoTracker: Upgrade Any Smart Wearable to Enable a Sensing of Heart Rate, Respiration Rate, and Microvibrations. In Proceedings of the 2016 CHI Conference Extended Abstracts on Human Factors in Computing Systems; ACM: New York, NY, USA, 2016; pp. 2209–2216. [Google Scholar] [CrossRef]
- Haescher, M.; Matthies, D.J.; Trimpop, J.; Urban, B. A study on measuring heart-and respiration-rate via wrist-worn accelerometer-based seismocardiography (SCG) in comparison to commonly applied technologies. In Proceedings of the 2nd international Workshop on Sensor-Based Activity Recognition and Interaction, Rostock, Germany, 25–26 June 2015; p. 2. [Google Scholar]
- Garbey, M.; Sun, N.; Merla, A.; Pavlidis, I. Contact-free measurement of cardiac pulse based on the analysis of thermal imagery. IEEE Trans. Biomed. Eng. 2007, 54, 1418–1426. [Google Scholar] [CrossRef] [PubMed]
- Puri, C.; Olson, L.; Pavlidis, I.; Levine, J.; Starren, J. StressCam: Non-contact measurement of users’ emotional states through thermal imaging. In CHI’05 Extended Abstracts on Human Factors in Computing Systems; ACM: New York, NY, USA, 2005. [Google Scholar]
- Yun, C.; Shastri, D.; Pavlidis, I.; Deng, Z. O’game, can you feel my frustration?: Improving user’s gaming experience via stresscam. In Proceedings of the SIGCHI Conference on Human Factors in Computing Systems, Boston, MA, USA, 4–9 April 2009; pp. 2195–2204. [Google Scholar]
- Ulyanov, S.S.; Tuchin, V.V. Pulse-wave monitoring by means of focused laser beams scattered by skin surface and membranes. In Static and Dynamic Light Scattering in Medicine and Biology; International Society for Optics and Photonics: Los Angeles, CA, USA, 1993; Volume 1884, pp. 160–167. [Google Scholar]
- Zimmermann, P.; Guttormsen, S.; Danuser, B.; Gomez, P. Affective computing—A rationale for measuring mood with mouse and keyboard. Int. J. Occup. Saf. Ergon. 2003, 9, 539–551. [Google Scholar] [CrossRef]
- Kołakowska, A. A review of emotion recognition methods based on keystroke dynamics and mouse movements. In Proceedings of the 2013 6th International Conference on Human System Interactions (HSI), Sopot, Poland, 6–8 June 2013; pp. 548–555. [Google Scholar]
- Picard, R.W. Affective Computing; MIT Press: Cambridge, MA, USA, 2000. [Google Scholar]
- Grafsgaard, J.F.; Wiggins, J.B.; Boyer, K.E.; Wiebe, E.N.; Lester, J.C. Automatically Recognizing Facial Expression: Predicting Engagement and Frustration. Available online: http://educationaldatamining.org/EDM2013/proceedings/paper_95.pdf (accessed on 18 May 2020).
- Fasel, B.; Luettin, J. Automatic facial expression analysis: A survey. Pattern Recognit. 2003, 36, 259–275. [Google Scholar] [CrossRef] [Green Version]
- Giannakakis, G.; Pediaditis, M.; Manousos, D.; Kazantzaki, E.; Chiarugi, F.; Simos, P.G.; Marias, K.; Tsiknakis, M. Stress and anxiety detection using facial cues from videos. Biomed. Signal Process. Control 2017, 31, 89–101. [Google Scholar] [CrossRef]
- Scheirer, J.; Fernandez, R.; Picard, R.W. Expression Glasses: A Wearable Device for Facial Expression Recognition. In CHI’99 Extended Abstracts on Human Factors in Computing Systems; ACM: New York, NY, USA, 1999; pp. 262–263. [Google Scholar] [CrossRef]
- Hazlett, R. Measurement of User Frustration: A Biologic Approach. In Proceedings of the CHI’03 Extended Abstracts on Human Factors in Computing Systems; ACM: New York, NY, USA, 2003; pp. 734–735. [Google Scholar] [CrossRef]
- San Agustin, J.; Hansen, J.P.; Hansen, D.W.; Skovsgaard, H. Low-cost gaze pointing and EMG clicking. In CHI’09 Extended Abstracts on Human Factors in Computing Systems; ACM: New York, NY, USA, 2009; pp. 3247–3252. [Google Scholar]
- Rantanen, V.; Niemenlehto, P.H.; Verho, J.; Lekkala, J. Capacitive facial movement detection for human–computer interaction to click by frowning and lifting eyebrows. Med. Biol. Eng. Comput. 2010, 48, 39–47. [Google Scholar] [CrossRef] [PubMed]
- Rantanen, V.; Venesvirta, H.; Spakov, O.; Verho, J.; Vetek, A.; Surakka, V.; Lekkala, J. Capacitive measurement of facial activity intensity. IEEE Sens. J. 2013, 13, 4329–4338. [Google Scholar] [CrossRef]
- Matthies, D.J.; Strecker, B.A.; Urban, B. EarFieldSensing: A Novel In-Ear Electric Field Sensing to Enrich Wearable Gesture Input Through Facial Expressions. In Proceedings of the 2017 CHI Conference on Human Factors in Computing Systems; ACM: New York, NY, USA, 2017; pp. 1911–1922. [Google Scholar] [CrossRef]
- Ekman, P.; Friesen, W.V. Detecting deception from the body or face. J. Personal. Soc. Psychol. 1974, 29, 288. [Google Scholar] [CrossRef]
- Argyle, M. Bodily Communication; Routledge: Abingdon, UK, 2013. [Google Scholar]
- Bull, P.E. Posture & Gesture; Elsevier: Amsterdam, The Netherlands, 2016; Volume 16. [Google Scholar]
- Mehrabian, A.; Friar, J.T. Encoding of attitude by a seated communicator via posture and position cues. J. Consult. Clin. Psychol. 1969, 33, 330. [Google Scholar] [CrossRef]
- Greene, S.; Thapliyal, H.; Caban-Holt, A. A Survey of Affective Computing for Stress Detection: Evaluating technologies in stress detection for better health. IEEE Consum. Electron. Mag. 2016, 5, 44–56. [Google Scholar] [CrossRef]
- Wallbott, H.G. Bodily expression of emotion. Eur. J. Soc. Psychol. 1998, 28, 879–896. [Google Scholar] [CrossRef]
- Ekman, P.; Friesen, W.V. Nonverbal leakage and clues to deception. Psychiatry 1969, 32, 88–106. [Google Scholar] [CrossRef] [PubMed]
- Kleinsmith, A.; Bianchi-Berthouze, N.; Steed, A. Automatic recognition of non-acted affective postures. IEEE Trans. Syst. Man Cybern. Part B (Cybernetics) 2011, 41, 1027–1038. [Google Scholar] [CrossRef] [PubMed]
- Kapur, A.; Kapur, A.; Virji-Babul, N.; Tzanetakis, G.; Driessen, P.F. Gesture-based affective computing on motion capture data. In International Conference on Affective Computing and Intelligent Interaction; Springer: Berlin/Heidelberg, Germany, 2005; pp. 1–7. [Google Scholar]
- Arnrich, B.; Setz, C.; La Marca, R.; Tröster, G.; Ehlert, U. What does your chair know about your stress level? IEEE Trans. Inf. Technol. Biomed. 2009, 14, 207–214. [Google Scholar] [CrossRef] [PubMed]
- Mota, S.; Picard, R.W. Automated posture analysis for detecting learner’s interest level. In Proceedings of the 2003 Conference on Computer Vision and Pattern Recognition Workshop, Madison, WI, USA, 16–22 June 2003; Volume 5, p. 49. [Google Scholar]
- Ohnishi, A.; Terada, T.; Tsukamoto, M. A Motion Recognition Method Using Foot Pressure Sensors. In Proceedings of the 9th Augmented Human International Conference, Seoul, Korea, 7–9 February 2018; p. 10. [Google Scholar]
- Sensingtex. Available online: http://www.sensingtex.com/ (accessed on 13 August 2019).
- Shu, L.; Hua, T.; Wang, Y.; Li, Q.; Feng, D.D.; Tao, X. In-shoe plantar pressure measurement and analysis system based on fabric pressure sensing array. IEEE Trans. Inf. Technol. Biomed. 2010, 14, 767–775. [Google Scholar]
- Kellis, E. Plantar pressure distribution during barefoot standing, walking and landing in preschool boys. Gait Posture 2001, 14, 92–97. [Google Scholar] [CrossRef]
- Matthies, D.J.; Haescher, M.; Nanayakkara, S.; Bieber, G. Step Detection for Rollator Users with Smartwatches. In Proceedings of the Symposium on Spatial User Interaction, Berlin, Germany, 13–14 October 2018; pp. 163–167. [Google Scholar]
- Telgarsky, R. Dominant frequency extraction. arXiv 2013, arXiv:1306.0103. [Google Scholar]
- The Most Comfortable and Accurate Wristband to Monitor Physiological Signals in Real-Time. 2019. Available online: https://e4.empatica.com/e4-wristband (accessed on 15 September 2019).
- Hart, S.G.; Staveland, L.E. Development of NASA-TLX (Task Load Index): Results of empirical and theoretical research. In Advances in Psychology; Elsevier: Amsterdam, The Netherlands, 1988; Volume 52, pp. 139–183. [Google Scholar]
- Stroop, J.R. Studies of interference in serial verbal reactions. J. Exp. Psychol. 1935, 18, 643. [Google Scholar] [CrossRef]
- Jun, G.; Smitha, K.G. EEG based stress level identification. In Proceedings of the 2016 IEEE International Conference on Systems, Man, and Cybernetics (SMC), Budapest, Hungary, 9–12 October 2016; pp. 003270–003274. [Google Scholar]
- Zhai, J.; Barreto, A. Stress Recognition Using Non-Invasive Technology. Available online: https://www.aaai.org/Papers/FLAIRS/2006/Flairs06-077.pdf (accessed on 18 May 2020).
- Jo, N.Y.; Lee, K.C.; Lee, D.S. Computer-mediated task performance under stress and non-stress conditions: Emphasis on physiological approaches. In Digital Creativity; Springer: Cham, Switzerland, 2013; pp. 15–27. [Google Scholar]
- Smeets, T.; Jelicic, M.; Merckelbach, H. Stress-induced cortisol responses, sex differences, and false recollections in a DRM paradigm. Biol. Psychol. 2006, 72, 164–172. [Google Scholar] [CrossRef]
- Haescher, M.; Matthies, D.J.; Srinivasan, K.; Bieber, G. Mobile assisted living: Smartwatch-based fall risk assessment for elderly people. In Proceedings of the 5th international Workshop on Sensor-Based Activity Recognition and Interaction; ACM: New York, NY, USA, 2018; p. 6. [Google Scholar]
- Gjoreski, H.; Lustrek, M.; Gams, M. Accelerometer placement for posture recognition and fall detection. In Proceedings of the 2011 Seventh International Conference on Intelligent Environments, Nottingham, UK, 25–28 July 2011; pp. 47–54. [Google Scholar]
- Gjoreski, M.; Gjoreski, H.; Luštrek, M.; Gams, M. How accurately can your wrist device recognize daily activities and detect falls? Sensors 2016, 16, 800. [Google Scholar] [CrossRef]
- Katsis, C.D.; Ganiatsas, G.; Fotiadis, D.I. An integrated telemedicine platform for the assessment of affective physiological states. Diagn. Pathol. 2006, 1, 16. [Google Scholar] [CrossRef] [Green Version]
- Betti, S.; Lova, R.M.; Rovini, E.; Acerbi, G.; Santarelli, L.; Cabiati, M.; Del Ry, S.; Cavallo, F. Evaluation of an integrated system of wearable physiological sensors for stress monitoring in working environments by using biological markers. IEEE Trans. Biomed. Eng. 2017, 65, 1748–1758. [Google Scholar] [PubMed]
- Akbar, F.; Mark, G.; Pavlidis, I.; Gutierrez-Osuna, R. An empirical study comparing unobtrusive physiological sensors for stress detection in computer work. Sensors 2019, 19, 3766. [Google Scholar] [CrossRef] [PubMed] [Green Version]
- Zhang, H.; Zhang, H.; Pirbhulal, S.; Wu, W.; Albuquerque, V.H.C.D. Active Balancing Mechanism for Imbalanced Medical Data in Deep Learning–Based Classification Models. ACM Trans. Multimed. Comput. Commun. Appl. 2020, 16, 1–15. [Google Scholar] [CrossRef] [Green Version]
- Sun, X.; Wang, S.; Xia, Y.; Zheng, W. Predictive-Trend-Aware Composition of Web Services with Time-Varying Quality-of-Service. IEEE Access 2019, 8, 1910–1921. [Google Scholar] [CrossRef]
- Wu, W.; Pirbhulal, S.; Zhang, H.; Mukhopadhyay, S.C. Quantitative assessment for self-tracking of acute stress based on triangulation principle in a wearable sensor system. IEEE J. Biomed. Health Inform. 2018, 23, 703–713. [Google Scholar] [CrossRef] [PubMed]
- Smith, L.; Hamer, M.; Ucci, M.; Marmot, A.; Gardner, B.; Sawyer, A.; Wardle, J.; Fisher, A. Weekday and weekend patterns of objectively measured sitting, standing, and stepping in a sample of office-based workers: The active buildings study. BMC Public Health 2015, 15, 9. [Google Scholar] [CrossRef] [Green Version]
- Haescher, M.; Trimpop, J.; Matthies, D.J.; Bieber, G.; Urban, B.; Kirste, T. aHead: Considering the head position in a multi-sensory setup of wearables to recognize everyday activities with intelligent sensor fusions. In International Conference on Human-Computer Interaction; Springer: Cham, Switzerland, 2015; pp. 741–752. [Google Scholar]


| Feature Model | A1+B2+C3+D1 | C3+A1 | ALL | C3 | A1 | B2 | D1 | C1 | B1 | D2 | A2 | C2 | A3 |
|---|---|---|---|---|---|---|---|---|---|---|---|---|---|
| Accuracy [%] | 85.32 | 85.0 | 83.9 | 83.1 | 79.8 | 78.8 | 69.3 | 67.3 | 66.6 | 65.3 | 62.5 | 52.8 | 50.7 |
| SD [%] | 8.1 | 9.7 | 12.01 | 11.9 | 11.1 | 6.7 | 7.9 | 8.0 | 11.3 | 6.7 | 11.4 | 10.6 | 9.25 |
| Distinguishablity [p] | <0.0001 | <0.0001 | <0.0001 | <0.0001 | <0.0001 | <0.0001 | <0.0001 | <0.0001 | <0.0001 | <0.0001 | <0.0001 | <0.001 | =0.2 |
| Feature Model | A1+B2 +C3+D1 | C3+A1 | ALL | C3 | A1 | B2 | D1 |
|---|---|---|---|---|---|---|---|
| Accuracy [%] | 87.45 | 87.3 | 85.6 | 86.7 | 79.3 | 79.6 | 66.5 |
| SD [%] | 8.5 | 9.62 | 12.0 | 10.0 | 8.5 | 6.5 | 7.6 |
| Participant No: | P1 | P2 | P3 | P4 | P5 | P6 | P7 | P8 | P9 | P10 |
|---|---|---|---|---|---|---|---|---|---|---|
| Sitting time [%] | 85.7 | 76.5 | 76.3 | 73.9 | 88.4 | 86.7 | 70.6 | 75.1 | 83.8 | 78.2 |
| Level of Stress > 4 | Level of Stress < 4 | p | t | |
|---|---|---|---|---|
| Level of Pleasantness | M = 3.8, SD = 1.4 | M = 5.2, SD = 0.9 | <0.05 | 4.10 |
| Level of Energy | M = 4.9, SD = 1.1 | M = 4.3, SD = 1.4 | >0.05 | 1.64 |
| Task Load | M = 62.3, SD = 8.6 | M = 42.4, SD = 11.4 | <0.05 | 7.02 |
| Parti. No: | Stress | Relax | p | t |
|---|---|---|---|---|
| P1 | 1.99 × 10 | −1.61 × 10 | >0.05 | 0.08 |
| P2 | - | −3.58 × 10 | - | - |
| P3 | 5.16 × 10 | −3.93 × 10 | >0.05 | 0.02 |
| P4 | 2.91 × 10 | −9.69 × 10 | >0.05 | 0.17 |
| P5 | 7.04 × 10 | −2.38 × 10 | >0.05 | 0.15 |
| P6 | 2.95 × 10 | −6.81 × 10 | >0.05 | 0.38 |
| P7 | - | 9.03 × 10 | - | - |
| P8 | - | −5.77 × 10 | - | - |
| P9 | - | 4.48 × 10 | - | - |
| P10 | −8.08 × 10 | −3.52 × 10 | >0.05 | 0.14 |
© 2020 by the authors. Licensee MDPI, Basel, Switzerland. This article is an open access article distributed under the terms and conditions of the Creative Commons Attribution (CC BY) license (http://creativecommons.org/licenses/by/4.0/).
Share and Cite
Elvitigala, D.S.; Matthies, D.J.C.; Nanayakkara, S. StressFoot: Uncovering the Potential of the Foot for Acute Stress Sensing in Sitting Posture. Sensors 2020, 20, 2882. https://doi.org/10.3390/s20102882
Elvitigala DS, Matthies DJC, Nanayakkara S. StressFoot: Uncovering the Potential of the Foot for Acute Stress Sensing in Sitting Posture. Sensors. 2020; 20(10):2882. https://doi.org/10.3390/s20102882
Chicago/Turabian StyleElvitigala, Don Samitha, Denys J. C. Matthies, and Suranga Nanayakkara. 2020. "StressFoot: Uncovering the Potential of the Foot for Acute Stress Sensing in Sitting Posture" Sensors 20, no. 10: 2882. https://doi.org/10.3390/s20102882