Easing Power Consumption of Wearable Activity Monitoring with Change Point Detection


Abstract
:1. Introduction
2. Related Work
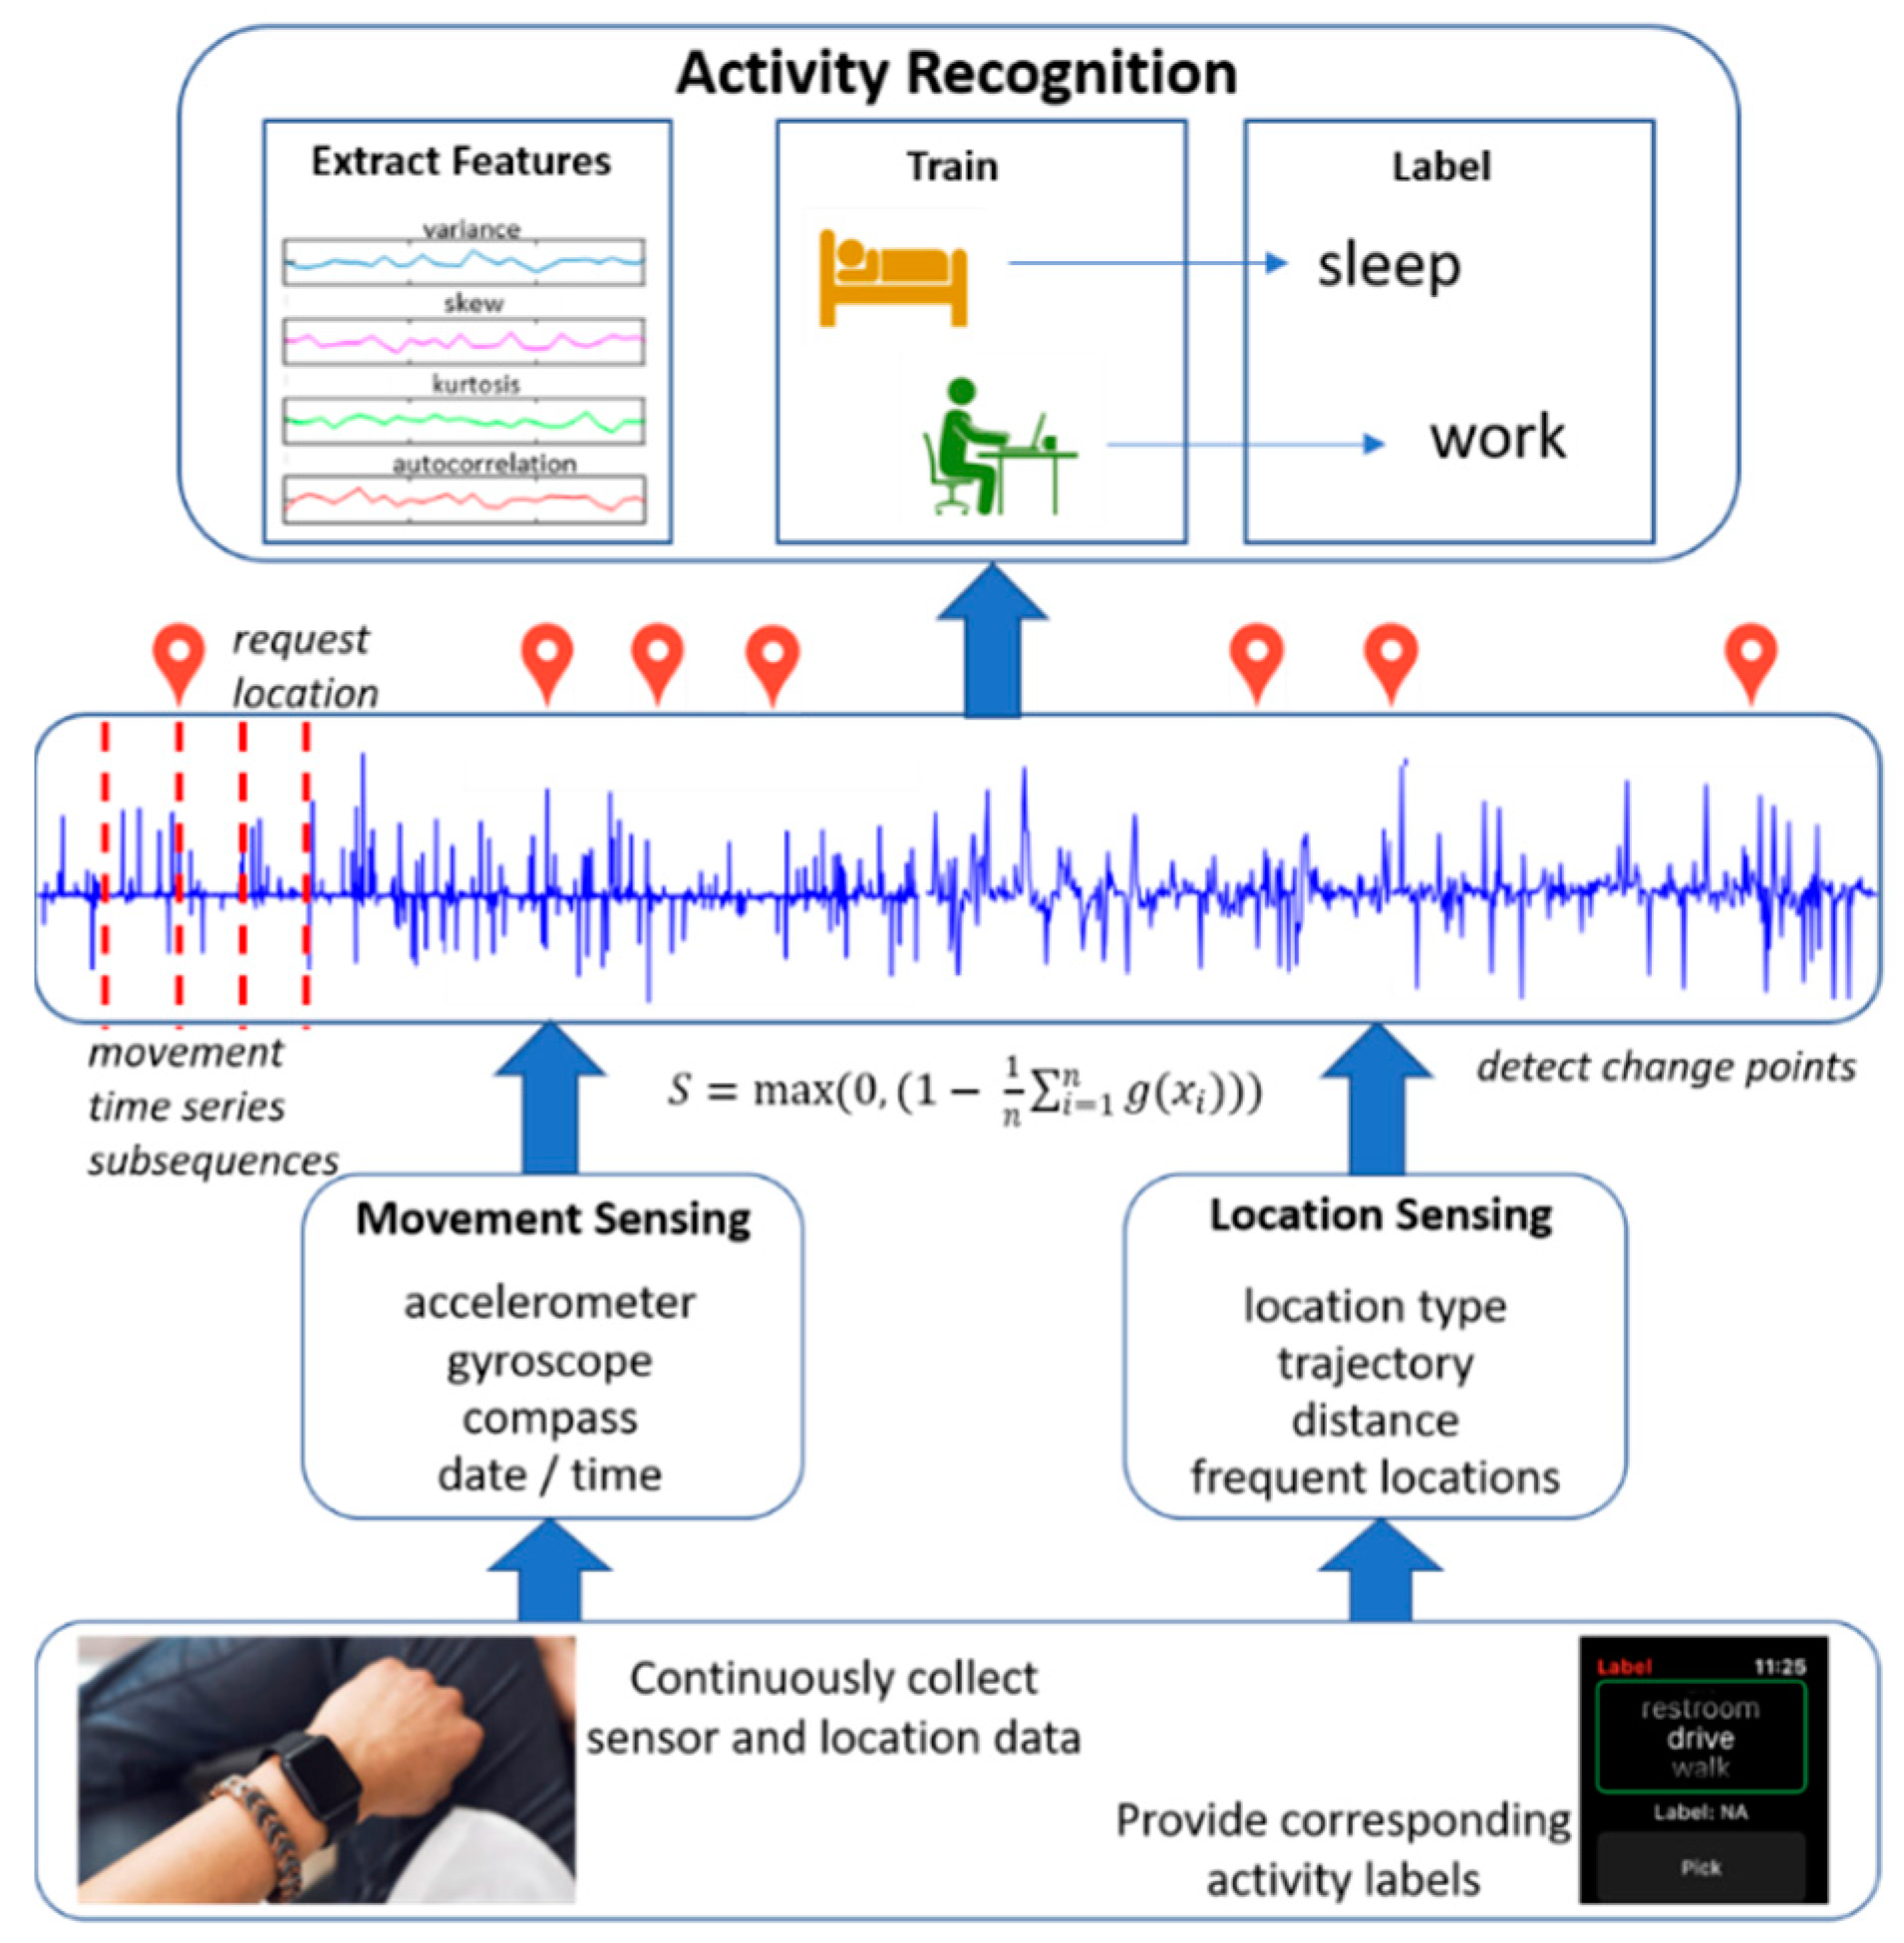
3. CPAM
3.1. Monitoring Complex Activities
3.2. Real-Time Activity Recognition
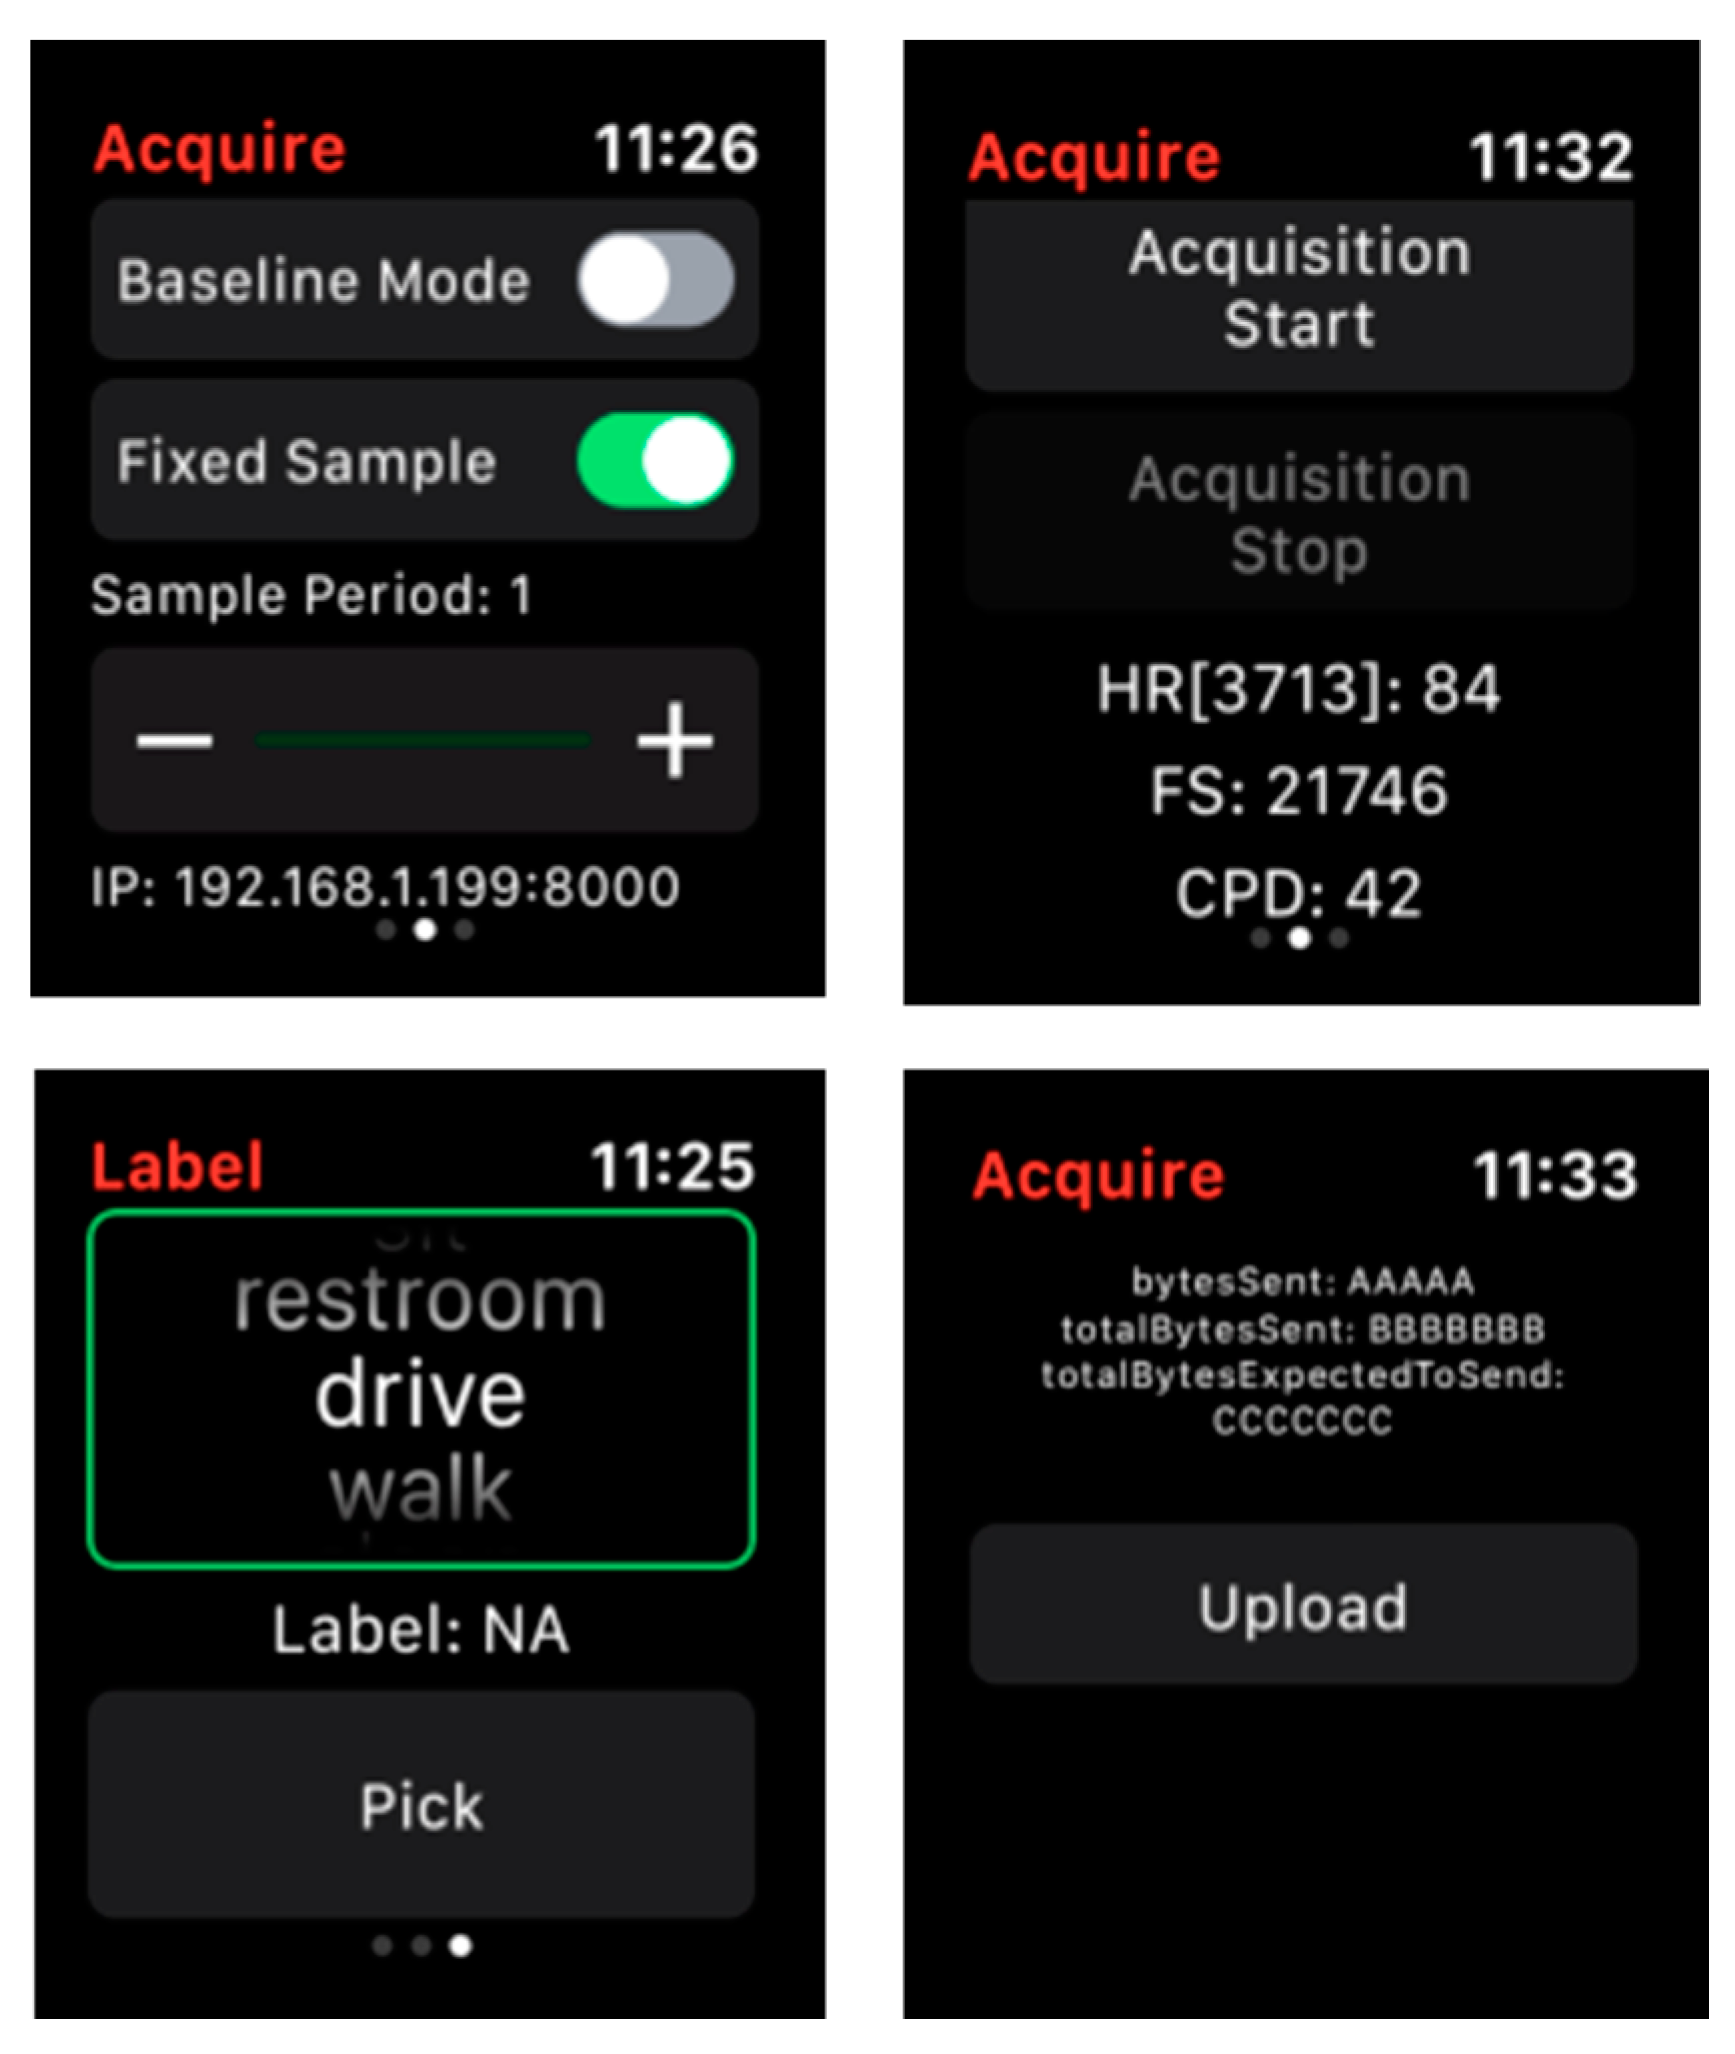
3.3. App Design
3.4. SEP Change Point Detection
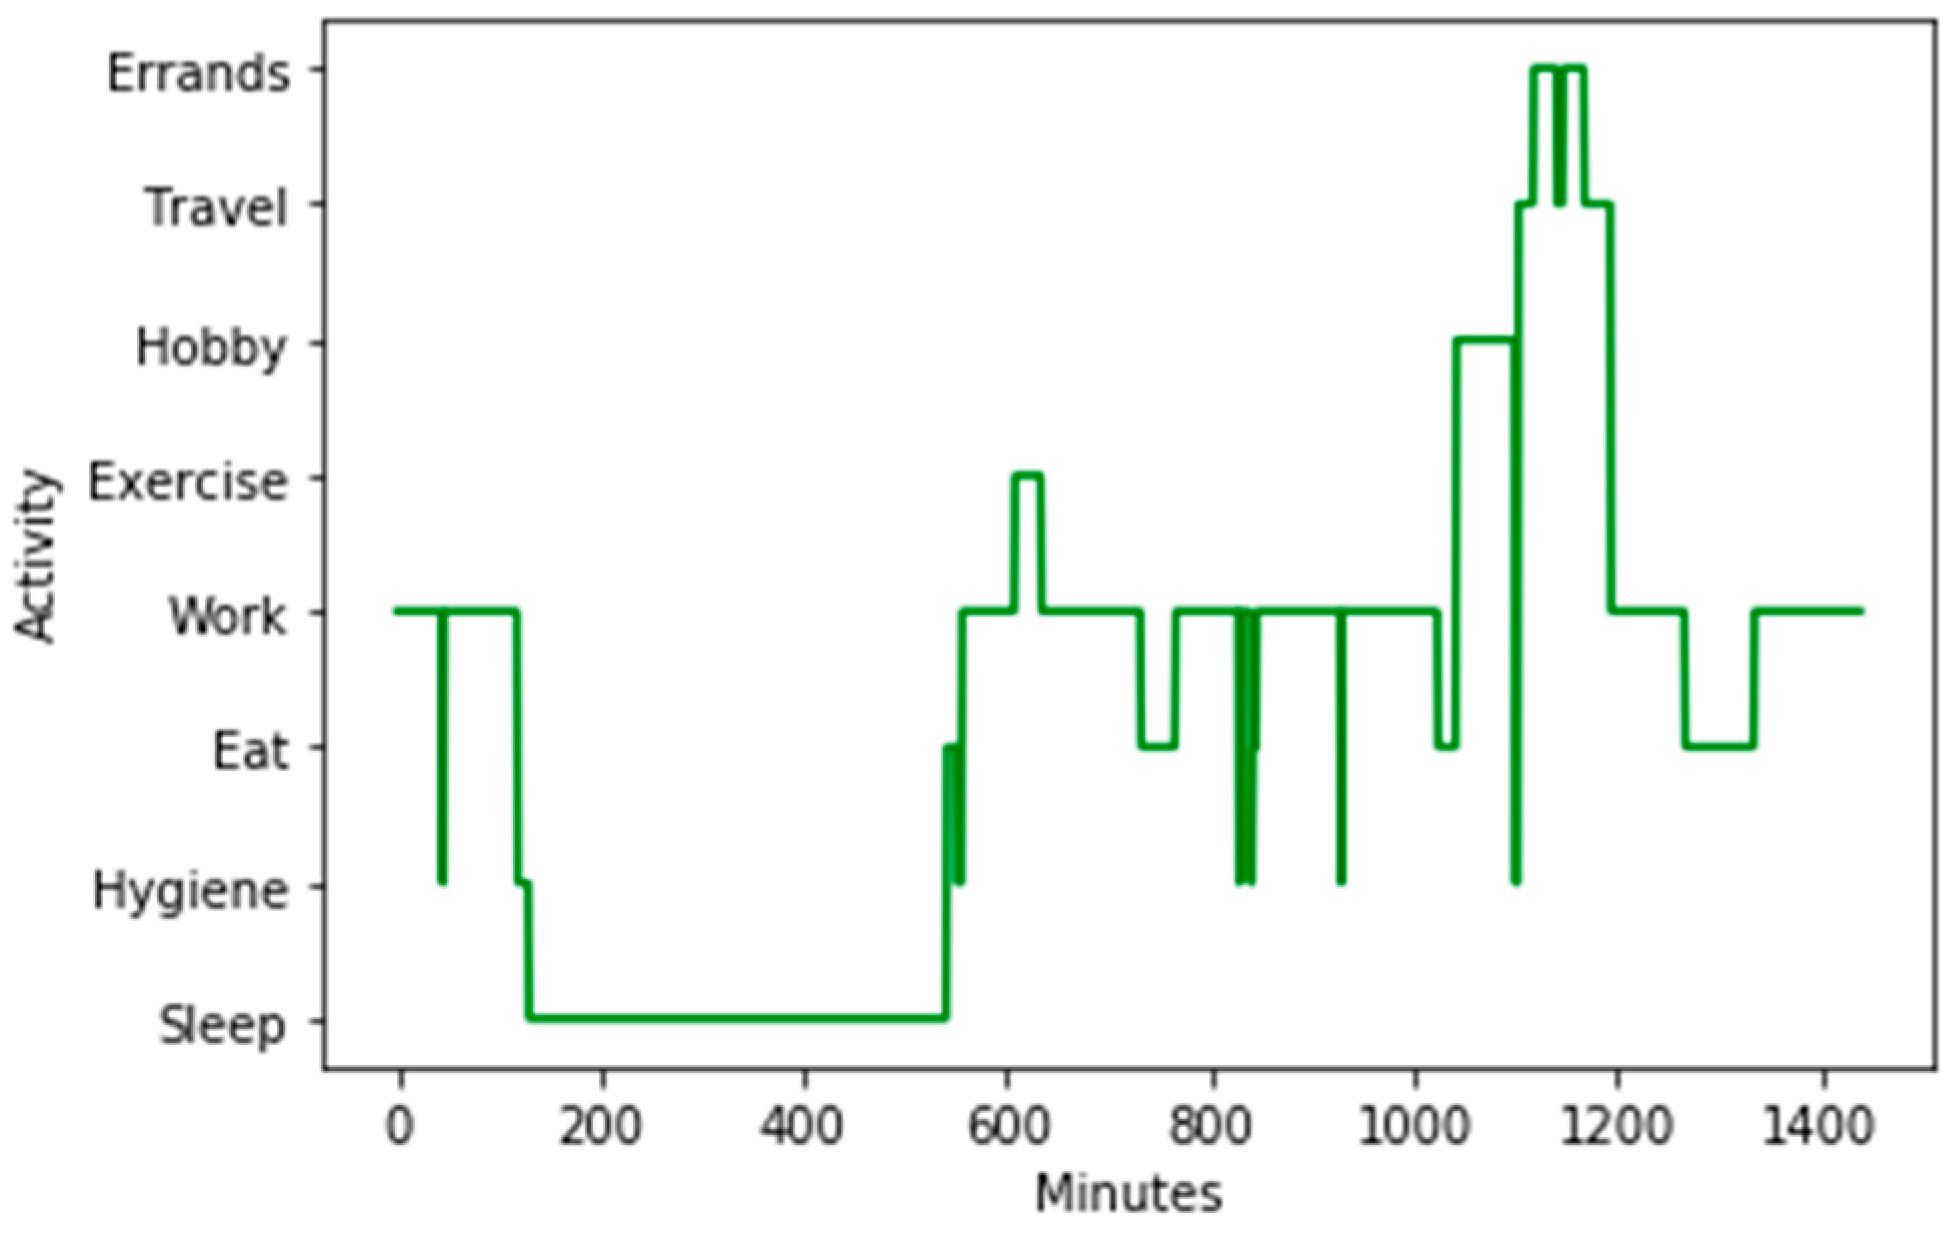
4. Experimental Results
- Can SEP accurately find change points in smartwatch sensor data that represent activity transitions?
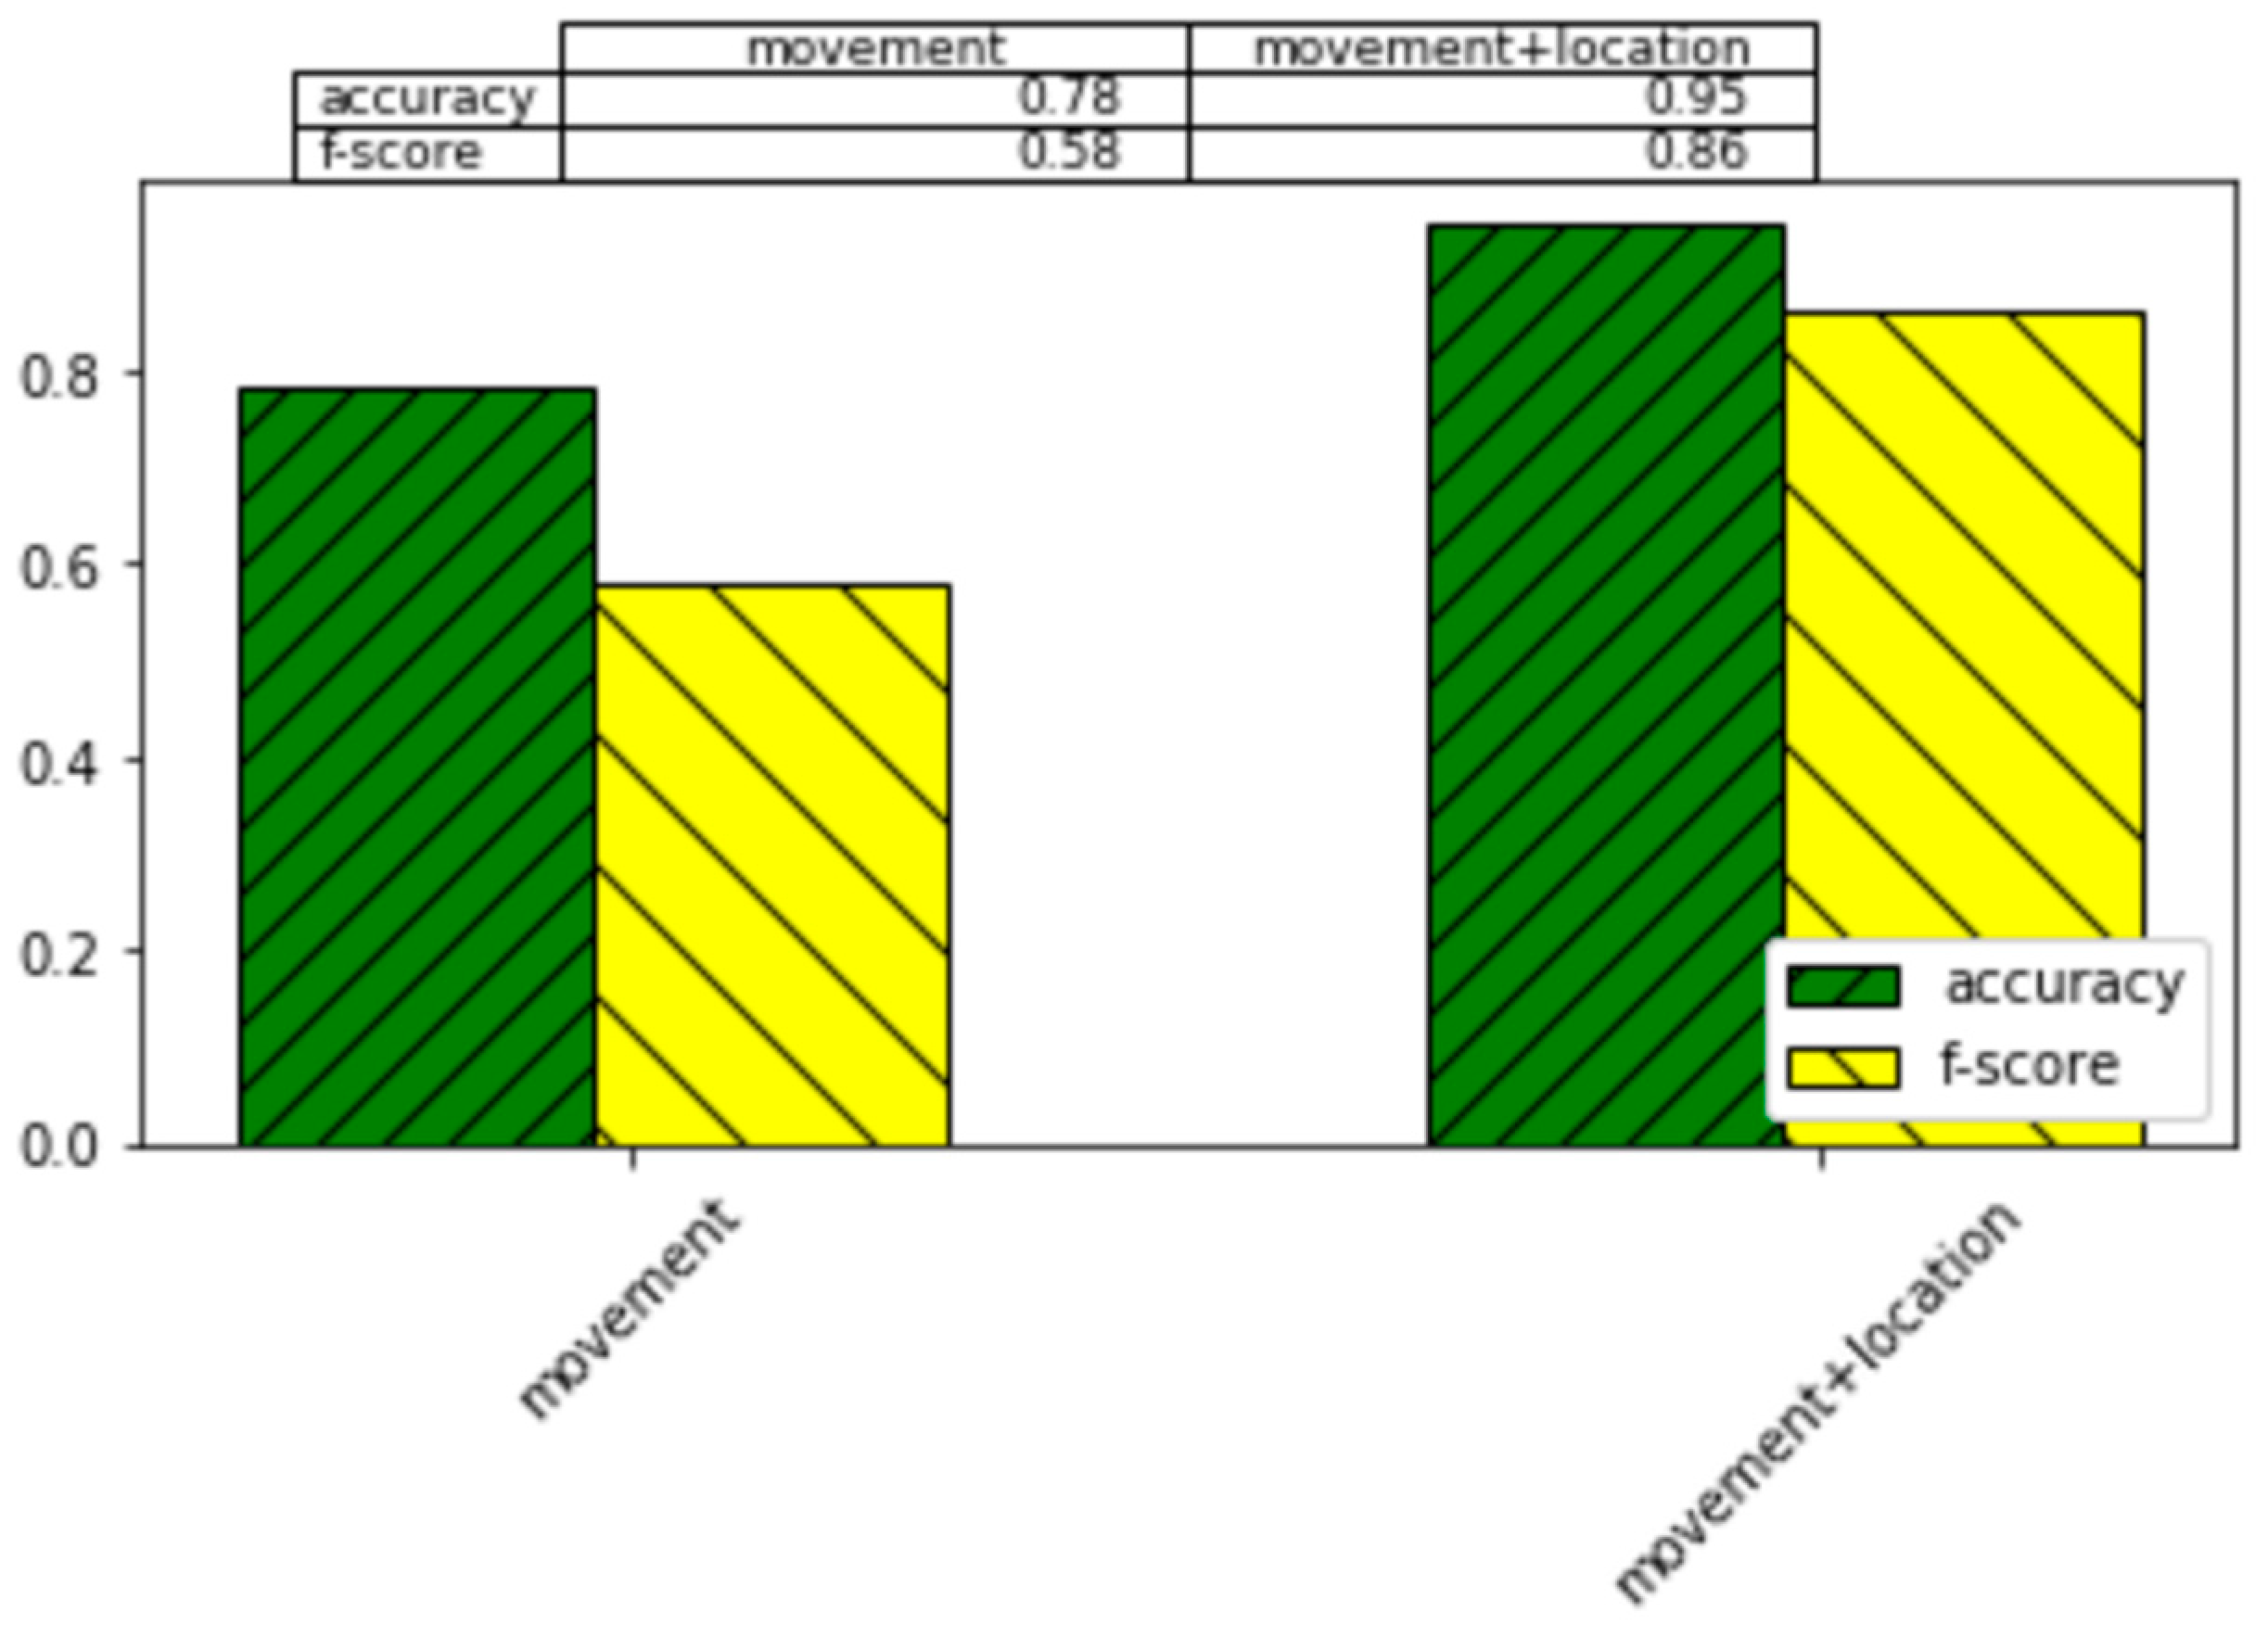
- Are location data essential for recognition of complex activities? To answer this question, we will compare activity recognition performance using only location data, using only movement (non-location) data, and using a combination of data sources.
- How does CPAM compare with baseline methods for activity recognition performance?
- How does CPAM compare with baseline methods for battery consumption?
- Can CPD-based activity segmentation and activity recognition be used to infer location information for use with other context-aware applications?
4.1. Experimental Conditions
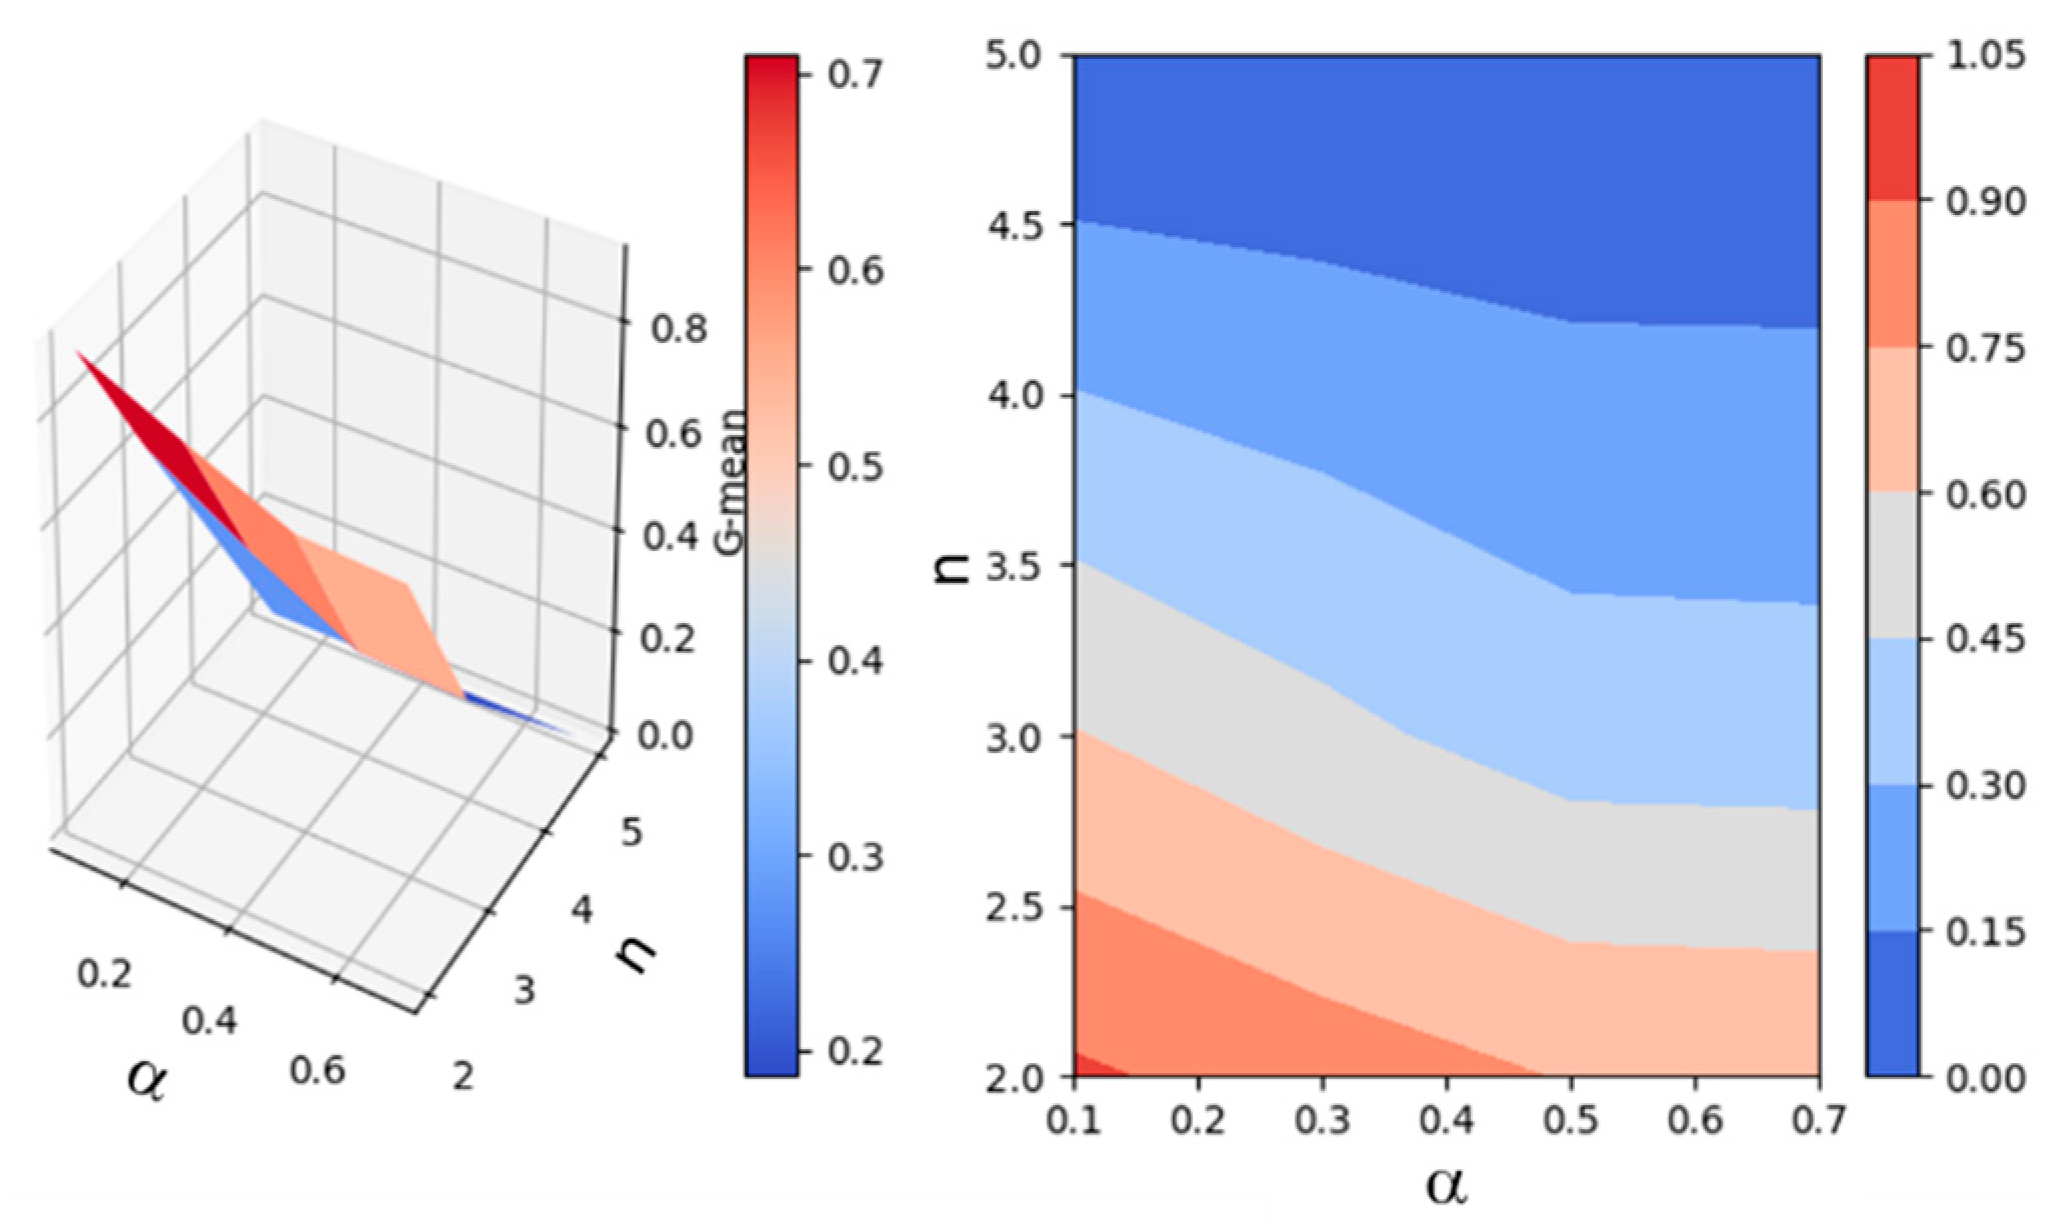
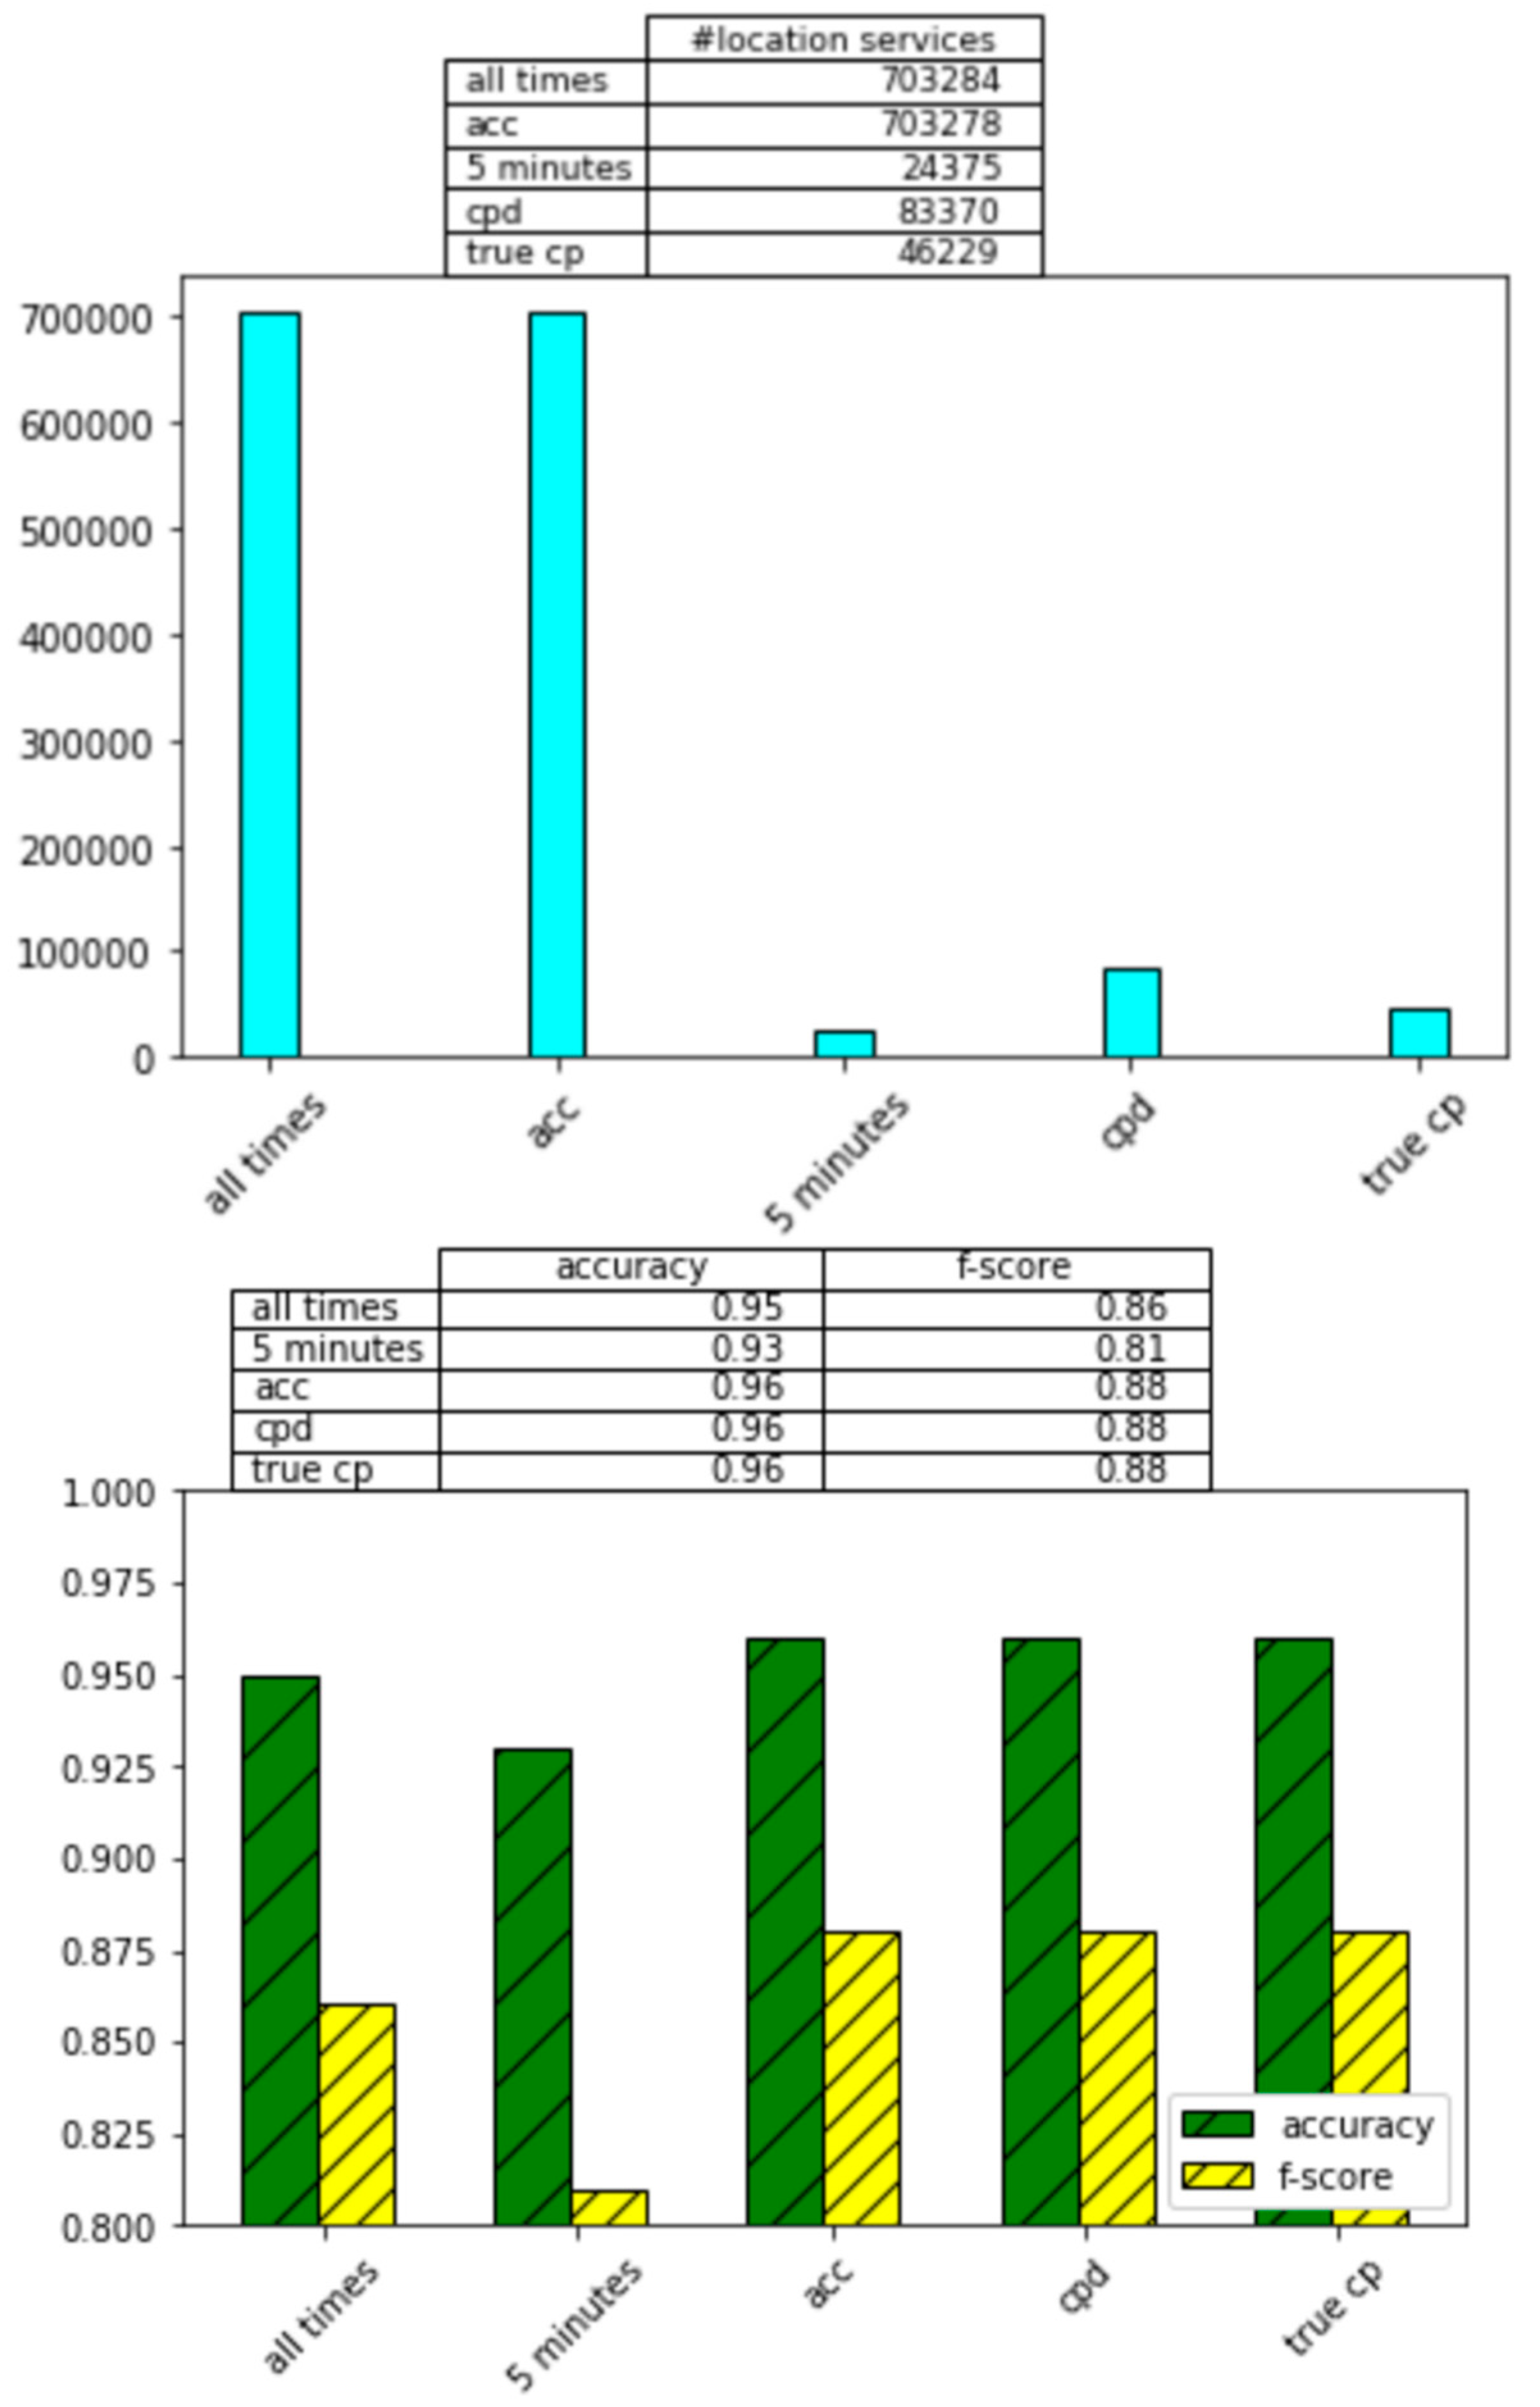
4.2. Analysis of SEP for Smartwatch Data
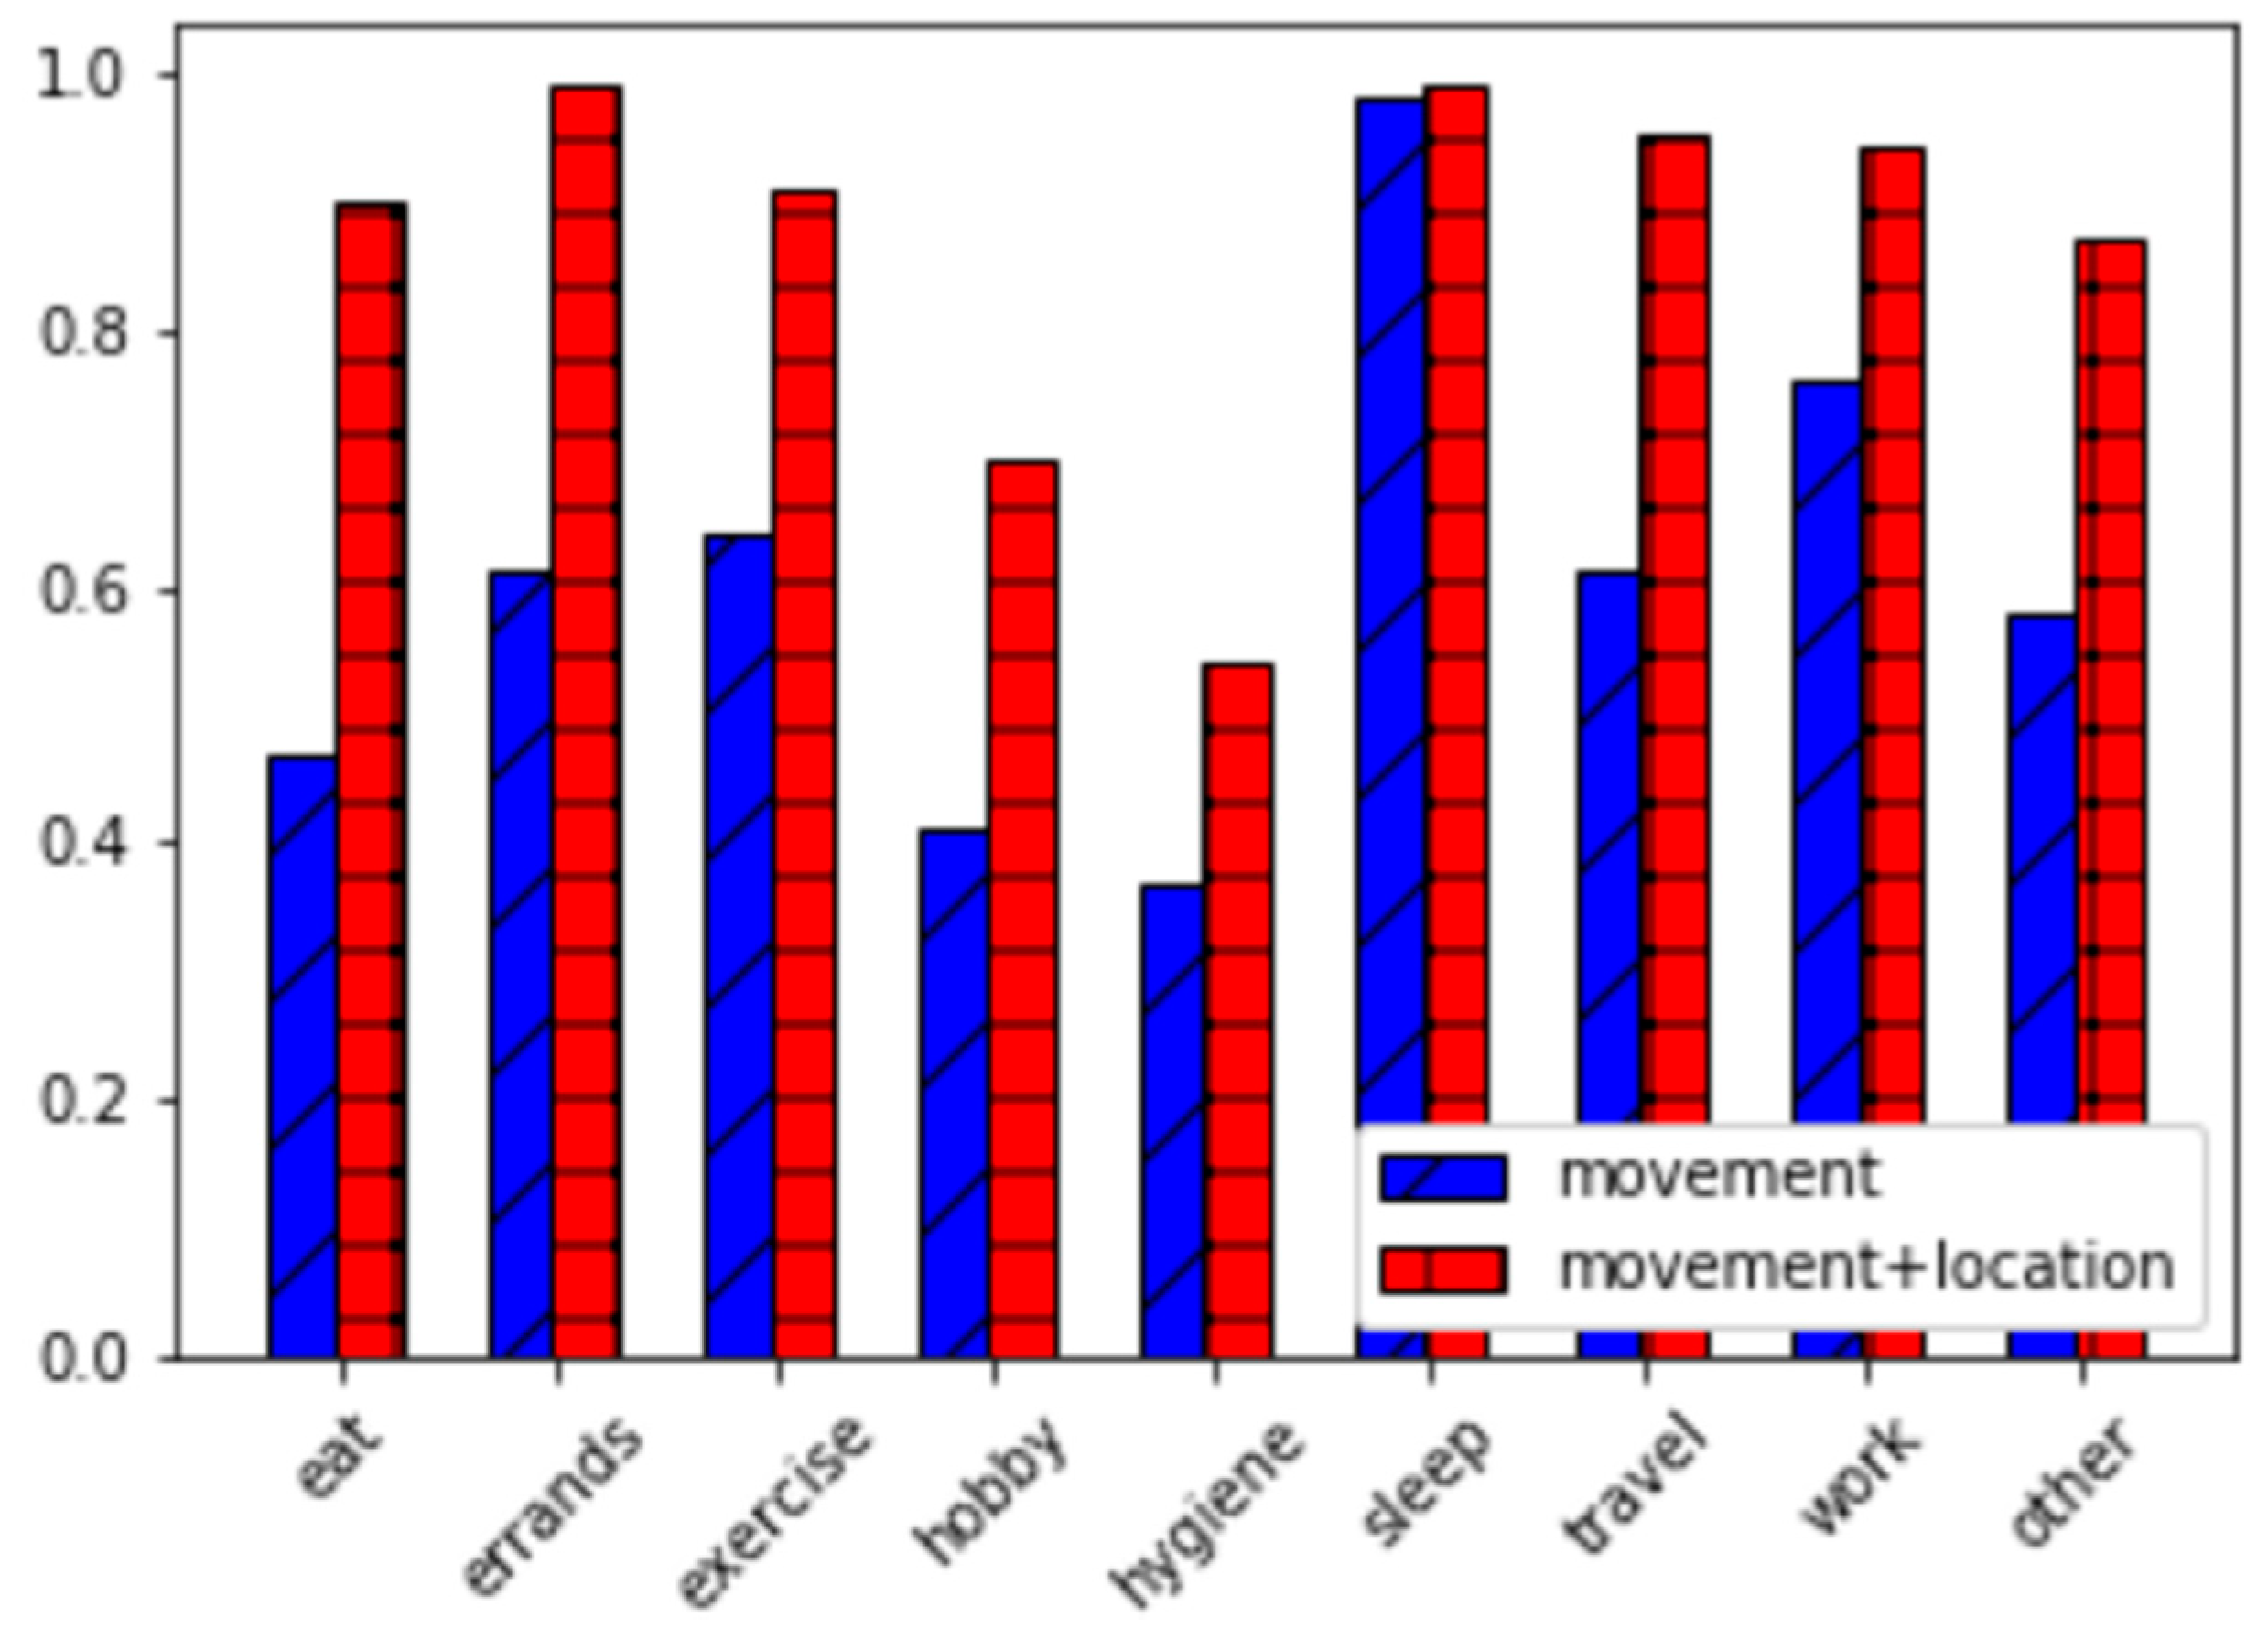
4.3. Recognition Based on Movement and Location
4.4. Recognition Comparison with Baseline Energy-Reduction Methods
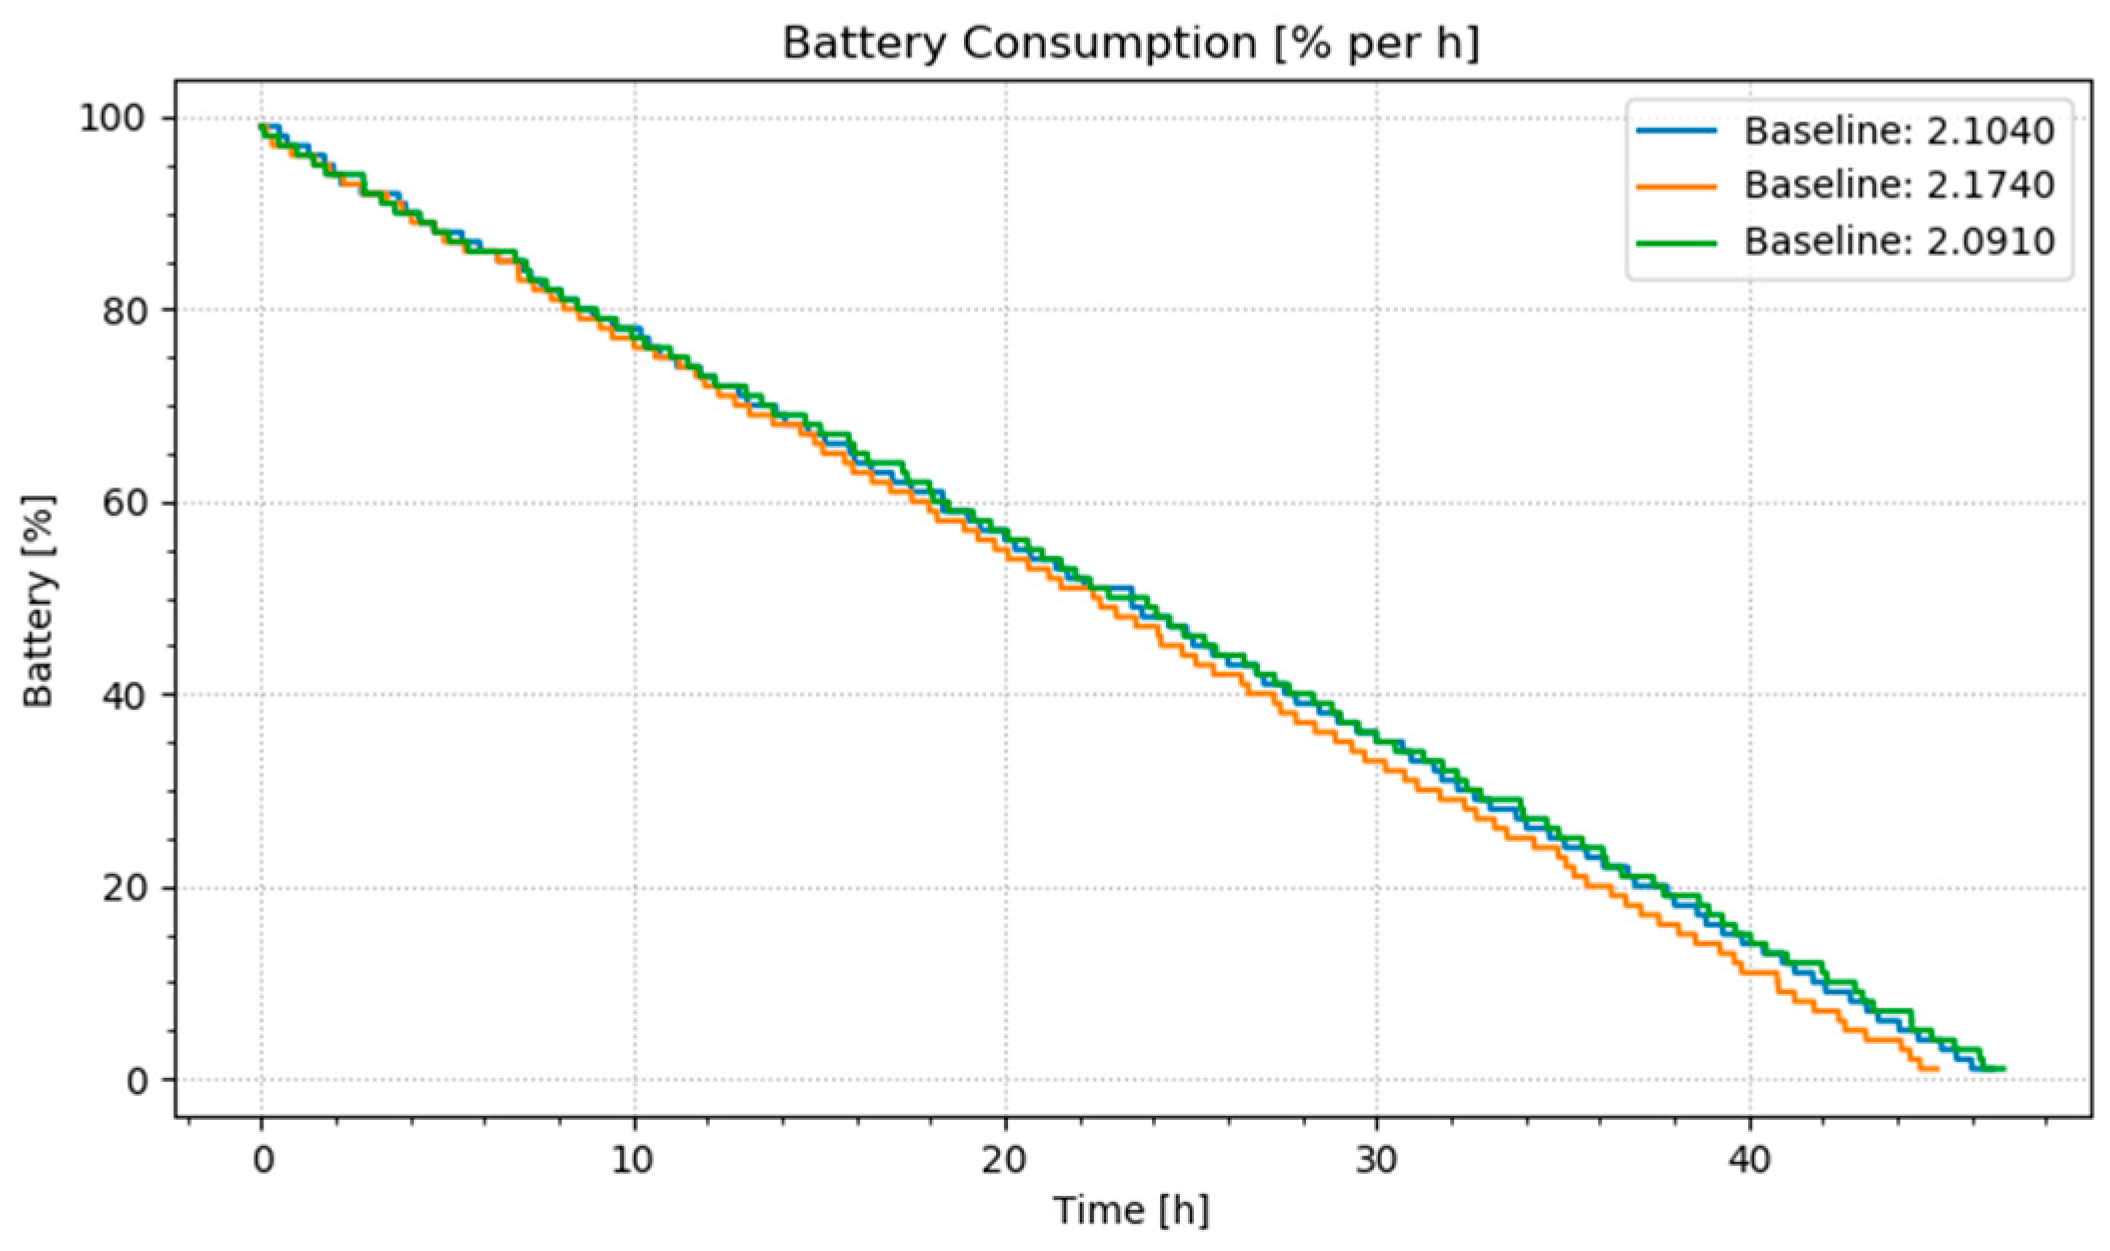
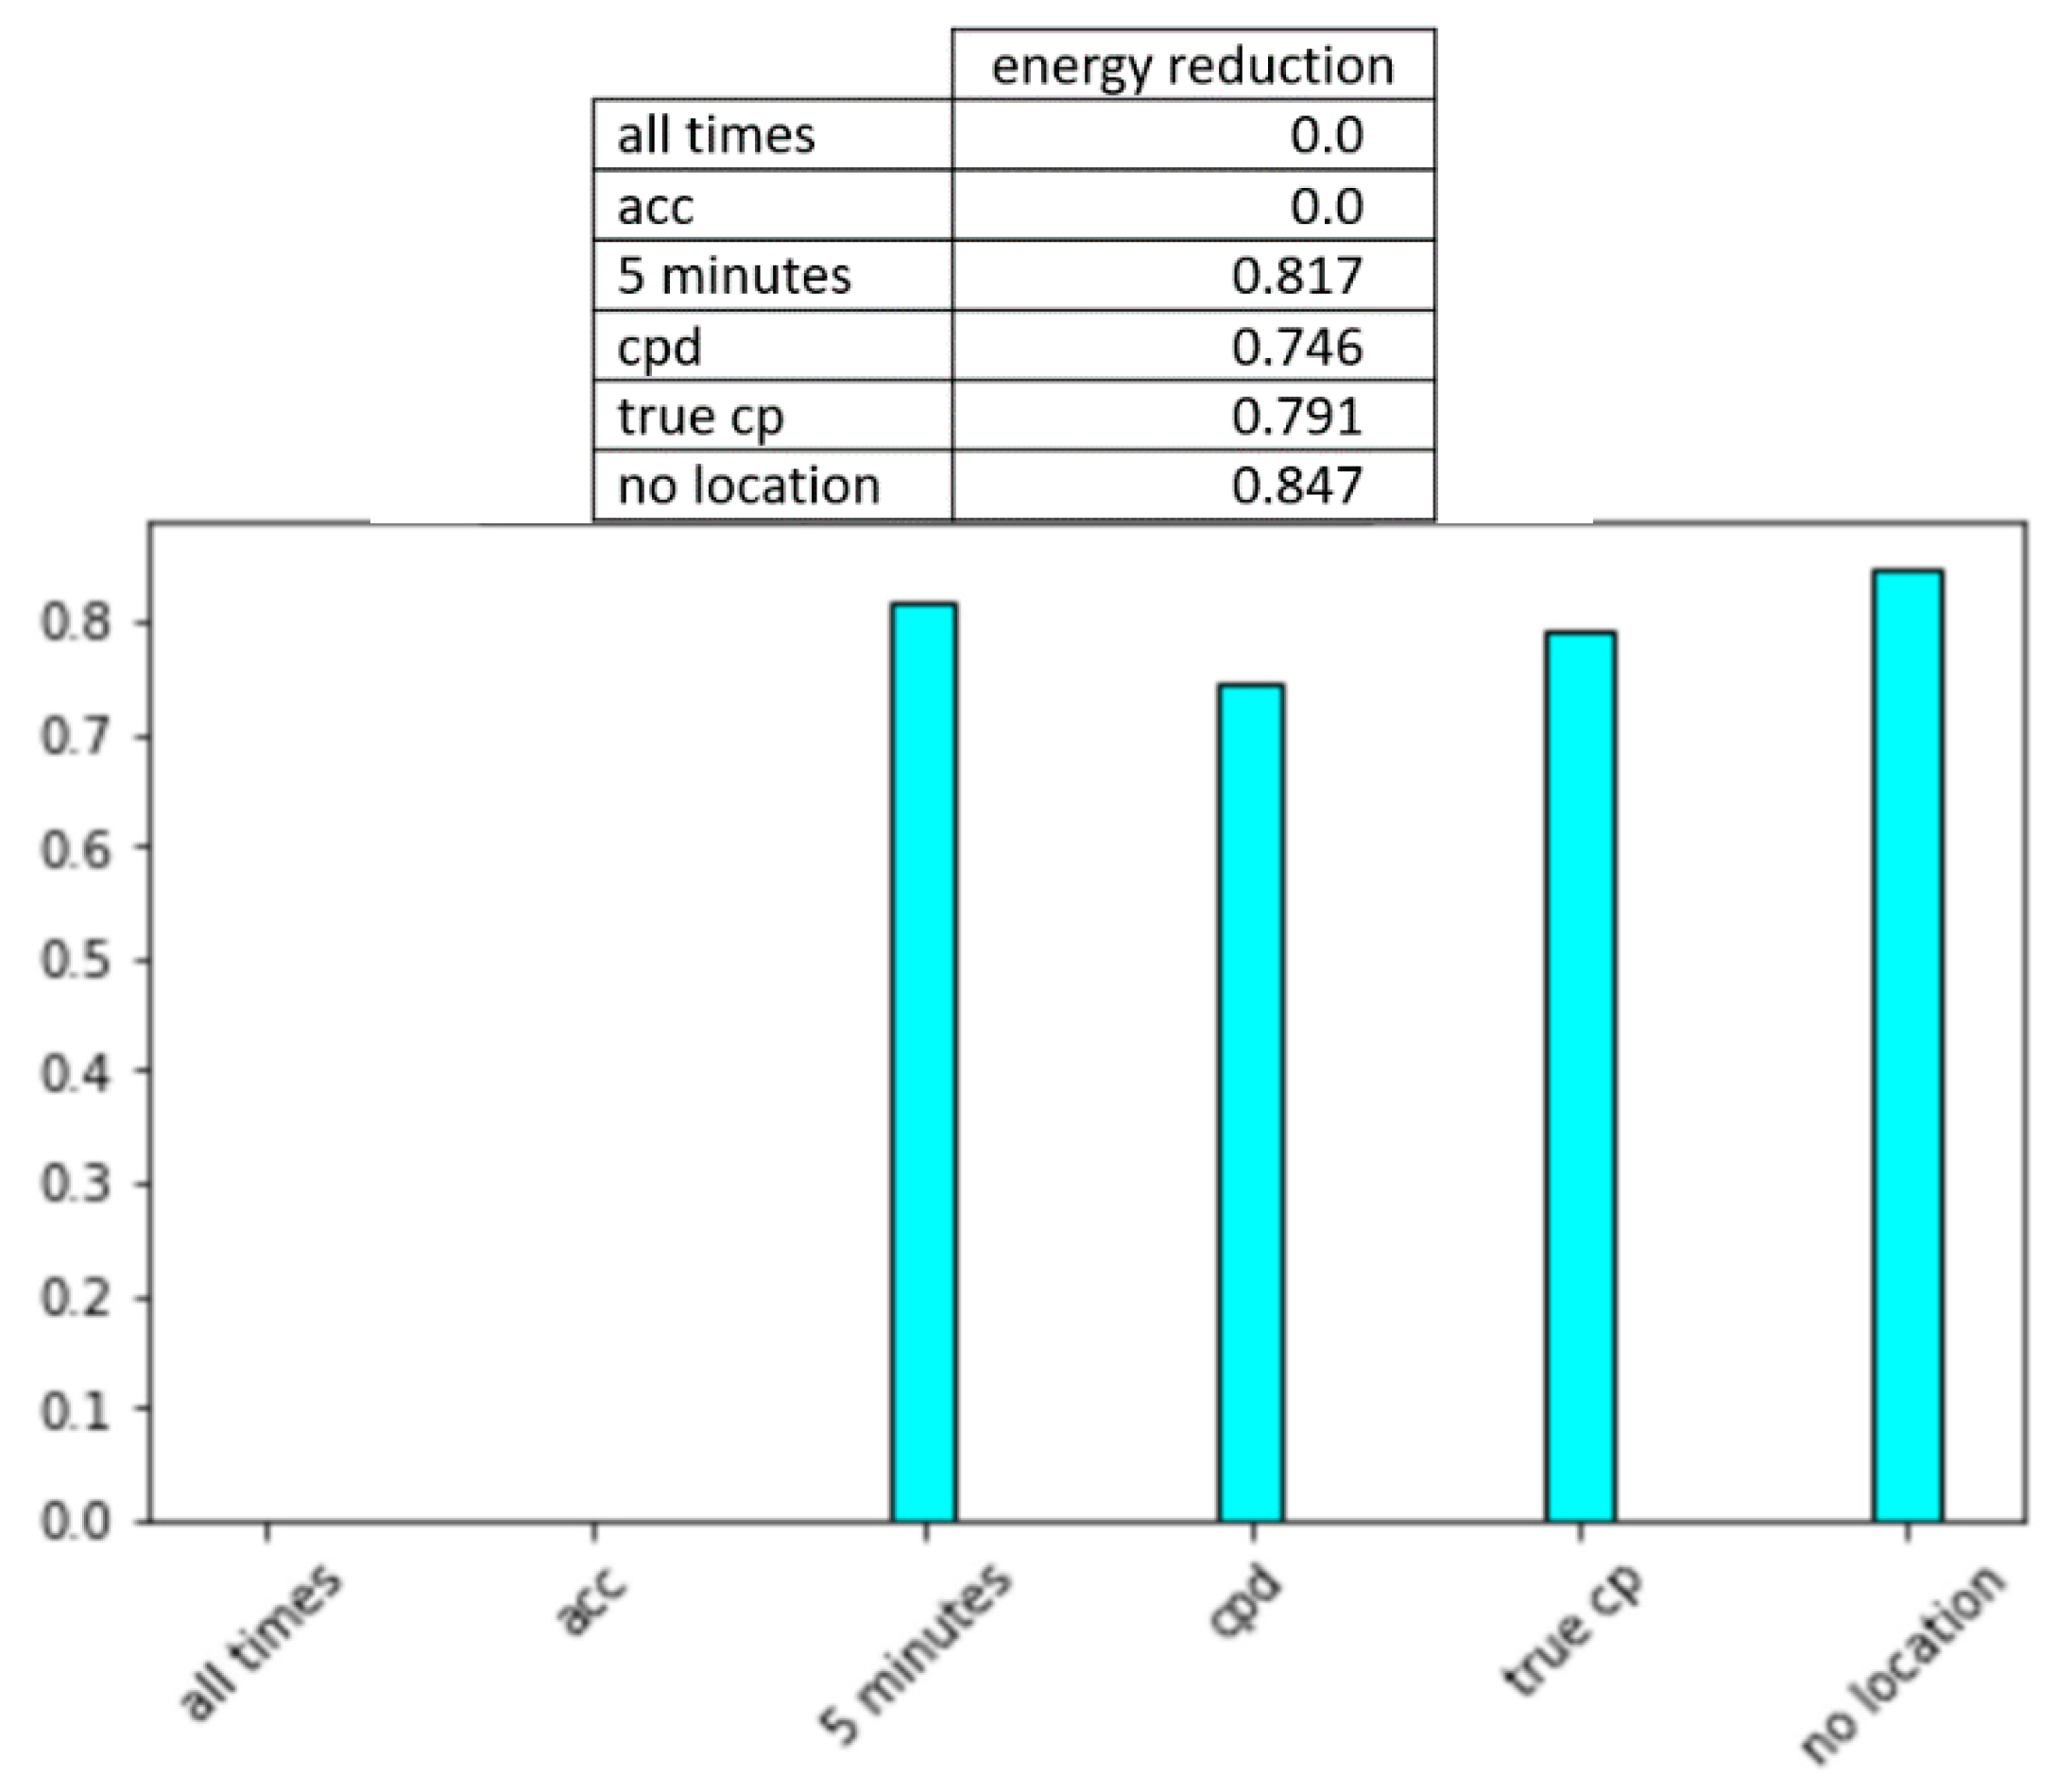
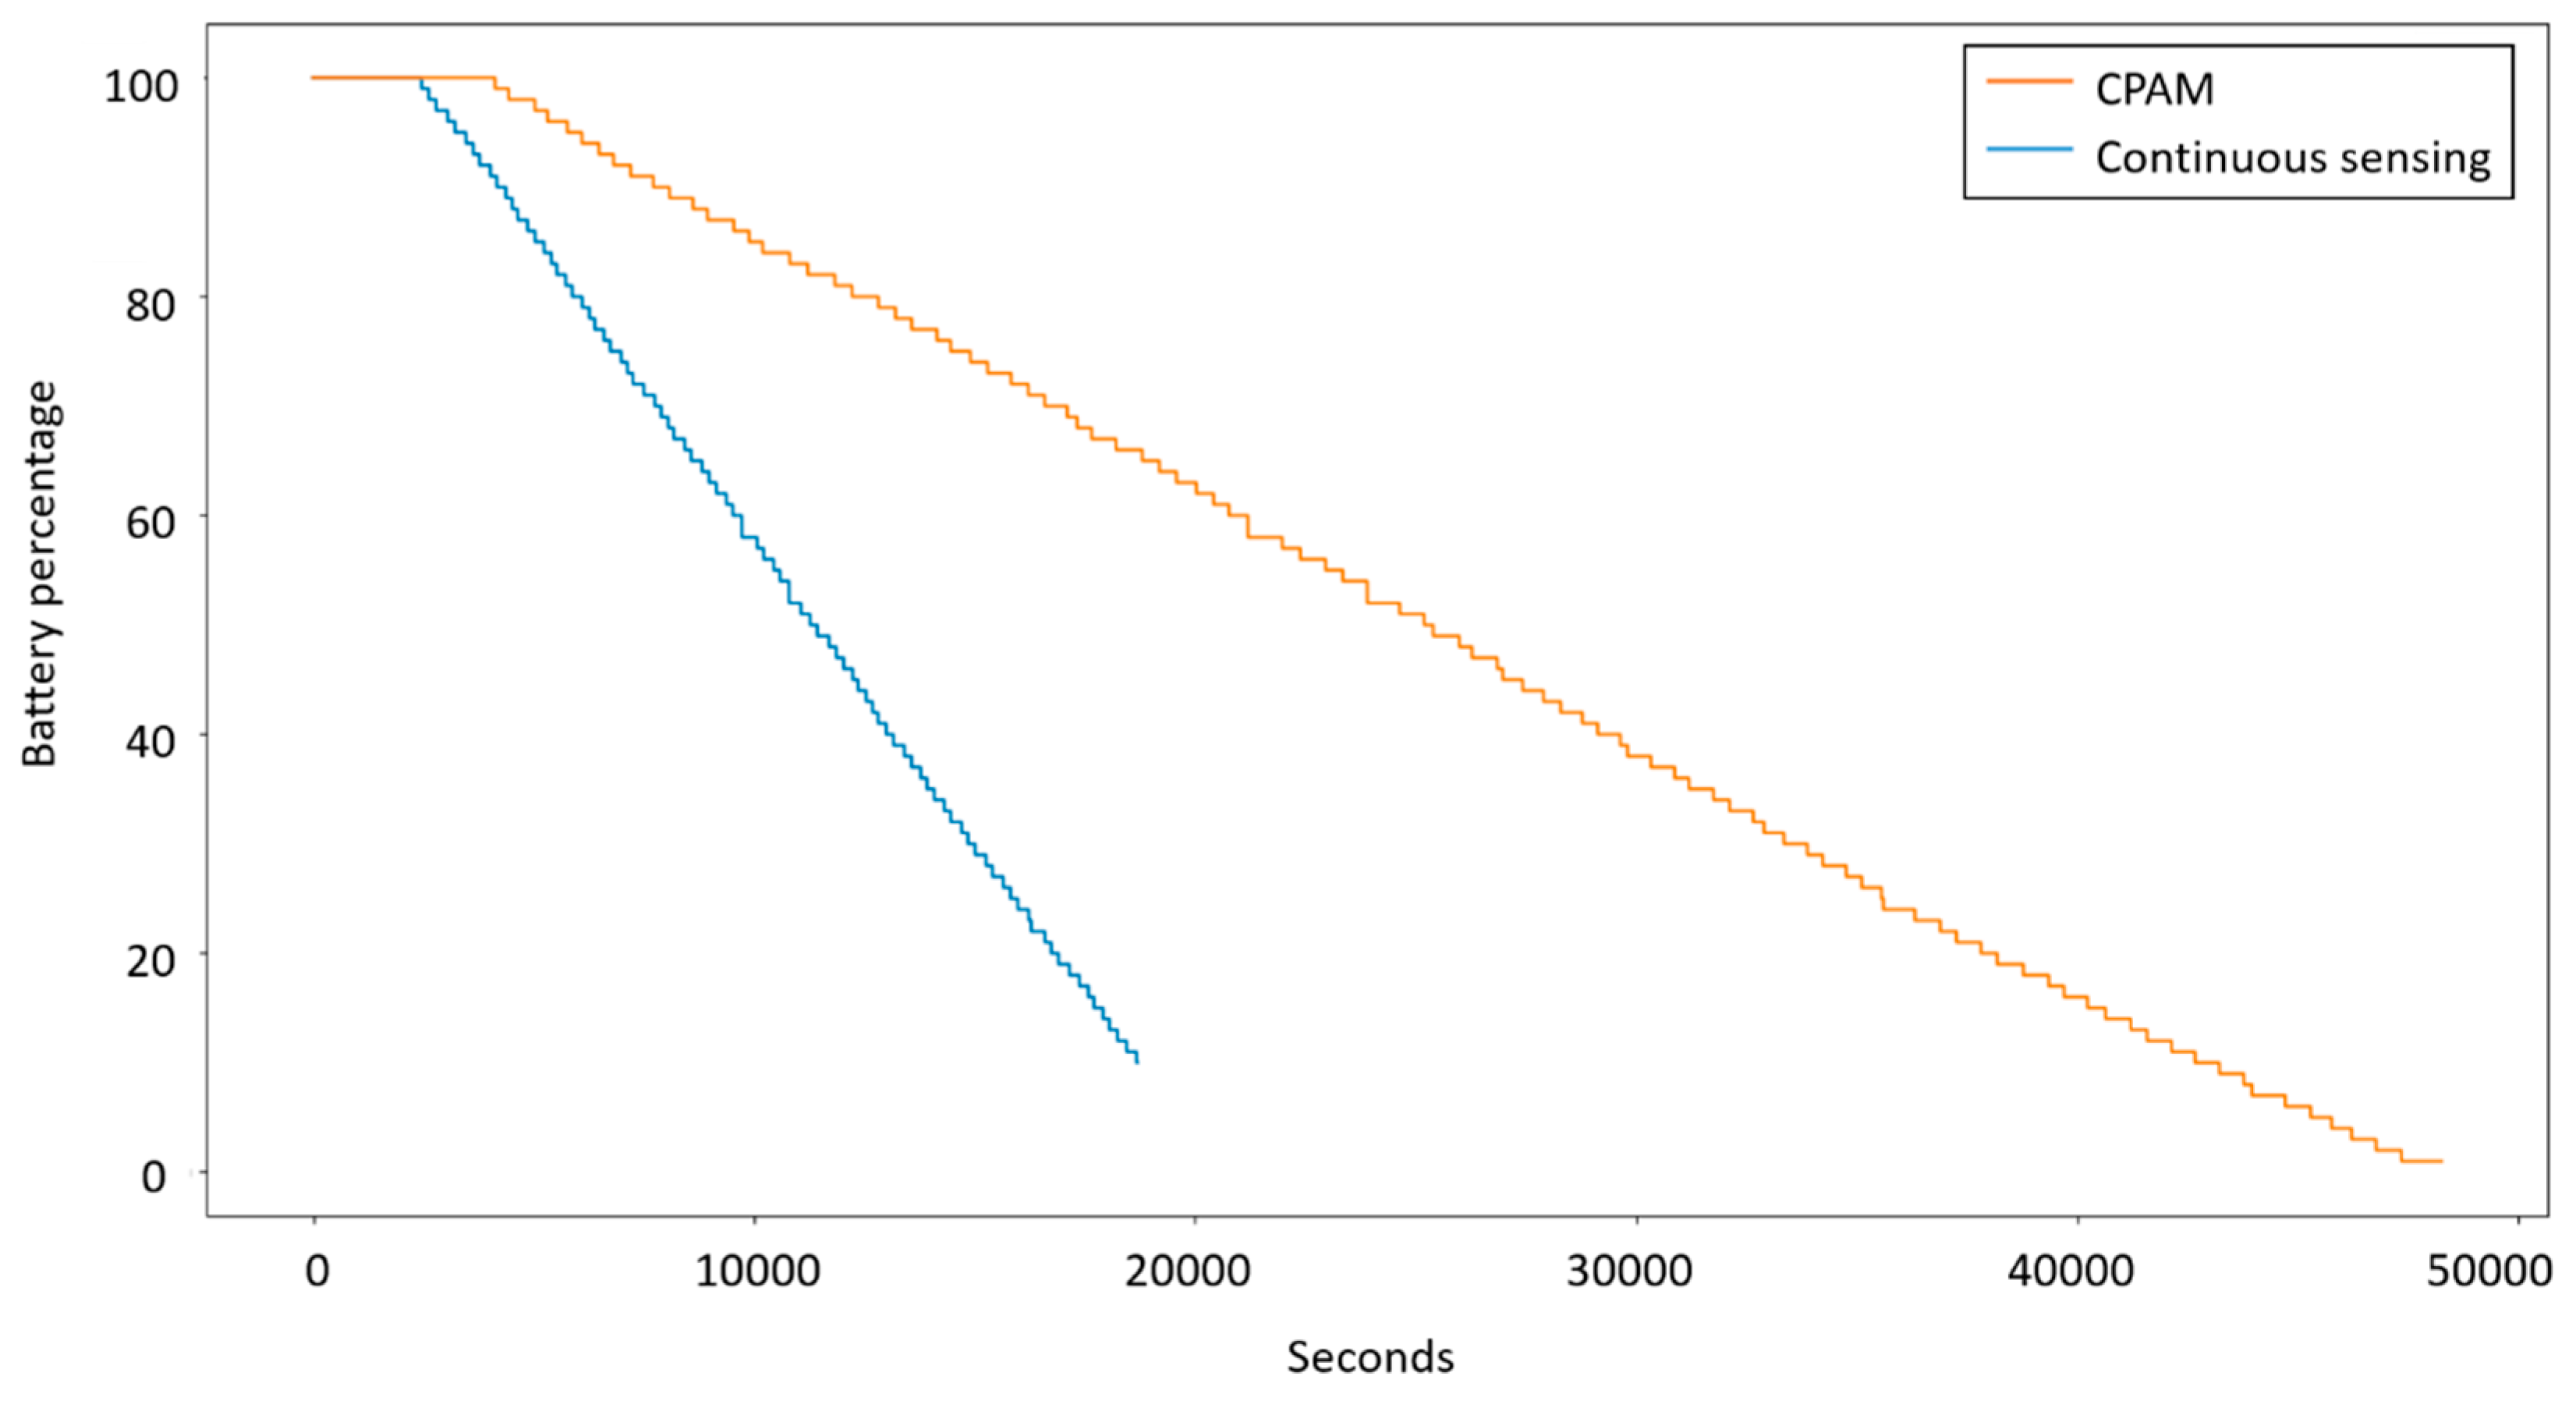
4.5. Energy Reduction
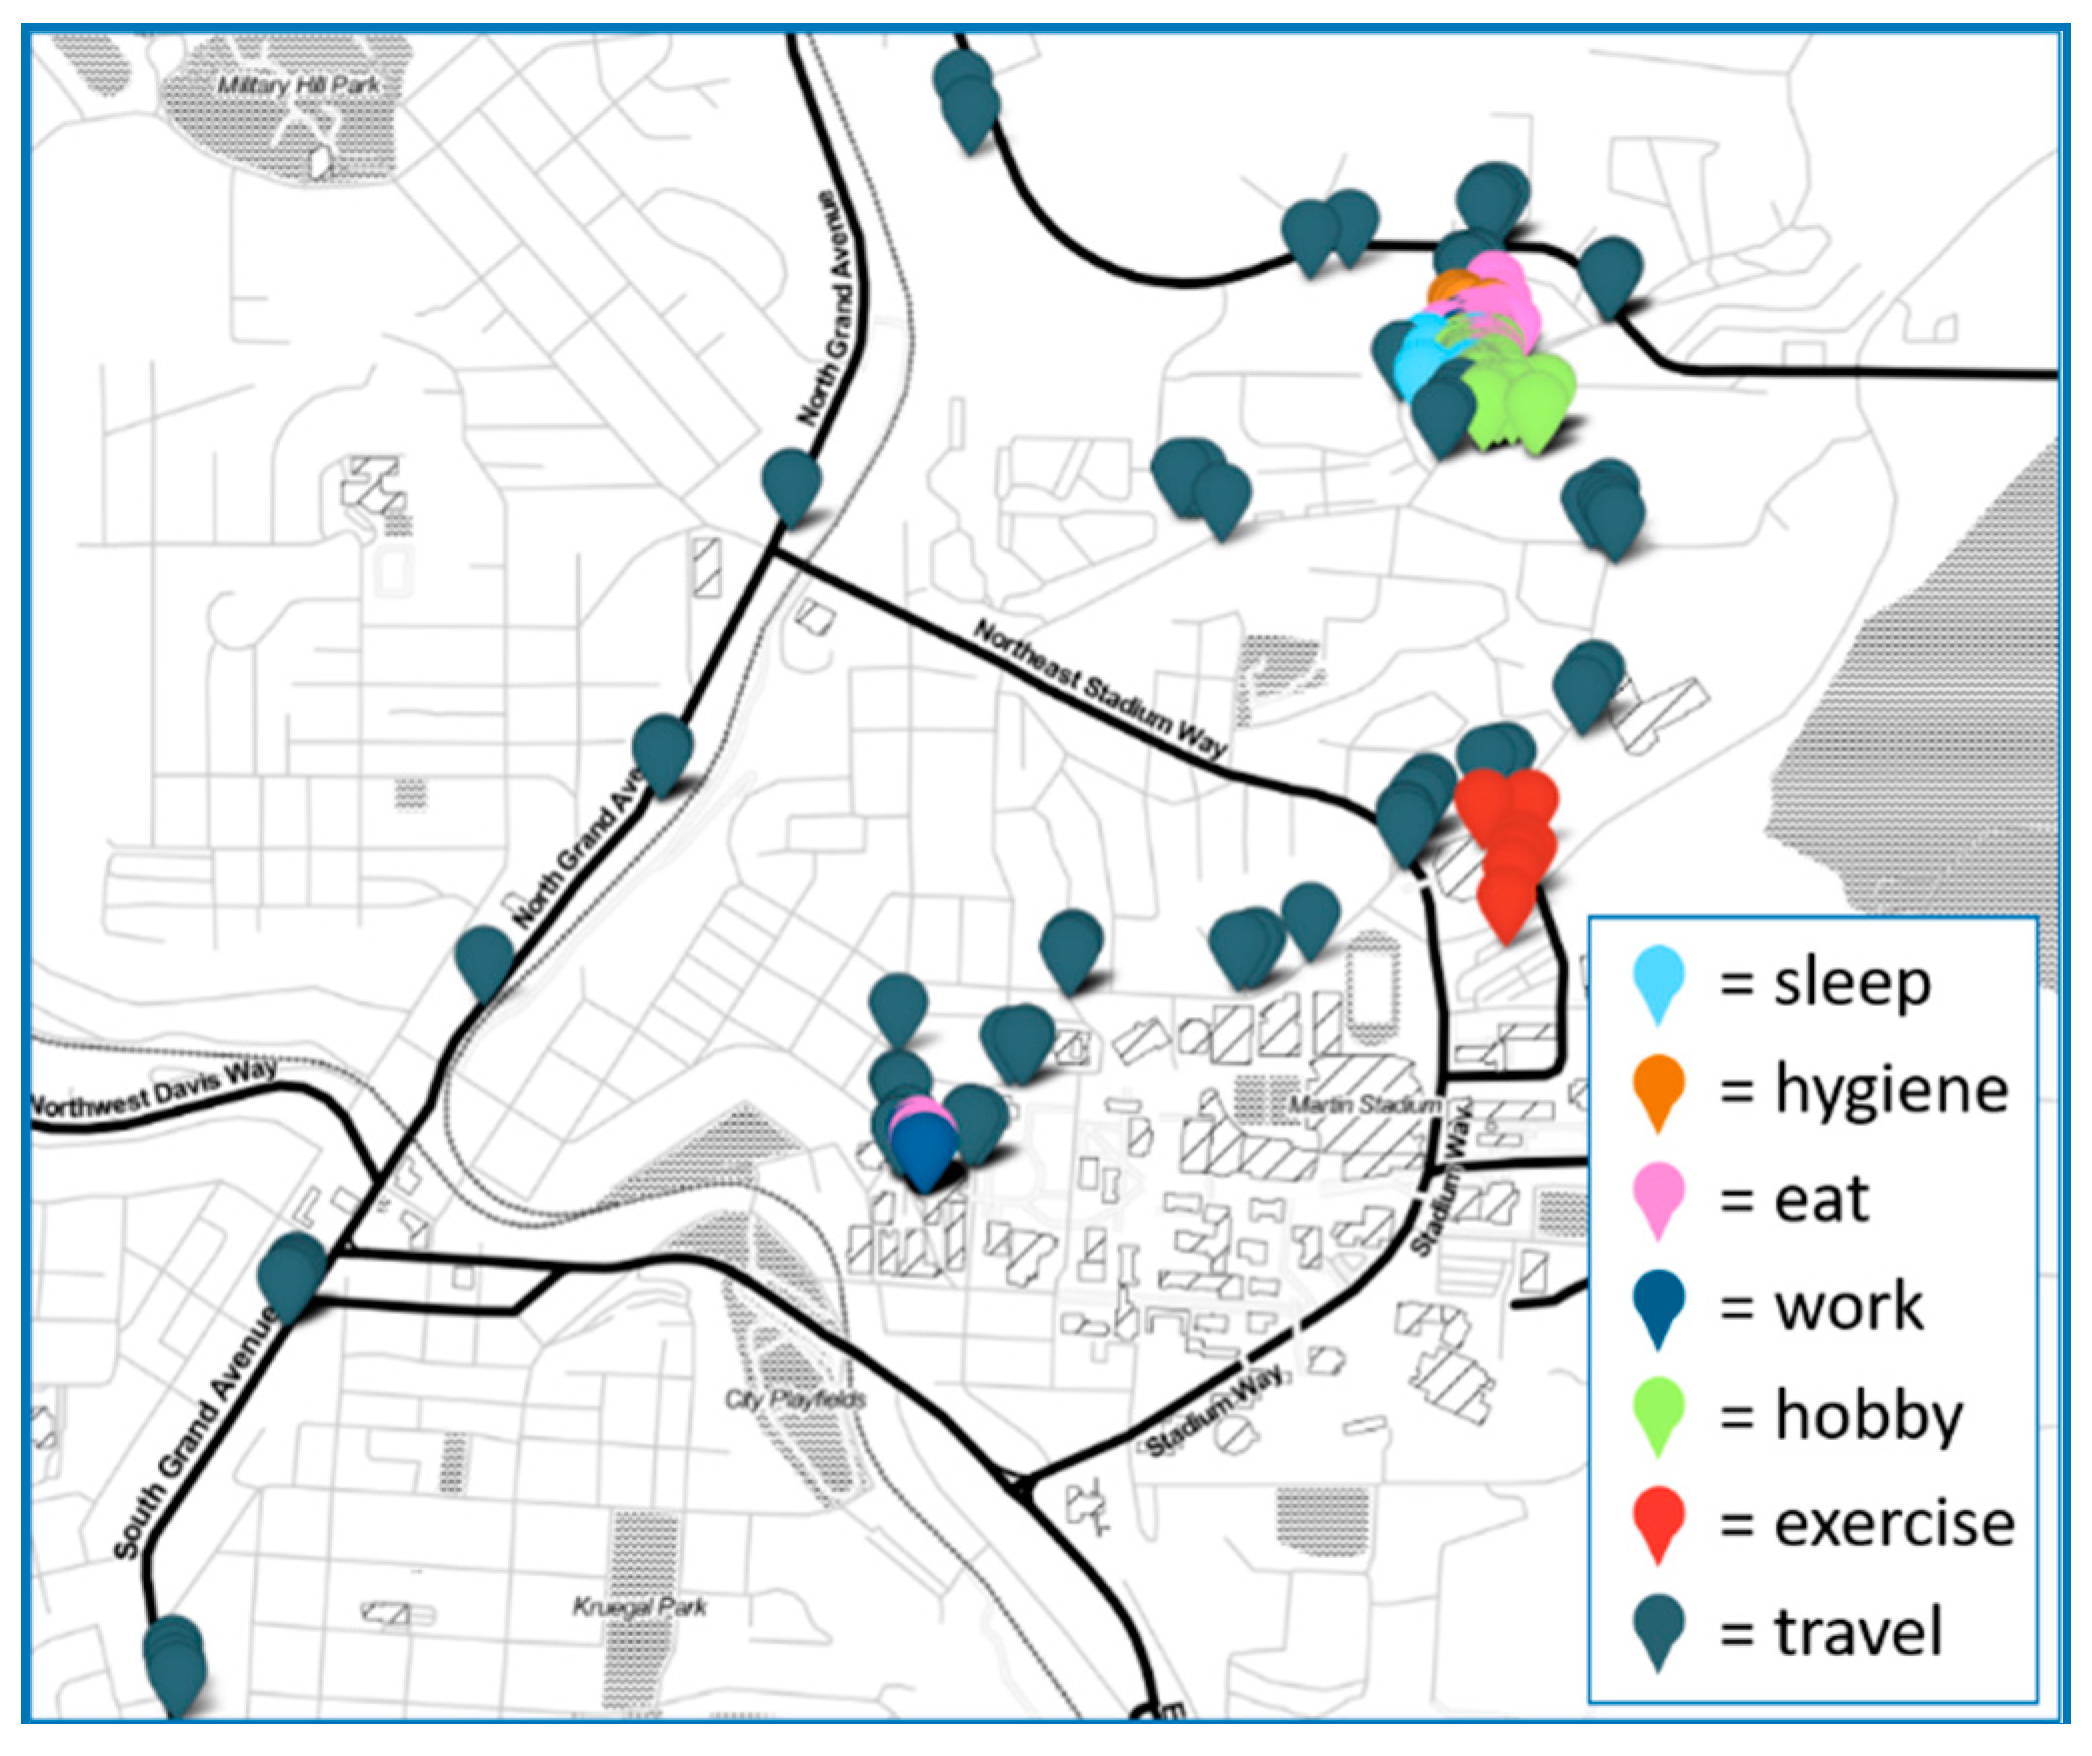
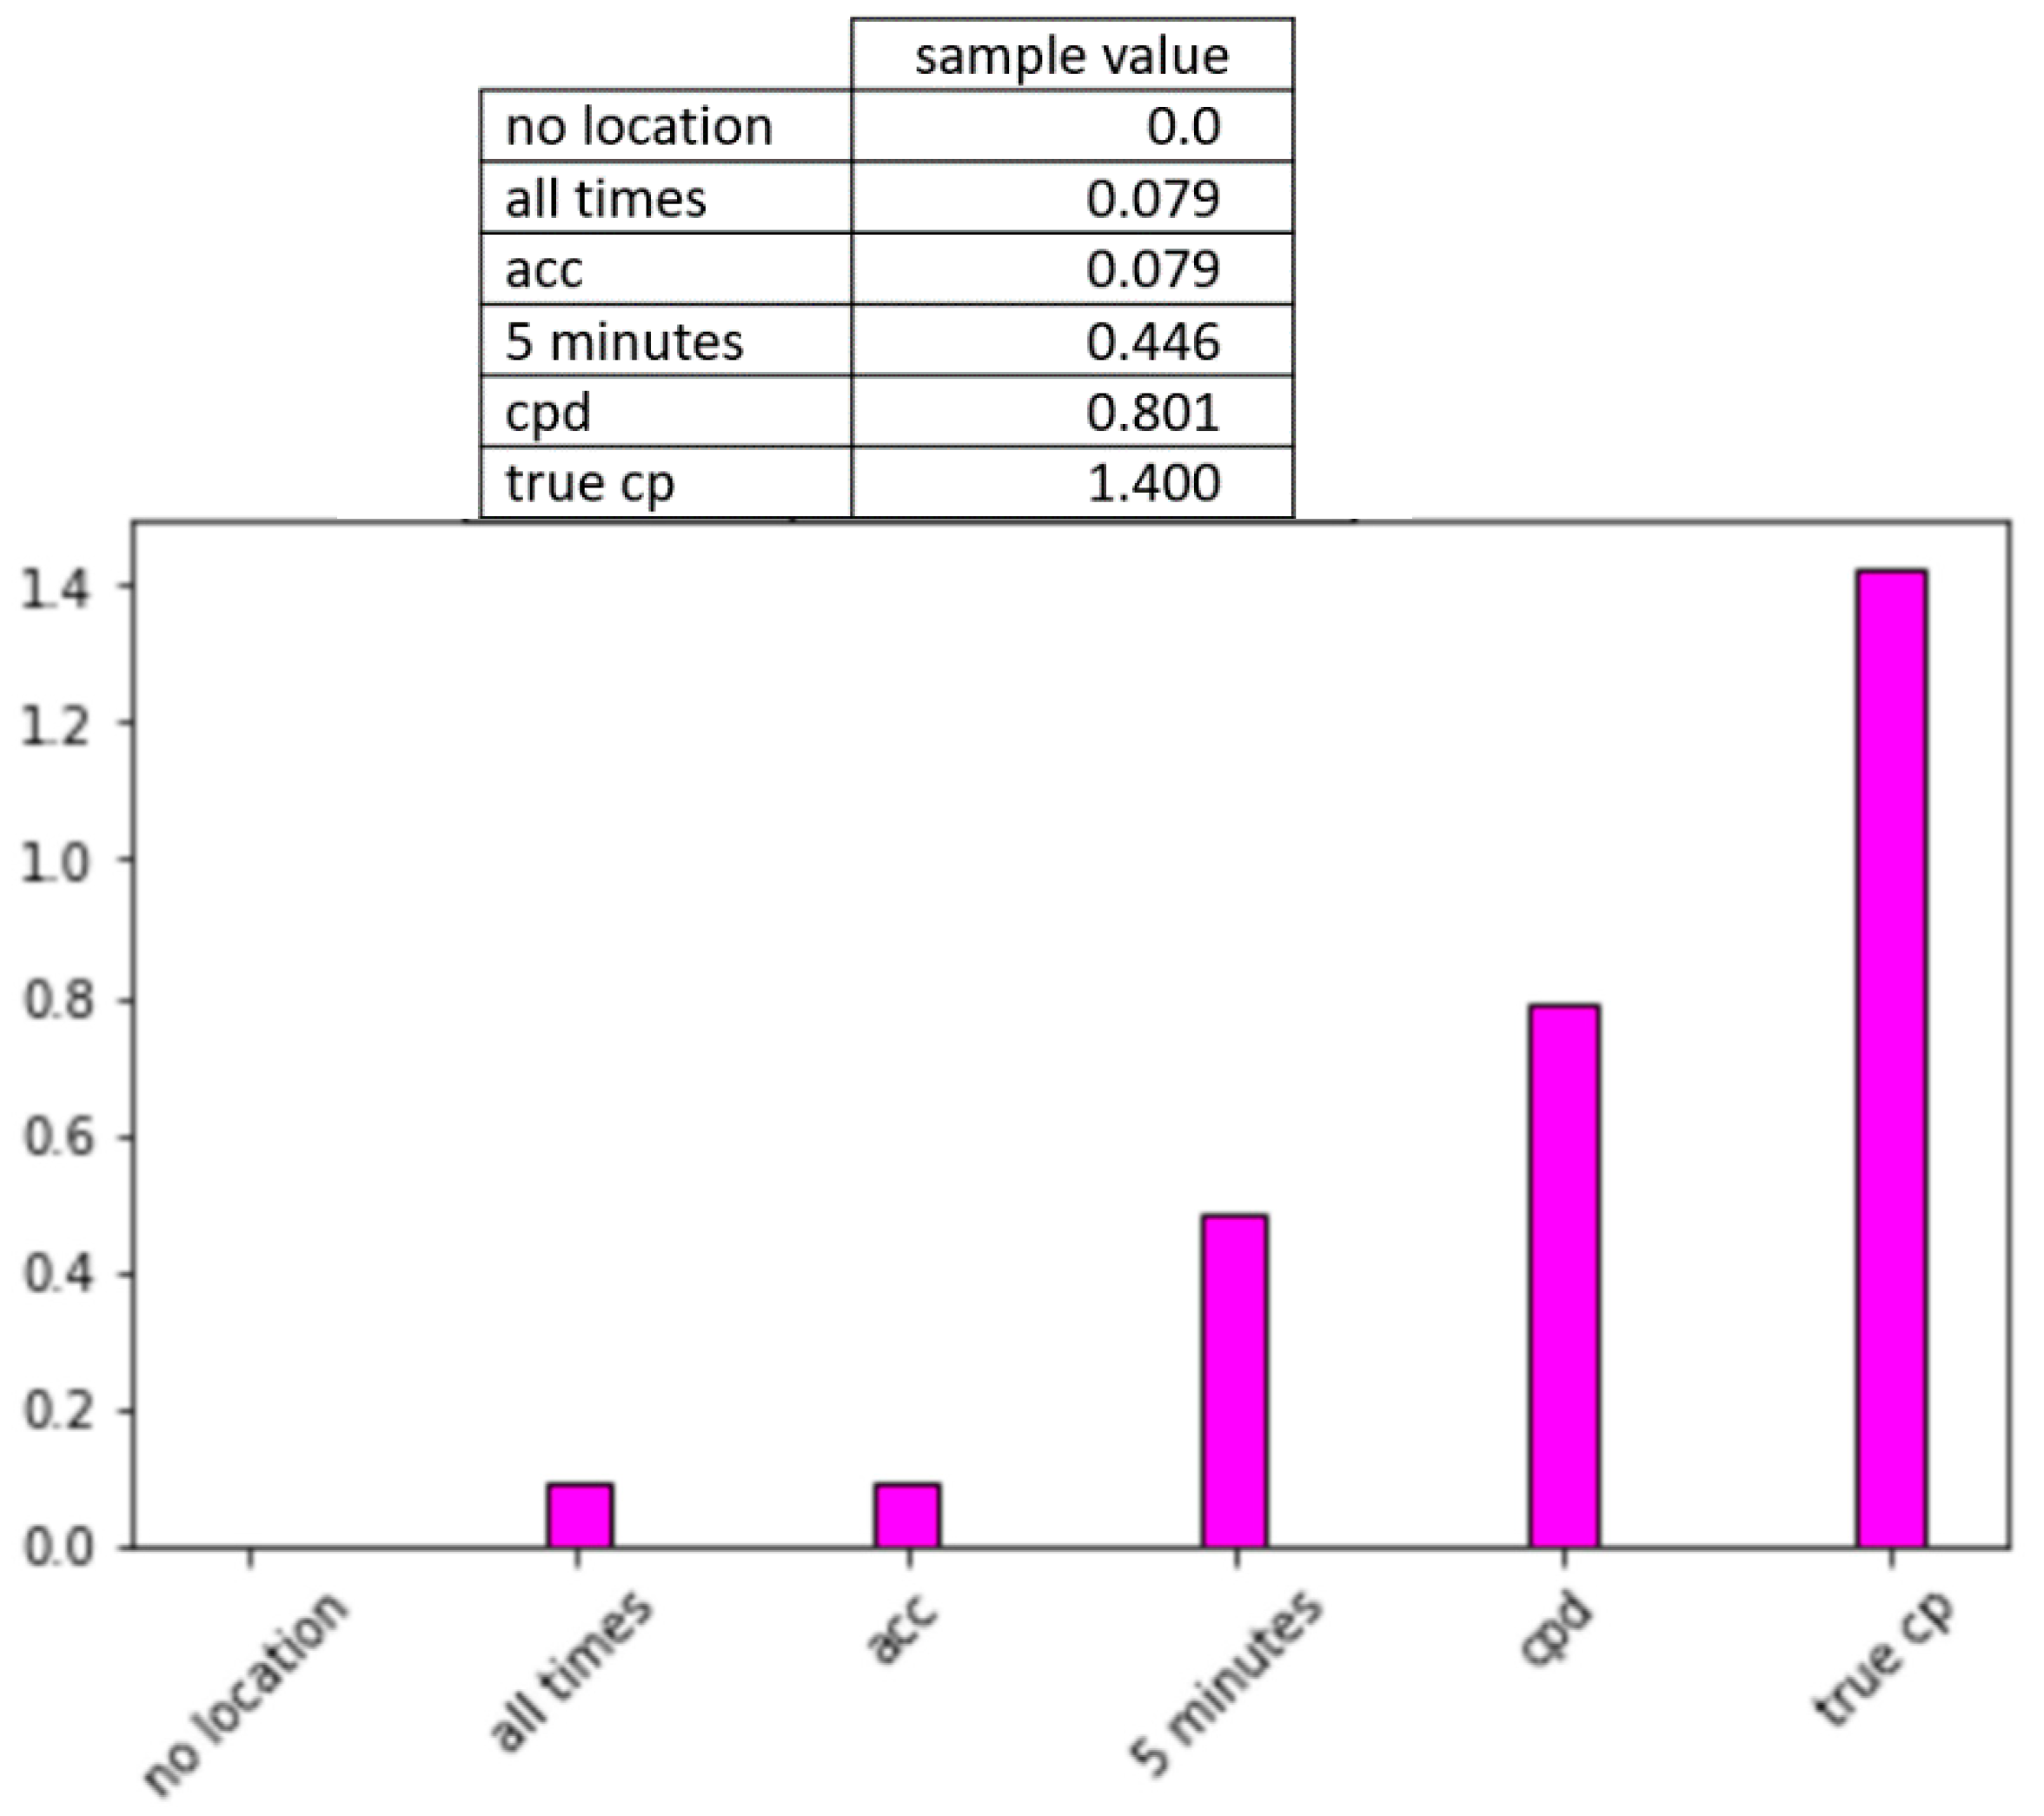
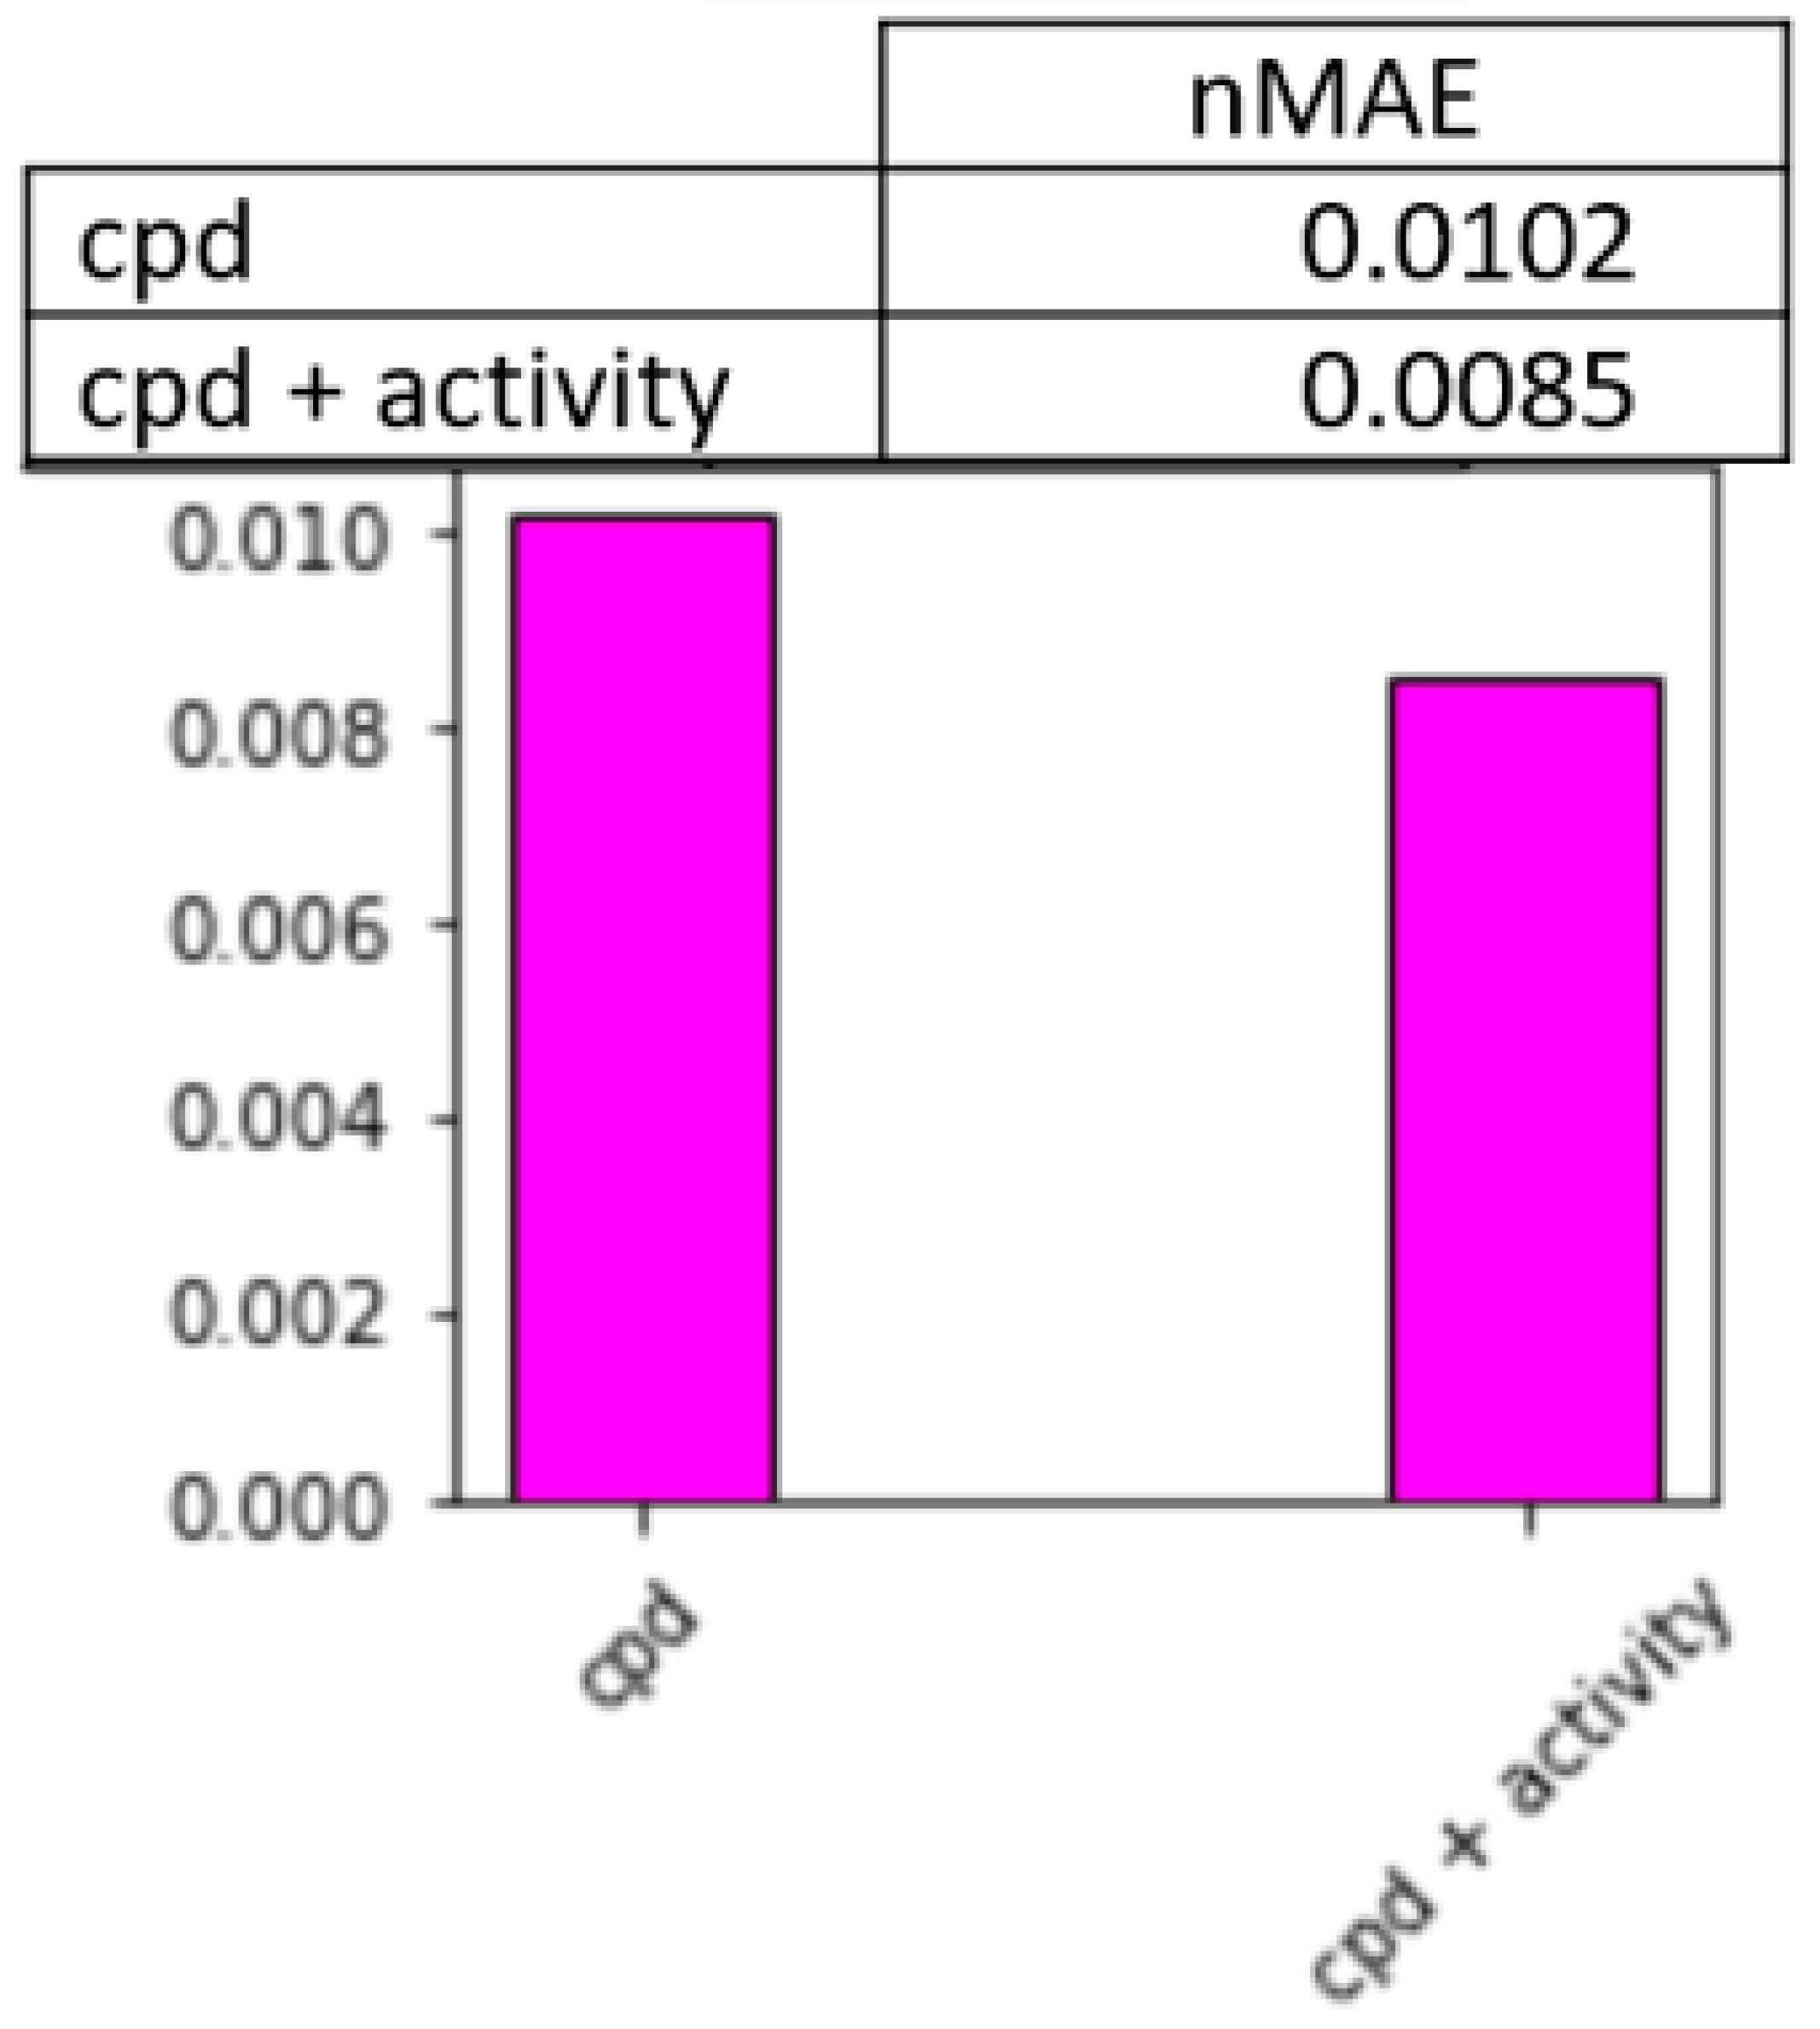
4.6. Location Estimation from Activity Information
5. Conclusions
Author Contributions
Funding
Acknowledgments
Conflicts of Interest
References
- Cook, D.J.; Schmitter-Edgecombe, M.; Jonsson, L.; Morant, A.V. Technology-enabled assessment of functional health. IEEE Rev. Biomed. Eng. 2018, 12, 319–332. [Google Scholar] [CrossRef] [PubMed]
- Bharti, P.; Panwar, A.; Gopalakrishna, G.; Chellappan, S. Watchdog: Detecting self-harming activities from wrist worn accelerometers. IEEE J. Biomed. Health Inform. 2018, 22, 686–696. [Google Scholar] [CrossRef] [PubMed]
- Kumari, P.; Mathew, L.; Syal, P. Increasing trend of wearables and multimodal interface for human activity monitoring: A review. Biosens. Bioelectron. 2017, 90, 298–307. [Google Scholar] [CrossRef]
- Ma, H.; Liao, W.-H. Human gait modeling and analysis using a semi-markov process with ground reaction forces. IEEE Trans. Neural Syst. Rehabil. Eng. 2017, 25, 597–607. [Google Scholar] [CrossRef] [PubMed]
- Villegas, N.M.; Sanchez, C.; Diaz-Cely, J.; Tamura, G. Characterizing context-aware recommender systems: A systematic literature review. Knowl. Based Syst. 2018, 140, 173–200. [Google Scholar] [CrossRef]
- Camomilla, V.; Bergamini, E.; Fantozzi, S.; Vannozzi, G. Trends supporting the in-field use of wearable inertial sensors for sport performance evaluation: A systematic review. Sensors 2018, 18, 873. [Google Scholar] [CrossRef] [Green Version]
- Jiang, S.; Li, Z.; Zhou, P.; Li, M. Memento: An emotion-drive lifelogging system with wearables. ACM Trans. Sens. Netw. 2019, 15, 8. [Google Scholar] [CrossRef]
- Turner-McGrievy, G.M.; Hales, S.B.; Schoffman, D.E.; Valafar, H.; Brazendale, K.; Weaver, R.G.; Beets, M.W.; Wirth, M.D.; Shivappa, N.; Mandes, T.; et al. Choosing between responsive-design websites versus mobile apps for your mobile behavioral intervention: Presenting four case studies. Transl. Behav. Med. 2017, 7, 224–232. [Google Scholar] [CrossRef] [Green Version]
- Alshurafa, N.; Xu, W.; Liu, J.J.; Pourhomayoun, M.; Ghasemzadeh, H.; Sarrafzadeh, M. Battery Optimization in Remote Health Monitoring Systems to Enhance User Adherence. In Proceedings of the 7th International Conference on PErvasive Technologies Related to Assistive Environments (PETRA ’14), Island of Rhodes, Greece, 27–30 May 2014. [Google Scholar]
- Mamaghanian, H.; Khaled, N.; Atienza, D.; Vandergheynst, P. Compressed sensing for real-time energy-efficient ECG compression on wireless body sensor nodes. IEEE Trans. Biomed. Eng. 2011, 58, 2456–2466. [Google Scholar] [CrossRef] [Green Version]
- Akimura, D.; Kawahara, Y.; Asami, T. Compressed sensing method for human activity sensing using mobile phone accelerometers. In Proceedings of the 2012 Ninth International Conference on Networked Sensing (INSS), Antwerp, Belgium, 11–14 June 2012; pp. 1–4. [Google Scholar]
- Jansi, R.; Amutha, R. A novel chaotic map based compressive classification scheme for human activity recognition using a tri-axial accelerometer. Multimed. Tools Appl. 2018, 77, 31261–31280. [Google Scholar] [CrossRef]
- Khalifa, S. Energy-efficient human activity recognition for self-powered wearable devices. In Proceedings of the Australasian Computer Science Week Multiconference (ACSW ’17), Geelong, Australia, 31 January–3 February 2017. [Google Scholar]
- Gordon, D.; Cerny, J.; Miyaki, T.; Beigl, M. Energy-efficient activity recognition using prediction. In Proceedings of the 2012 16th International Symposium on Wearable Computers, Newcastle, UK, 18–22 June 2012. [Google Scholar]
- Pagán, J.; Fallahzadeh, R.; Pedram, M.; Risco-Martín, J.L.; Moya, J.M.; Ayala, J.L.; Ghasemzadeh, H. Toward ultra-low-power remote health monitoring: An optimal and adaptive compressed sensing framework for activity recognition. IEEE Trans. Mob. Comput. 2019, 18, 658–673. [Google Scholar] [CrossRef]
- Rani, M.; Dhok, S.B.; Deshmukh, R.B. A systematic review of compressive sensing: Concepts, implementations and applications. IEEE Access 2018, 6, 4875–4894. [Google Scholar] [CrossRef]
- Djelouat, H.; Amira, A.; Bensaali, F. Compressive sensing-based IoT applications: A review. J. Sens. Actuator Netw. 2018, 7, 45. [Google Scholar] [CrossRef] [Green Version]
- Elgendi, M.; Al-Ali, A.; Mohamed, A.; Ward, R. Improving remote health monitoring: A low-complexity ECG compression approach. Diagnostics 2018, 8, 10. [Google Scholar] [CrossRef] [PubMed] [Green Version]
- Braojos, R.; Beretta, I.; Constantin, J.; Burg, A.; Atienza, D. A wireless body sensor network for activity monitoring with low transmission overhead. In Proceedings of the 2014 12th IEEE International Conference on Embedded and Ubiquitous Computing, Milano, Italy, 26–28 August 2014. [Google Scholar]
- Lan, G.; Ma, D.; Xu, W.; Hassan, M.; Hu, W. CapSense: Capacitor-based activity sensing for kinetic energy harvesting powered wearable devices. In Proceedings of the 14th EAI International Conference on Mobile and Uibiquitous Systems: Computing, Networking and Services, Melbourne, Australia, 7–10 November 2017. [Google Scholar]
- Kwak, J.; Kim, J.; Chong, S. Proximity-aware location based collaborative sensing for energy-efficient mobile devices. IEEE Trans. Mob. Comput. 2019, 18, 417–430. [Google Scholar] [CrossRef]
- Guo, S.; Liu, J.; Yang, Y.; Xiao, B.; Li, Z. Energy-efficient dynamic computation offloading and cooperative task scheduling in cloud computing. IEEE Trans. Mob. Comput. 2019, 18, 319–333. [Google Scholar] [CrossRef]
- Sheng, X.; Tang, J.; Zhang, W. Energy-efficient collaborative sensing with mobile phones. In Proceedings of the 2012 Proceedings IEEE INFOCOM, Orlando, FL, USA, 25–30 March 2012. [Google Scholar]
- Alshurafa, N.; Eastwood, J.-A.; Nyamathi, S.; Liu, J.J.; Xu, W.; Ghasemzadeh, H.; Pourhomayoun, M.; Sarrafzadeh, M. Improving compliance in a remote health monitoring system through smartphone battery optimization. IEEE J. Biomed. Health Inform. 2015, 19, 57–63. [Google Scholar] [CrossRef]
- Yan, Z.; Subbaraju, V.; Chakraborty, D.; Misra, A.; Aberer, K. Energy-efficient continuous activity recognition on mobile phones: An activity-adaptive approach. In Proceedings of the 2012 16th International Symposium on Wearable Computers, Newcastle, UK, 18–22 June 2012; pp. 17–24. [Google Scholar]
- Fallahzadeh, R.; Ghasemzadeh, H. Trading-off power consumption and prediction performance in wearable motion sensors: An optimal and real-time approach. ACM Trans. Des. Autom. Electron. Syst. 2018, 23, 67. [Google Scholar] [CrossRef]
- Grützmacher, F.; Wolff, J.; Hein, A.; Lepidis, P.; Dorsch, R.; Kirste, T.; Haubelt, C. Towards energy efficient sensor nodes for online activity recognition. In Proceedings of the IECON 2017—43rd Annual Conference of the IEEE Industrial Electronics Society, Beijing, China, 29 October–1 November 2017. [Google Scholar]
- Elsts, A.; McConville, R.; Fafoutis, X.; Twomey, N.; Piechocki, R.J.; Santos-Rodriguez, R.; Craddock, I. On-board feature extraction from acceleration data for activity recognition. In Proceedings of the 2018 International Conference on Embedded Wireless Systems and Networks, Madrid, Spain, 14–16 February 2018; pp. 163–168. [Google Scholar]
- Bhat, G.; Deb, R.; Chaurasia, V.V.; Shill, H.; Ogras, U.Y. Online human activity recognition using low-power wearable devices. In Proceedings of the 2018 IEEE/ACM International Conference on Computer-Aided Design (ICCAD), San Diego, CA, USA, 5–8 November 2018. [Google Scholar]
- Berrocal, J.; Garcia-Alonso, J.; Vicente-Chicote, C.; Hernández, J.; Mikkonen, T.; Canal, C.; Murillo, J.M. Early analysis of resource consumption patterns in mobile applications. Pervasive Mob. Comput. 2017, 35, 32–50. [Google Scholar] [CrossRef]
- French, B.; Siewiorek, D.P.; Smailagic, A.; Deisher, M. Selective sampling strategies to conserve power in context aware devices. In Proceedings of the 2007 11th IEEE International Symposium on Wearable Computers, Boston, MA, USA, 11–13 October 2007. [Google Scholar]
- Bulling, A.; Blanke, U.; Schiele, B. A tutorial on human activity recognition using body-worn inertial sensors. ACM Comput. Surv. 2014, 46, 107–140. [Google Scholar] [CrossRef]
- Lara, O.; Labrador, M.A. A survey on human activity recognition using wearable sensors. IEEE Commun. Surv. Tutor. 2013, 15, 1192–1209. [Google Scholar] [CrossRef]
- Bharti, P.; De, D.; Chellappan, S.; Das, S.K. HuMAn: Complex activity recognition with multi-modal multi-positional body sensing. IEEE Trans. Mob. Comput. 2019, 18, 857–870. [Google Scholar] [CrossRef]
- Kwon, M.-C.; You, H.; Kim, J.; Choi, S. Classification of various daily activities using convolution neural network and smartwatch. In Proceedings of the 2018 IEEE International Conference on Big Data (Big Data), Seattle, WA, USA, 10–13 December 2018. [Google Scholar]
- Shoaib, M.; Incel, O.D.; Scholten, H.; Havinga, P. SmokeSense: Online activity recognition framework on smartwatches. In Proceedings of the International Conference on Mobile Computing, Applications, and Services, Osaka, Japan, 28 February–2 March 2018; pp. 106–124. [Google Scholar]
- Minor, B.D.; Doppa, J.R.; Cook, D.J. Learning activity predictors from sensor data: Algorithms, evaluation, and applications. IEEE Trans. Knowl. Data Eng. 2017, 29, 2744–2757. [Google Scholar] [CrossRef] [PubMed]
- Herrera-Alcantara, O.; Barrera-Animas A yair Gonalez-Mendoza, M.; Castr-Espinoza, F. Monitoring student activities with smartwatches: On the academic performance achievement. Sensors 2019, 19, 1605. [Google Scholar] [CrossRef] [PubMed] [Green Version]
- Graf, C. The Lawton instrumental activities of daily living scale. Am. J. Nurs. 2008, 108, 52–62. [Google Scholar] [CrossRef] [Green Version]
- Leurent, C.; Ehlers, M.D. Digital technologies for cognitive assessment to accelerate drug development in Alzheimer’s disease. Clin. Pharmacol. Ther. 2015, 98, 475–476. [Google Scholar] [CrossRef] [Green Version]
- Bureau of Labor Statistics. American Time Use Survey. Available online: http://www.bls.gov/tus/ (accessed on 24 June 2019).
- Aminikhanghahi, S.; Fallahzadeh, R.; Sawyer, M.; Cook, D.J.; Holder, L.B. Thyme: Improving smartphone prompt timing through activity awareness. In Proceedings of the 16th IEEE International Conference on Machine Learning and Applications (ICMLA 2017), Cancun, Mexico, 18–21 December 2017. [Google Scholar] [CrossRef]
- Munoz-Organero, M. Human activity recognition based on single sensor square HV acceleration images and convolutional neural networks. IEEE Sens. J. 2018, 19, 1487–1498. [Google Scholar]
- Feuz, K.D.; Cook, D.J.; Rosasco, C.; Robertson, K.; Schmitter-Edgecombe, M. Automated Detection of Activity Transitions for Prompting. IEEE Trans. Hum.-Mach. Syst. 2015, 45. [Google Scholar] [CrossRef] [Green Version]
- Aminikhanghahi, S.; Cook, D.J. Enhancing activity recognition using CPD-based activity segmentation. Pervasive Mob. Comput. 2019, 53, 75–89. [Google Scholar] [CrossRef]
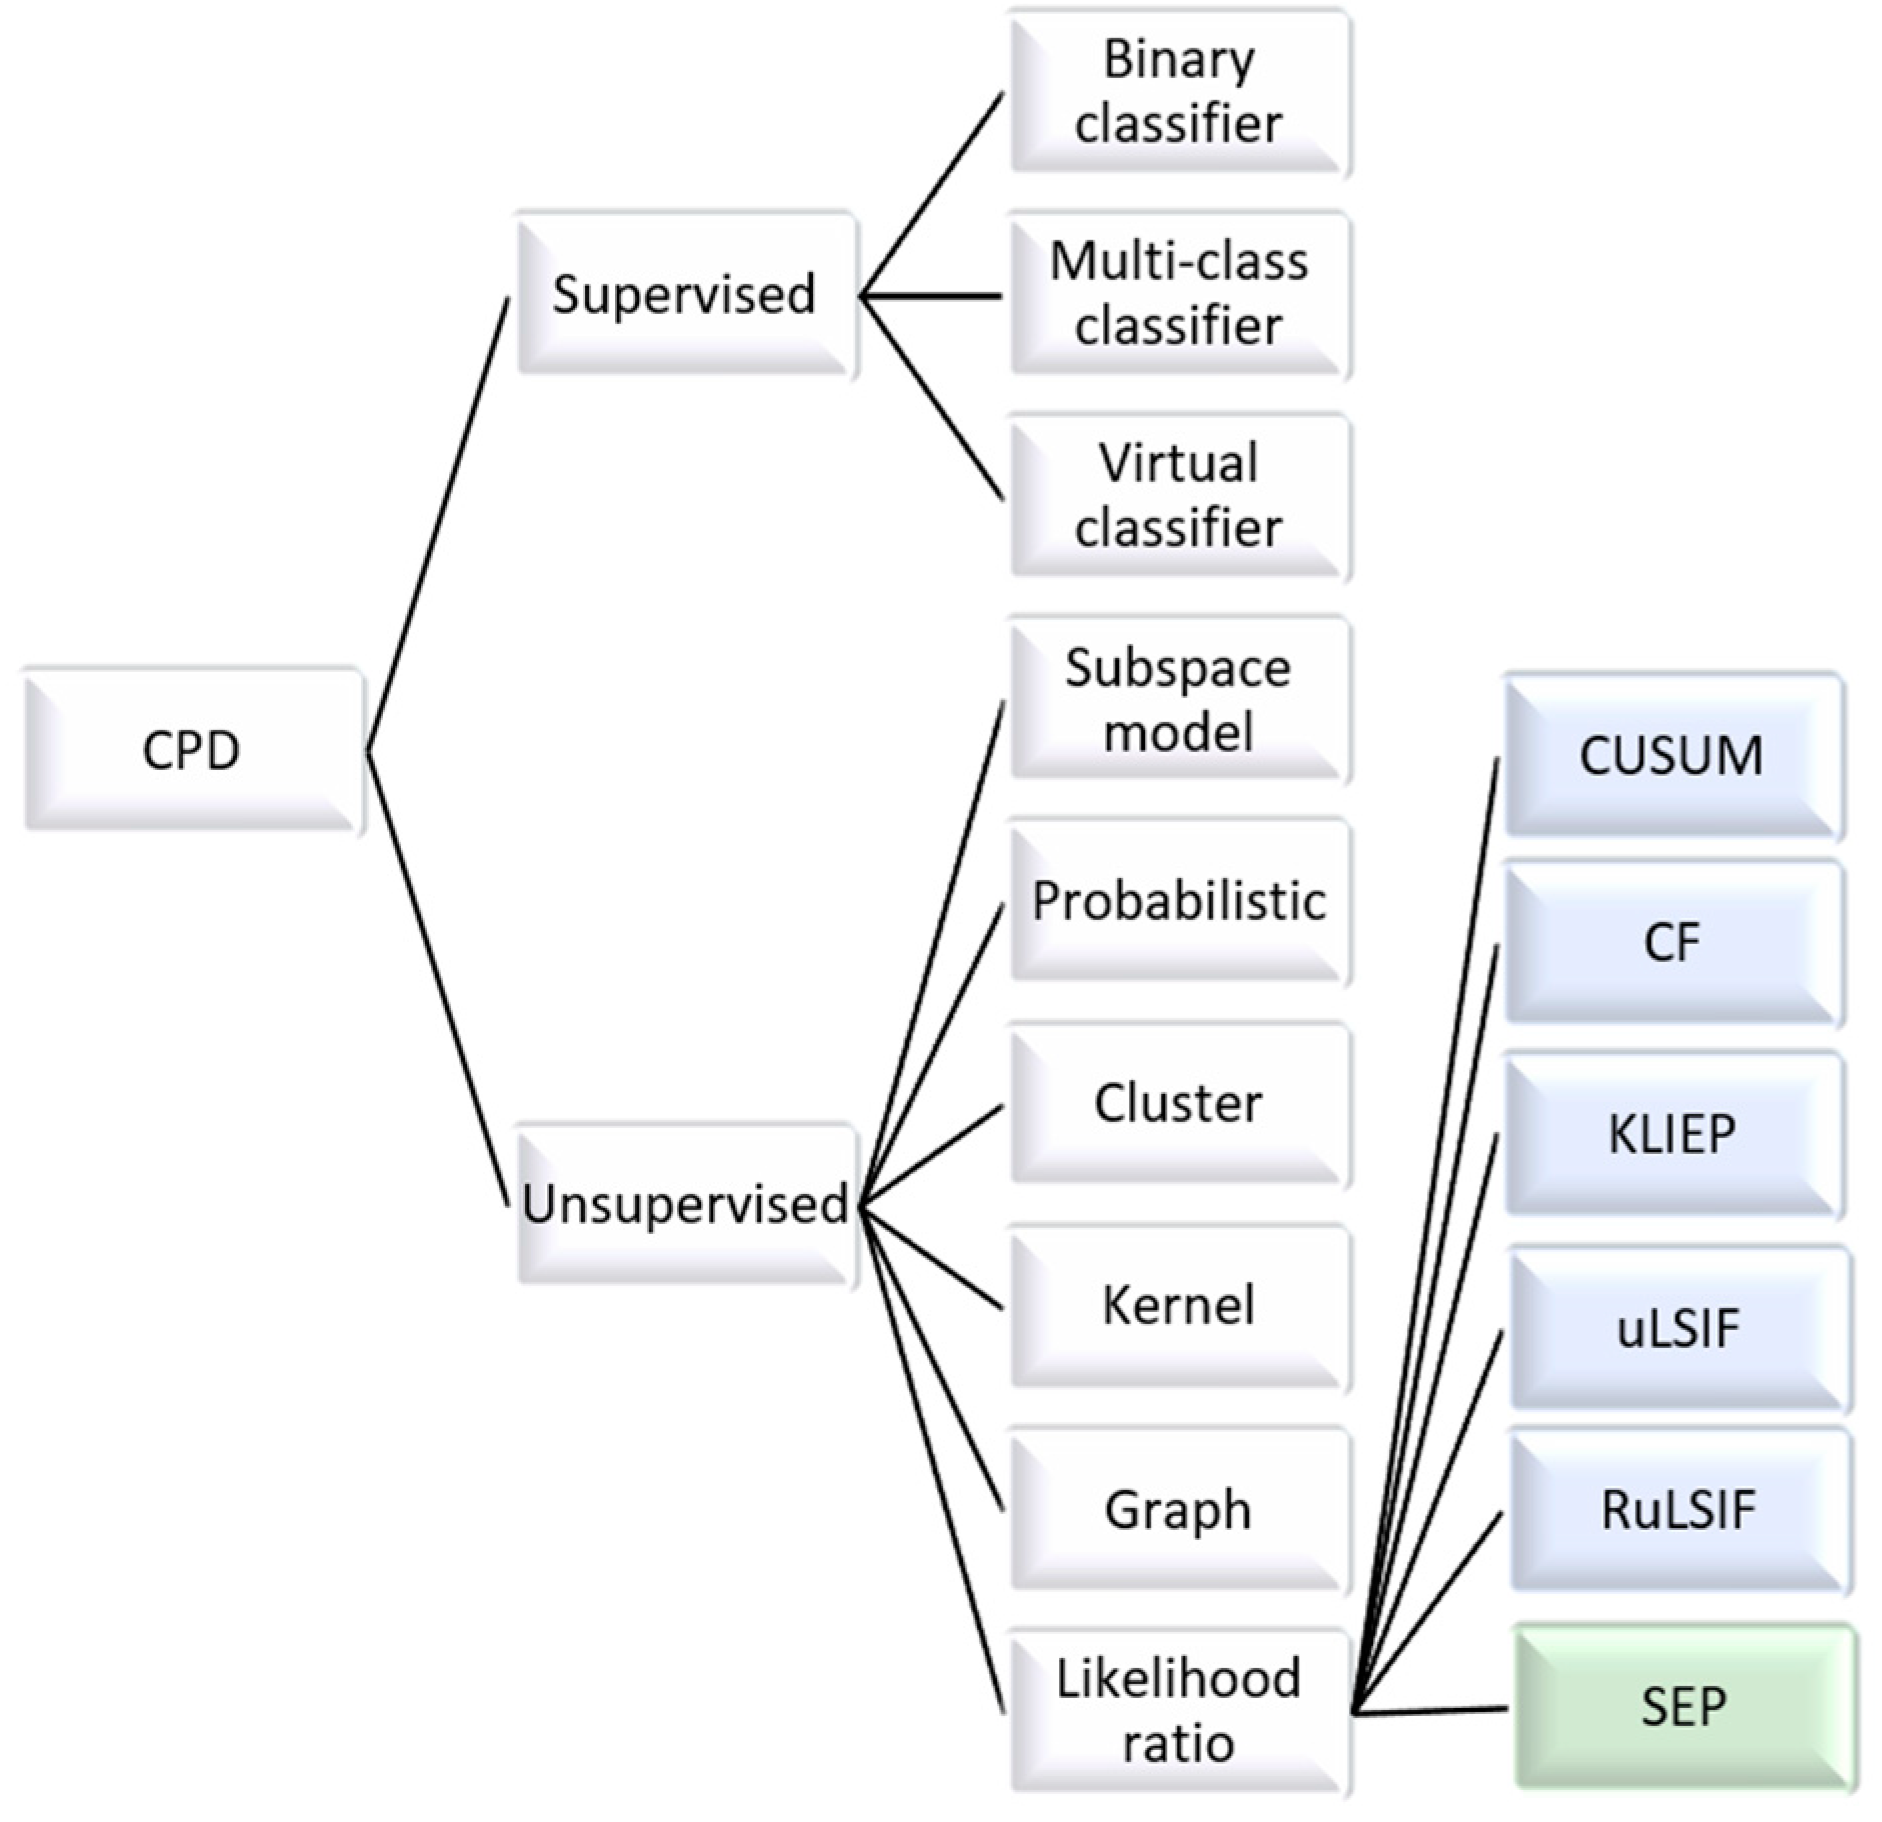
- Aminikhanghahi, S.; Cook, D.J. A survey of methods for time series change point detection. Knowl. Inf. Syst. 2017, 51, 339–367. [Google Scholar] [CrossRef] [Green Version]
- Kawahara, Y.; Yairi, T.; Machida, K. Change-point detection in time-series data based on subspace identification. In Proceedings of the International Conference on Data Mining, Omaha, NE, USA, 28–31 October 2007; pp. 559–564. [Google Scholar]
- Rakthanmanon, T.; Keogh, E.J.; Lonardi, S.; Evans, S. MDL-based time series clustering. Knowl. Inf. Syst. 2012, 33, 371–399. [Google Scholar] [CrossRef]
- Zakaria, J.; Mueen, A.; Keogh, E. Clustering time series using unsupervised shapelets. In Proceedings of the International Conference on Data Mining, Brussels, Belgium, 10–13 December 2012; pp. 785–794. [Google Scholar]
- Li, S.; Xie, Y.; Dai, H.; Song, L. M-statistic for kernel change-point detection. In Proceedings of the Advances in Neural Information Processing Systems 28: Annual Conference on Neural Information Processing Systems 2015, Montreal, QC, Canada, 7–12 December 2015. [Google Scholar]
- Adams, R.P.; MacKay, D.J.C. Bayesian Online Changepoint Detection. arXiv 2007, arXiv:0710.3742. [Google Scholar]
- Saatçi, Y.; Turner, R.D.; Rasmussen, C.E. Gaussian Process Change Point Models. In Proceedings of the International Conference on Machine Learning, Haifa, Israel, 21–24 June 2010; pp. 927–934. [Google Scholar]
- Basseville, M.; Nikiforov, I. Detection of Abrupt Changes: Theory and Application; Prentice Hall: Englewood Cliffs, NJ, USA, 1993. [Google Scholar]
- Takeuchi, J.; Yamanishi, K. A unifying framework for detecting outliers and change points from non-stationary time series data. IEEE Trans. Knowl. Data Eng. 2006, 18, 482–492. [Google Scholar] [CrossRef]
- Sugiyama, M.; Suzuki, T.; Nakajima, S.; Kashima, H.; von Bünau, P.; Kawanabe, M. Direct importance estimation for covariate shift adaptation. Ann. Inst. Stat. Math. 2008, 60, 699–746. [Google Scholar] [CrossRef]
- Kanamori, T.; Hido, S.; Sugiyama, M. A Least-squares Approach to Direct Importance Estimation. J. Mach. Learn. Res. 2009, 10, 1391–1445. [Google Scholar]
- Liu, S.; Yamada, M.; Collier, N.; Sugiyama, M. Change-point detection in time-series data by relative density-ratio estimation. Neural Netw. 2013, 43, 72–83. [Google Scholar] [CrossRef] [Green Version]
- Yoshizawa, M.; Takasadi, W.; Ohmura, R. Parameter exploration for response time reduction in accelerometer-based activity recognition. In Proceedings of the 2013 ACM Conference on Ubiquitous Computing, Zurich, Switzerland, 8–12 September 2013; pp. 653–664. [Google Scholar]
- Cho, M.; Kim, Y.; Lee, Y. Contextual relationship-based activity segmentation on an event stream in the IoT environment with multi-user activities. arXiv 2016, arXiv:1609.06024. [Google Scholar]
- Wang, Y.; Fan, Z.; Bandara, A. Identifying activity boundaries for activity recognition in smart environments. In Proceedings of the IEEE International Conference on Communications, Kuala Lumpur, Malaysia, 22–27 May 2016; pp. 1–6. [Google Scholar]
- Reyes-Ortiz, J.-L.; Oneto, L.; Sama, A.; Parra, X.; Anguita, D. Transition-aware human activity recognition using smartphones. Neurocomputing 2016, 171, 754–767. [Google Scholar] [CrossRef] [Green Version]
- Noor, M.H.M.; Salcic, Z.; Wang, K.I.K. Adaptive sliding window segmentation for physical activity recognition using a single tri-axial accelerometer. Pervasive Mob. Comput. 2017, 38, 41–59. [Google Scholar] [CrossRef]
- Li, K.; Habre, R.; Deng, H.; Urman, R.; Morrison, J.; Gilliland, F.D.; Ambite, J.L.; Stripelis, D.; Chiang, Y.Y.; Lin, Y.; et al. Applying multivariate segmentation methods to human activity recognition from wearable sensors’ data. JMIR Mhealth Uhealth 2019, 7, e11201. [Google Scholar] [CrossRef] [Green Version]
- Alam, M.A.U.; Roy, N.; Gangopadhyay, A.; Galik, E. A smart segmentation technique towards improved infrequent non-speech gestural activity recognition model. Pervasive Mob. Comput. 2016. [Google Scholar] [CrossRef] [Green Version]
- Ni, Q.; Patterson, T.; Cleland, I.; Nugent, C. Dynamic detection of window starting positions and its implementation within an activity recognition framework. J. Biomed. Inform. 2016, 62, 171–180. [Google Scholar] [CrossRef] [PubMed]
- Aminikhanghahi, S.; Wang, T.; Cook, D.J. Real-Time Change Point Detection with application to Smart Home Time Series Data. IEEE Trans. Knowl. Data Eng. 2018, 31, 1010–1023. [Google Scholar] [CrossRef]


| Activity | Interpretation |
|---|---|
| Sleep | nighttime sleep (going to bed, waking up, nighttime interruptions), daytime naps |
| Work | work at office, work on computer, teach, attend class, finances, research, meetings |
| Eat | cook, eat at home, eat out, snack, drink, clean dishes |
| Errands | shop, doctor appointment, other appointment |
| Exercise | exercise machines, run, walk, bike, lift weights, sports |
| Travel | drive/ride in car, bus, train, airplane |
| Hygiene | dress, brush teeth, wash, bathe/shower, groom |
| Hobby | garden, games, care for others, care for house, socialize, entertainment, read |
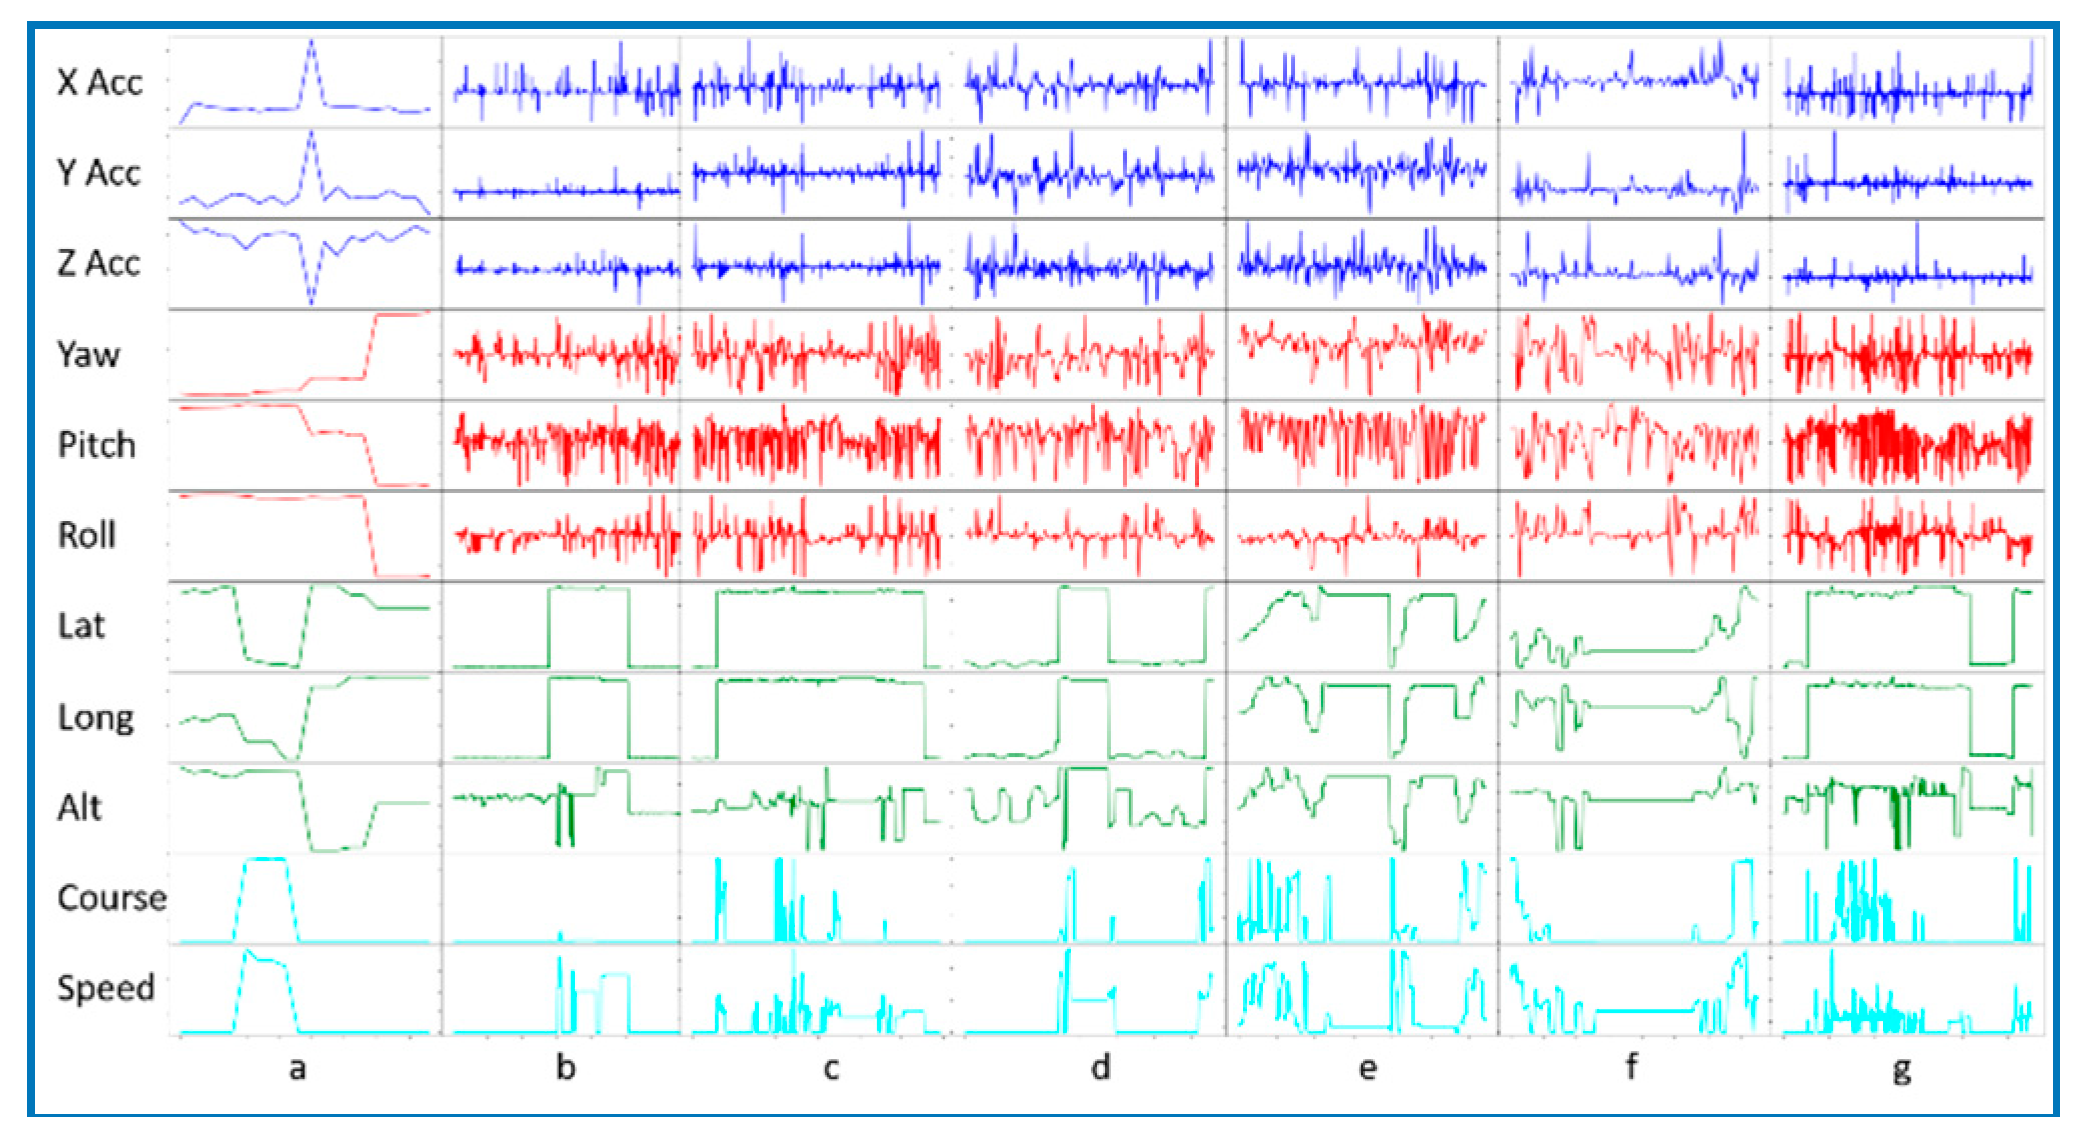
| Sensor Data | |
| Acc = <x acceleration, y acceleration, z acceleration>, rot = <yaw, pitch, roll>, course, speed, orientation, loc = <latitude, longitude, altitude>, heart rate, compass, date, time | |
| Features | Data |
| fstatistical: max, min, sum, mean, standard deviation, mean absolute deviation, median absolute deviation, variance, zero crossings, interquartile range, coefficient of variation, skewness, kurtosis, entropy, discrete Fourier transform, signal energy, log signal energy, power, autocorrelation | acc, rot, course, speed, compass, heart rate |
| frelational: total, multidimensional correlation | acc, rot, loc |
| ftemporal: day of week, hours, minutes, seconds past midnight | date, time |
| fnavigational: heading change rate, stop rate, overall trajectory, distance travelled | loc, calculated for each window |
| fpersonal: frequent cluster membership, frequency/time cluster membership, distance from center | loc, calculated for each user |
| fpositional: loc_type = <home, restaurant, road, store, work, attraction, service, other> | loc, calculated via reverse geocoding |
| Activities | |
| A: eat, errands, exercise, hobby, hygiene, sleep, travel, work, other | |
| Activity | Number of Sensor Readings | Number of Occurrences |
|---|---|---|
| Eat | 72,272 | 5253 |
| Errands | 6475 | 297 |
| Exercise | 48,984 | 5909 |
| Hobby | 29,400 | 8219 |
| Hygiene | 10,832 | 1455 |
| Sleep | 254,939 | 1038 |
| Travel | 25,022 | 3400 |
| Work | 224,012 | 14,518 |
| Other | 31,626 | 6141 |
| Total | 703,284 | 46,230 |
| SEP | |
| True Positive Rate = 0.875 | False Positive Rate = 0.150 |
| G-Mean = 0.862 | |
| Baseline | |
| True Positive Rate = 0.003 | False Positive Rate = 0.46 |
| G-Mean = 0.002 | |
| Operation | Energy Consumption |
|---|---|
| Normal (1 s) | 1.1430 × 10⁻⁵ Wh |
| Movement (1 sample) | 1.3716 × 10⁻⁵ Wh |
| Location sample (1 sample) | 7.6454 × 10⁻⁵ Wh |
© 2020 by the authors. Licensee MDPI, Basel, Switzerland. This article is an open access article distributed under the terms and conditions of the Creative Commons Attribution (CC BY) license (http://creativecommons.org/licenses/by/4.0/).
Share and Cite
Culman, C.; Aminikhanghahi, S.; J. Cook, D. Easing Power Consumption of Wearable Activity Monitoring with Change Point Detection. Sensors 2020, 20, 310. https://doi.org/10.3390/s20010310
Culman C, Aminikhanghahi S, J. Cook D. Easing Power Consumption of Wearable Activity Monitoring with Change Point Detection. Sensors. 2020; 20(1):310. https://doi.org/10.3390/s20010310
Chicago/Turabian StyleCulman, Cristian, Samaneh Aminikhanghahi, and Diane J. Cook. 2020. "Easing Power Consumption of Wearable Activity Monitoring with Change Point Detection" Sensors 20, no. 1: 310. https://doi.org/10.3390/s20010310