An Analysis Method for Capacitive Micromachined Ultrasound Transducer (CMUT) Energy Conversion during Large Signal Operation


Abstract
:1. Introduction
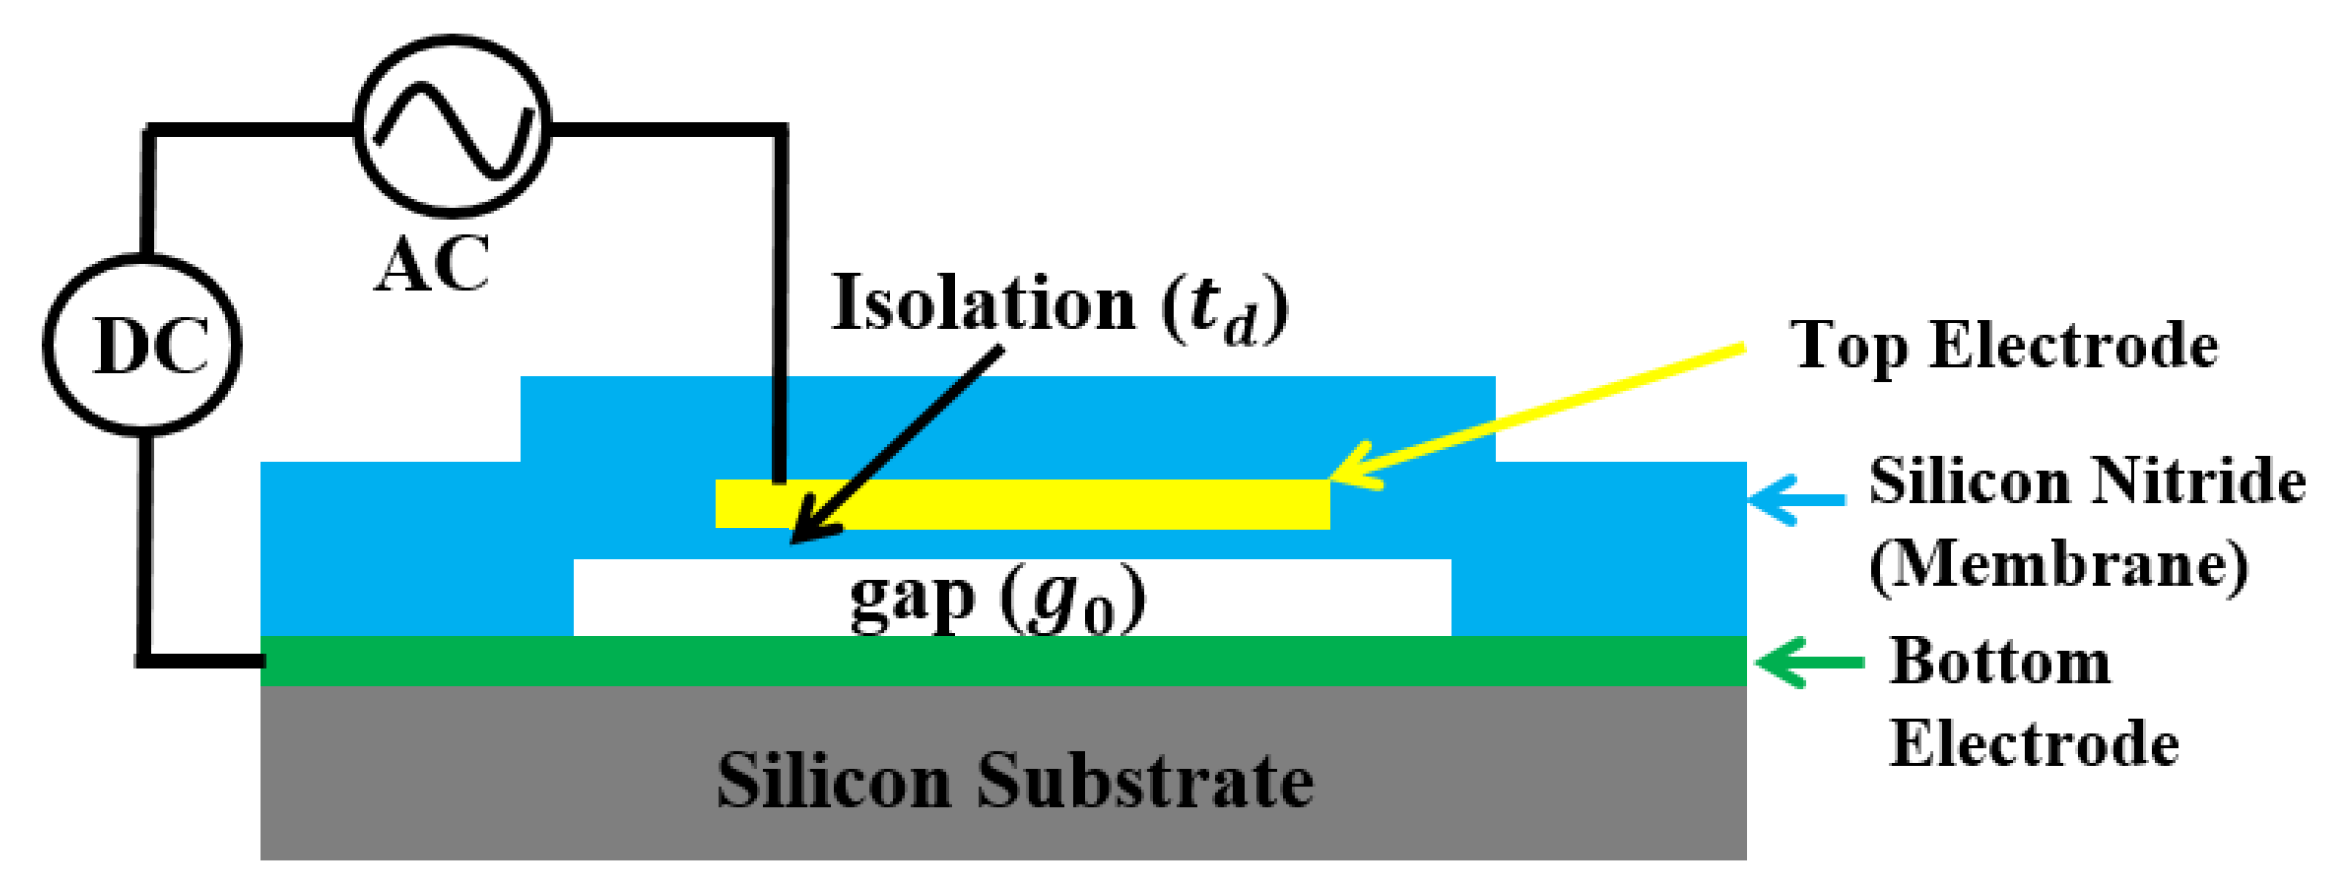
2. CMUT Operation and Nonlinear Model
3. ECR Calculation
ECR Calculation Example
4. ECR Verification in Small Signal Operation
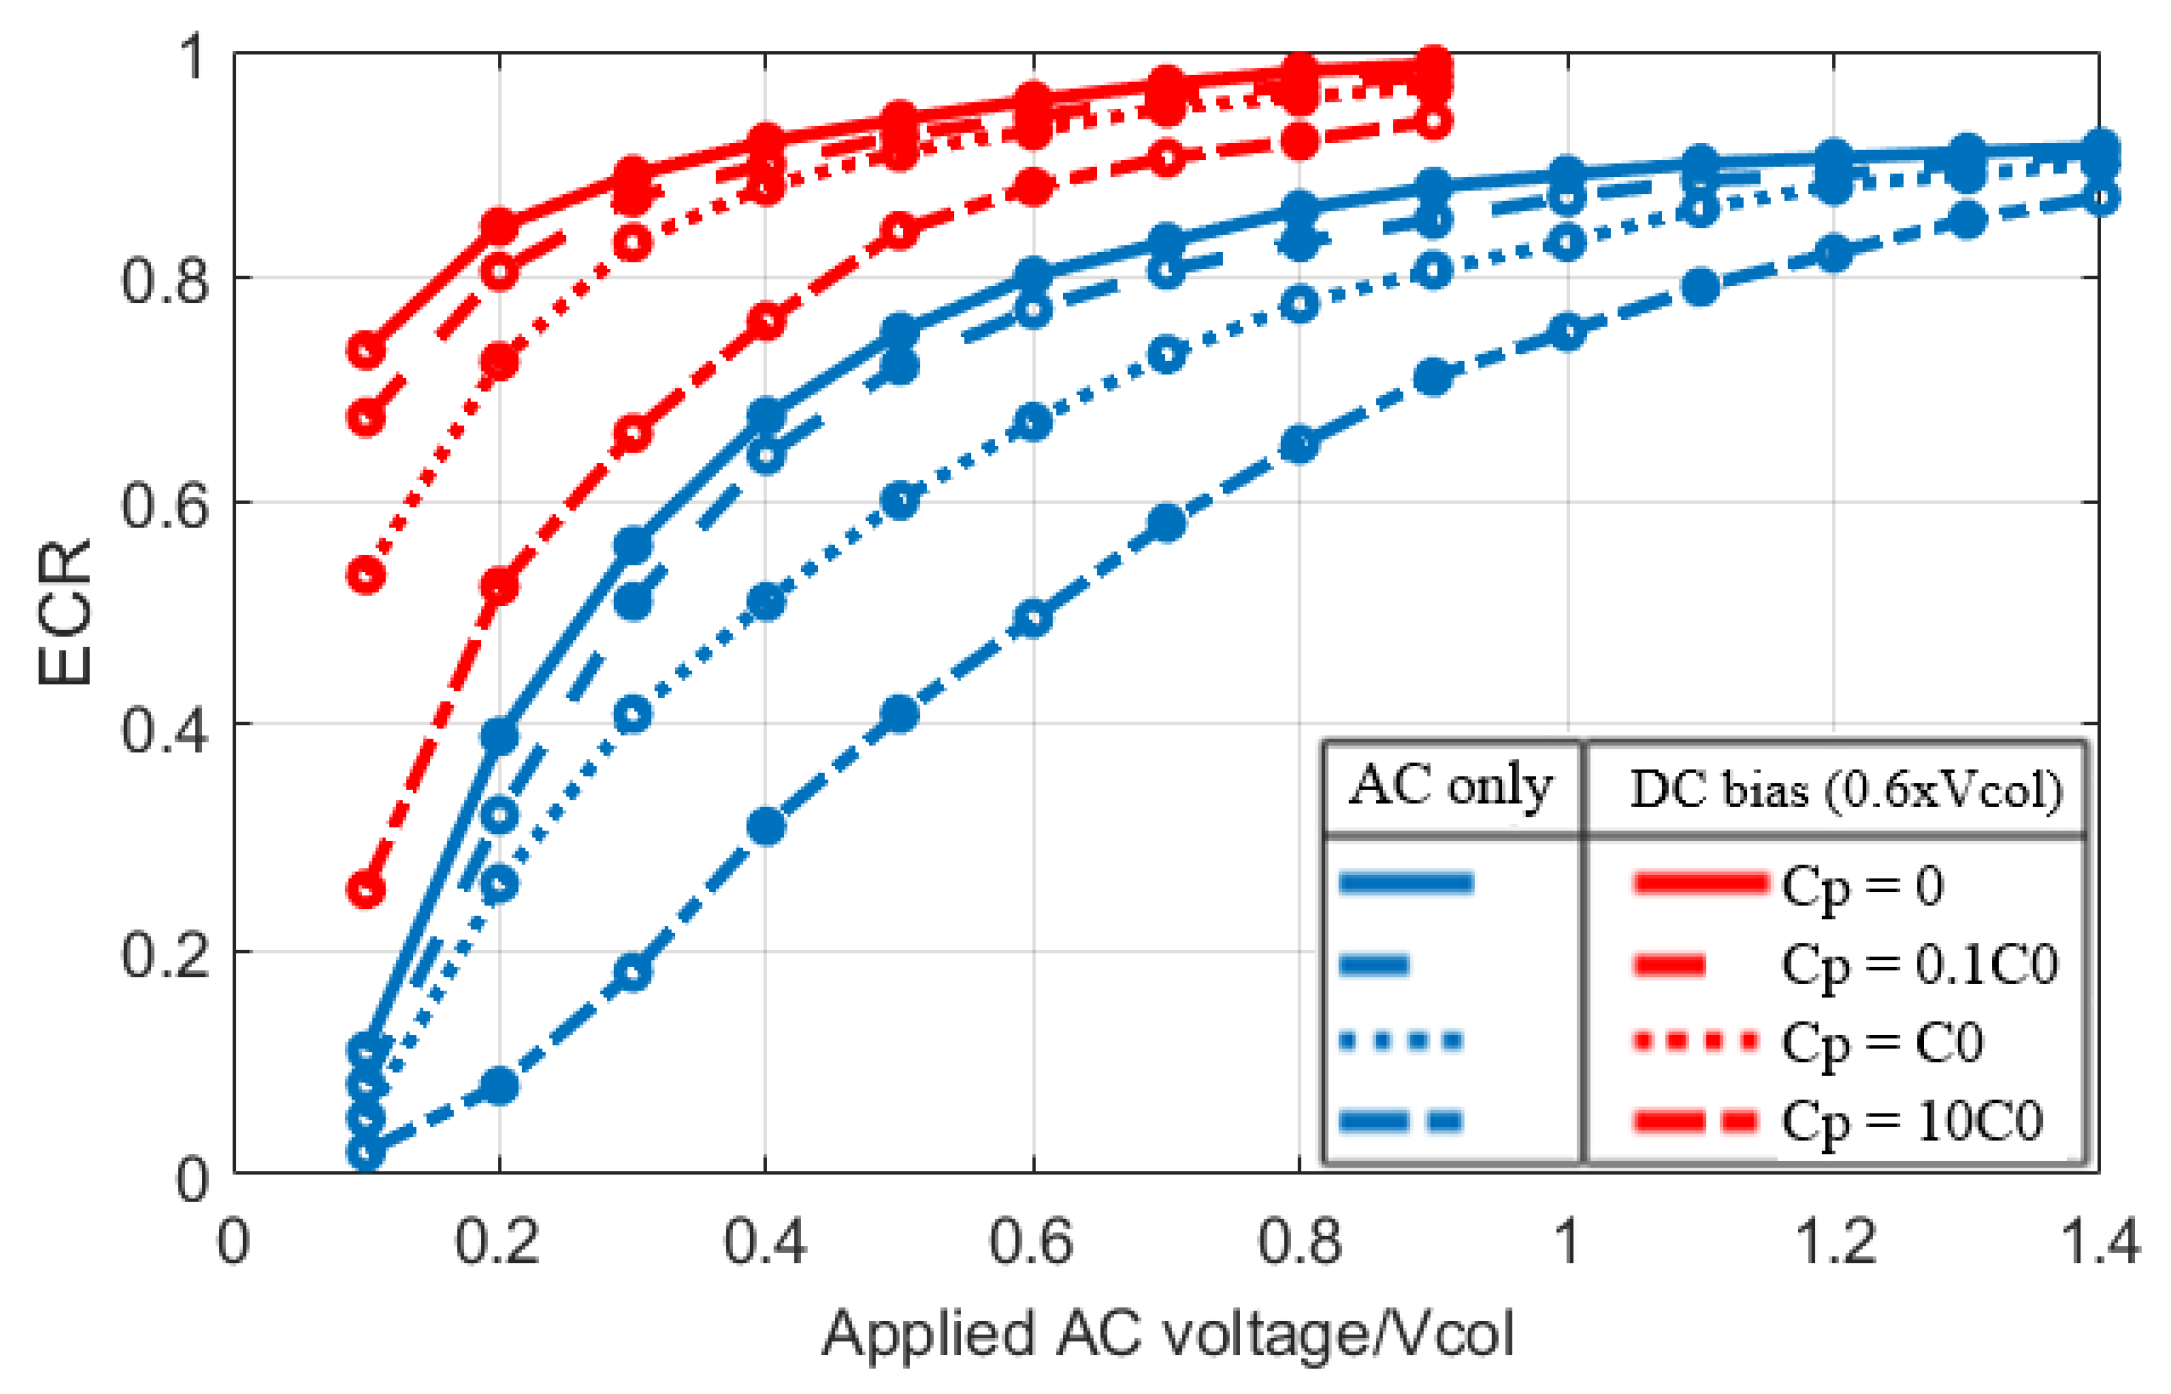
5. Large Signal Operation
Impact of Parasitic Capacitance on ECR
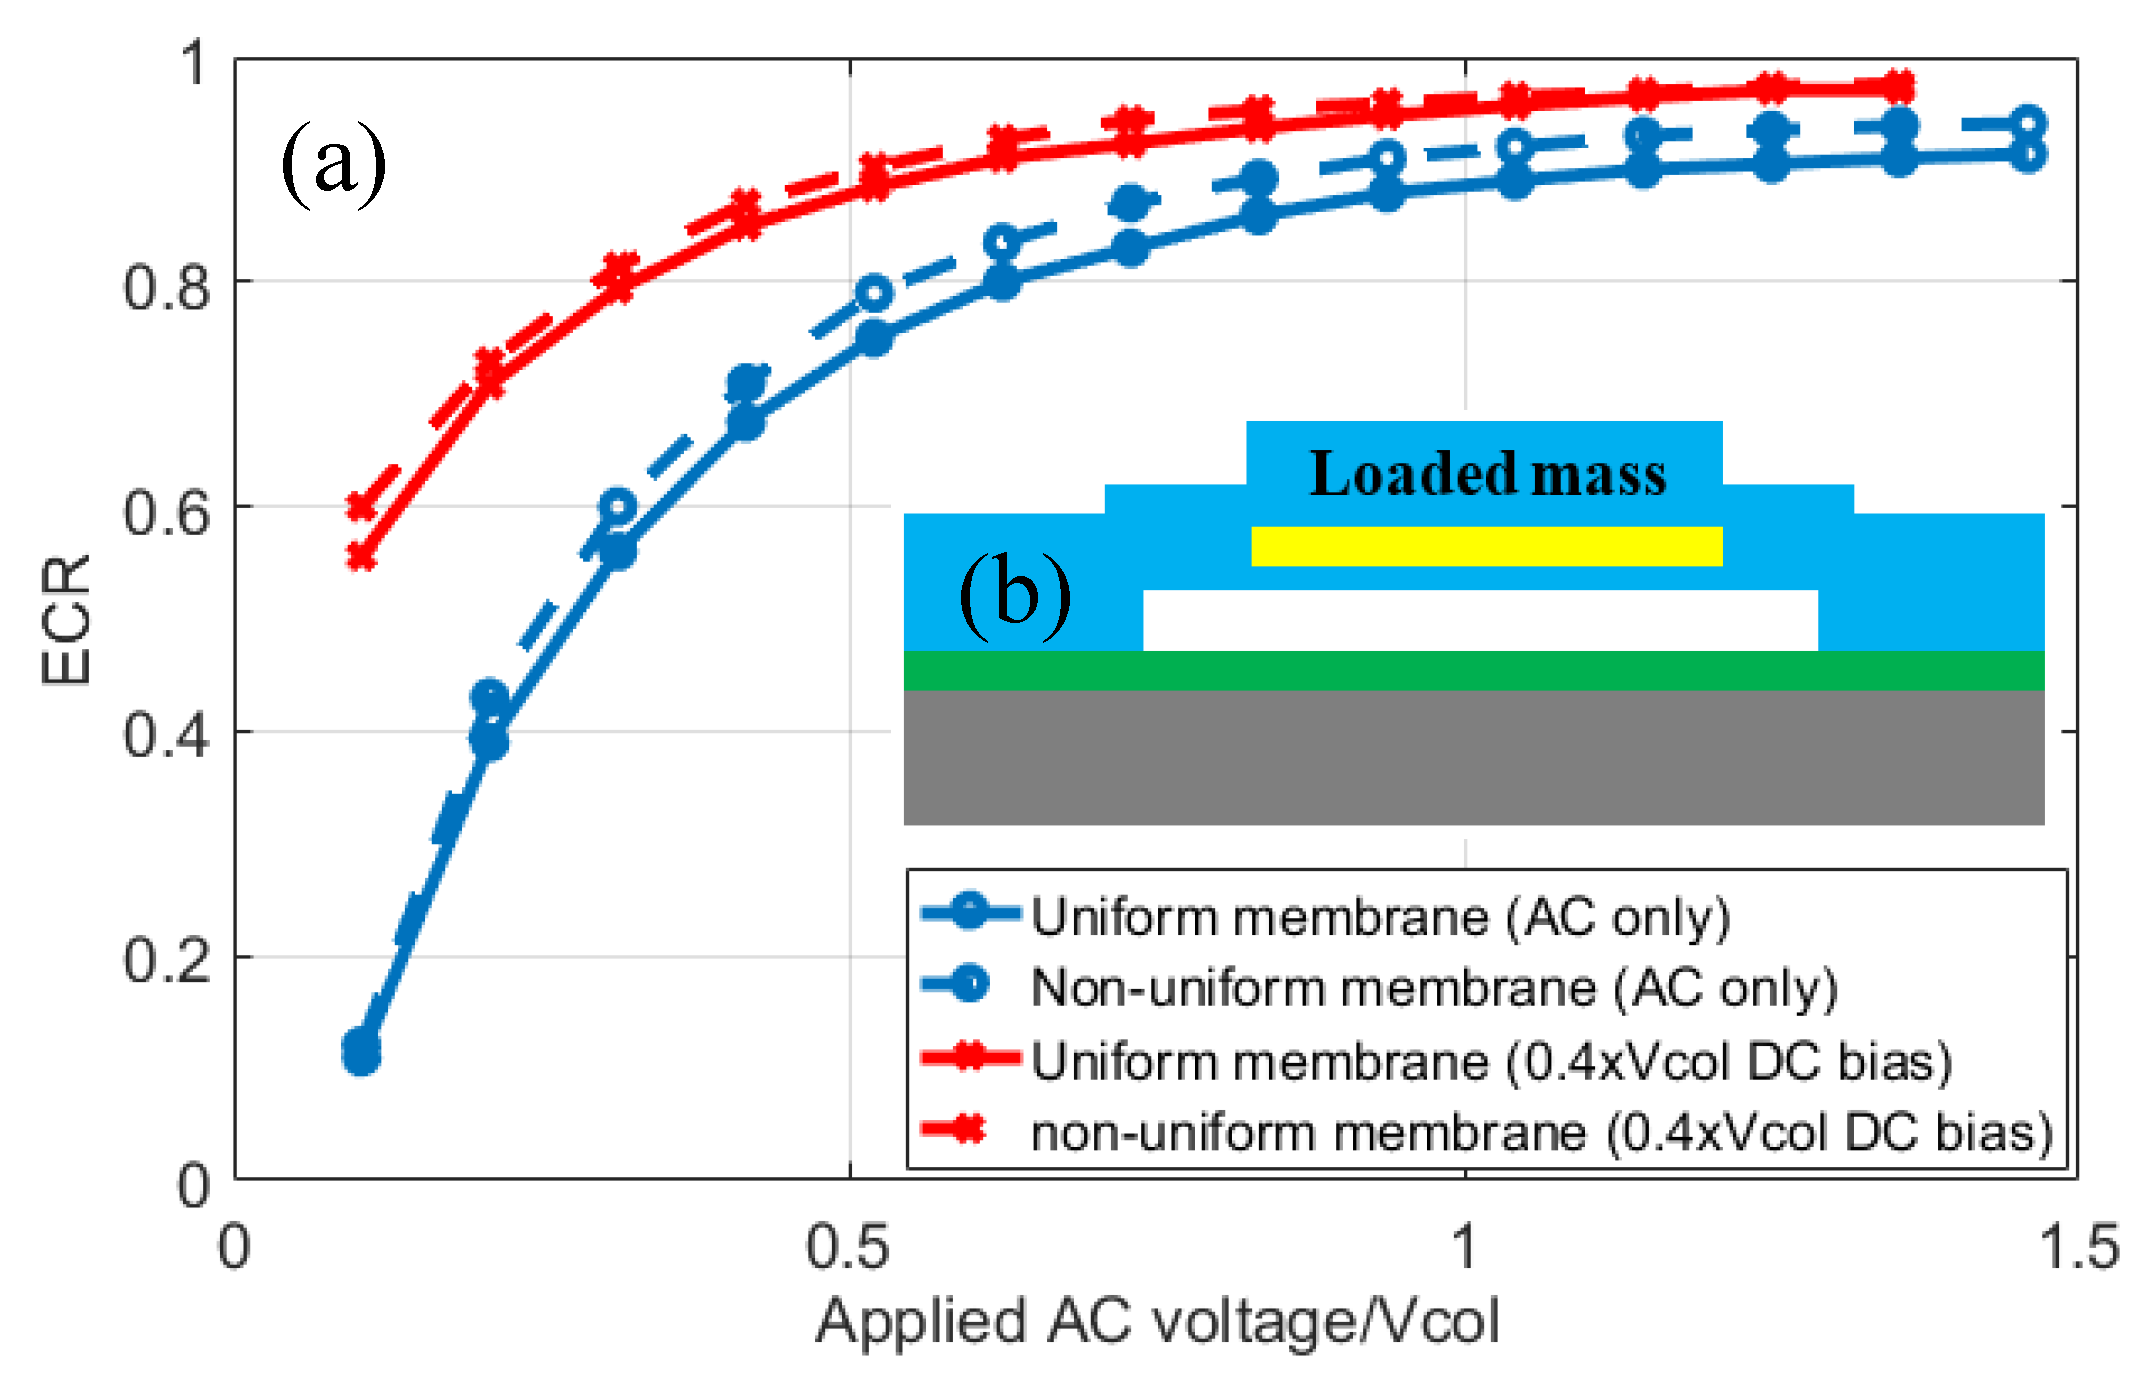
6. ECR Application: Mass Loaded and Uniform Membrane Performance Comparison
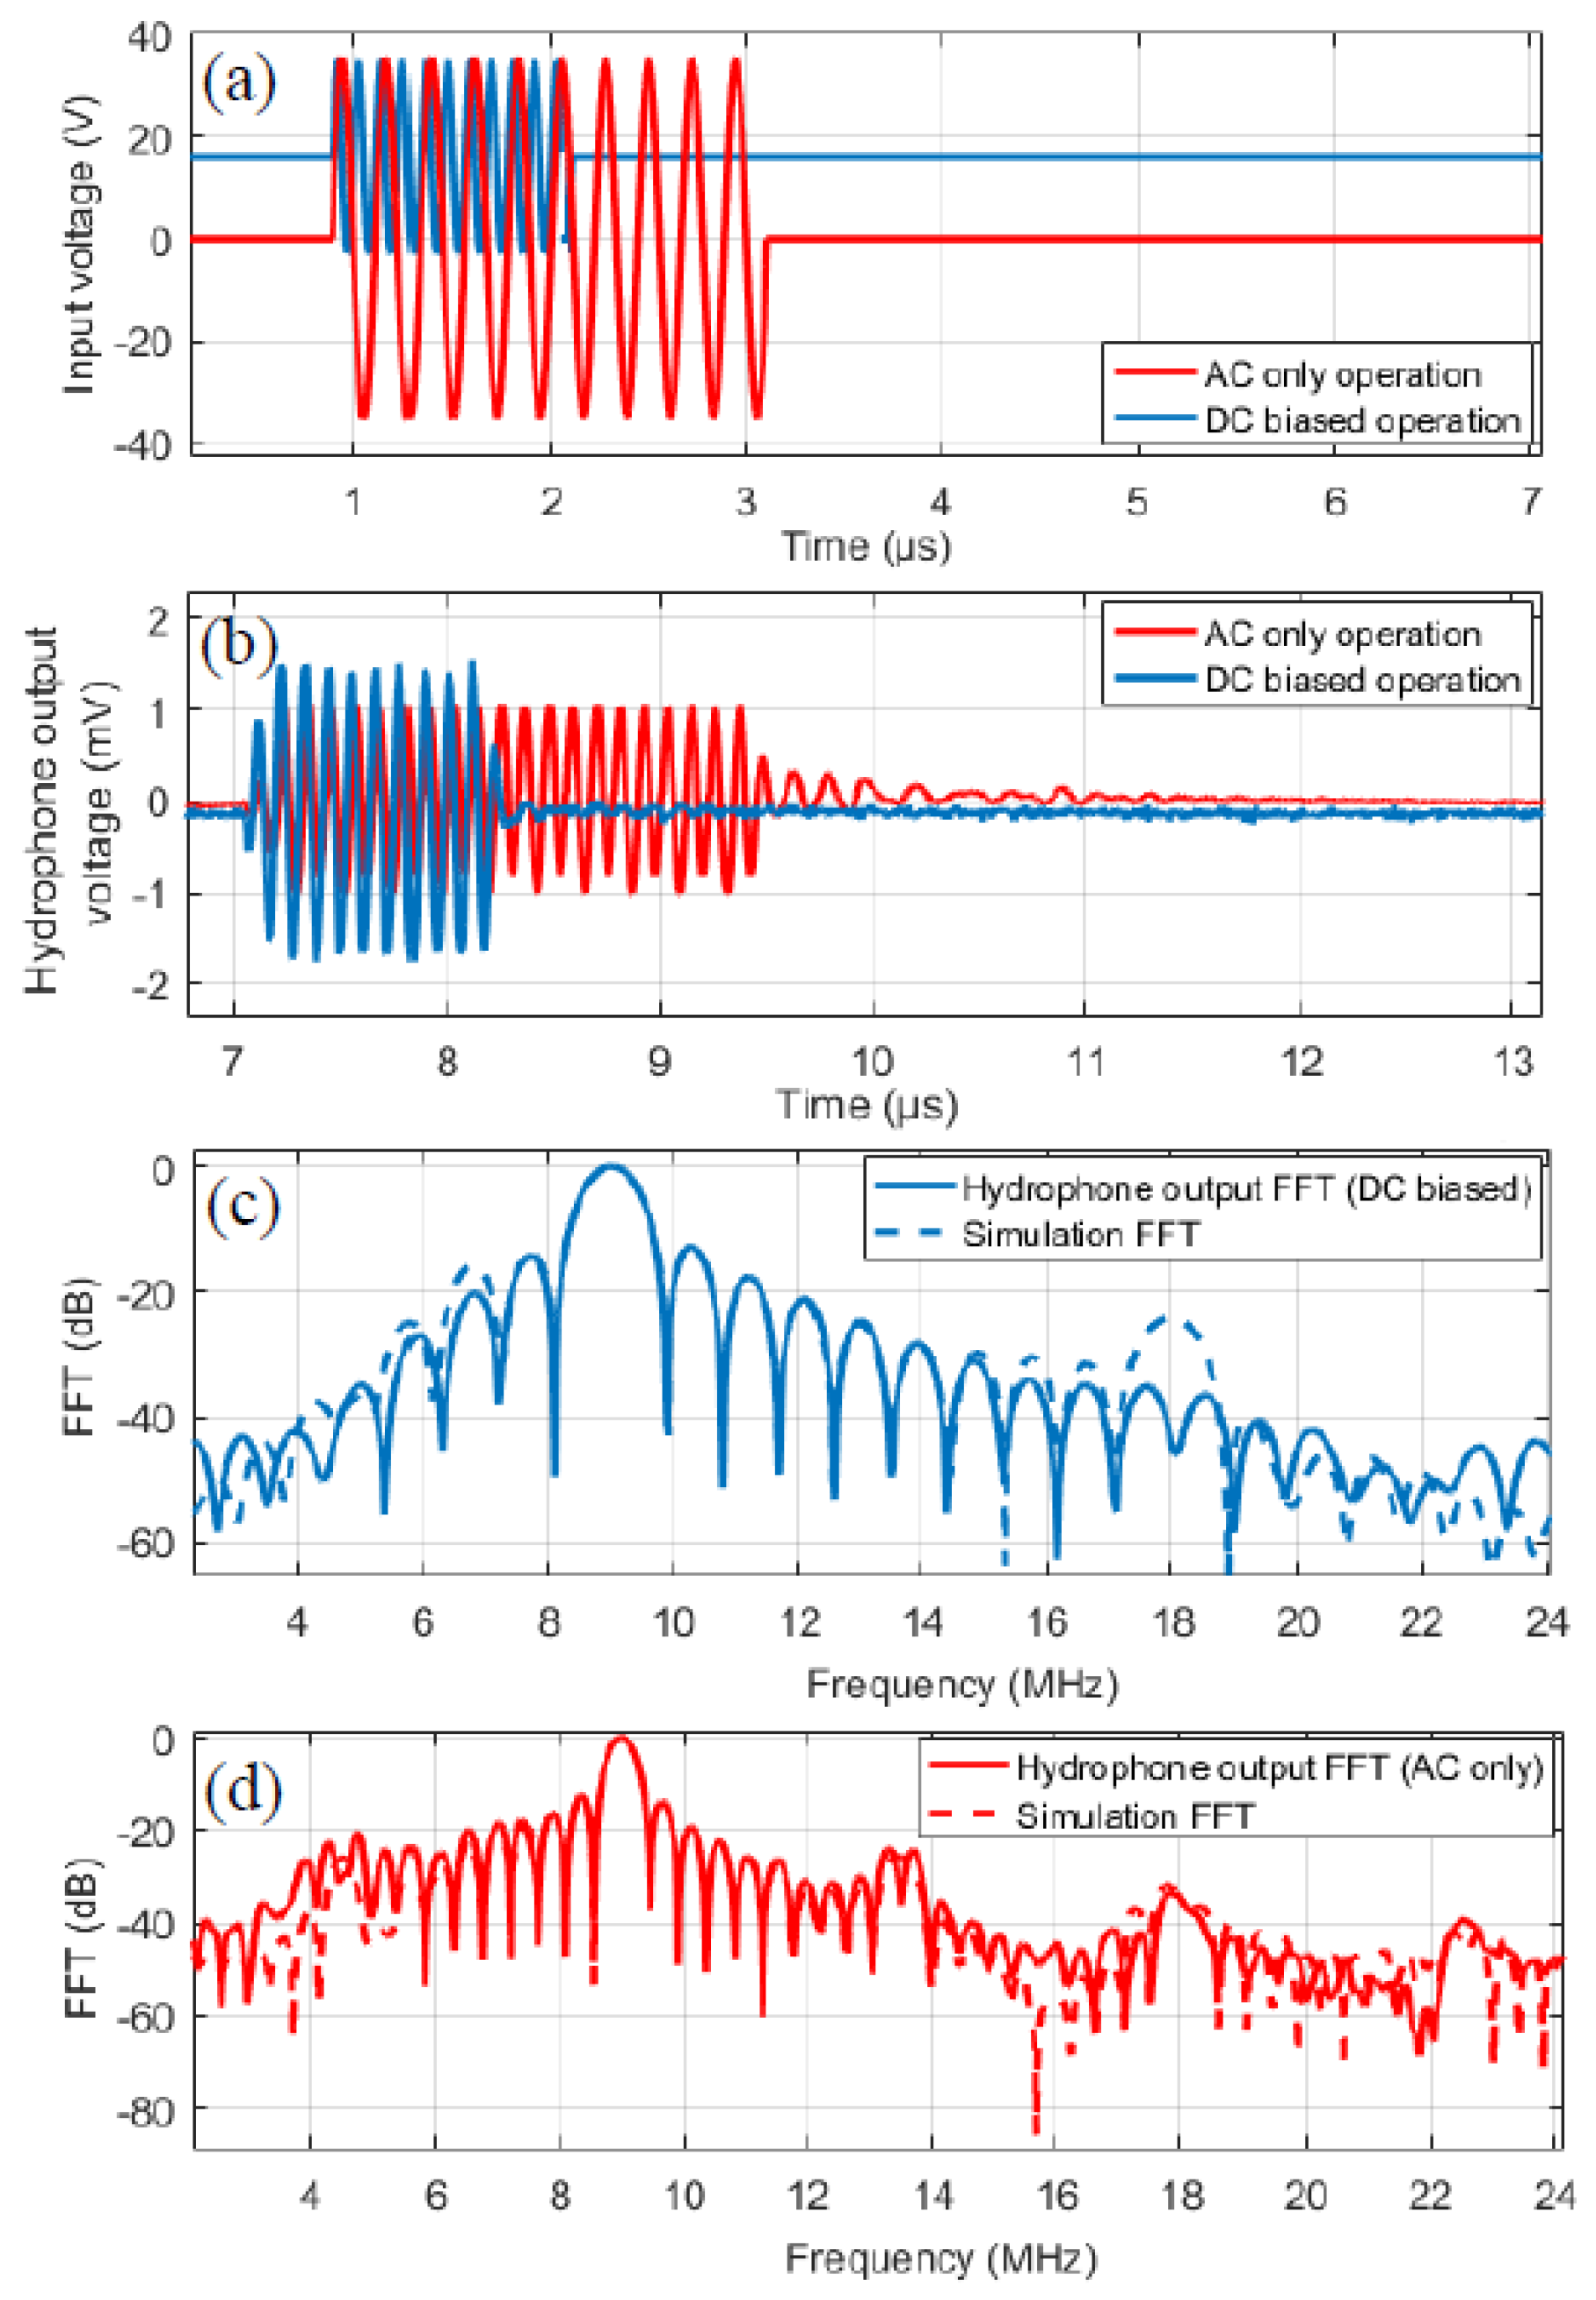
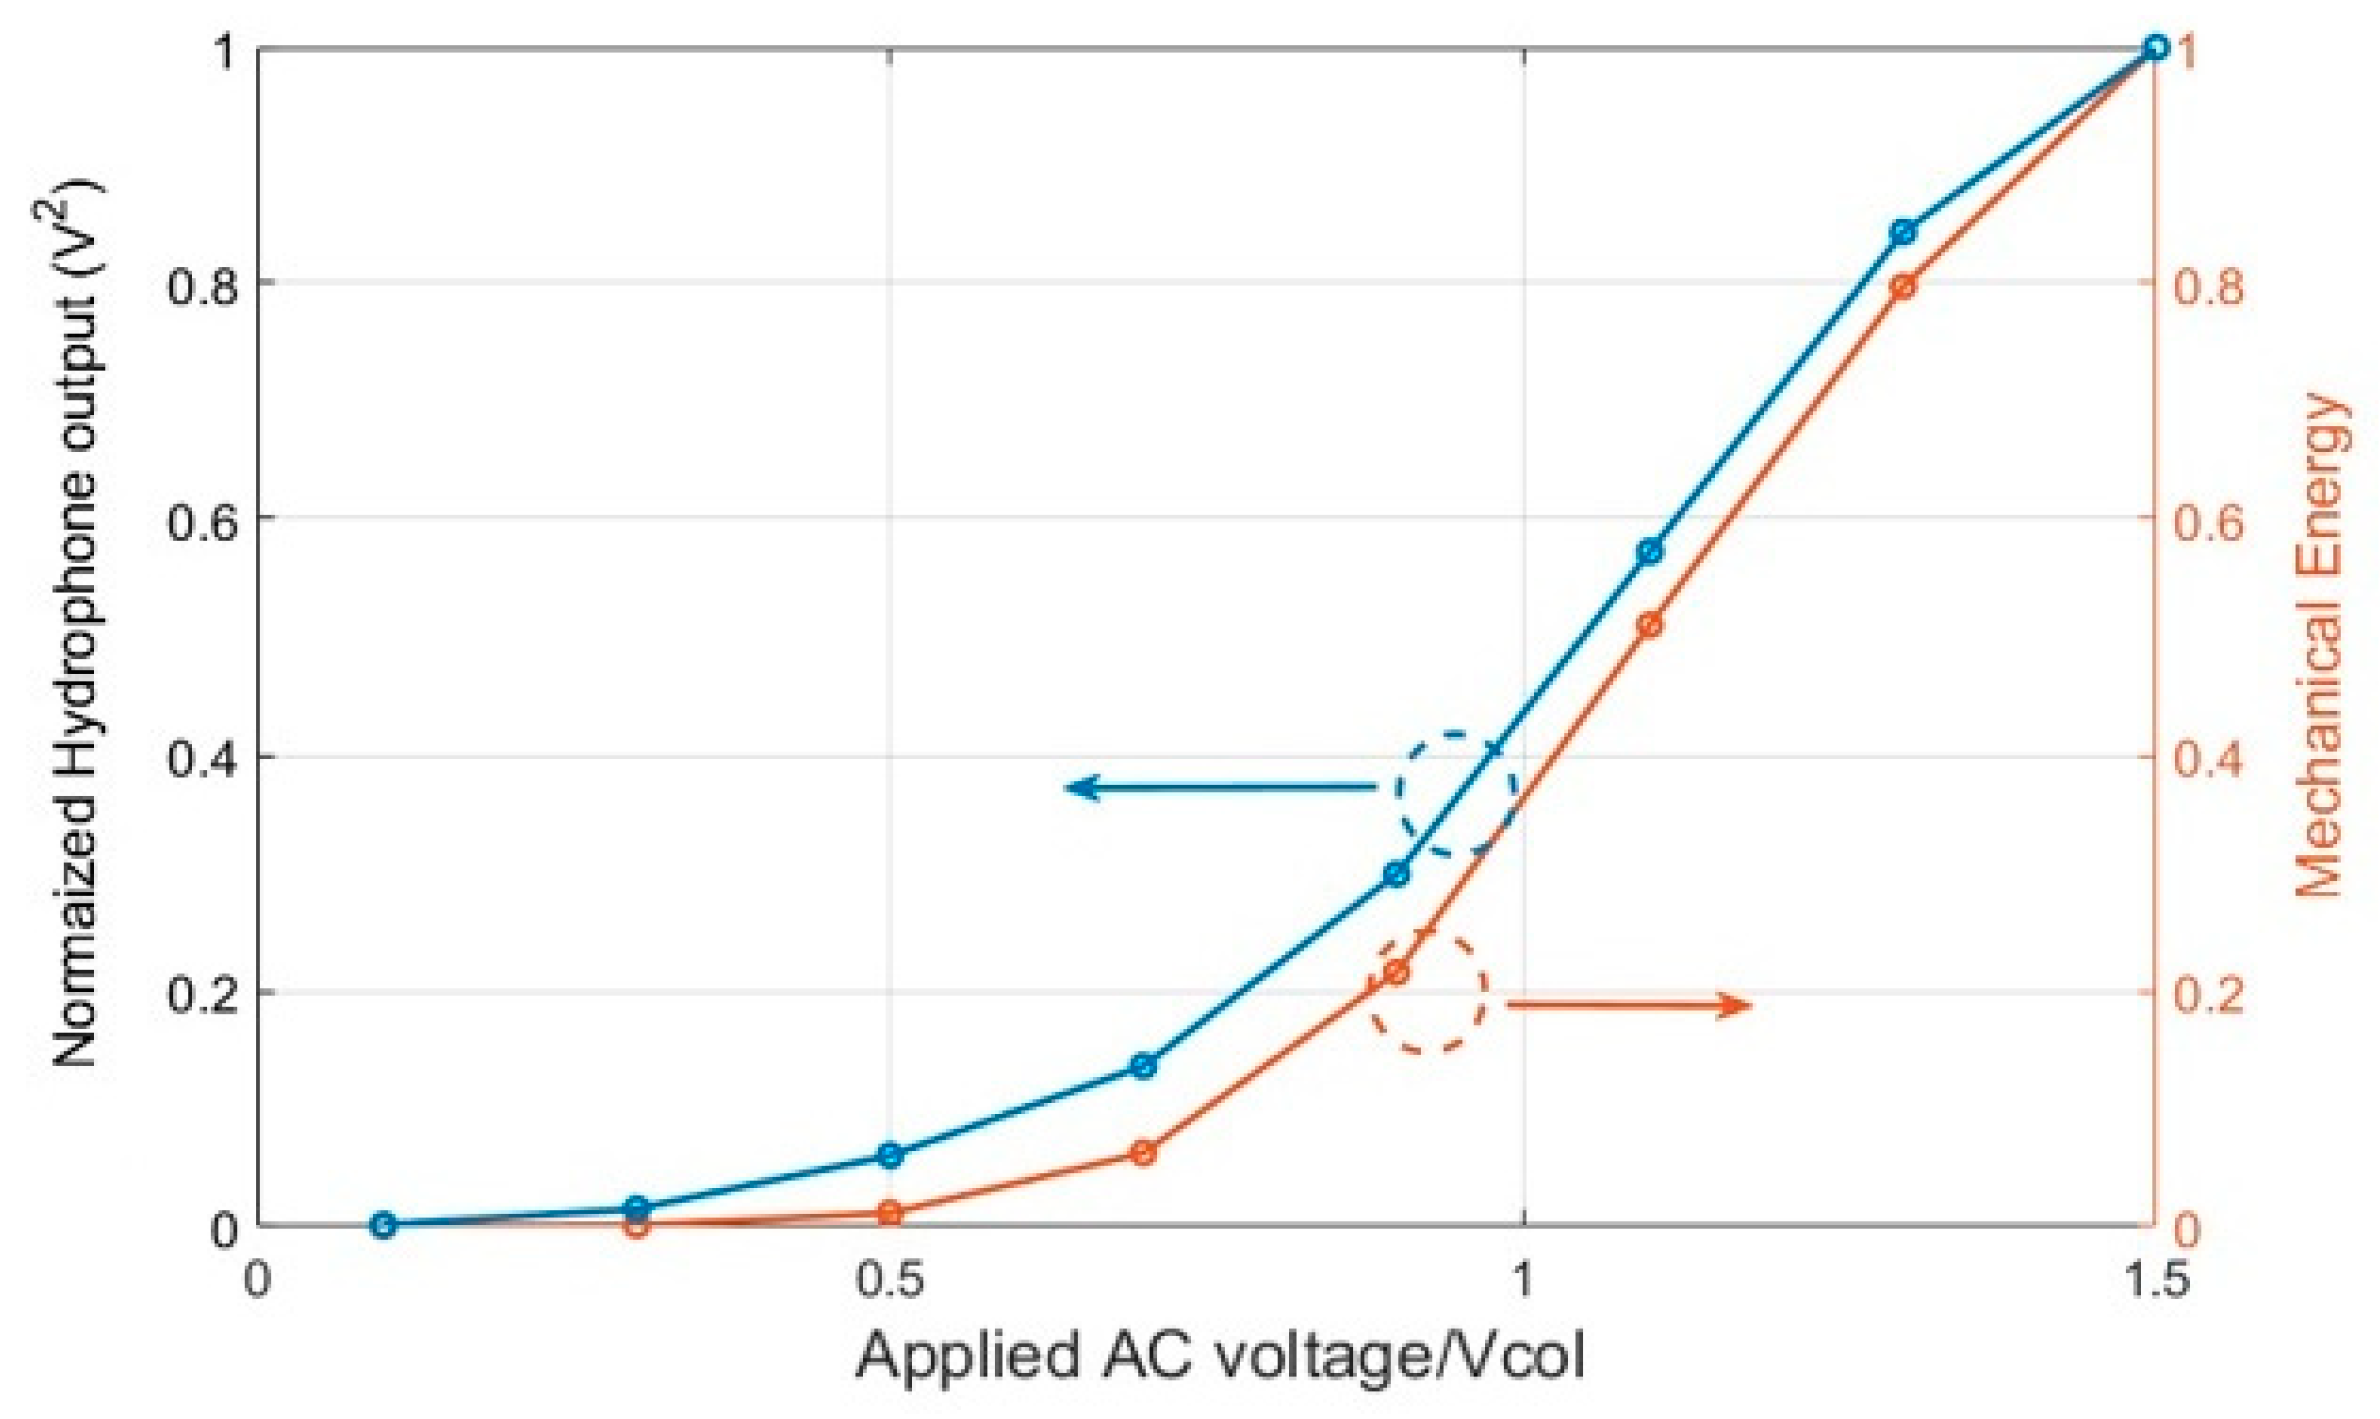
7. Experimental Validation of Mechanical Energy Output
8. Conclusions
Author Contributions
Funding
Acknowledgments
Conflicts of Interest
Appendix A

References
- Hunt, F. Electroacoustics; The Analysis of Transduction, and Its Historical Background; Harvard University Press: Cambridge, UK, 1954. [Google Scholar]
- Sherman, C.H.; Butler, J.L. Transducers and Arrays for Underwater Sound; Springer: New York, NY, USA, 2007. [Google Scholar]
- Caronti, A.; Carotenuto, R.; Pappalardo, M. Electromechanical coupling factor of capacitive micromachined ultrasonic transducers. J. Acoust. Soc. Am. 2003, 113, 279–288. [Google Scholar] [CrossRef] [PubMed]
- Yaralioglu, G.G.; Ergun, A.S.; Bayram, B.; Hæggstrom, E.; Khuri-Yakub, B.T. Calculation and Measurement of Electromechanical Coupling Coefficient of Capacitive Micromachined Ultrasonic Transducers. IEEE Trans. Ultrason. Ferroelectr. Freq. Control 2003, 50, 449–456. [Google Scholar] [CrossRef] [PubMed]
- Desilets, C.; Fraser, J.; Kino, G. The Design of Broadband and efficient Acoustic Wave Transducers. IEEE Trans. Sonics Ultrason. 1978, 25, 115–125. [Google Scholar] [CrossRef]
- Satir, S.; Zahourian, J.; Degertekin, F.L. Transmit Optimization of CMUTs in Non-Collapse Mode using a Transient Array Model. In Proceedings of the 2012 IEEE International Ultrasonics Symposium, Dresden, Germany, 7–10 October 2012; pp. 85–88. [Google Scholar]
- Wong, S.; Kupnik, M.; Butts-Pauly, K.; Khuri-Yakub, B. Advantages of Capacitive Micromachined Ultrasonics Transducers (CMUTs) for High Intensity Focused Ultrasound (HIFU). In Proceedings of the IEEE International Ultrasonics Symposium, New York, NY, USA, 28–31 October 2007; pp. 1313–1316. [Google Scholar]
- Illing, R.O.; Kennedy, J.E.; Wu, F.; Haar, G.R.; Protheroe, A.S.; Friend, P.J.; Gleeson, F.V.; Cranston, D.W.; Phillips, R.R.; Middleton, M.R. The safety and feasibility of extracorporeal high-intensity focused ultrasound (HIFU) for the treatment of liver and kidney tumours in a Western population. Br. J. Cancer 2005, 93, 890–895. [Google Scholar] [CrossRef] [PubMed]
- Bawiec, C.; N’Djin, W.; Bouchoux, G.; Sénégond, N.; Guillen, N.; Chapelon, Y. Preliminary investigation of dual mode CMUT probe for ultrasound image guided HIFU therapy. In Proceedings of the IEEE International Ultrasonics Symposium, Washington, DC, USA, 6–9 September 2017. [Google Scholar]
- Yamaner, F.Y.; Olçum, S.; Oğuz, H.K.; Bozkurt, A.; Köymen, H.; Atalar, A. High-Power CMUTs: Design and Experimental Verification. IEEE Trans. Ultrason. Ferroelectr. Freq. Control 2012, 59, 1276–1284. [Google Scholar] [CrossRef] [PubMed]
- Satir, S.; Degertekin, F.L. Harmonic Reduction in Capacitive Micromachined Ultrasonic Transducers by Gap Feedback Linearization. IEEE Trans. Ultrason. Ferroelectr. Freq. Control 2012, 59, 50–59. [Google Scholar] [CrossRef] [PubMed]
- Knight, J.; Degertekin, F. Cpacitive Micromachined Ultrasonic Treansducers for Forward Looking Intravascular Imaging Arrays. In Proceedings of the IEEE International Ultrasonics Symposium, Munich, Germany, 8–11 October 2002; pp. 1079–1082. [Google Scholar]
- Satir, S.; Zahorian, J.; Degertekin, F.L. A Large-Signal Model for CMUT Arrays with Arbitrary Membrane Geometry Operating in Non-Collapsed Mode. IEEE Trans. Ultrason. Ferroelectr. Freq. Control 2013, 60, 2426–2439. [Google Scholar] [CrossRef] [PubMed]
- Satir, S.; Degertekin, F.L. A Nonlinear Lumped Model for Ultrasound Systems Using CMUT Arrays. IEEE Trans. Ultrason. Ferroelectr. Freq. Control 2015, 62, 1865–1879. [Google Scholar] [CrossRef] [PubMed]
- Desoer, C.A.; Kuh, E.S. Basic Circuit Theory; McGraw-Hill Inc.: New York, NY, USA, 1969; pp. 793–795. [Google Scholar]
- Eccardt, P.; Niederer, K.; Fischer, B. Micromachined Transducers for Ultrasound Applications. In Proceedings of the IEEE International Ultrasonics Symposium, Munich, Germany, 5–8 October 1997; pp. 1609–1618. [Google Scholar]
- Zhang, X.; Yamaner, F.Y.; Oralkan, O. Fabrication of Vacuum-Sealed Capacitive Micromachined Ultrasonic Transducers with Through-Glass-Via Interconnects Using Anodic Bonding. J. Microelectromech. Syst. 2017, 26, 226–234. [Google Scholar] [CrossRef]
- Knight, J.; McLean, J.; Degertekin, L. Low temperature fabrication of immersion capacitive micromachined ultrasonic transducers on silicon and dielectric substrates. IEEE Trans. Ultrason. Ferroelectr. Freq. Control 2004, 51, 1324–1333. [Google Scholar] [CrossRef]
- Zahorian, J.; Hochman, M.; Xu, T.; Satir, S.; Gurun, G.; Karaman, M.; Degertekin, F.L. Monolithic CMUT on-CMOS integration for intravascular ultrasound applications. IEEE Trans. Ultrason. Ferroelectr. Freq. Control 2011, 58, 2659–2667. [Google Scholar] [CrossRef] [PubMed]
- Kinsler, L.; Frey, A.; Coppens, A.; Sanders, J. Fundamentals of Acoustics; John Wiley and Sons, Inc.: New York, NY, USA, 2000. [Google Scholar]
- Pirouz, A.; Degertekin, F.L. Low Temperature CMUT Fabrication Process with Dielectric Lift-off Membrane Support for Improved Reliability. J. Micromech. Microeng. 2018, 28, 085006. [Google Scholar] [CrossRef] [PubMed]


| Formula | Notes |
|---|---|
| Short circuit resonance frequency , and open circuit resonance . [1,2] | |
[1,2] | |
| is the mechanical work done by the transducer and is the total input energy [2]. |
| Parameter | Value |
|---|---|
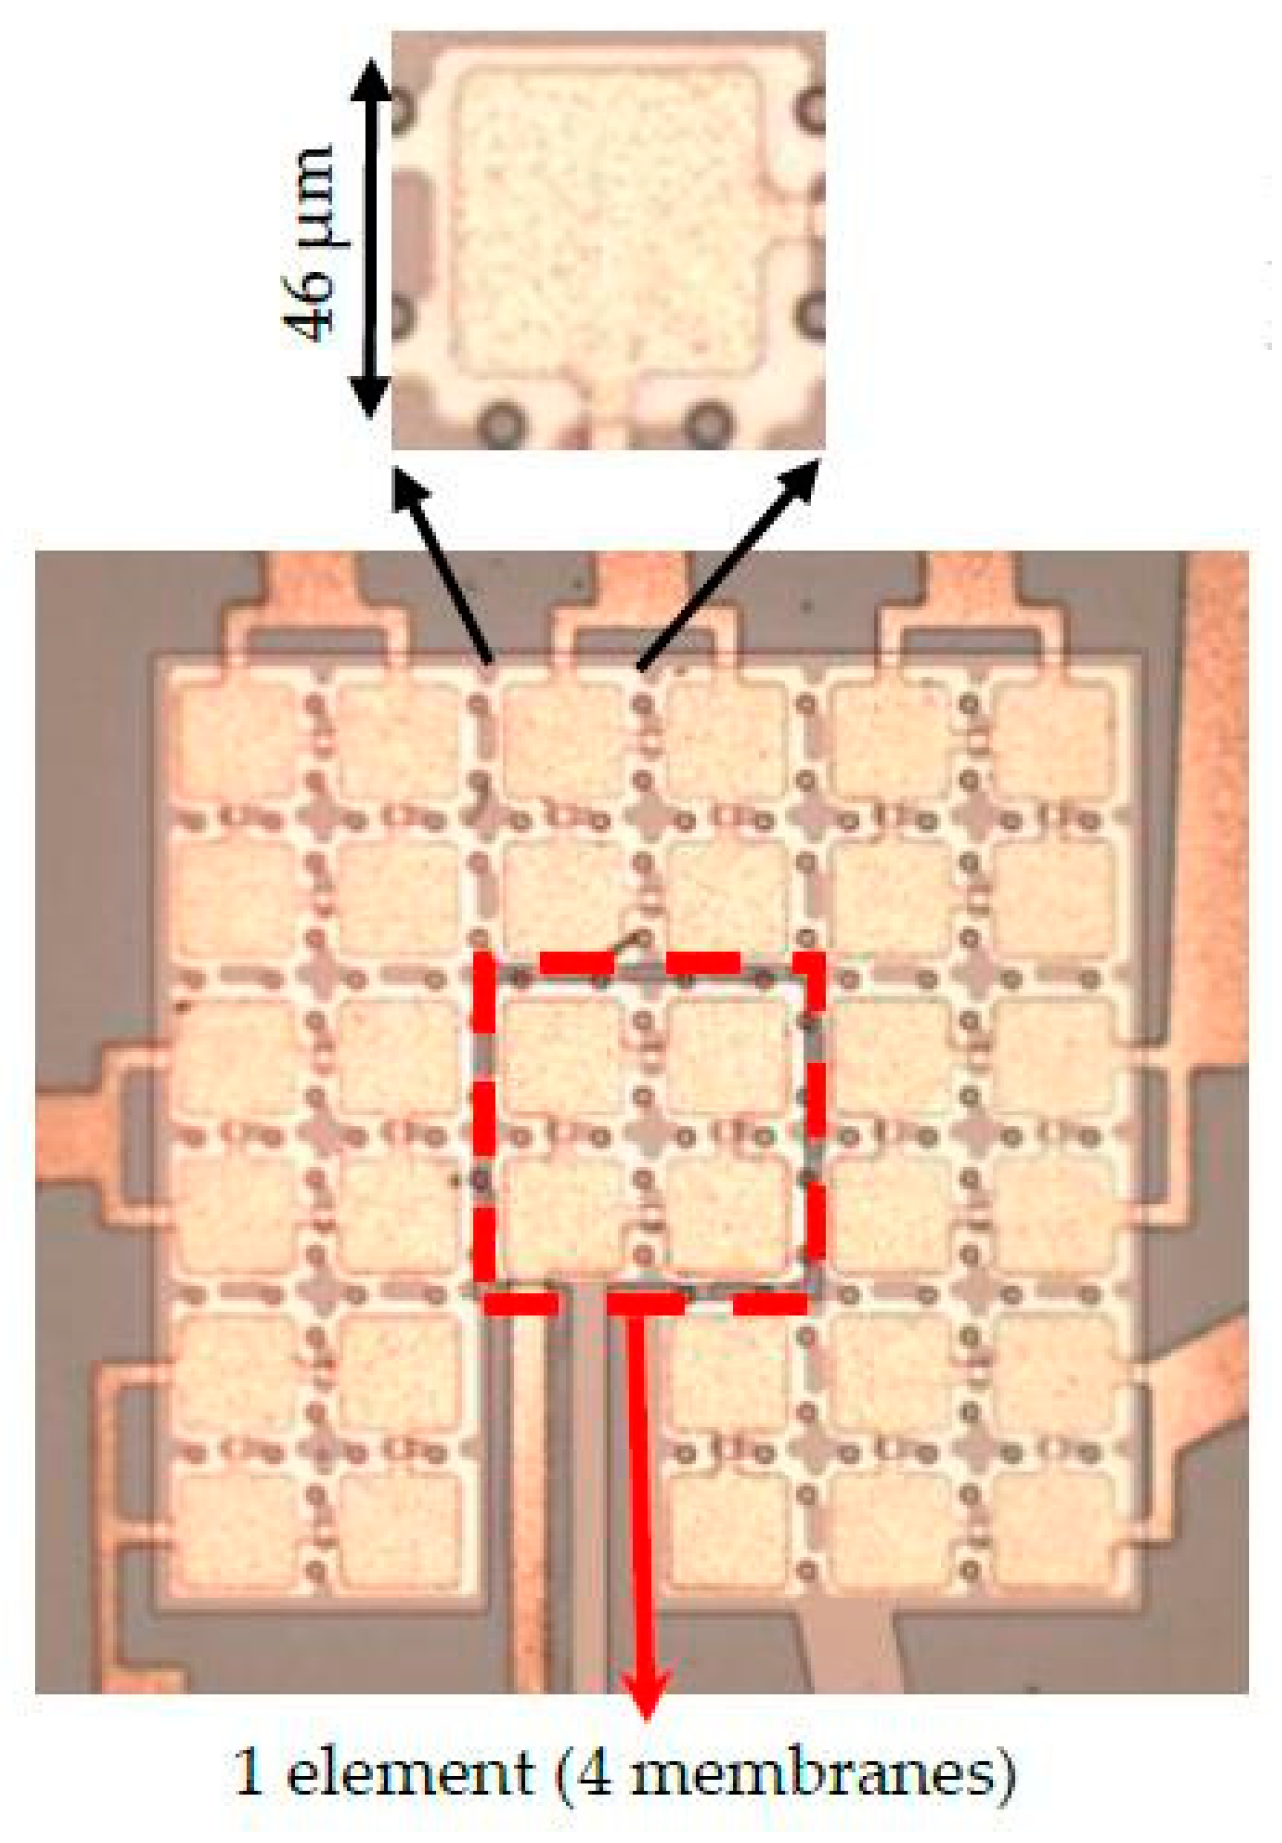
| Membrane size | 46 μm × 6 μm |
| Electrode area | 38 μm × 38 μm |
| Membrane thickness | 2.25 μm |
| Device center frequency | 9 MHz |
| Vacuum gap | 95 nm |
| Dielectric relative permittivity | 6.3 |
| SixNy isolation thickness | 250 nm |
| No. of membrane | 4 |
| Collapse voltage (Vcol) | 32 V |
| Membrane Poisson ratio | 0.22 |
| Membrane Young’s Modulus | 110 GPa |
| Membrane density | 2200 kg/m3 |
© 2019 by the authors. Licensee MDPI, Basel, Switzerland. This article is an open access article distributed under the terms and conditions of the Creative Commons Attribution (CC BY) license (http://creativecommons.org/licenses/by/4.0/).
Share and Cite
Pirouz, A.; Degertekin, F.L. An Analysis Method for Capacitive Micromachined Ultrasound Transducer (CMUT) Energy Conversion during Large Signal Operation. Sensors 2019, 19, 876. https://doi.org/10.3390/s19040876
Pirouz A, Degertekin FL. An Analysis Method for Capacitive Micromachined Ultrasound Transducer (CMUT) Energy Conversion during Large Signal Operation. Sensors. 2019; 19(4):876. https://doi.org/10.3390/s19040876
Chicago/Turabian StylePirouz, Amirabbas, and F. Levent Degertekin. 2019. "An Analysis Method for Capacitive Micromachined Ultrasound Transducer (CMUT) Energy Conversion during Large Signal Operation" Sensors 19, no. 4: 876. https://doi.org/10.3390/s19040876