Mining-Induced Time-Series Deformation Investigation Based on SBAS-InSAR Technique: A Case Study of Drilling Water Solution Rock Salt Mine

 ,
,
Abstract
:1. Introduction
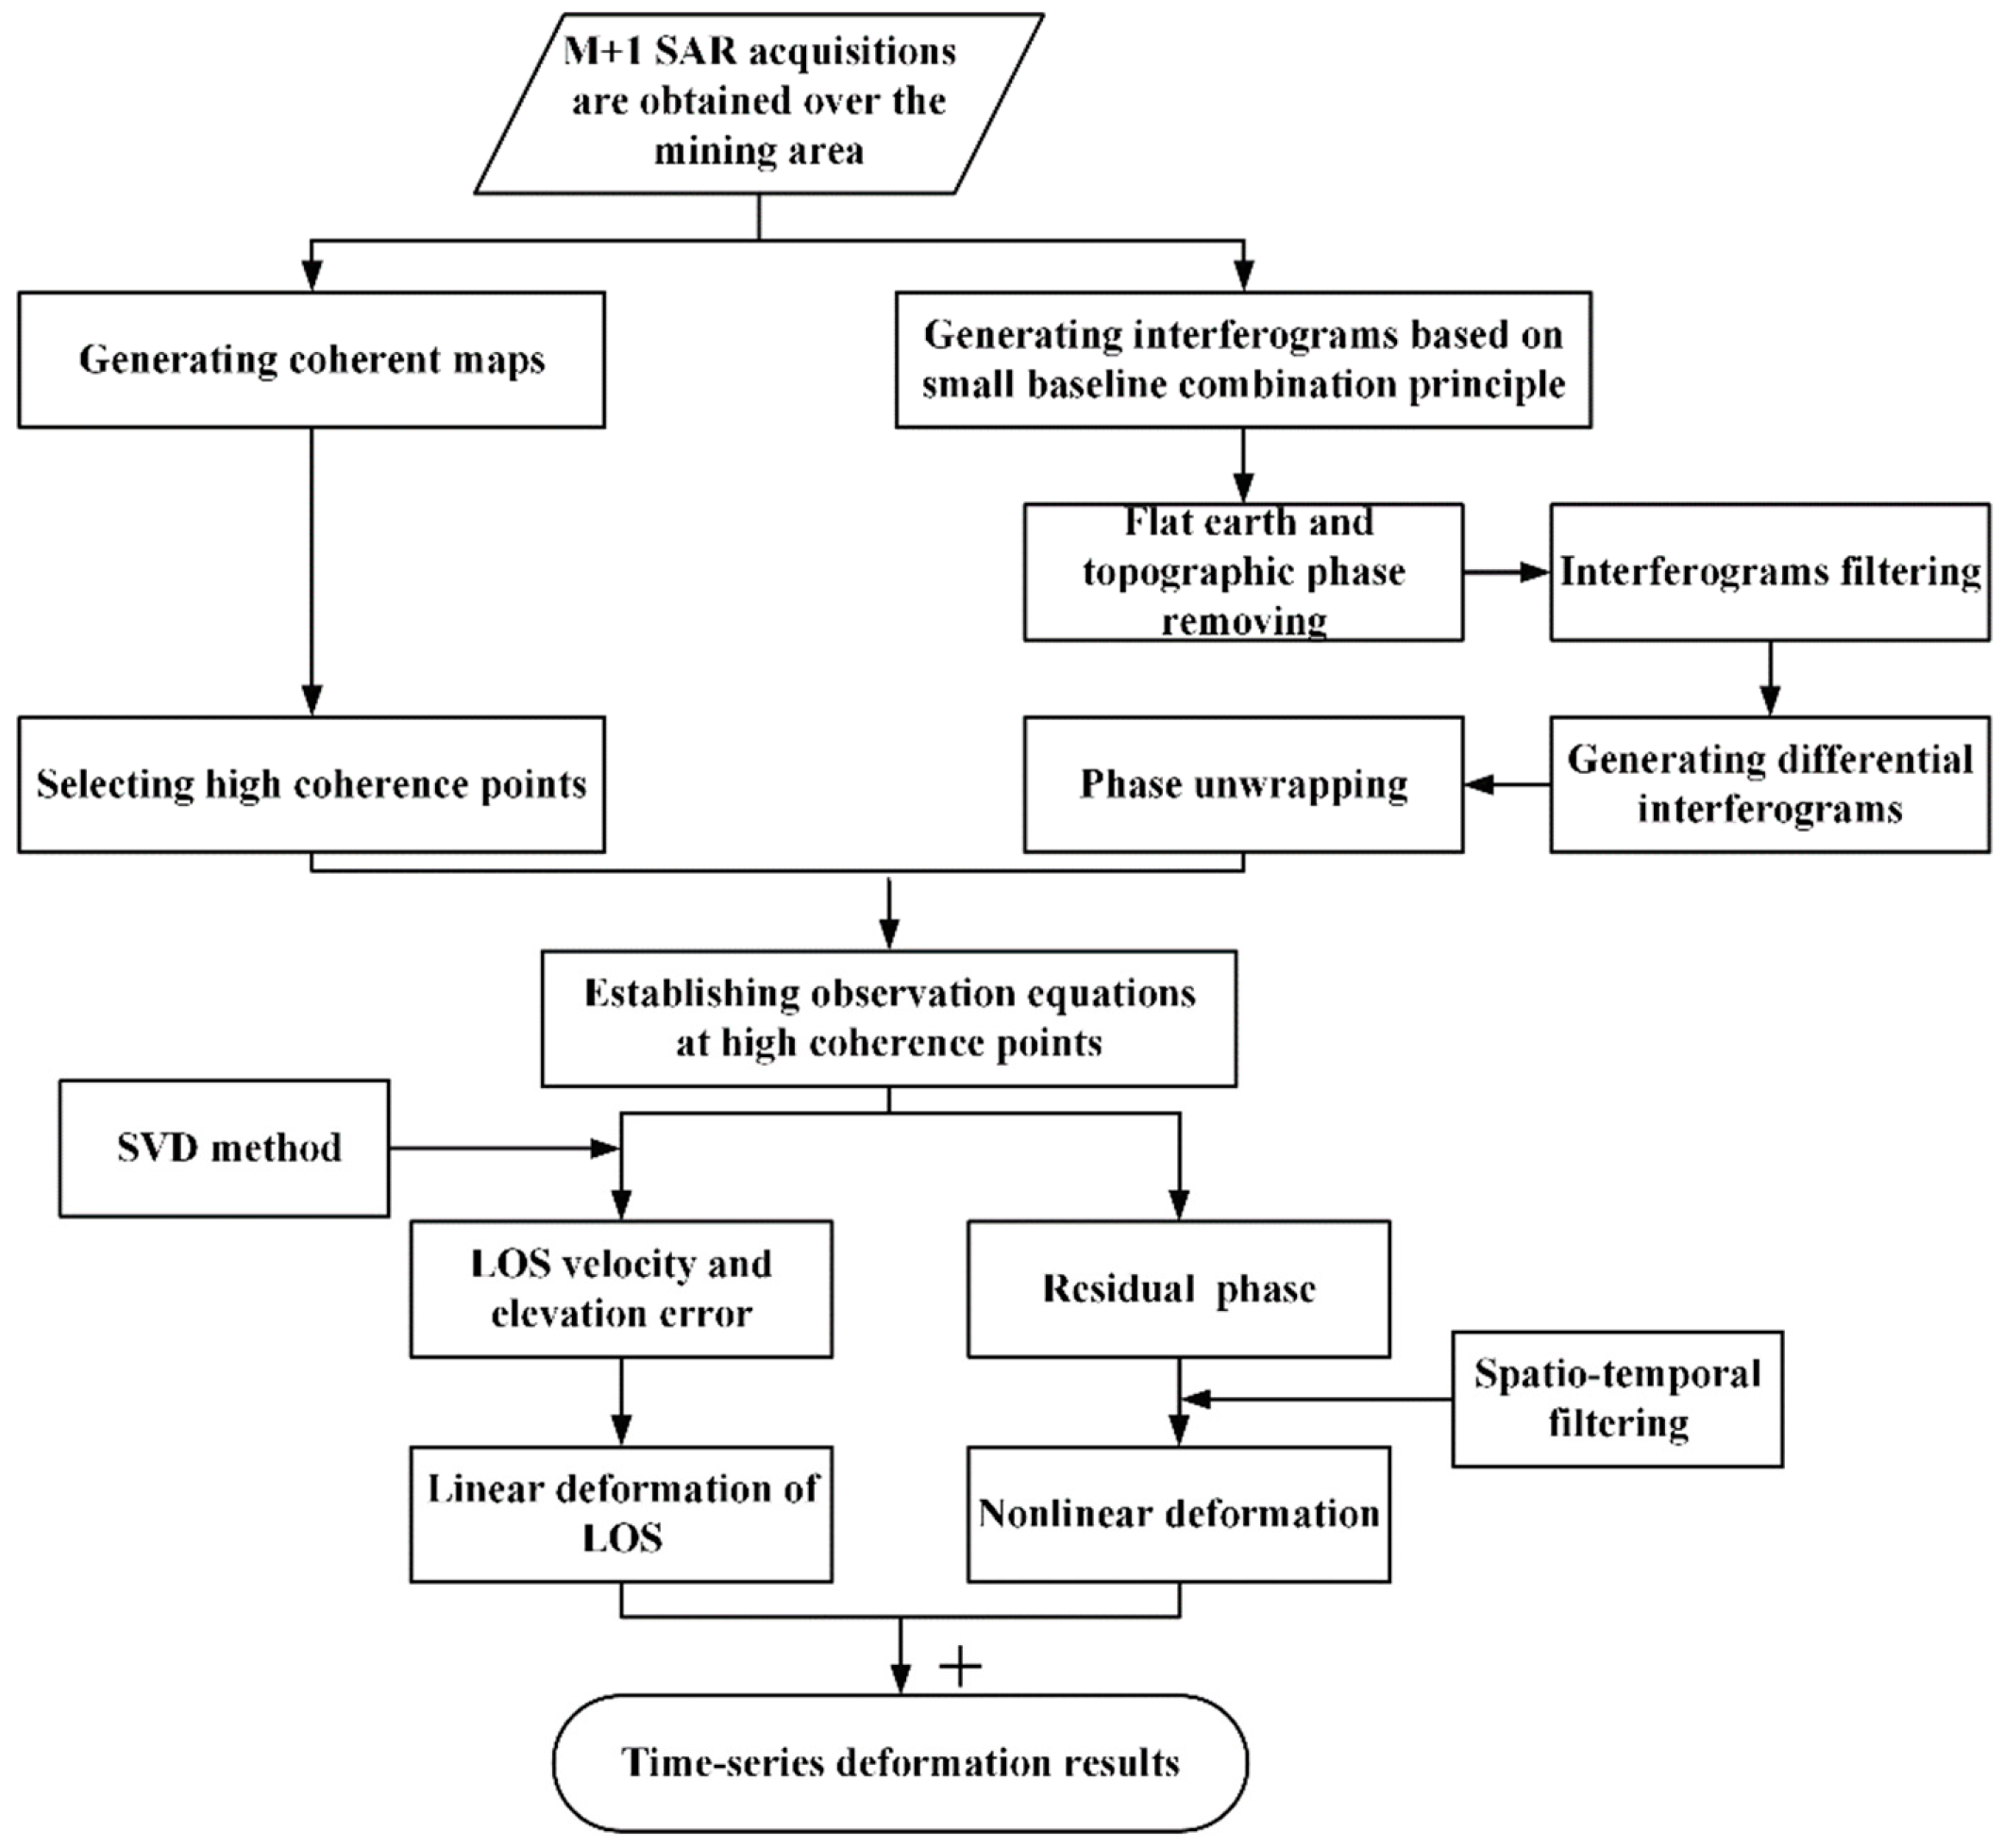
2. Methodology
3. Experiments
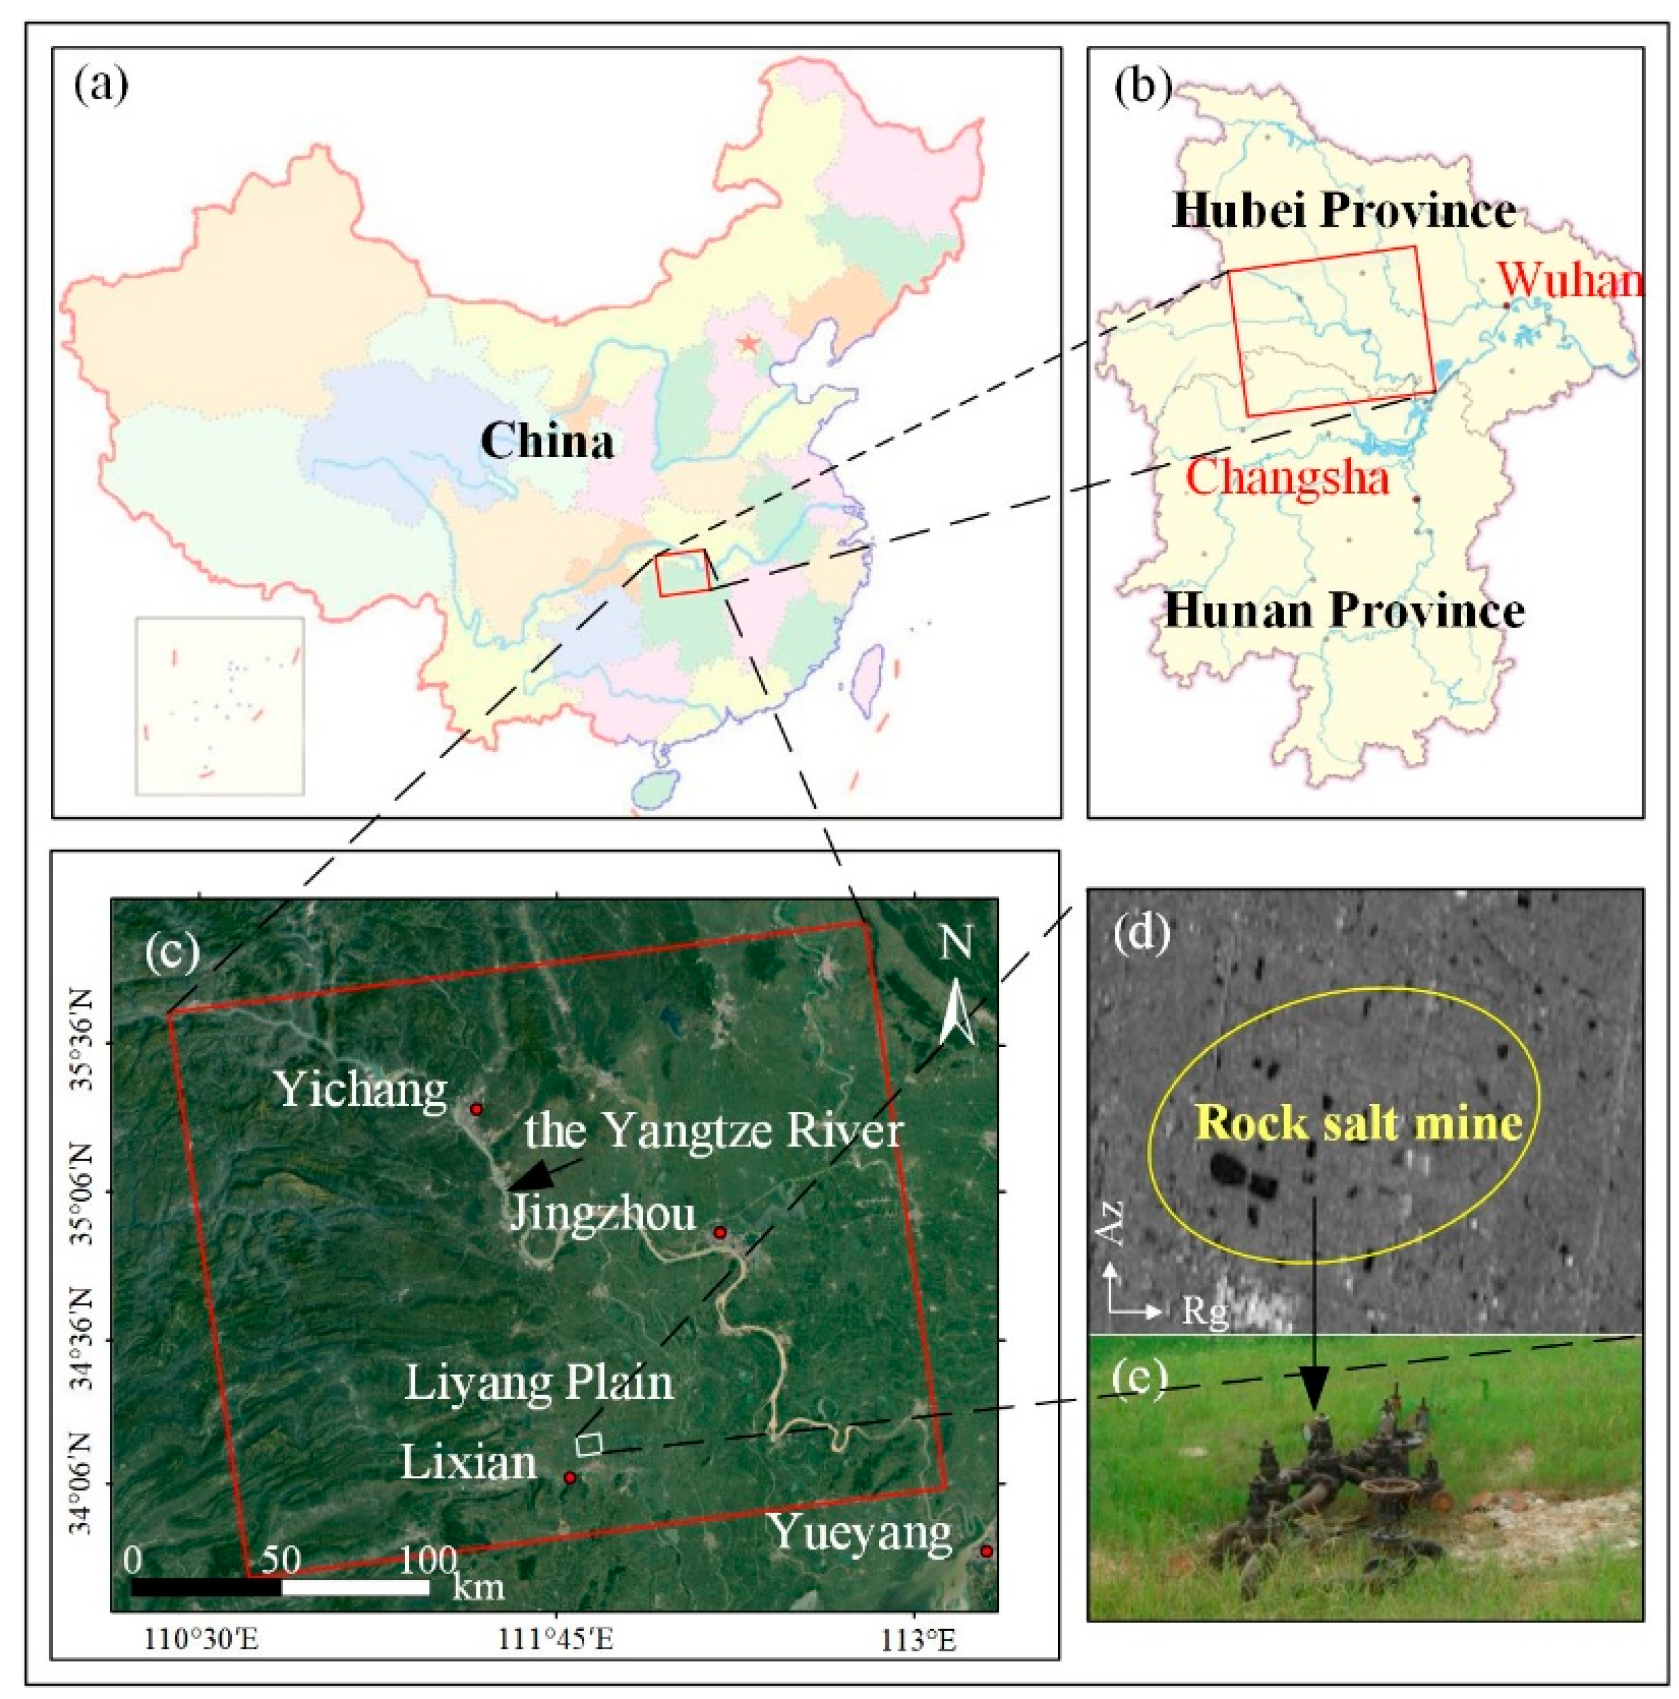
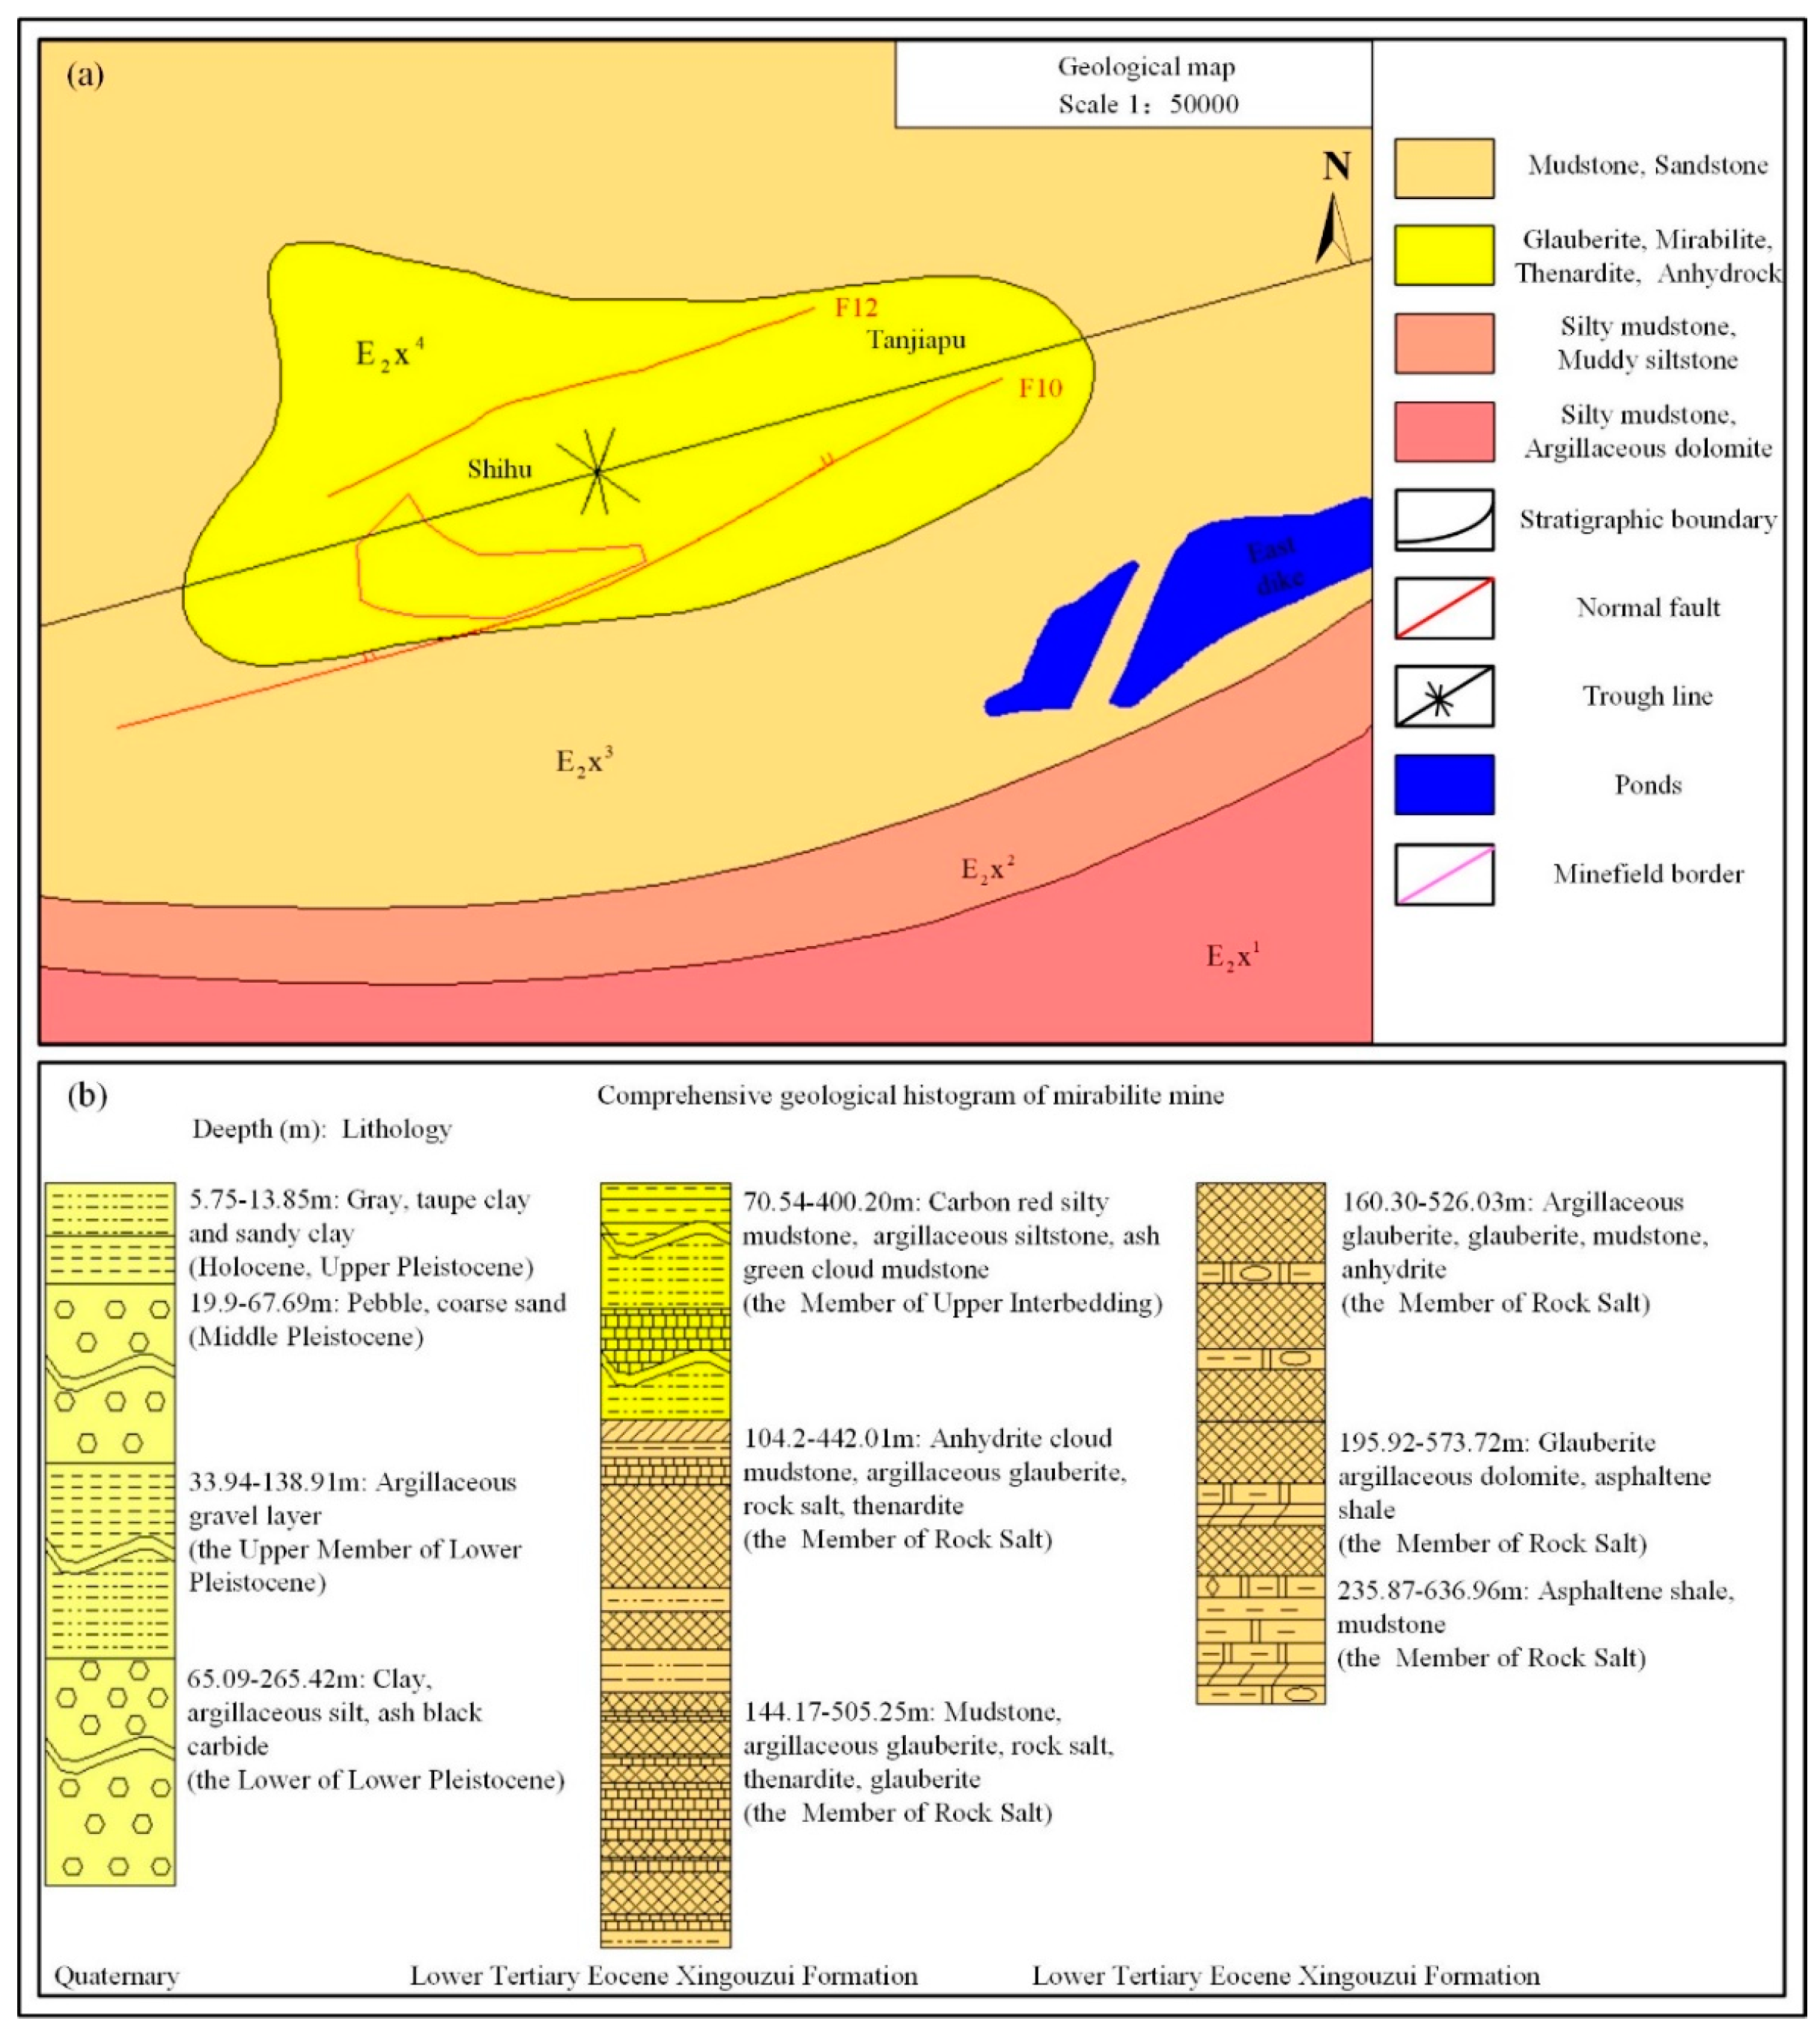
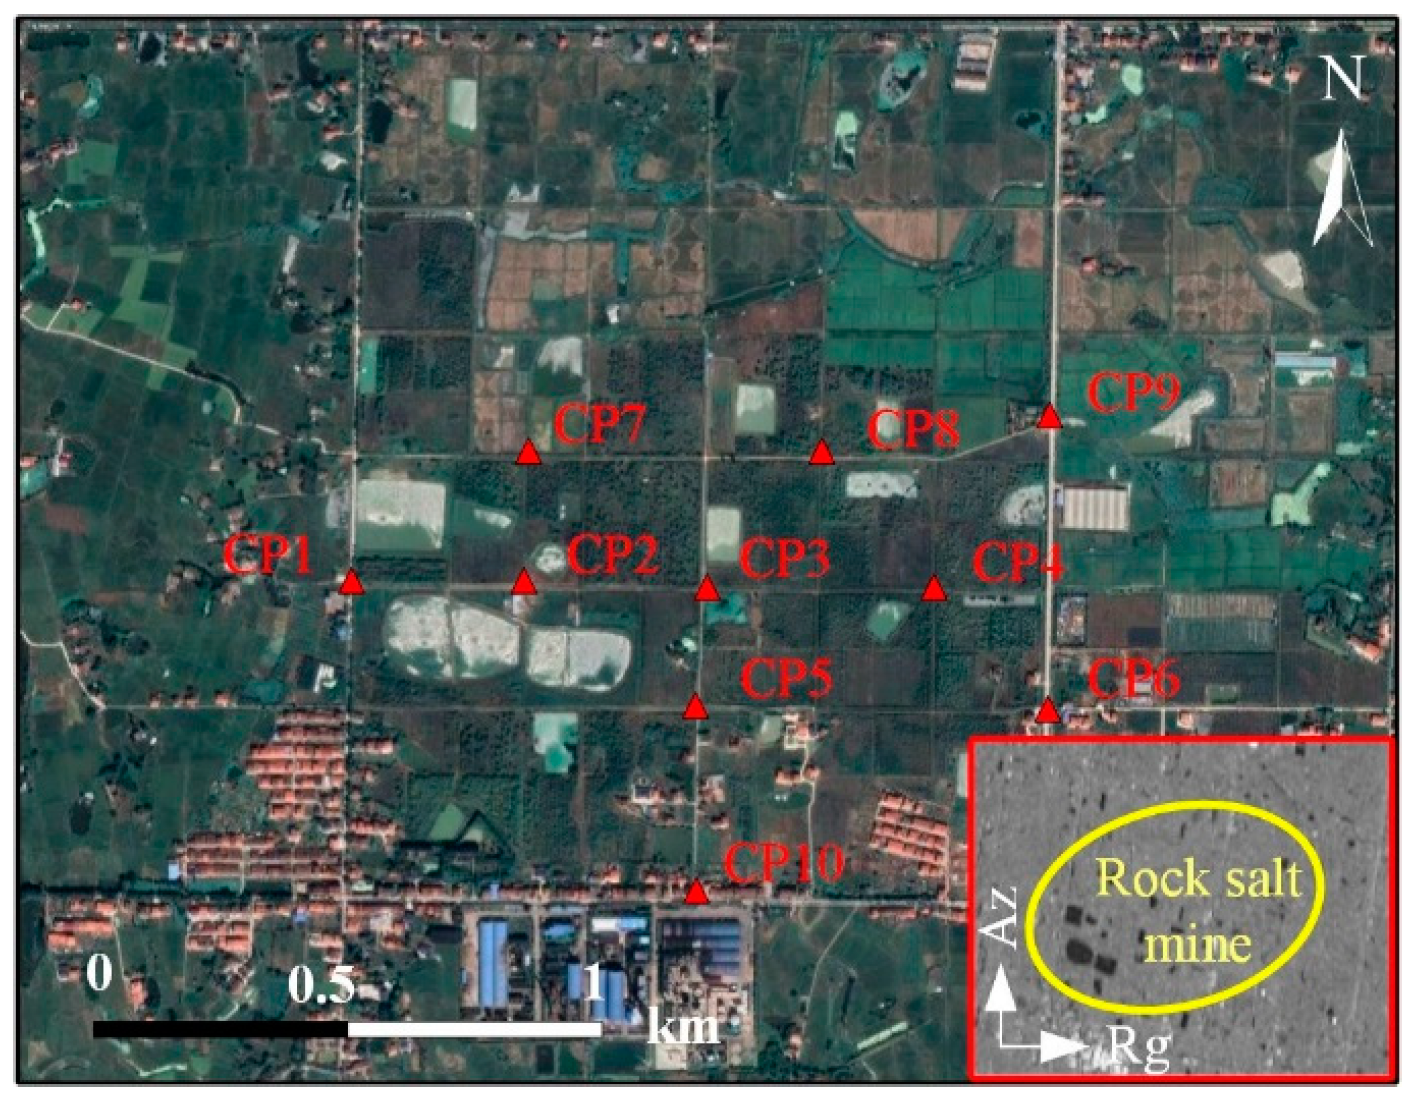
3.1. Study Area and Geological Background
3.2. SAR Acquisitions and Data Processing
4. Results and Discussion
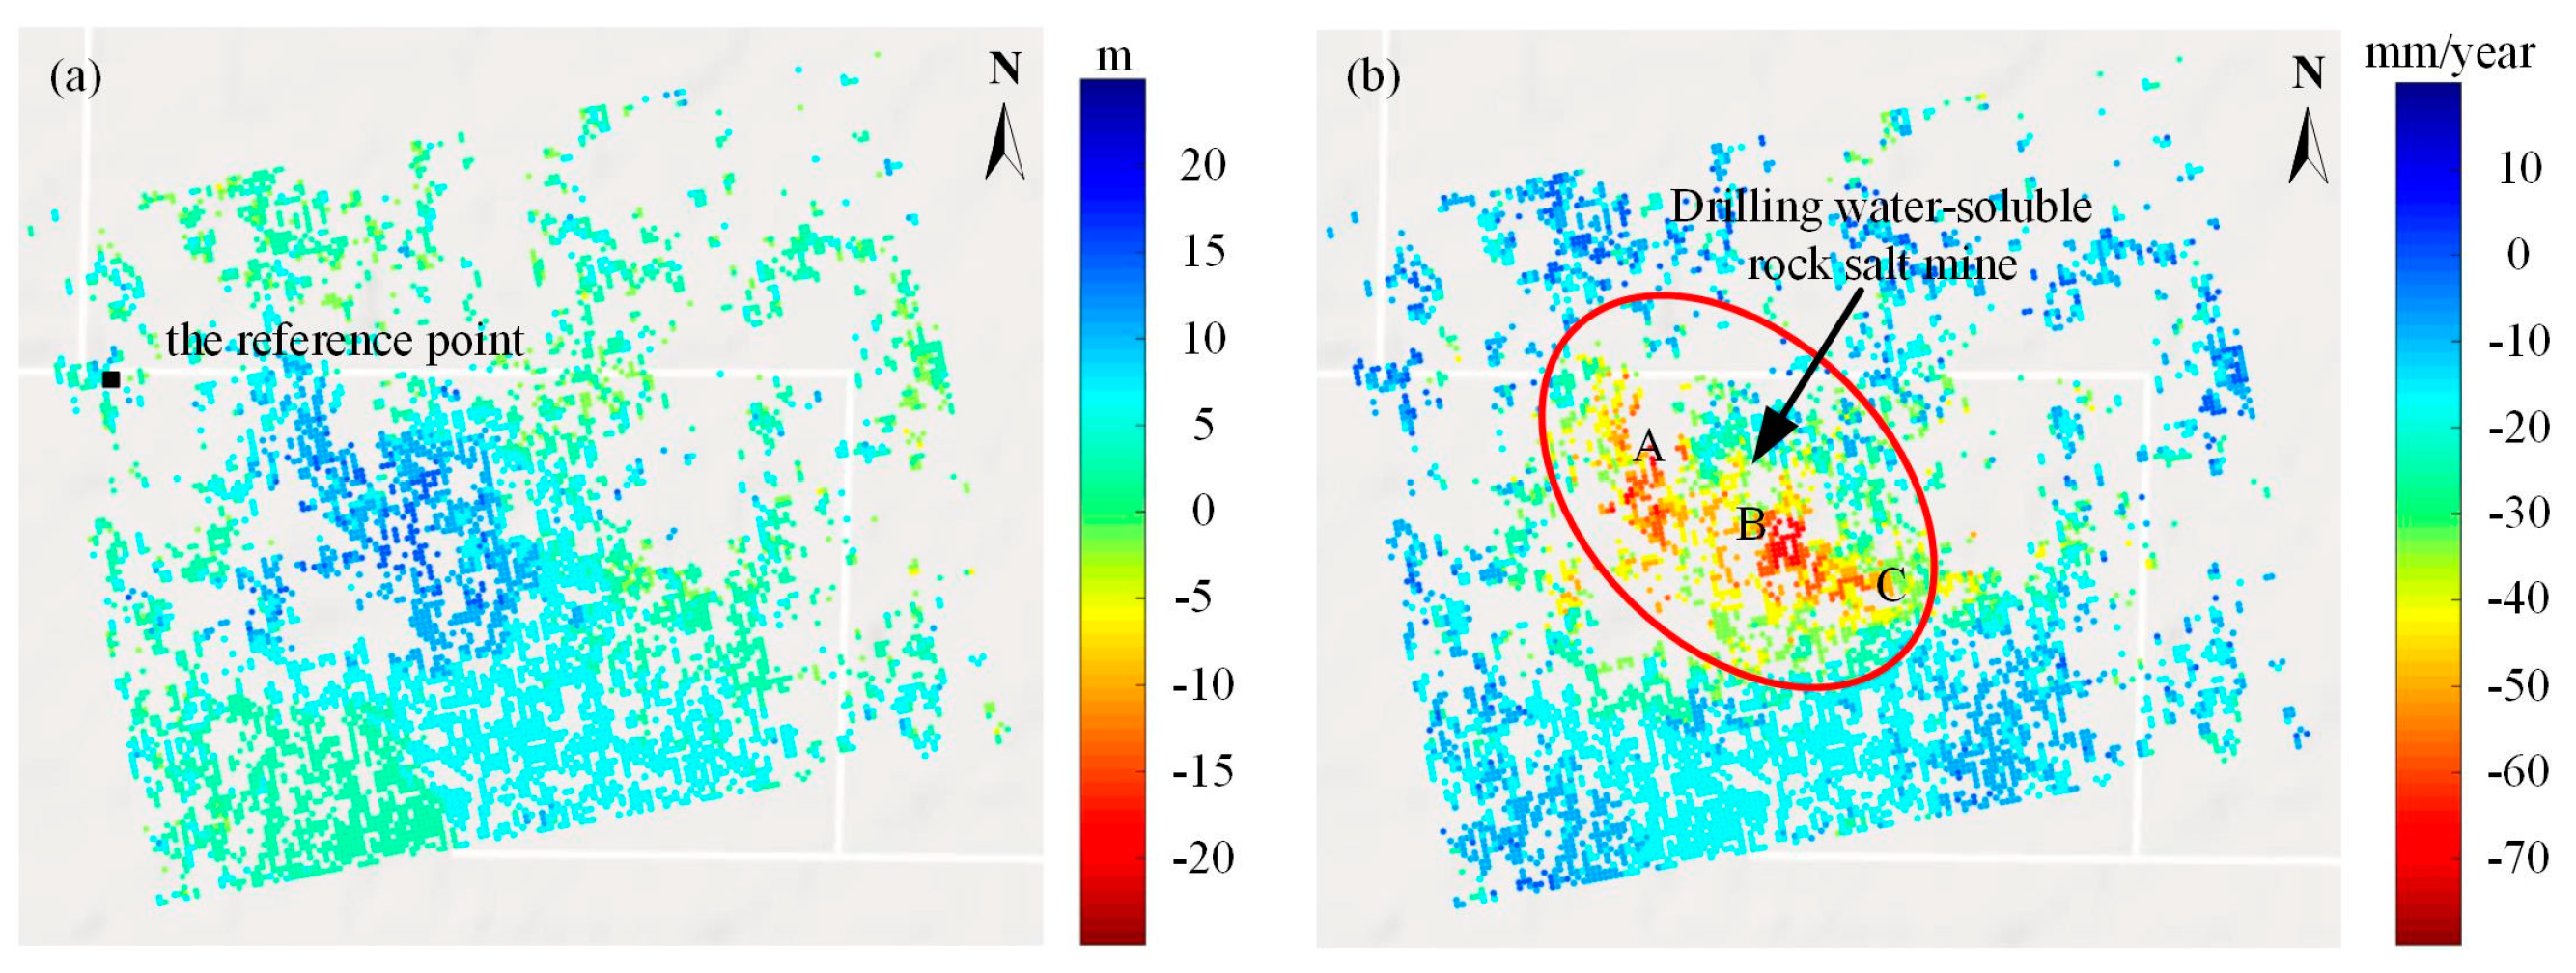
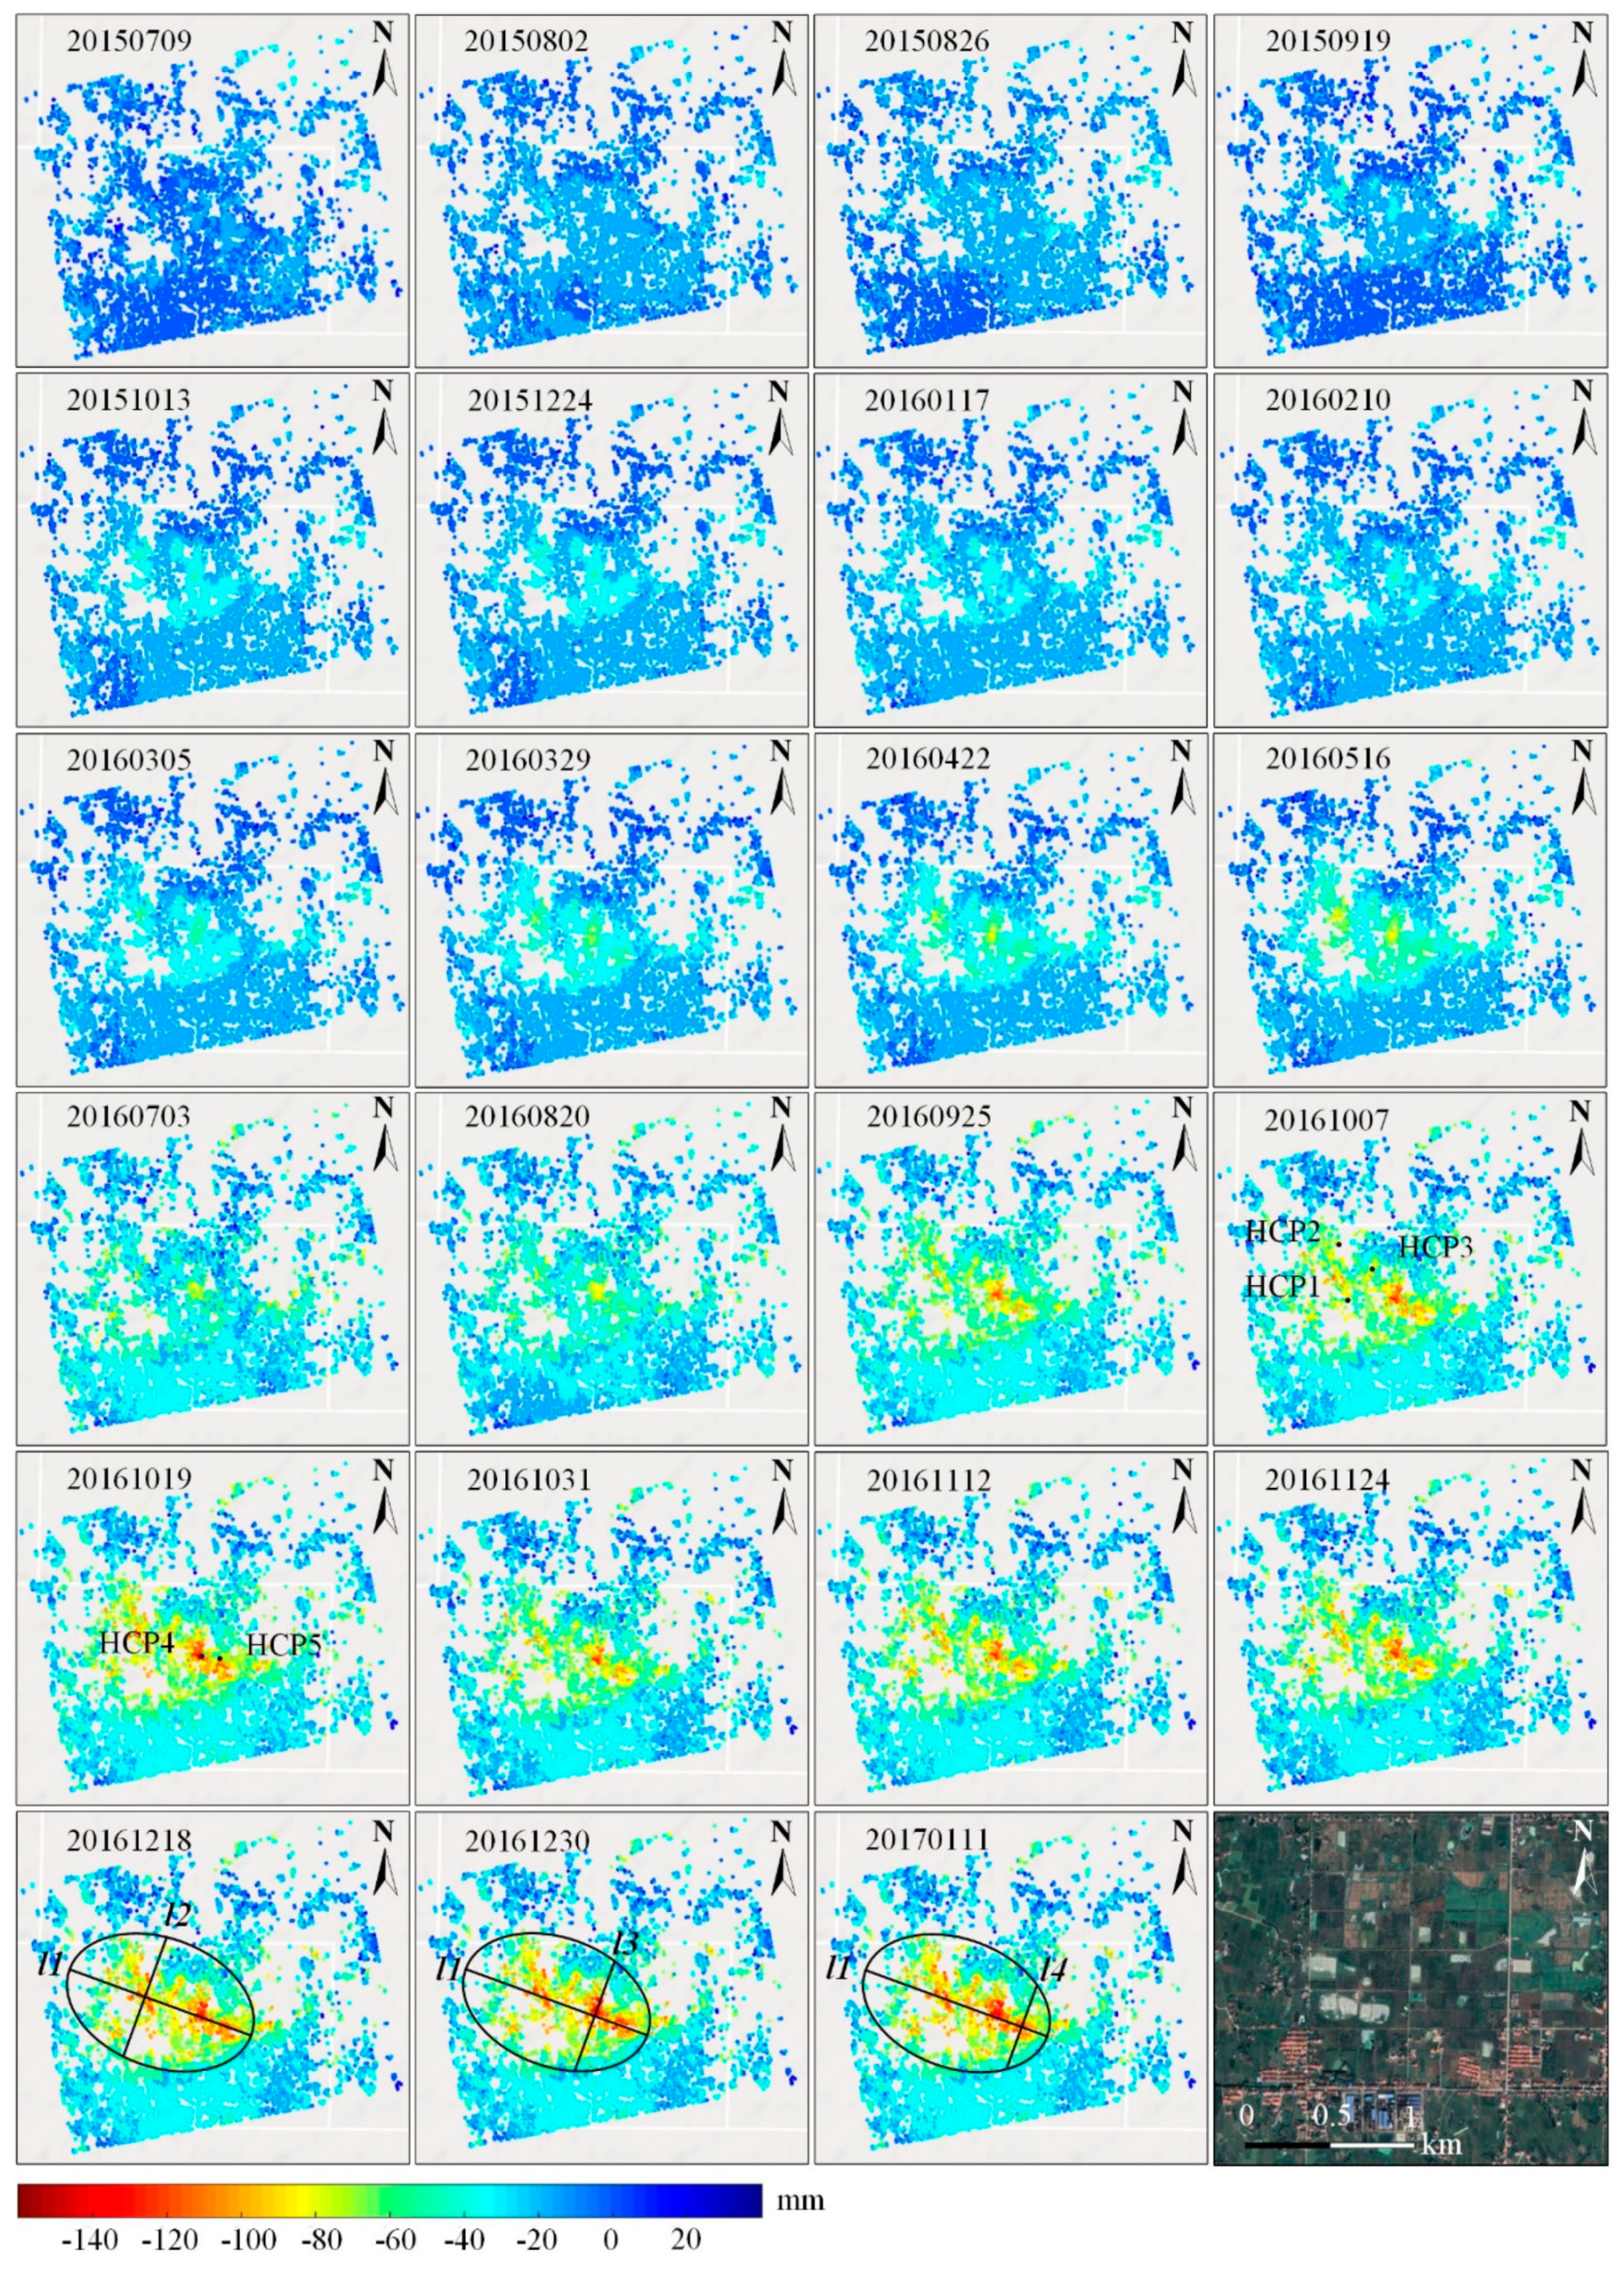
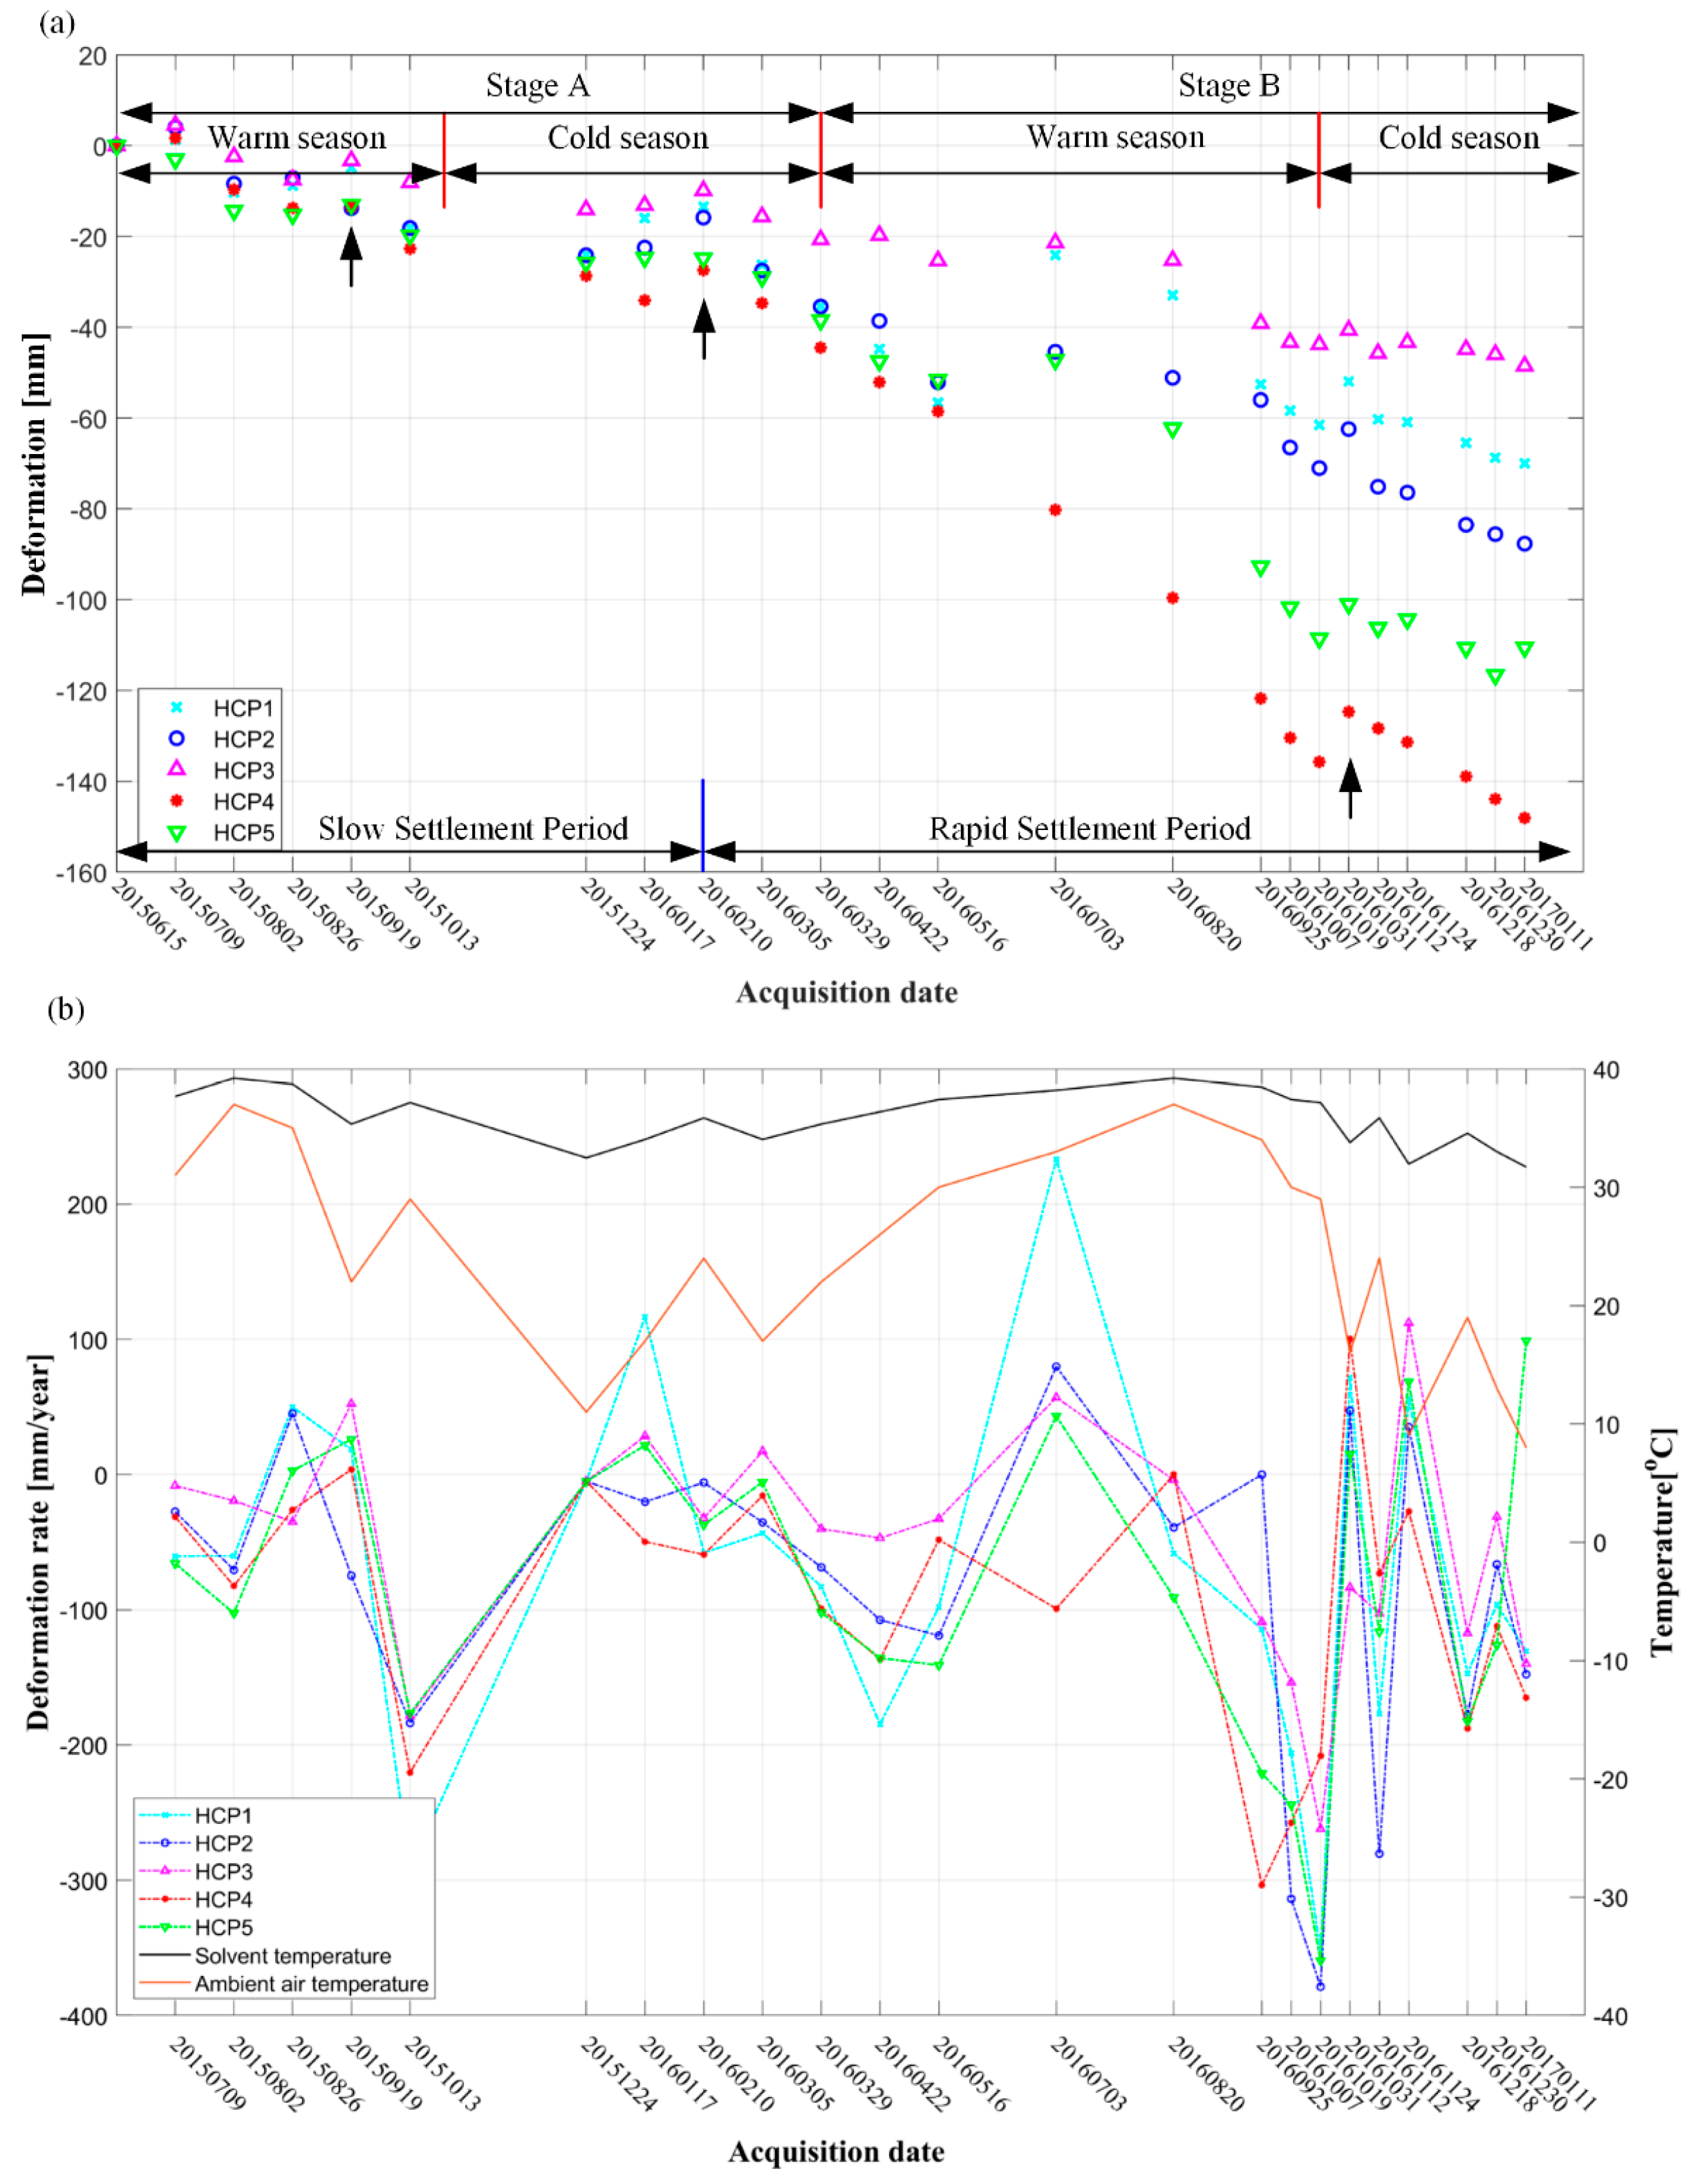
4.1. Overall Deformation Results
4.2. Discussions
- (1)
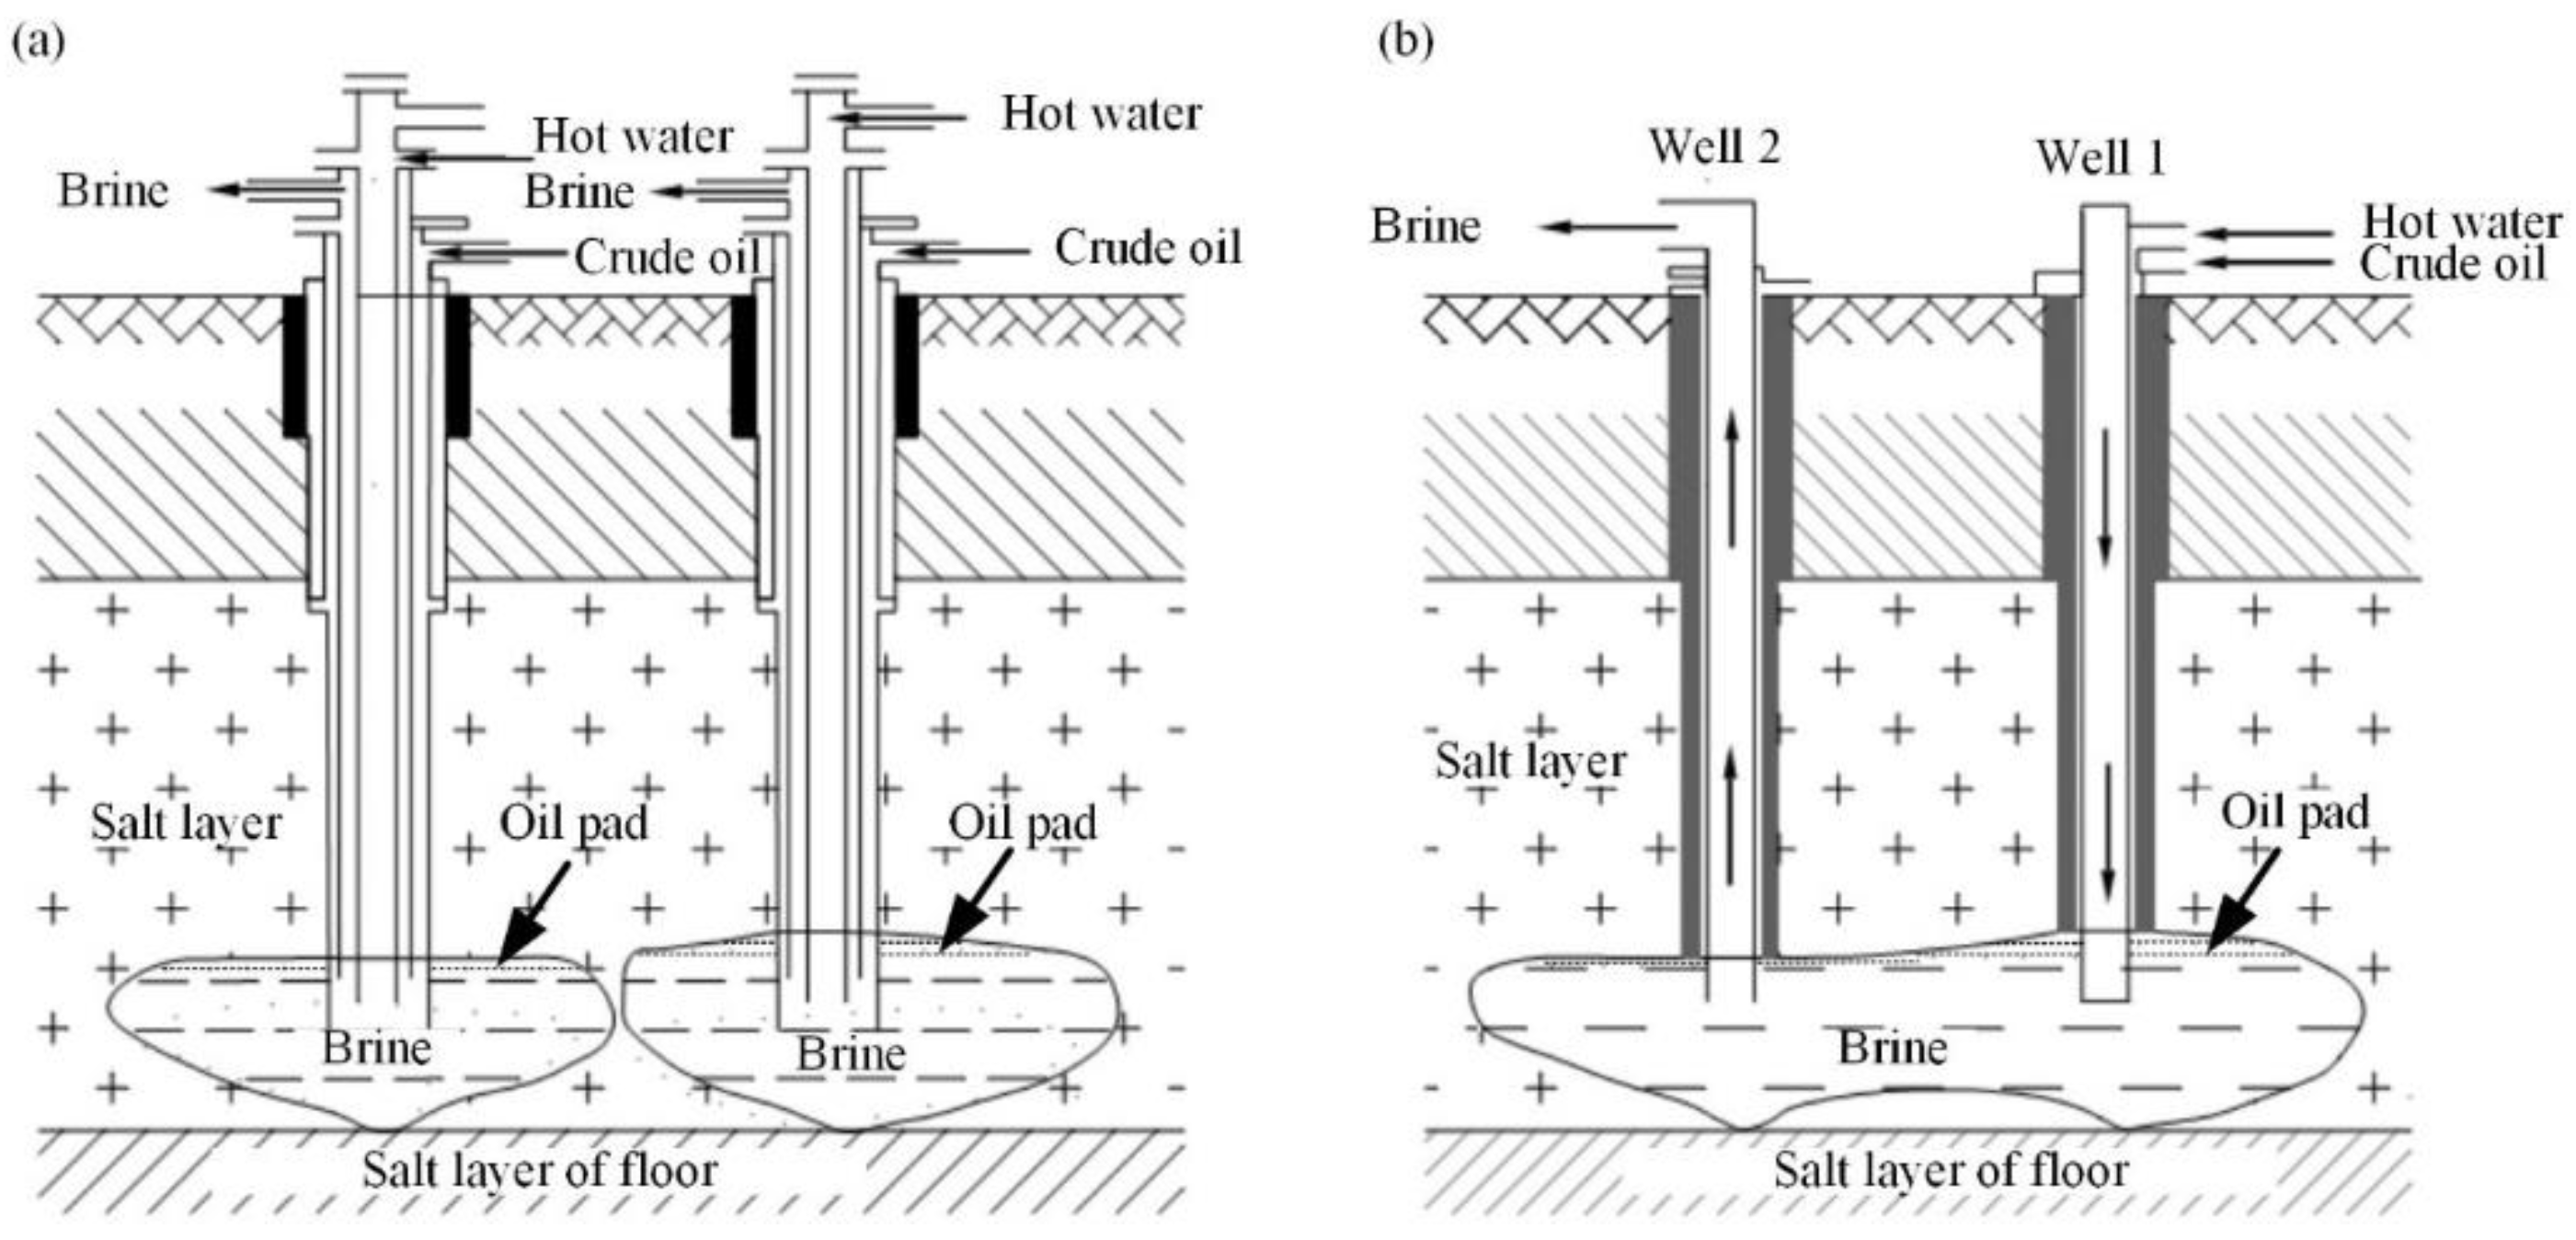
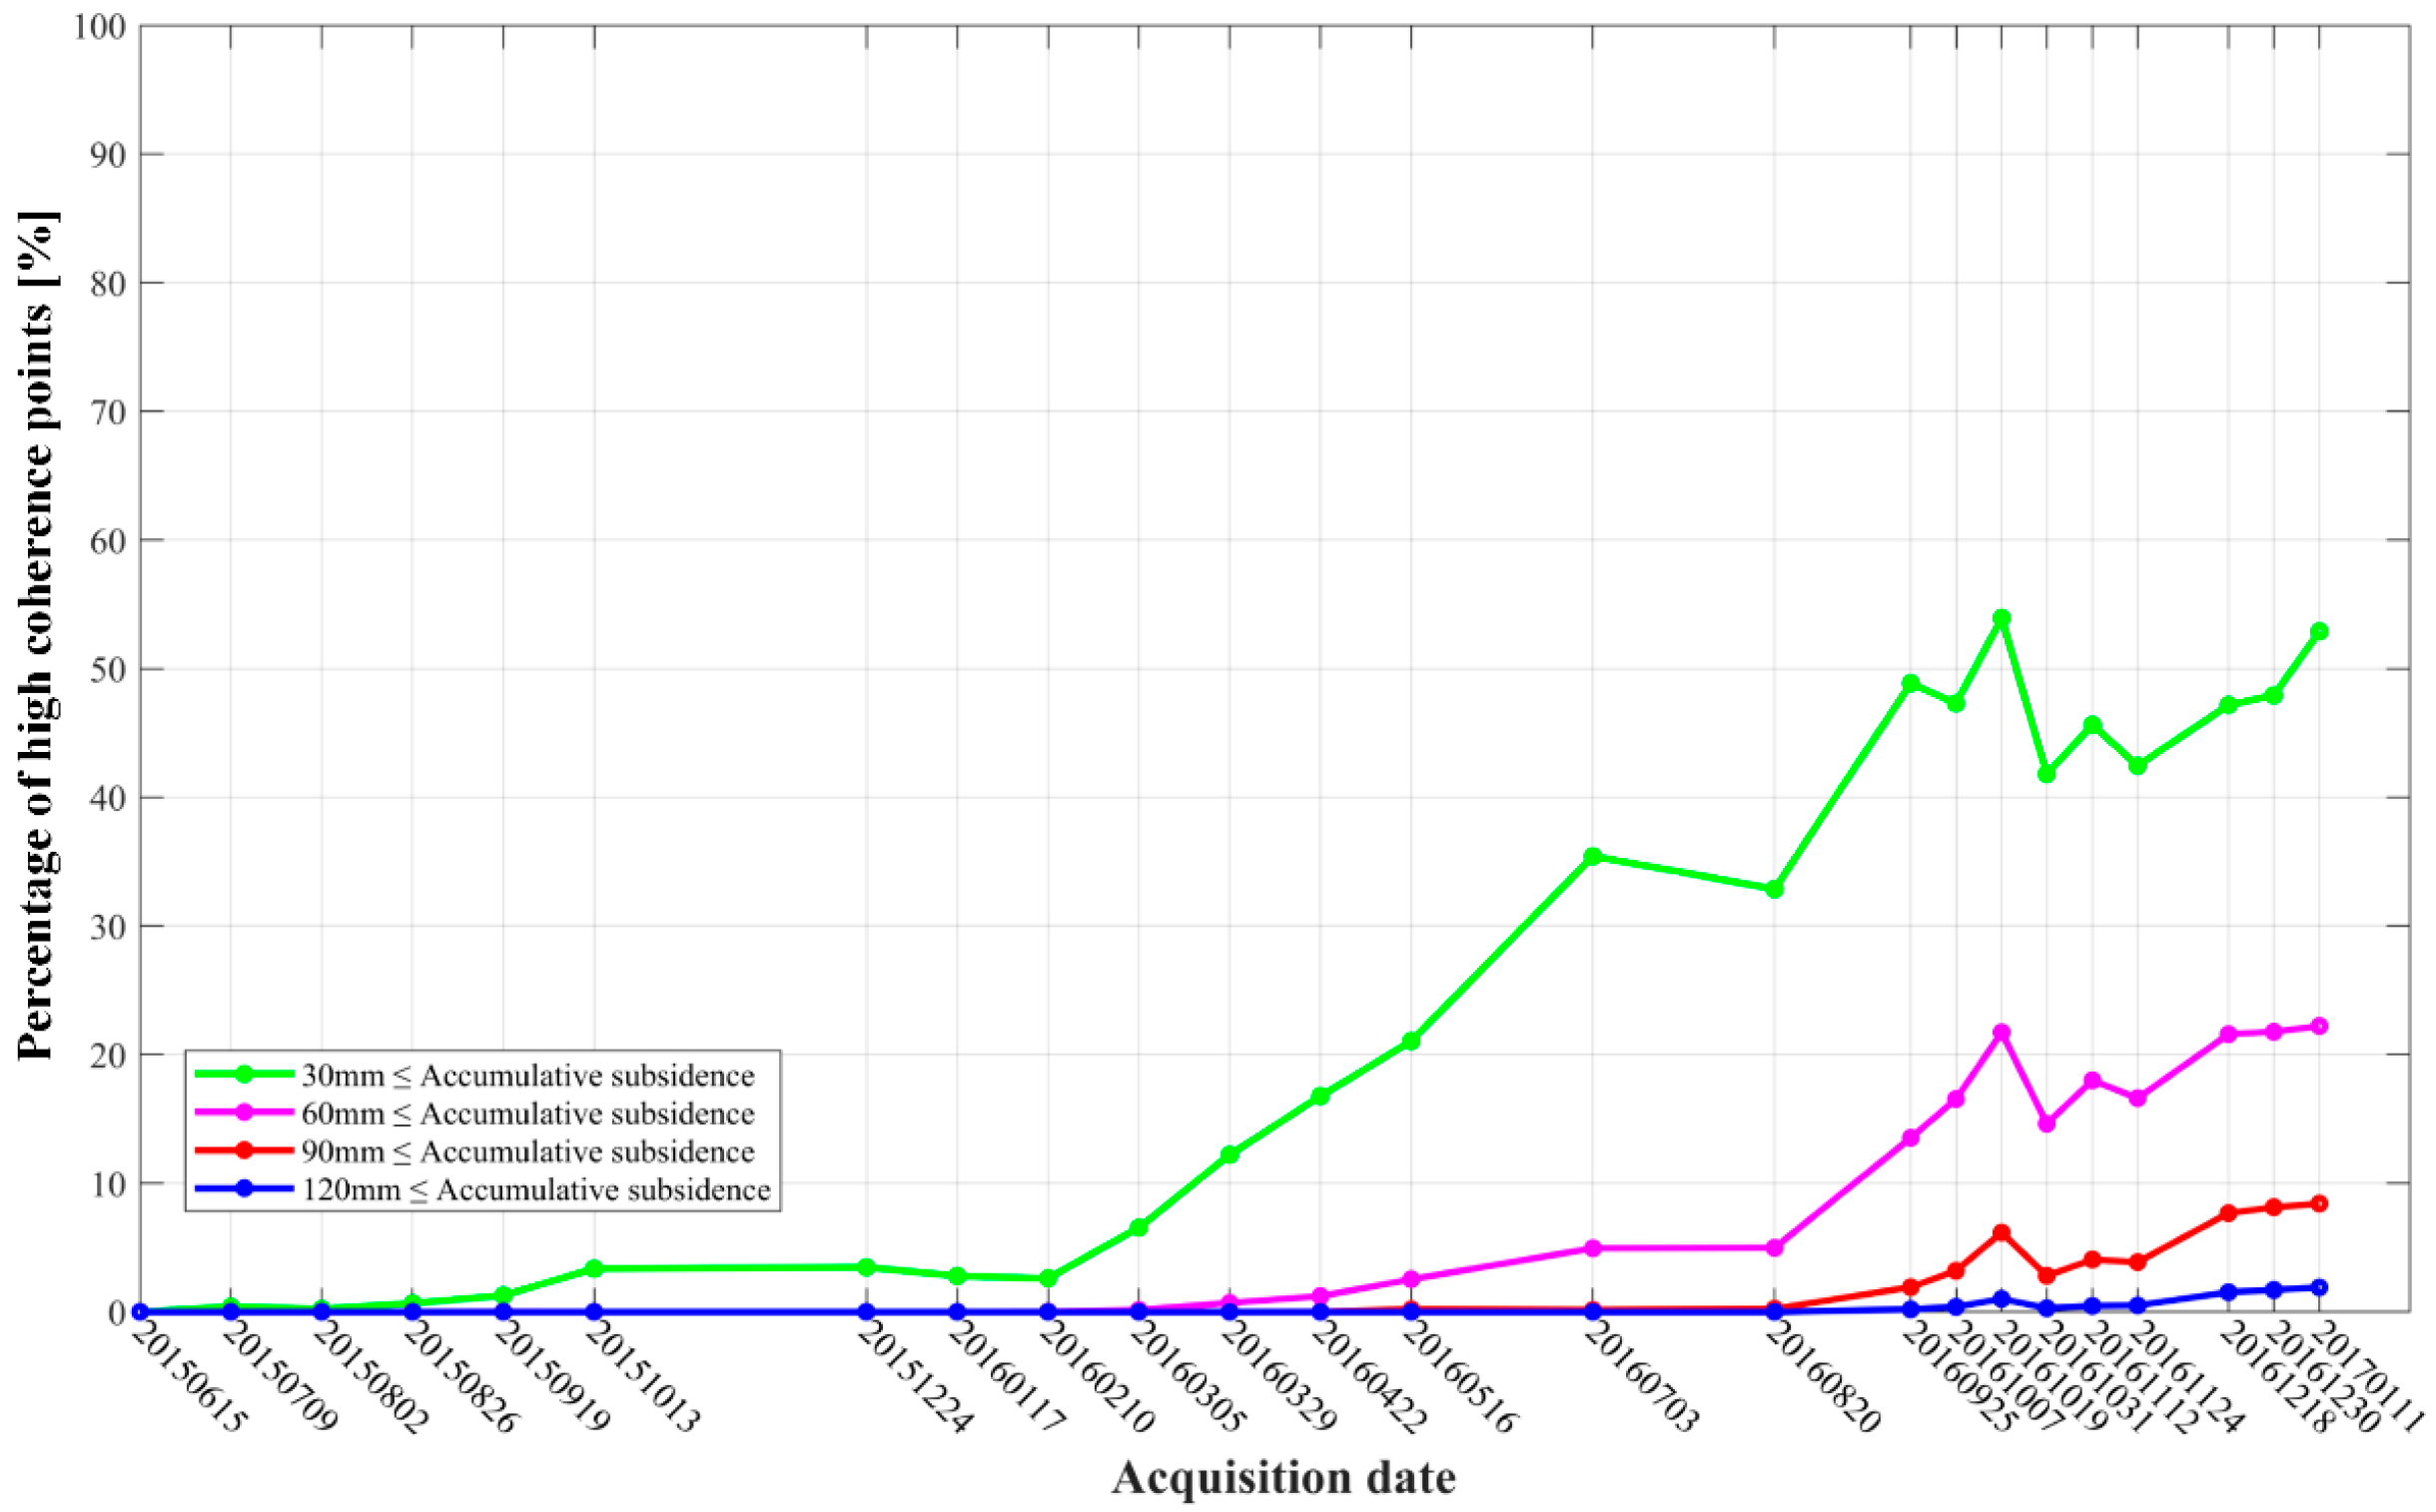
- The process of the brine extraction was conducted by injecting solvent followed by rock salt dissolution, which takes a longer time than traditional coal mining activities; in addition, the depth of the drilling solution mining was deeper than that of common coal mines (the depth of wells in this study area was 200–500 m), which induced the lagging appearance of ground surface subsidence.
- (2)
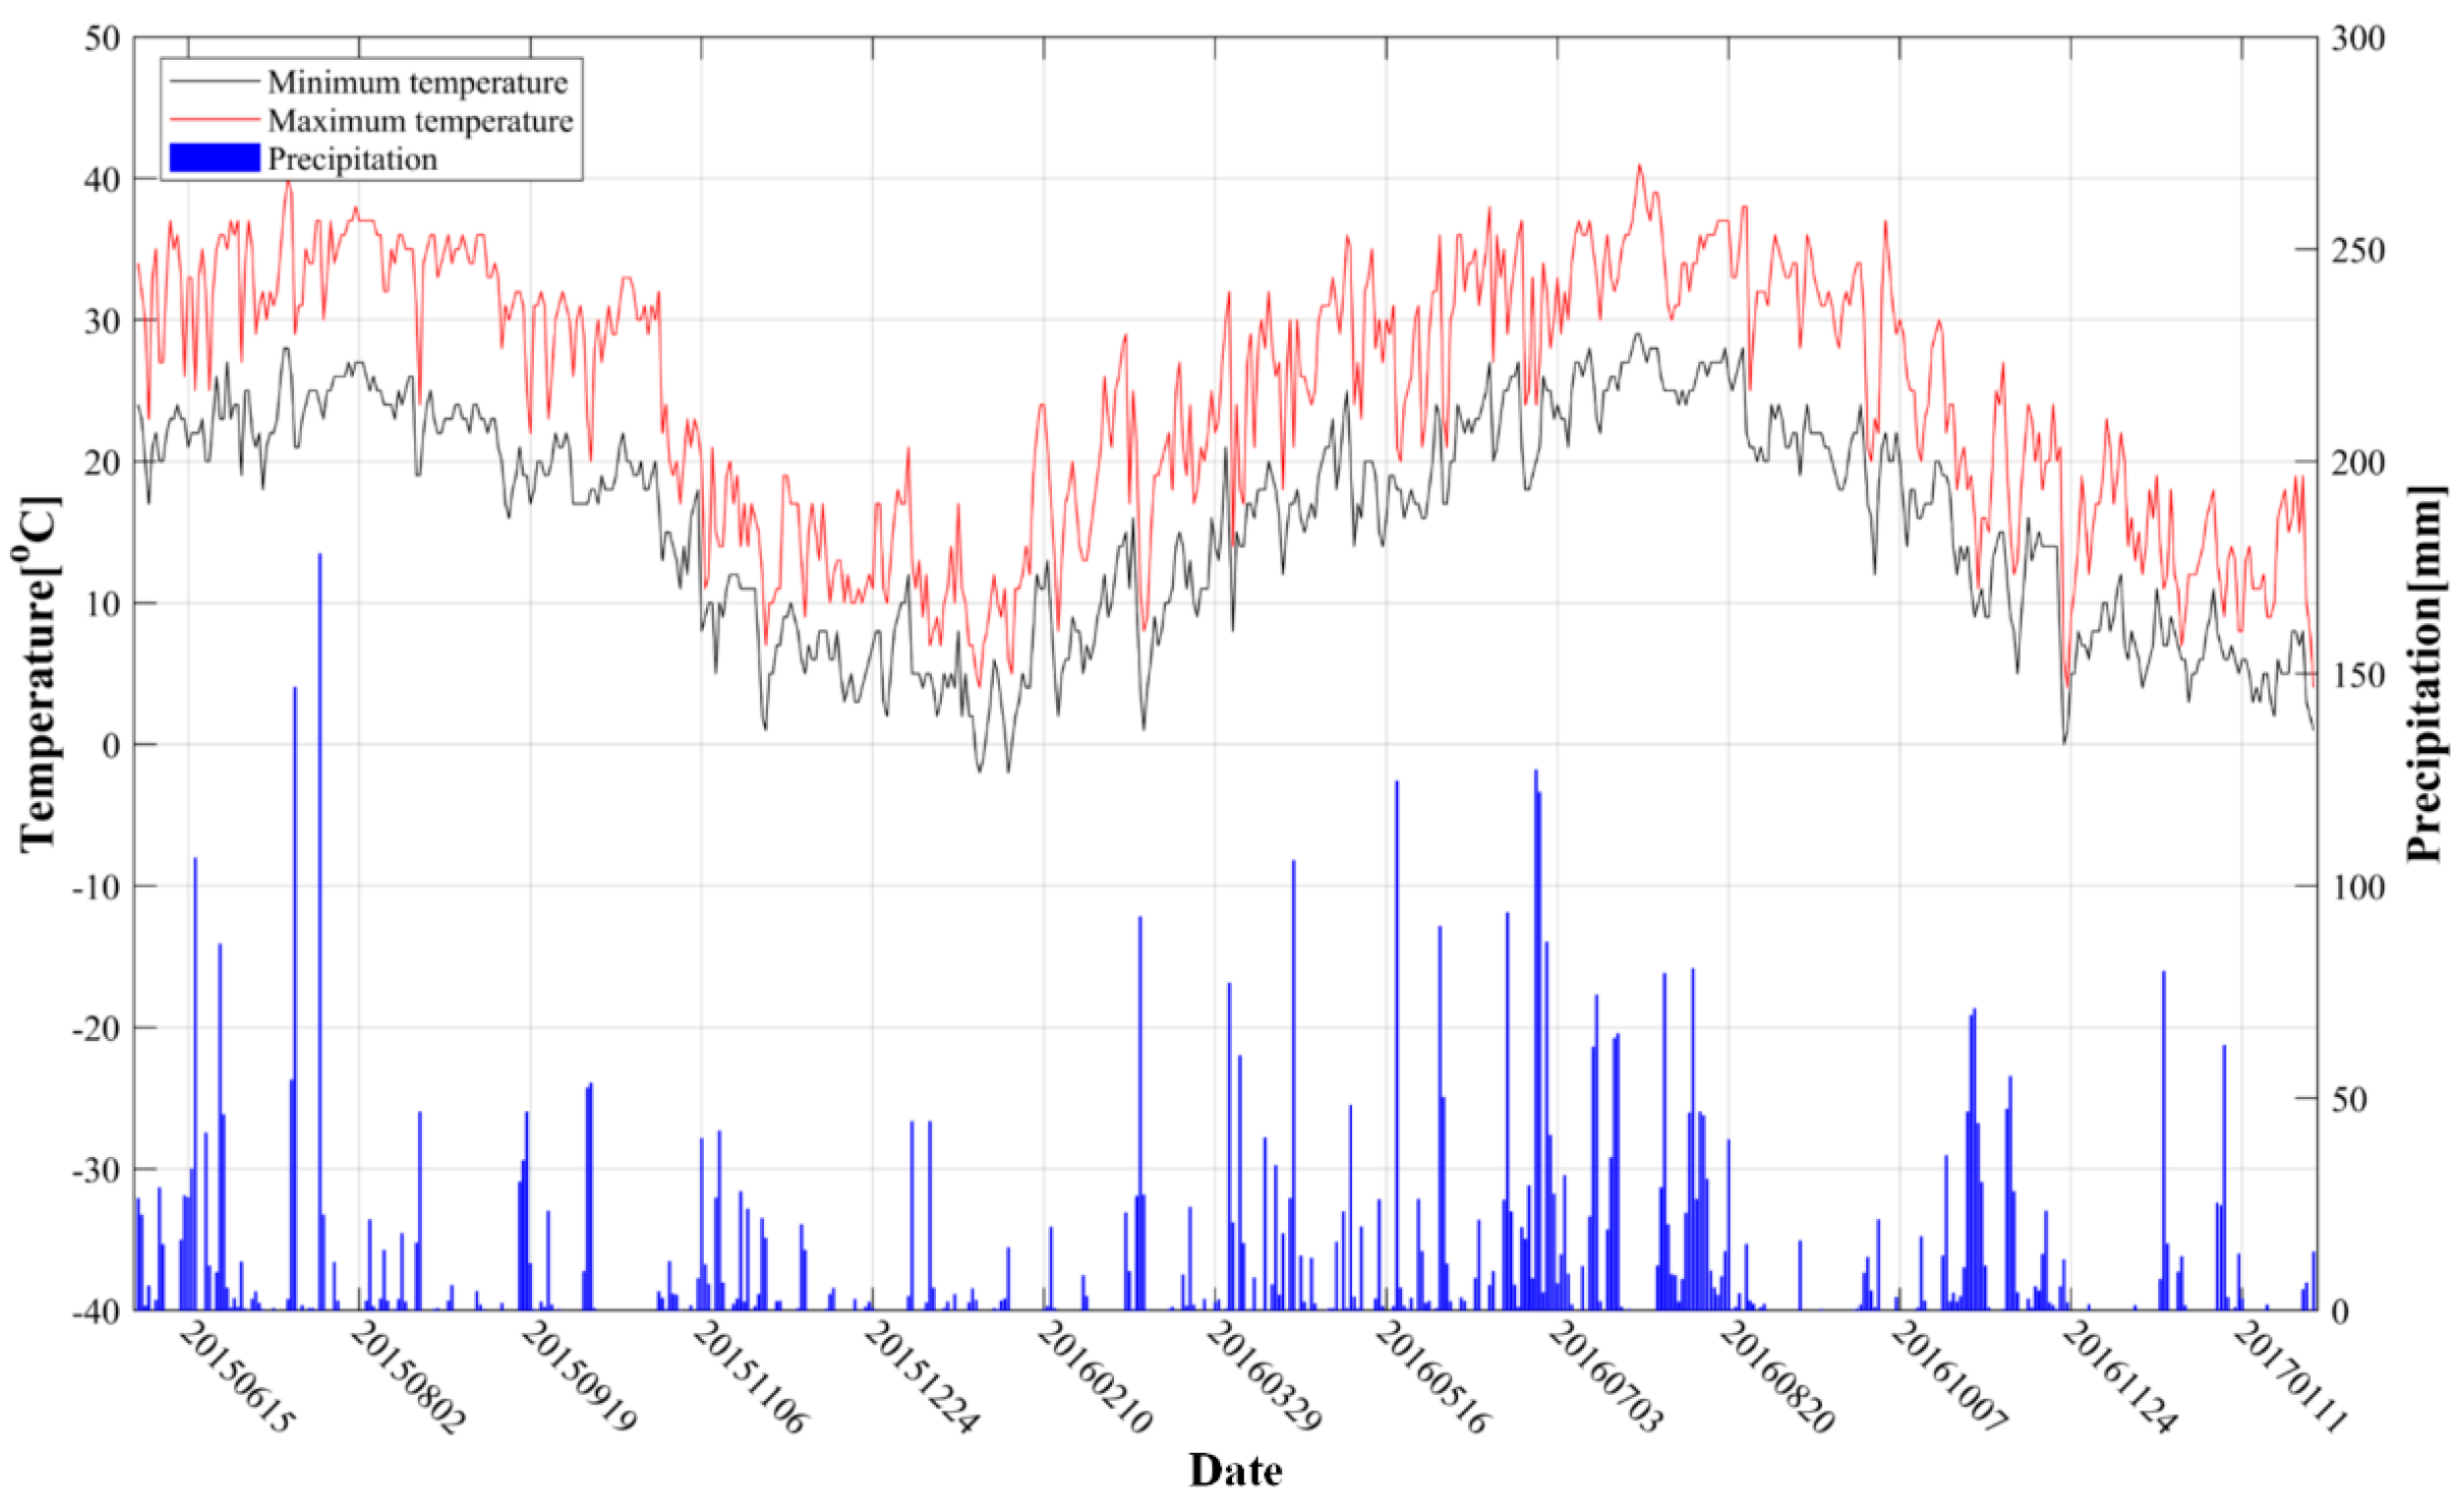
- The relationship between the solubility and the solvent temperature in Table 2 shows that the dissolution of mirabilite is significantly vulnerable to temperature [2,37]. The solubility under 30 °C is almost four times that of under 0–10 °C. This indicates that under the circumstance of high temperature in the warm season, the mineral dissolution was considerably rapid, inducing a larger amount of brine extraction. On the contrary, for the cold season (the period of 24 December 2015 to 25 March 2016), the low temperature in winter suppressed the dissolution rate for the mirabilite.
- (3)
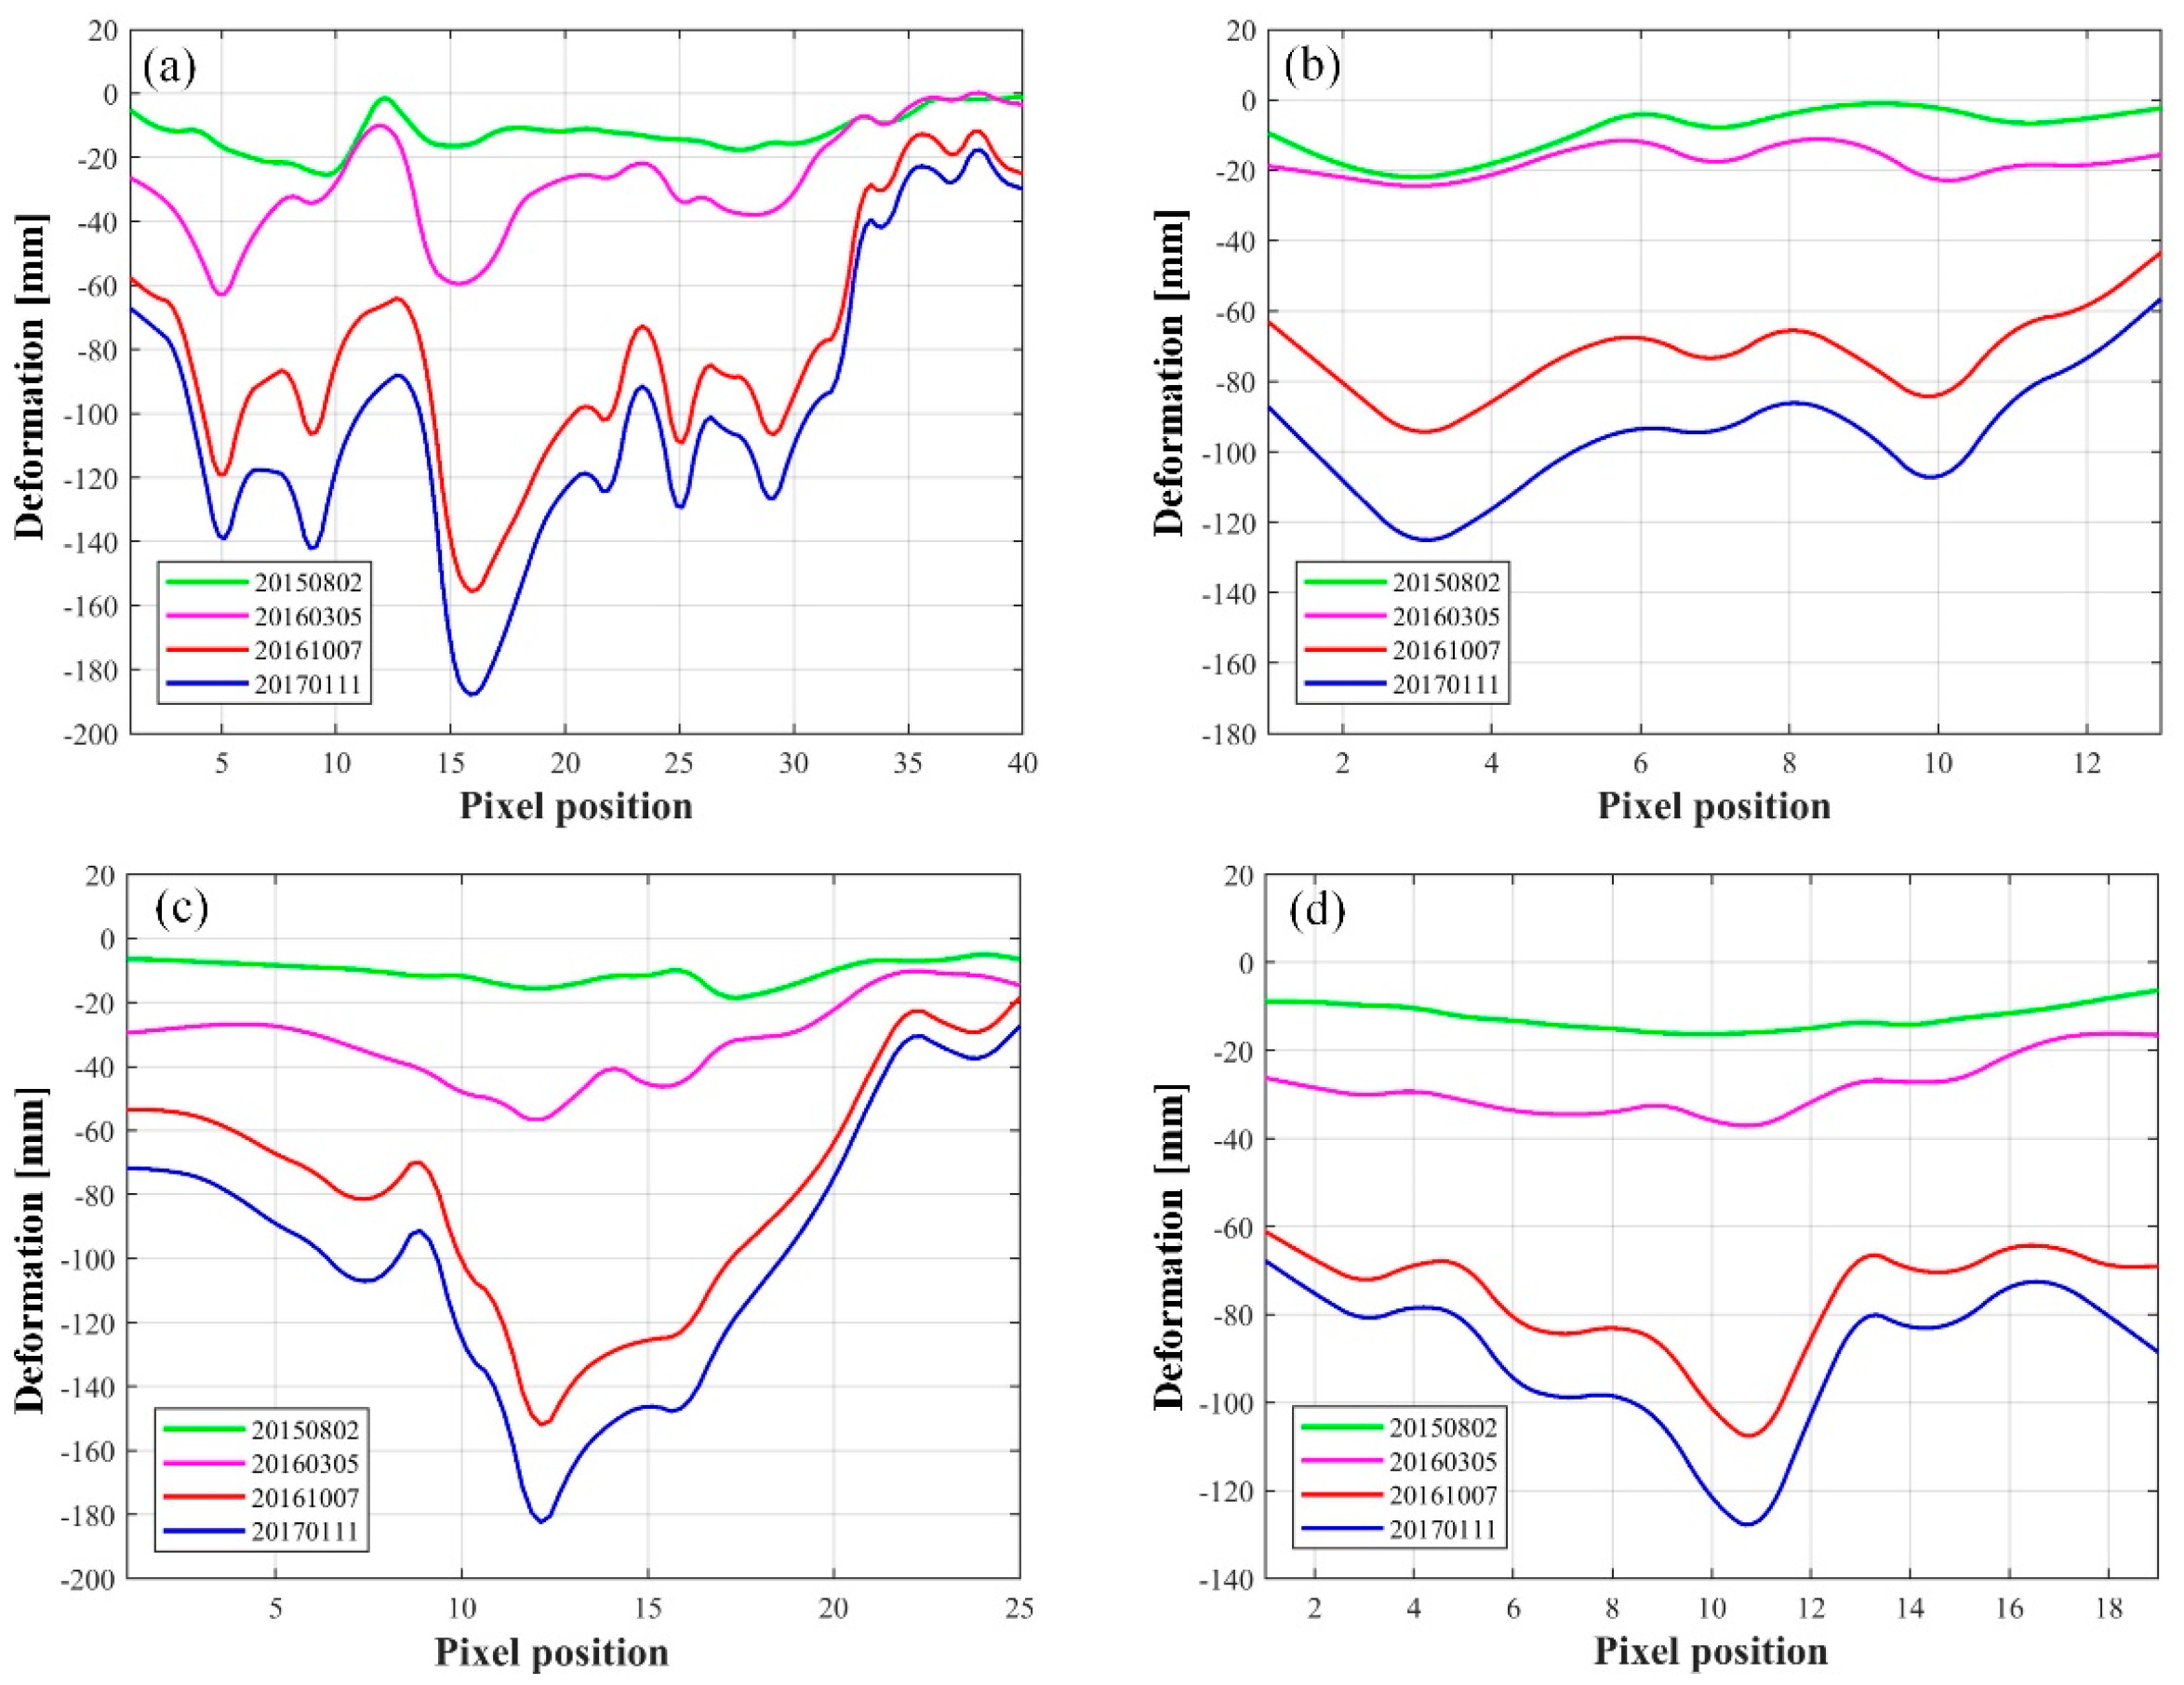
- The spatially multi-peak phenomenon was mainly due to the drilling solution mining method based on connected well groups and its comprehensively multi-direction advancing mode (which will be discussed in Section 4.2).
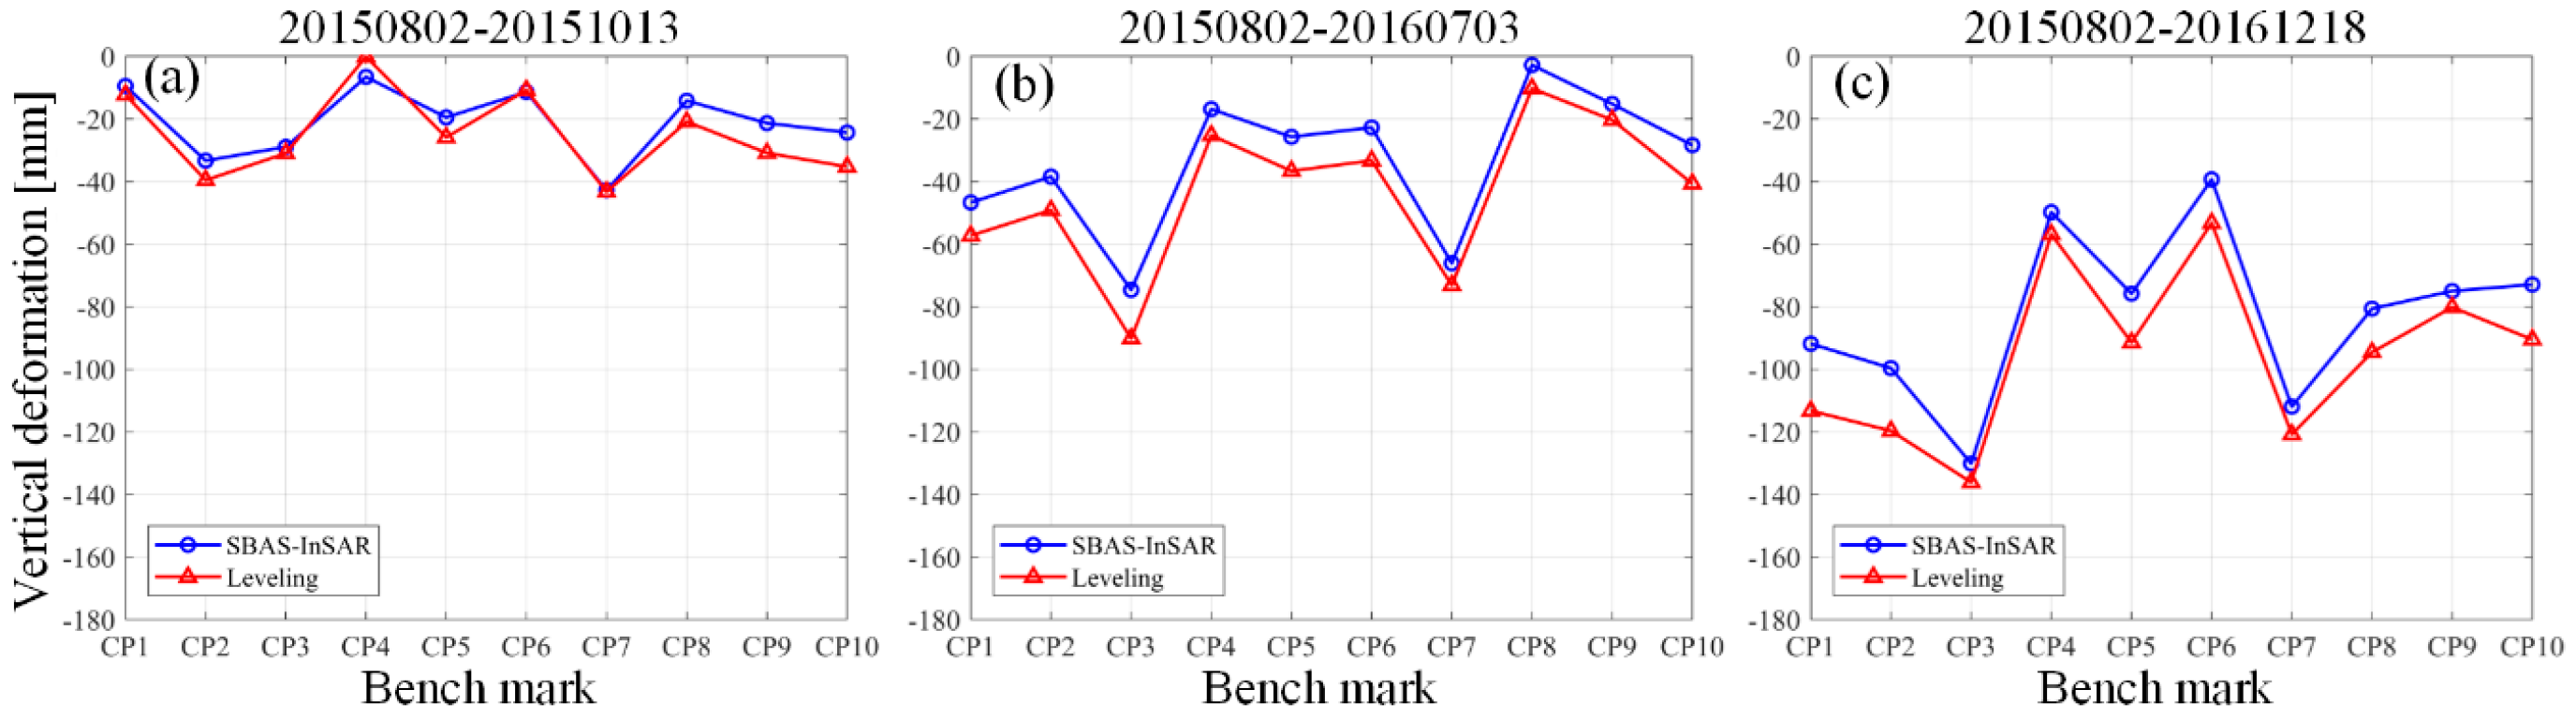
4.3. Accuracy Assessment
5. Conclusions
Author Contributions
Funding
Acknowledgments
Conflicts of Interest
References
- Ministry of Natural Resources, PRC. China Mineral Resources Report; Geological Publishing House: Beijing, China, 2018. [Google Scholar]
- Wang, Q. Drilling Solution Mining and Design; Chemical Industry Press: Beijing, China, 2016. [Google Scholar]
- Ren, S.; Jiang, D.; Yang, C.; Chen, J. Study on the Mechanism and the Prediction Model of the Subsidence Caused by Rock Salt Solution Mining; Chongqing University Press: Chongqing, China, 2012. [Google Scholar]
- Johnson, K.S. Evaporite-karst problems and studies in the USA. Environ. Geol. 2008, 53, 937–943. [Google Scholar] [CrossRef]
- Zhang, G.; Wang, Z.; Wang, L.; Chen, Y.; Wu, Y.; Ma, D.; Zhang, K. Mechanism of collapse sinkholes induced by solution mining of salt formations and measures for prediction and prevention. Bull. Eng. Geol. Environ. 2019, 78, 1401–1415. [Google Scholar] [CrossRef]
- Kaufmann, G. Geophysical mapping of solution and collapse sinkholes. J. Appl. Geophys. 2014, 111, 271–288. [Google Scholar] [CrossRef]
- Kaufmann, G.; Romanov, D.; Tippelt, T.; Vienken, T.; Werban, U.; Dietrich, P.; Mai, F.; Börner, F. Mapping and modelling of collapse sinkholes in soluble rock: The Münsterdorf Site, Northern Germany. J. Appl. Geophys. 2018, 154, 64–80. [Google Scholar] [CrossRef]
- Buchignani, V.; Amato Avanzi, G.D.; Giannecchini, R.; Puccinelli, A. Evaporite karst and sinkholes: A synthesis on the case of Camaiore (Italy). Environ. Geol. 2008, 53, 1037–1044. [Google Scholar] [CrossRef]
- Li, X.; Xu, B.; Tang, S. Research on ground subsidence mechanism of solution mining by drilling and control counter measures. J. Saf. Sci. Technol. 2009, 5, 131–134. [Google Scholar]
- Gutiérrez, F.; Parise, M.; Waele, J.D.; Jourde, H. A review on natural and human-induced geohazards and impacts in karst. Earth Sci. Rev. 2014, 138, 61–88. [Google Scholar] [CrossRef]
- Mura, J.C.; Gama, F.F.; Paradella, W.R.; Negrão, P.; Carneiro, S.; Oliveira, C.G.; Brandão, W.S. Monitoring the vulnerability of the dam and dikes in Germano iron mining area after the collapse of the tailings dam of Fundão (Mariana-mg, Brazil) using DInSAR techniques with TerraSAR-x data. Remote Sens. 2018, 10, 1507. [Google Scholar] [CrossRef] [Green Version]
- Li, Z.W.; Yang, Z.F.; Zhu, J.J.; Hu, J.; Wang, Y.J.; Li, P.X.; Chen, G.L. Retrieving three-dimensional displacement fields of mining areas from a single InSAR pair. J. Geod. 2014, 89, 17–32. [Google Scholar] [CrossRef]
- Massonnet, D.; Rossi, M.; Carmona, C.; Adragna, F.; Peltzer, G.; Feigl, K.; Rabaute, T. The displacement field of the Landers earthquake mapped by radar interferometry. Nature 1993, 364, 138–142. [Google Scholar] [CrossRef]
- Necsoiu, M.; Onaca, A.; Wigginton, S.; Urdea, P. Rock glacier dynamics in Southern Carpathian Mountains from high-resolution optical and multi-temporal SAR satellite imagery. Remote Sens. Environ. 2016, 177, 21–36. [Google Scholar] [CrossRef] [Green Version]
- Schaefer, L.N.; Lu, Z.; Oommen, T. Post-eruption deformation processes measured using ALOS-1 and UAVSAR InSAR at Pacaya Volcano, Guatemala. Remote Sens. 2016, 8, 73. [Google Scholar] [CrossRef] [Green Version]
- Darvishi, M.; Schlögel, R.; Kofler, C.; Cuozzo, G.; Rutzinger, M.; Zieher, T.; Toschi, I.; Remondino, F.; Mejia-Aguilar, A.; Thiebes, B.; et al. Sentinel-1 and ground-based sensors for continuous monitoring of the Corvara Landslide (South Tyrol, Italy). Remote Sens. 2018, 10, 1781. [Google Scholar] [CrossRef] [Green Version]
- Ng, A.H.M.; Chang, H.C.; Ge, L.; Rizos, C.; Omura, M. Assessment of radar interferometry performance for ground subsidence monitoring due to underground mining. Earth Planet. Space 2009, 61, 733–745. [Google Scholar] [CrossRef] [Green Version]
- Nikolaos, L.; Prashanth, R.; Kosmas, M.; Ouarda, P.; Taha, B.M.J. Ground subsidence monitoring with SAR interferometry techniques in the Rural Area of Al Wagan, UAE. Remote Sens. Environ. 2018, 216, 276–288. [Google Scholar]
- Berardino, P.; Fornaro, G.; Lanari, R.; Sansosti, E. A new algorithm for surface deformation monitoring based on small baseline differential SAR interferograms. Inst. Electr. Electron. Eng. Trans. Geosci. Remote Sens. 2002, 40, 2375–2383. [Google Scholar] [CrossRef] [Green Version]
- Choi, J.K.; Won, J.S.; Lee, S.; Kim, S.W.; Kim, K.D.; Jung, H.S. Integration of a subsidence model and SAR interferometry for a coal mine subsidence hazard map in Taebaek, Korea. Int. J. Remote Sens. 2011, 32, 8161–8181. [Google Scholar] [CrossRef]
- Dong, S.; Samsonov, S.; Yin, H.; Yao, S.; Xu, C. Spatio-temporal analysis of ground subsidence due to under-ground coal mining in Huainan coalfield, China. Environ. Earth Sci. 2015, 73, 5523–5534. [Google Scholar] [CrossRef]
- Plank, S. Rapid damage assessment by means of multi-temporal SAR-a comprehensive review and outlook to Sentinel-1. Remote Sens. 2014, 6, 4870–4906. [Google Scholar] [CrossRef] [Green Version]
- Du, Z.; Ge, L.; Ng, A.H.-M.; Li, X. Investigation on mining subsidence over Appin–West Cliff Colliery using time-series SAR interferometry. Int. J. Remote Sens. 2017, 39, 1528–1547. [Google Scholar] [CrossRef]
- Zheng, M.; Deng, K.; Fan, H.; Du, S.; Zou, H. Monitoring and analysis of mining 3D time-series deformation based on multi-track SAR data. Int. J. Remote Sens. 2018, 40, 1409–1425. [Google Scholar] [CrossRef]
- Xing, X.; Chang, H.-C.; Chen, L.; Zhang, J.; Yuan, Z.; Shi, Z. Radar interferometry time series to investigate deformation of soft clay subgrade settlement—A case study of Lungui Highway, China. Remote Sens. 2019, 11, 429. [Google Scholar] [CrossRef] [Green Version]
- Lanari, R.; Mora, O.; Manunta, M.; Mallorquí, J.J.; Berardino, P.; Sansosti, E. A small-baseline approach for investigating deformations on full-resolution differential SAR interferograms. Inst. Electr. Electron. Eng. Trans. Geosci. Remote Sens. 2004, 42, 1377–1386. [Google Scholar] [CrossRef]
- Casu, F.; Manzo, M.; Lanari, R. A quantitative assessment of the SBAS algorithm performance for surface deformation retrieval from DInSAR data. Remote Sens. Environ. 2006, 102, 195–210. [Google Scholar] [CrossRef]
- Ferretti, A.; Prati, C.; Rocca, F. Nonlinear subsidence rate estimation using permanent scatters in differential SAR interferometry. Inst. Electr. Electron. Eng. Trans. Geosci. Remote Sens. 2000, 38, 2202–2212. [Google Scholar]
- Ferretti, A.; Prati, C.; Rocca, F. Permanent scatterers in SAR interferometry. Inst. Electr. Electron. Eng. Trans. Geosci. Remote Sens. 2001, 39, 8–19. [Google Scholar] [CrossRef]
- Gama, F.F.; Cantone, A.; Mura, J.C.; Pasquali, P.; Paradella, W.R.; dos Santos, A.R.; Silva, G.G. Monitoring subsidence of open pit iron mines at Carajás Province based on SBAS interferometric technique using TerraSAR-X data. Remote Sens. Appl. Soc. Environ. 2017, 8, 199–211. [Google Scholar] [CrossRef]
- Hunan Institute of Geology. Mine Geological Environment Impact Assessment Report of Lixian Mirabilite Mine; Xinli Chemical co., Ltd.: Changsha, China, 2007. [Google Scholar]
- Liang, W.; Zhao, Y. Analysis on mechanism of salt deposit solution mining. J. Taiyuan Univ. Technol. 2002, 33, 234–237. [Google Scholar]
- Goldstein, R.M.; Werner, C.L. Radar interferogram filtering for geophysical applications. Geophys. Res. Letters 1998, 25, 4035–4038. [Google Scholar] [CrossRef] [Green Version]
- Costantini, M.; Rosen, P.A. A Generalized Phase Unwrapping Approach for Sparse Data. In Proceedings of the IEEE International Geoscience & Remote Sensing Symposium, Hamburg, Germany, 28 June–2 July 1999. [Google Scholar]
- Dai, K.; Li, Z.; Tomás, R.; Yu, B.; Wang, X.; Cheng, H.; Chen, J.; Stockamp, J. Monitoring activity at the Daguangbao Mega-landslide (China) using Sentinel-1 TOPS time series interferometry. Remote Sens. Environ. 2016, 186, 501–513. [Google Scholar] [CrossRef] [Green Version]
- Du, Y.; Zhang, L.; Feng, G.; Lu, Z.; Sun, Q. On the accuracy of topographic residuals retrieved by MTInSAR. Inst. Electr. Electron. Trans. Geosci. Remote Sens. 2017, 55, 1053–1065. [Google Scholar] [CrossRef]
- Ma, Z.; Nie, C.; Wang, R. Well Mineral. Salt Geology and Mining Process; Sichuan Salt Society, National Well Mineral Salt Science and Technology Information Station: Chengdu, China, 1992. [Google Scholar]
- Fomelis, M.; Papageorgiou, E.; Stamatopoulos, C. Episodic ground deformation signals in Thessaly Plain (Greece) revealed by data mining of SAR interferometry time series. Int. J. Remote Sens. 2016, 37, 3696–3711. [Google Scholar] [CrossRef]
- Ran, C. Temperature Drop and Heat Dissipation Calculation of Hot Water Heating Pipeline. In Proceedings of the 2000 Annual Meeting of National HVAC Refrigeration, Nanning, China, 31 October–2 November 2000; pp. 114–117. [Google Scholar]
- Qiu, Z. Mechanism analysis of surface collapse in the area of solution salt mining. J. Saf. Sci. Technol. 2011, 7, 27–31. [Google Scholar]


| Drilling Water-Soluble Rock Salt Mine (Orbit No. 11) | |||||||
|---|---|---|---|---|---|---|---|
| No. | Acquisition Date (yyyy/mm/dd) | Vertical Baseline (m) | Temporal Baseline (days) | No. | Acquisition Date (yyyy/mm/dd) | Vertical Baseline (m) | Temporal Baseline (days) |
| 0 | 2015/06/15 | 26.89 | −216 | 12 | 2016/05/16 | −15.15 | 120 |
| 1 | 2015/07/09 | 88.17 | −192 | 13 | 2016/07/03 | −19.95 | 168 |
| 2 | 2015/08/02 | 1.87 | −168 | 14 | 2016/08/20 | 22.27 | 216 |
| 3 | 2015/08/26 | −36.04 | −144 | 15 | 2016/09/25 | −55.61 | 252 |
| 4 | 2015/09/19 | −33.99 | −120 | 16 | 2016/10/07 | −21.78 | 264 |
| 5 | 2015/10/13 | 43.37 | −96 | 17 | 2016/10/19 | 57.01 | 276 |
| 6 | 2015/12/24 | 121.57 | −24 | 18 | 2016/10/31 | 54.31 | 288 |
| 7 | 2016/01/17 | 0 | 0 | 19 | 2016/11/12 | 42.52 | 300 |
| 8 | 2016/02/10 | 95.00 | 24 | 20 | 2016/11/24 | 0.96 | 312 |
| 9 | 2016/03/05 | −23.73 | 48 | 21 | 2016/12/18 | −20.47 | 336 |
| 10 | 2016/03/29 | −48.43 | 72 | 22 | 2016/12/30 | 20.89 | 348 |
| 11 | 2016/04/22 | 39.75 | 96 | 23 | 2017/01/11 | 71.62 | 360 |
| Mineral | Temperatures (°C) | ||||||||||
|---|---|---|---|---|---|---|---|---|---|---|---|
| 0 | 10 | 20 | 30 | 40 | 50 | 60 | 70 | 80 | 90 | 100 | |
| Thenardite (Na2SO4) | 5.0 | 9.0 | 19.4 | 40.8 | 48.8 | 46.7 | 45.3 | 44.1 | 43.7 | 42.9 | 42.5 |
© 2019 by the authors. Licensee MDPI, Basel, Switzerland. This article is an open access article distributed under the terms and conditions of the Creative Commons Attribution (CC BY) license (http://creativecommons.org/licenses/by/4.0/).
Share and Cite
Liu, X.; Xing, X.; Wen, D.; Chen, L.; Yuan, Z.; Liu, B.; Tan, J. Mining-Induced Time-Series Deformation Investigation Based on SBAS-InSAR Technique: A Case Study of Drilling Water Solution Rock Salt Mine. Sensors 2019, 19, 5511. https://doi.org/10.3390/s19245511
Liu X, Xing X, Wen D, Chen L, Yuan Z, Liu B, Tan J. Mining-Induced Time-Series Deformation Investigation Based on SBAS-InSAR Technique: A Case Study of Drilling Water Solution Rock Salt Mine. Sensors. 2019; 19(24):5511. https://doi.org/10.3390/s19245511
Chicago/Turabian StyleLiu, Xiangbin, Xuemin Xing, Debao Wen, Lifu Chen, Zhihui Yuan, Bin Liu, and Jianbo Tan. 2019. "Mining-Induced Time-Series Deformation Investigation Based on SBAS-InSAR Technique: A Case Study of Drilling Water Solution Rock Salt Mine" Sensors 19, no. 24: 5511. https://doi.org/10.3390/s19245511