Design of Multi-Wavelength Optical Sensor Module for Depth-Dependent Photoplethysmography


Abstract
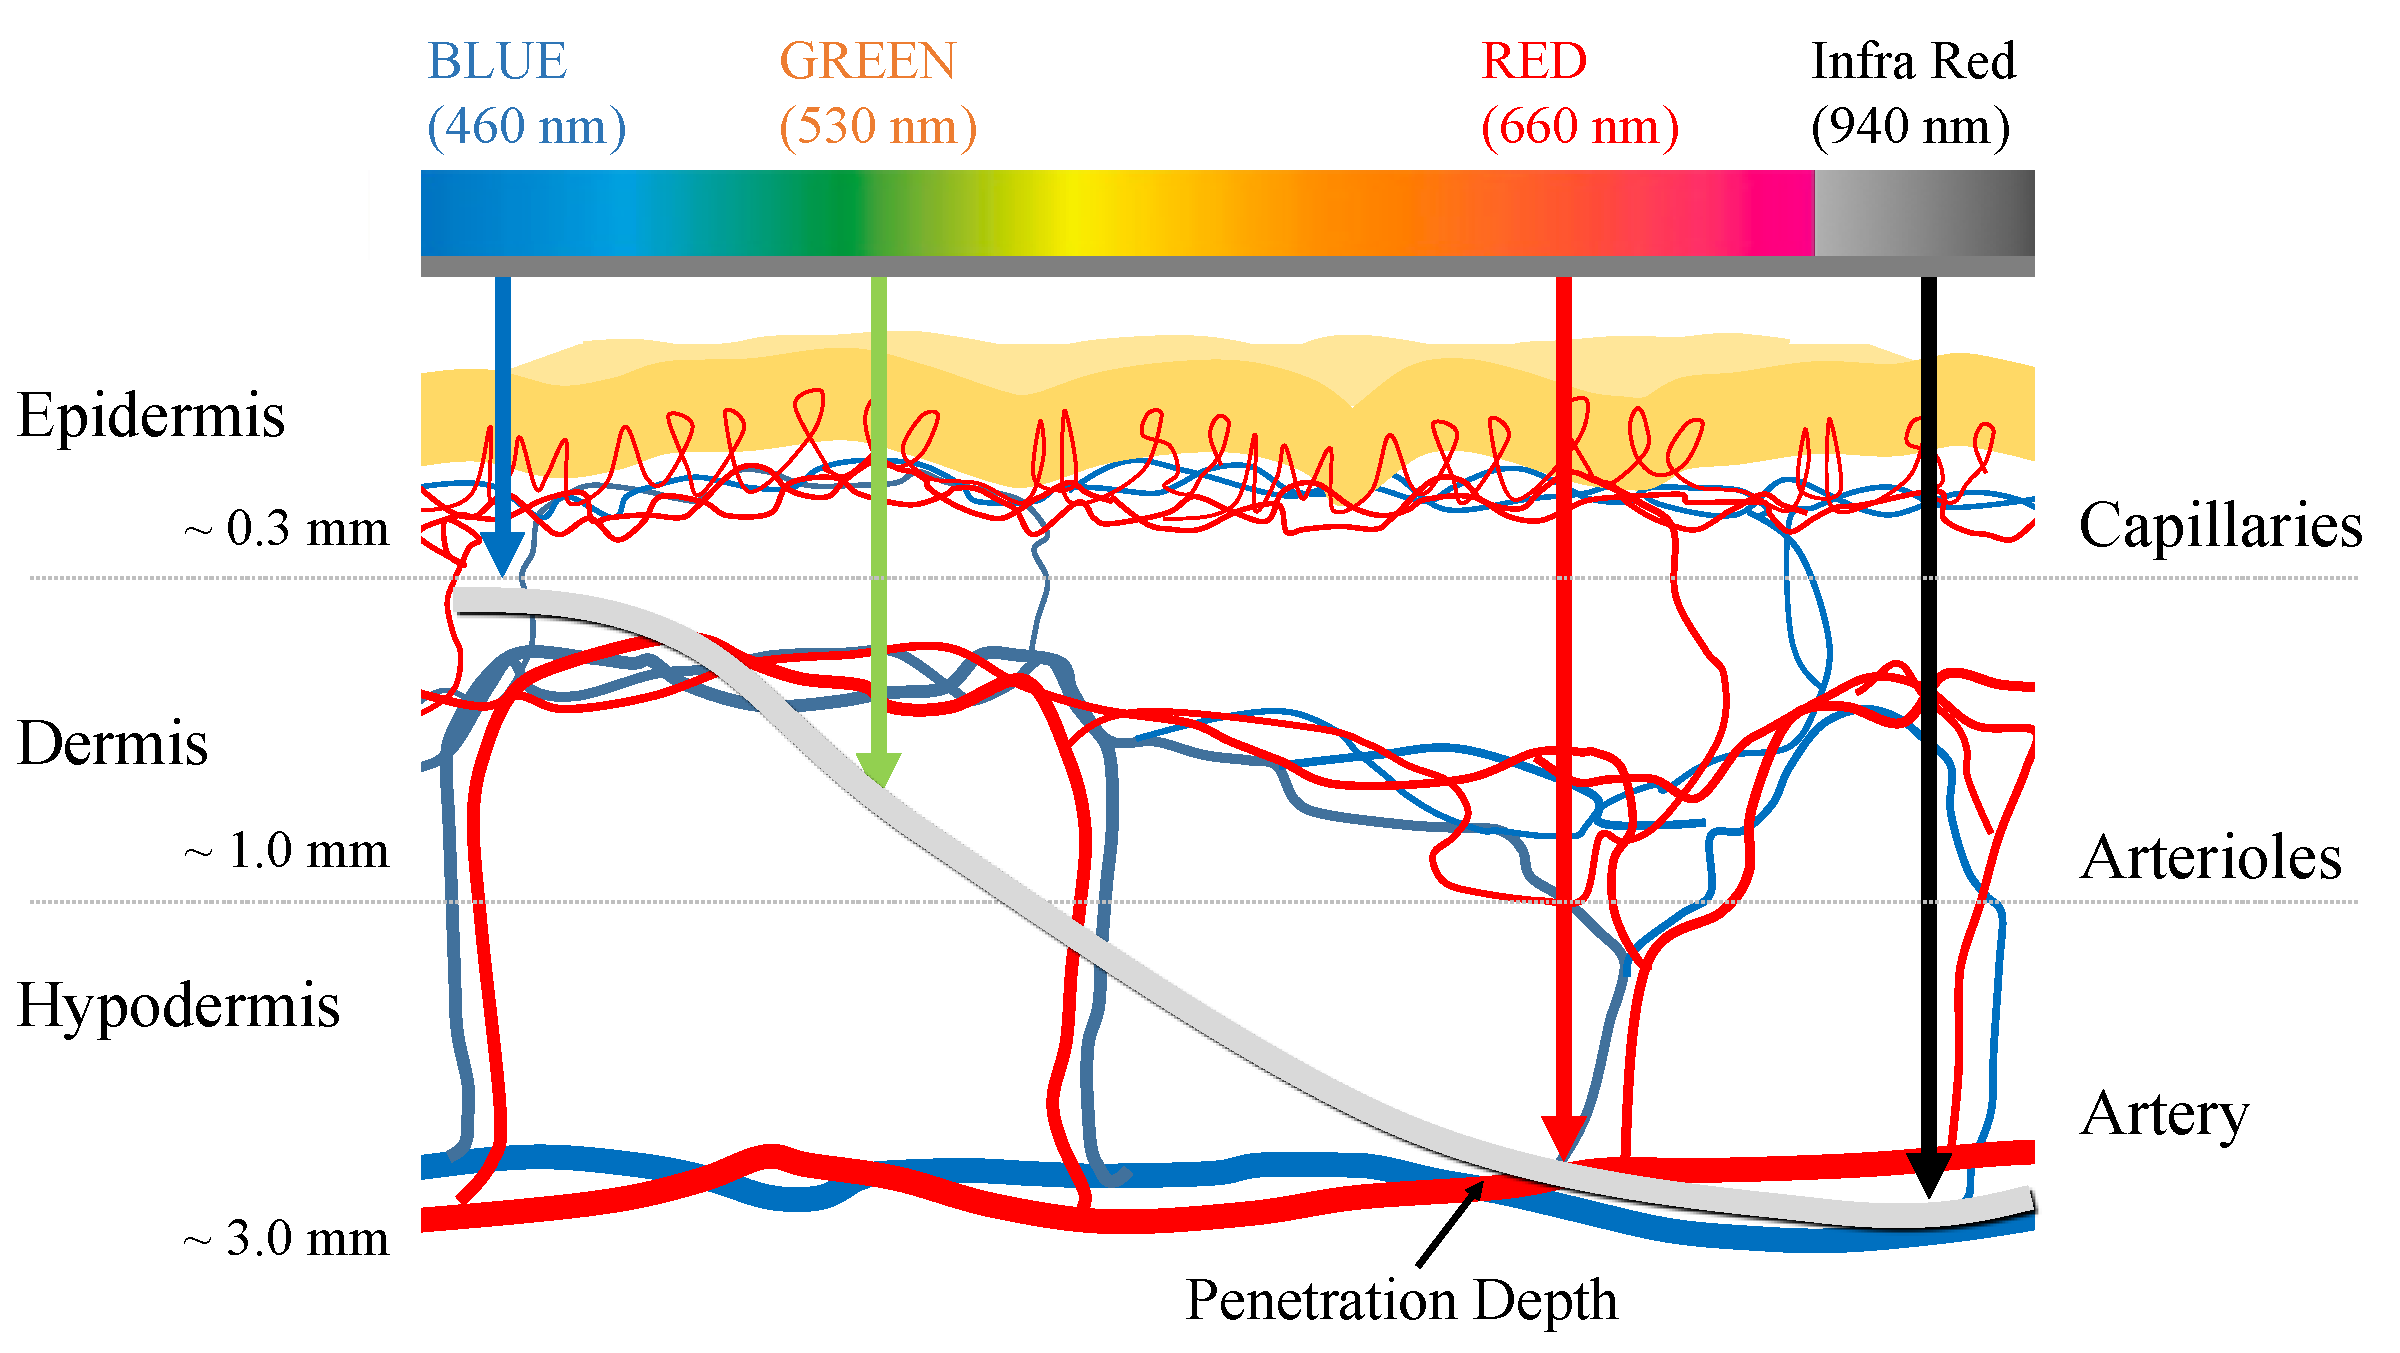
:1. Introduction
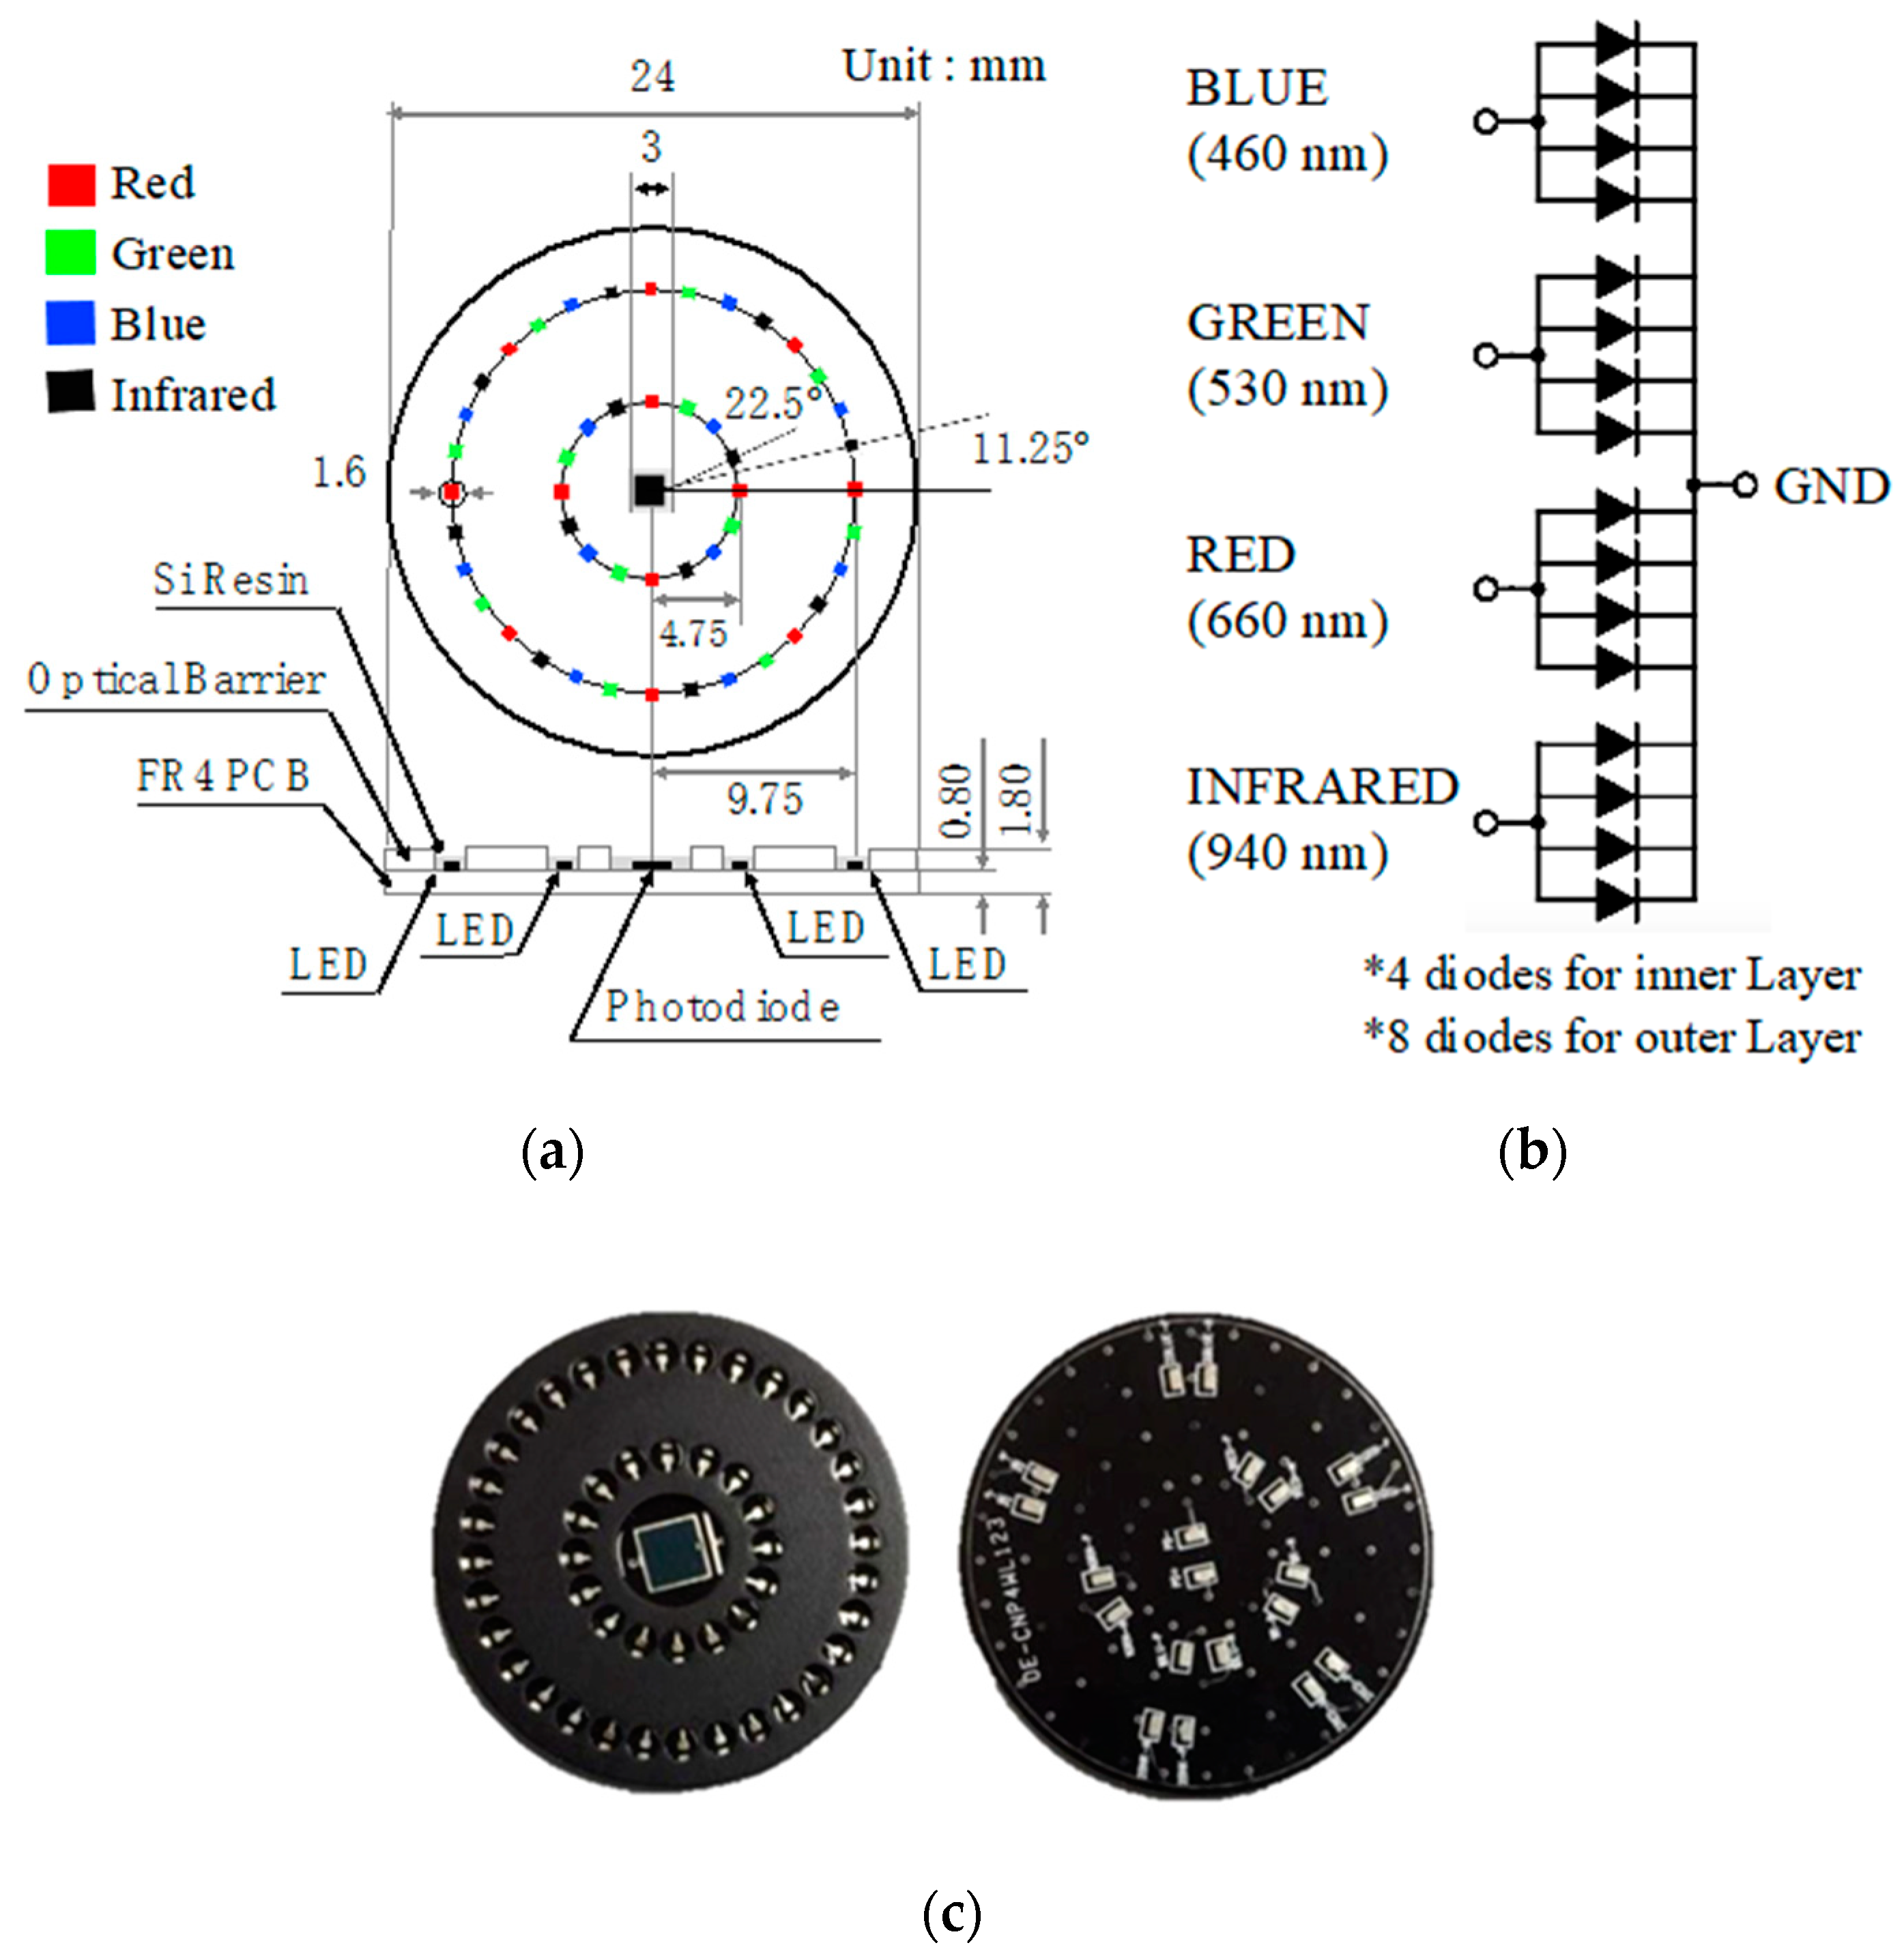
2. Omnidirectional Multi-wavelength PPG sensor
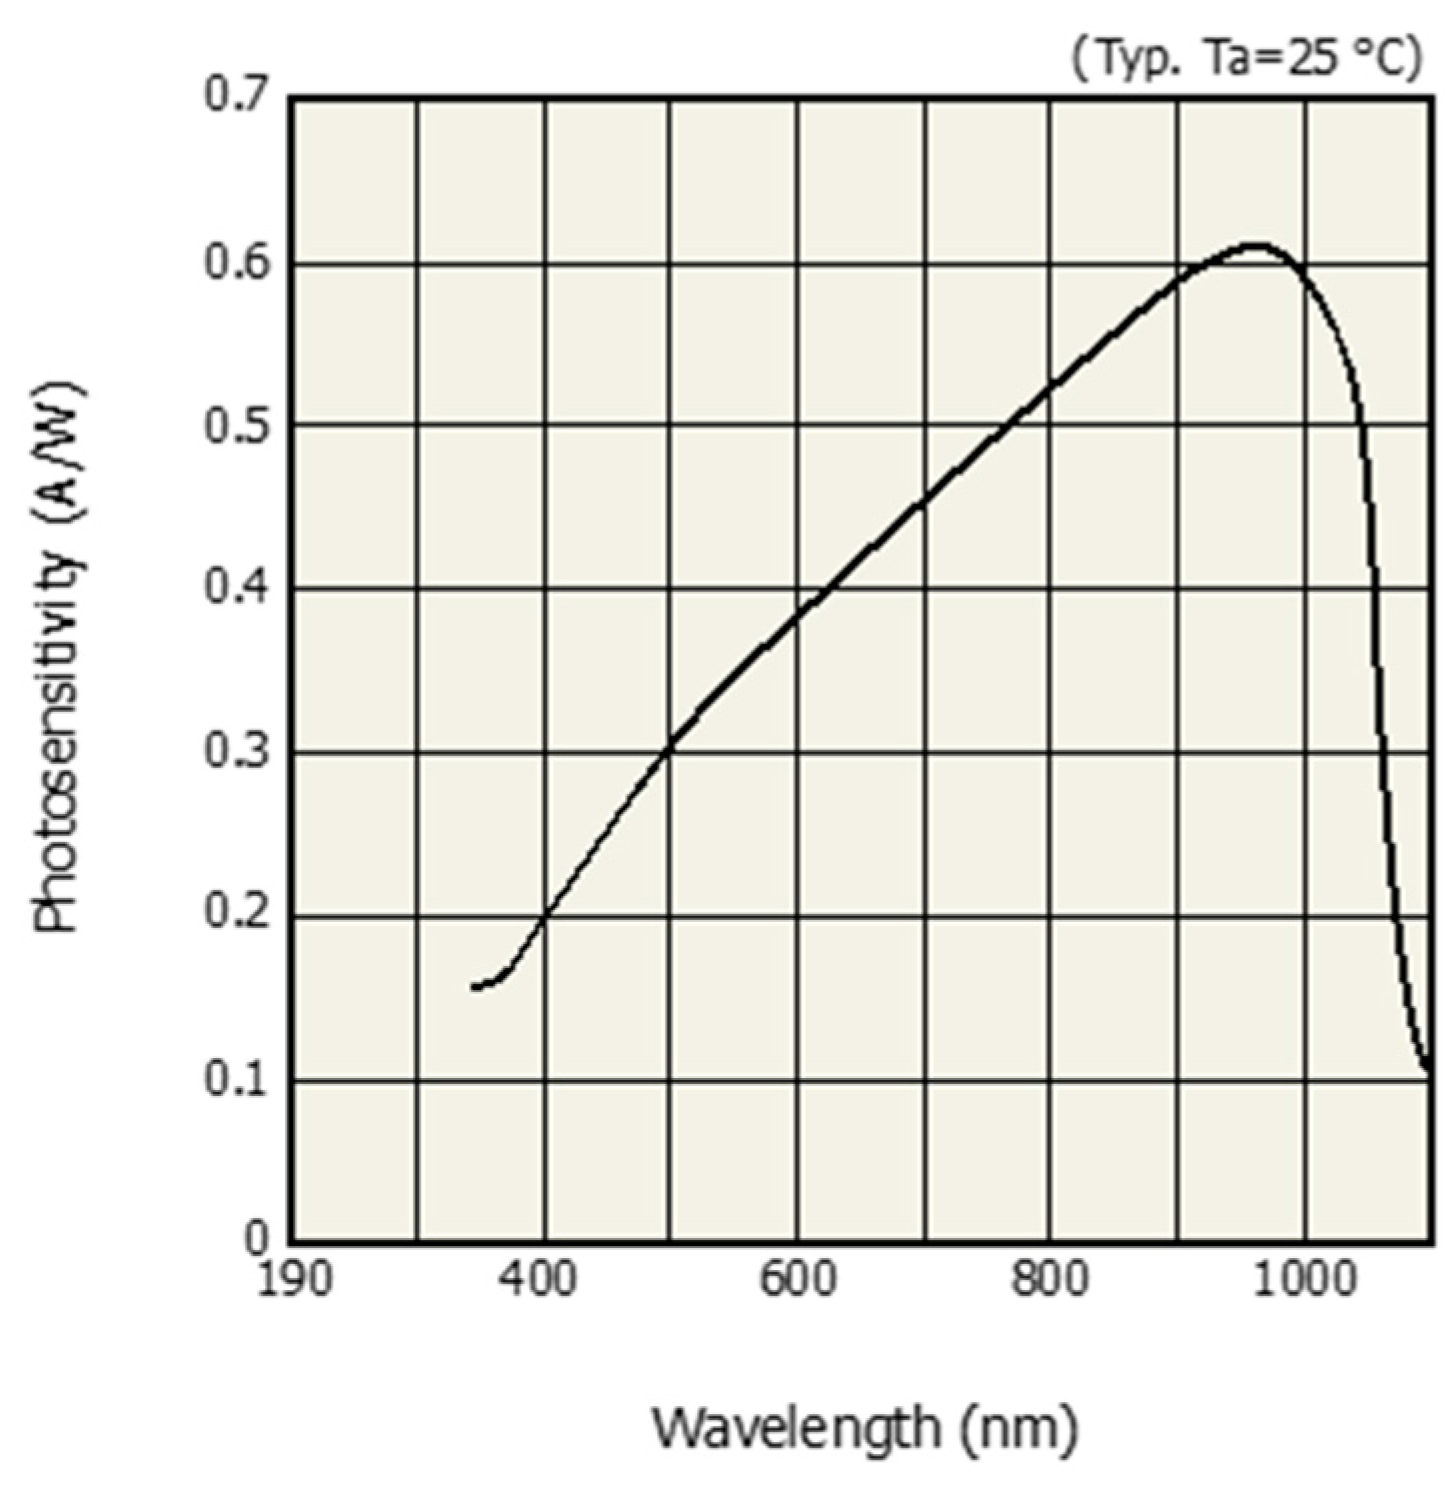
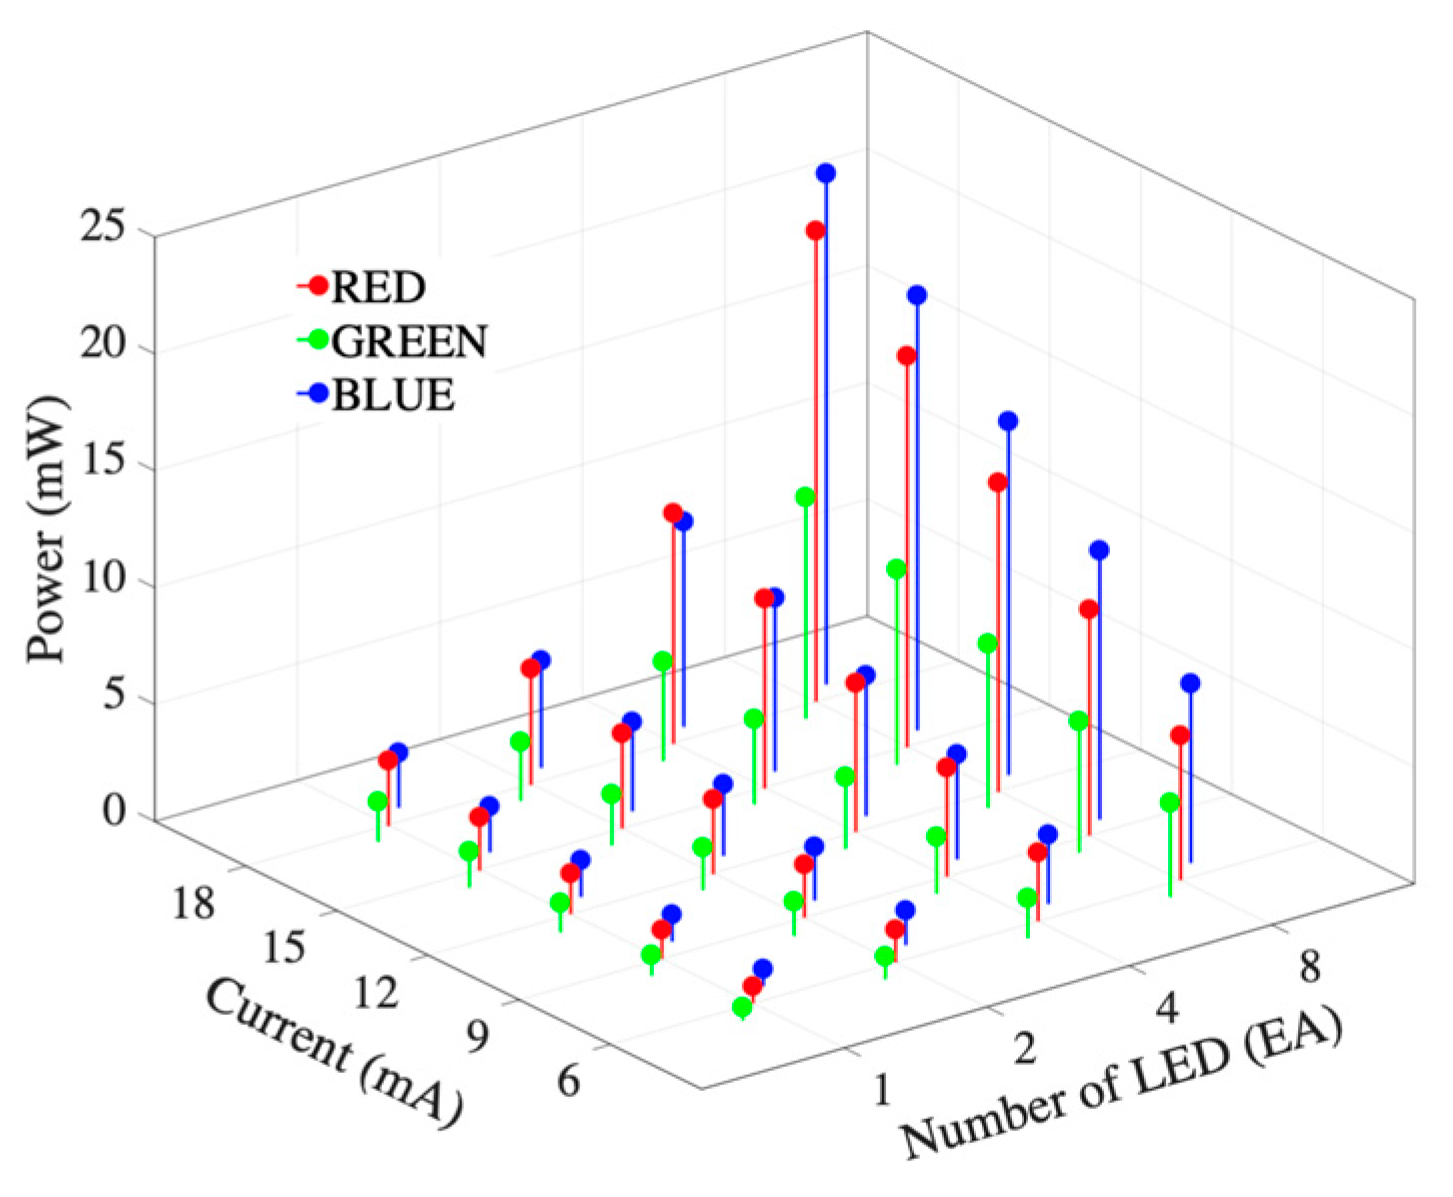
2.1. Sensor Structure and LED Circuit
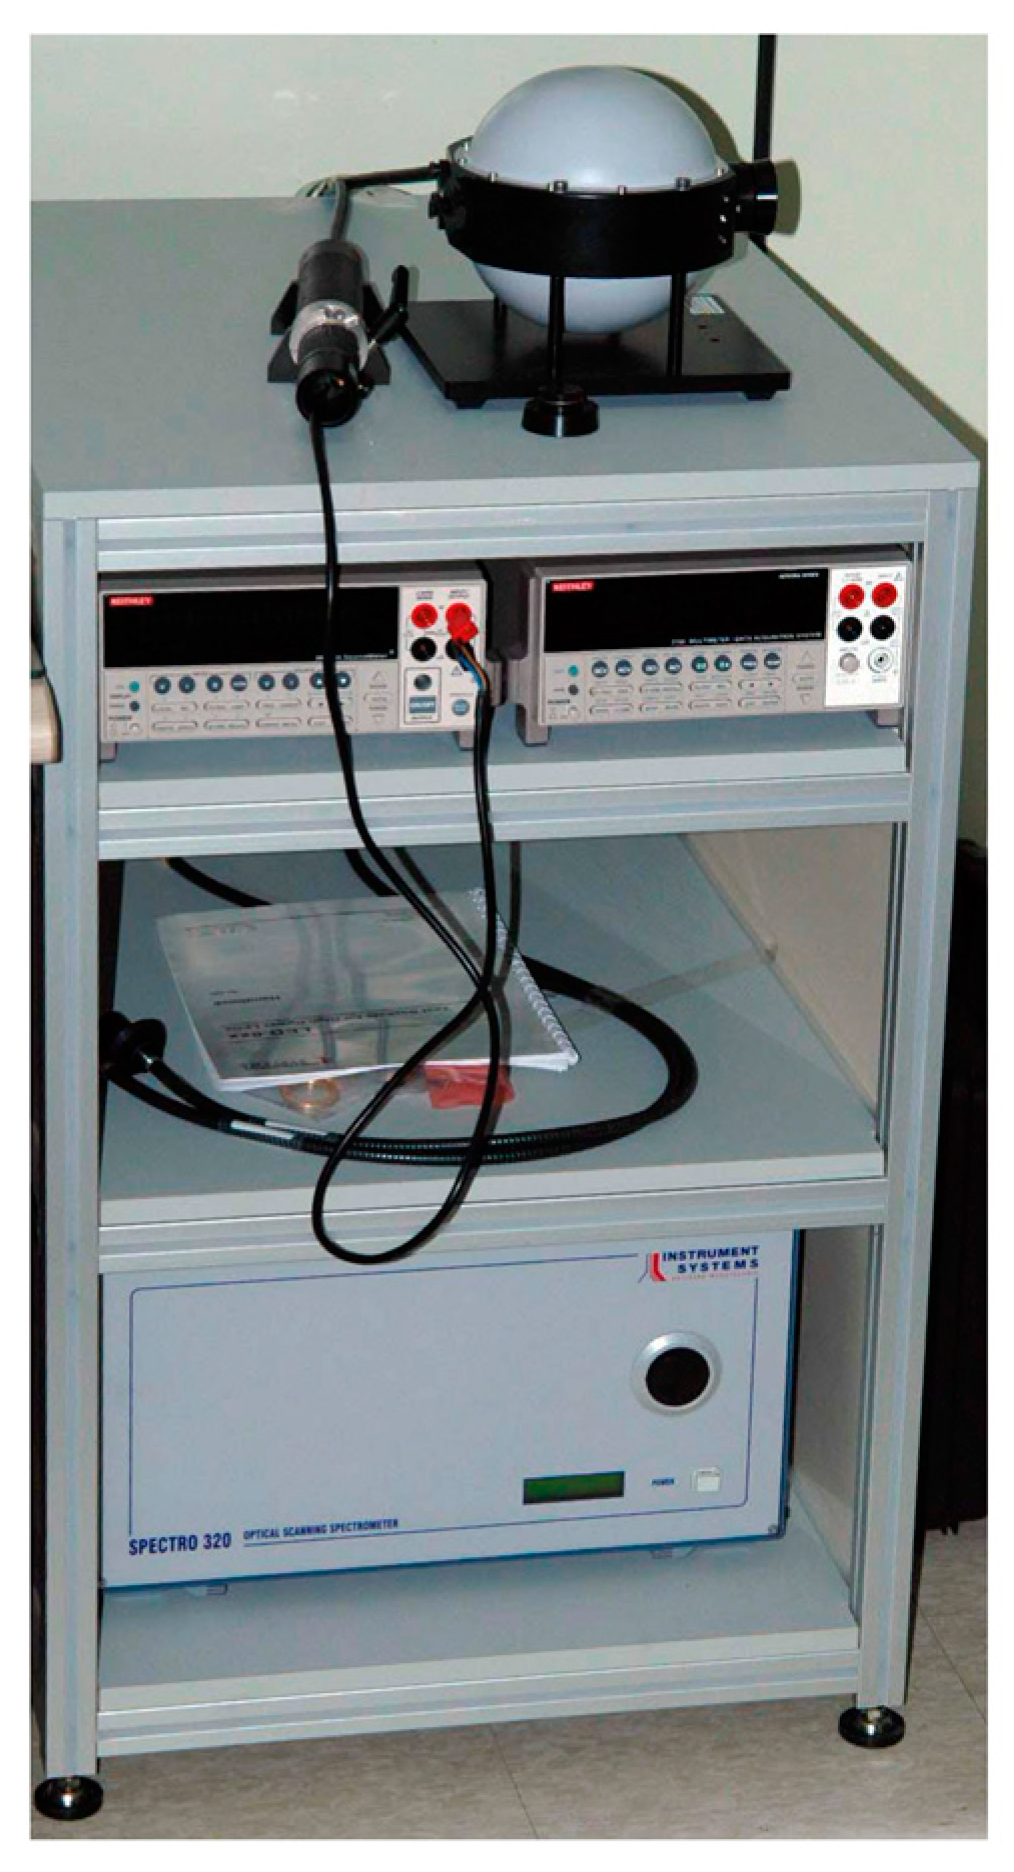
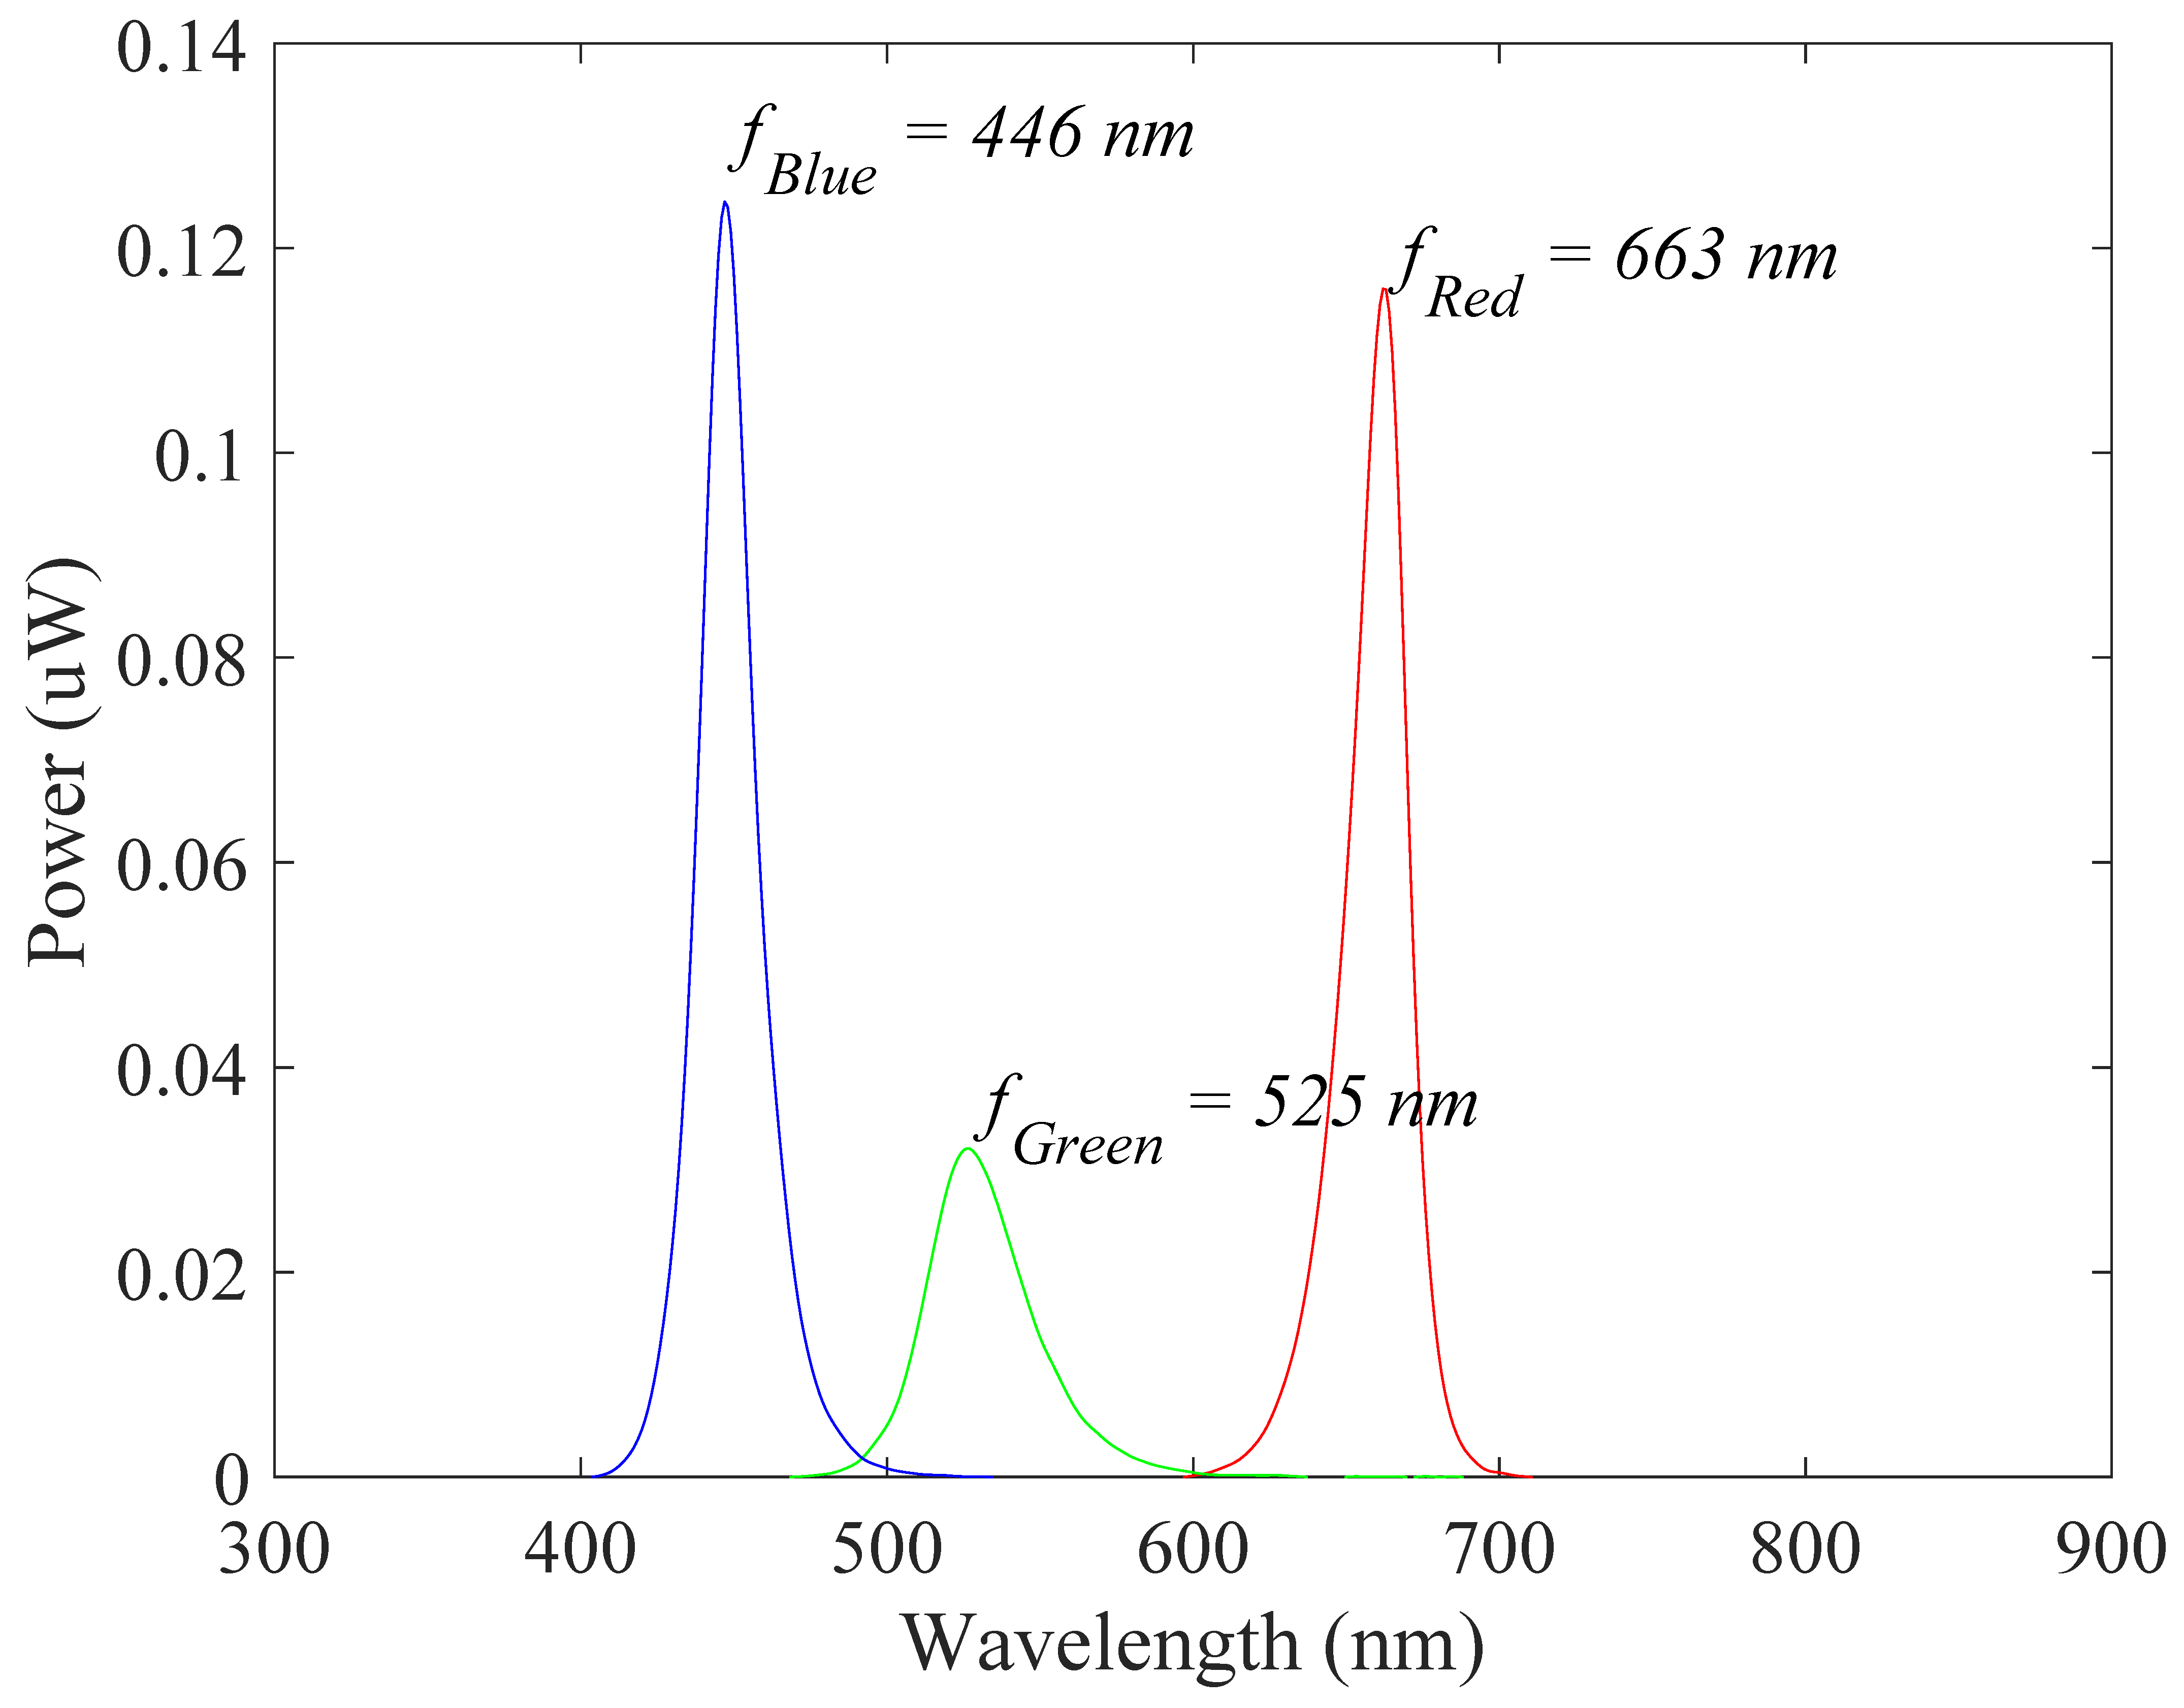
2.2. Photopluminescence Test
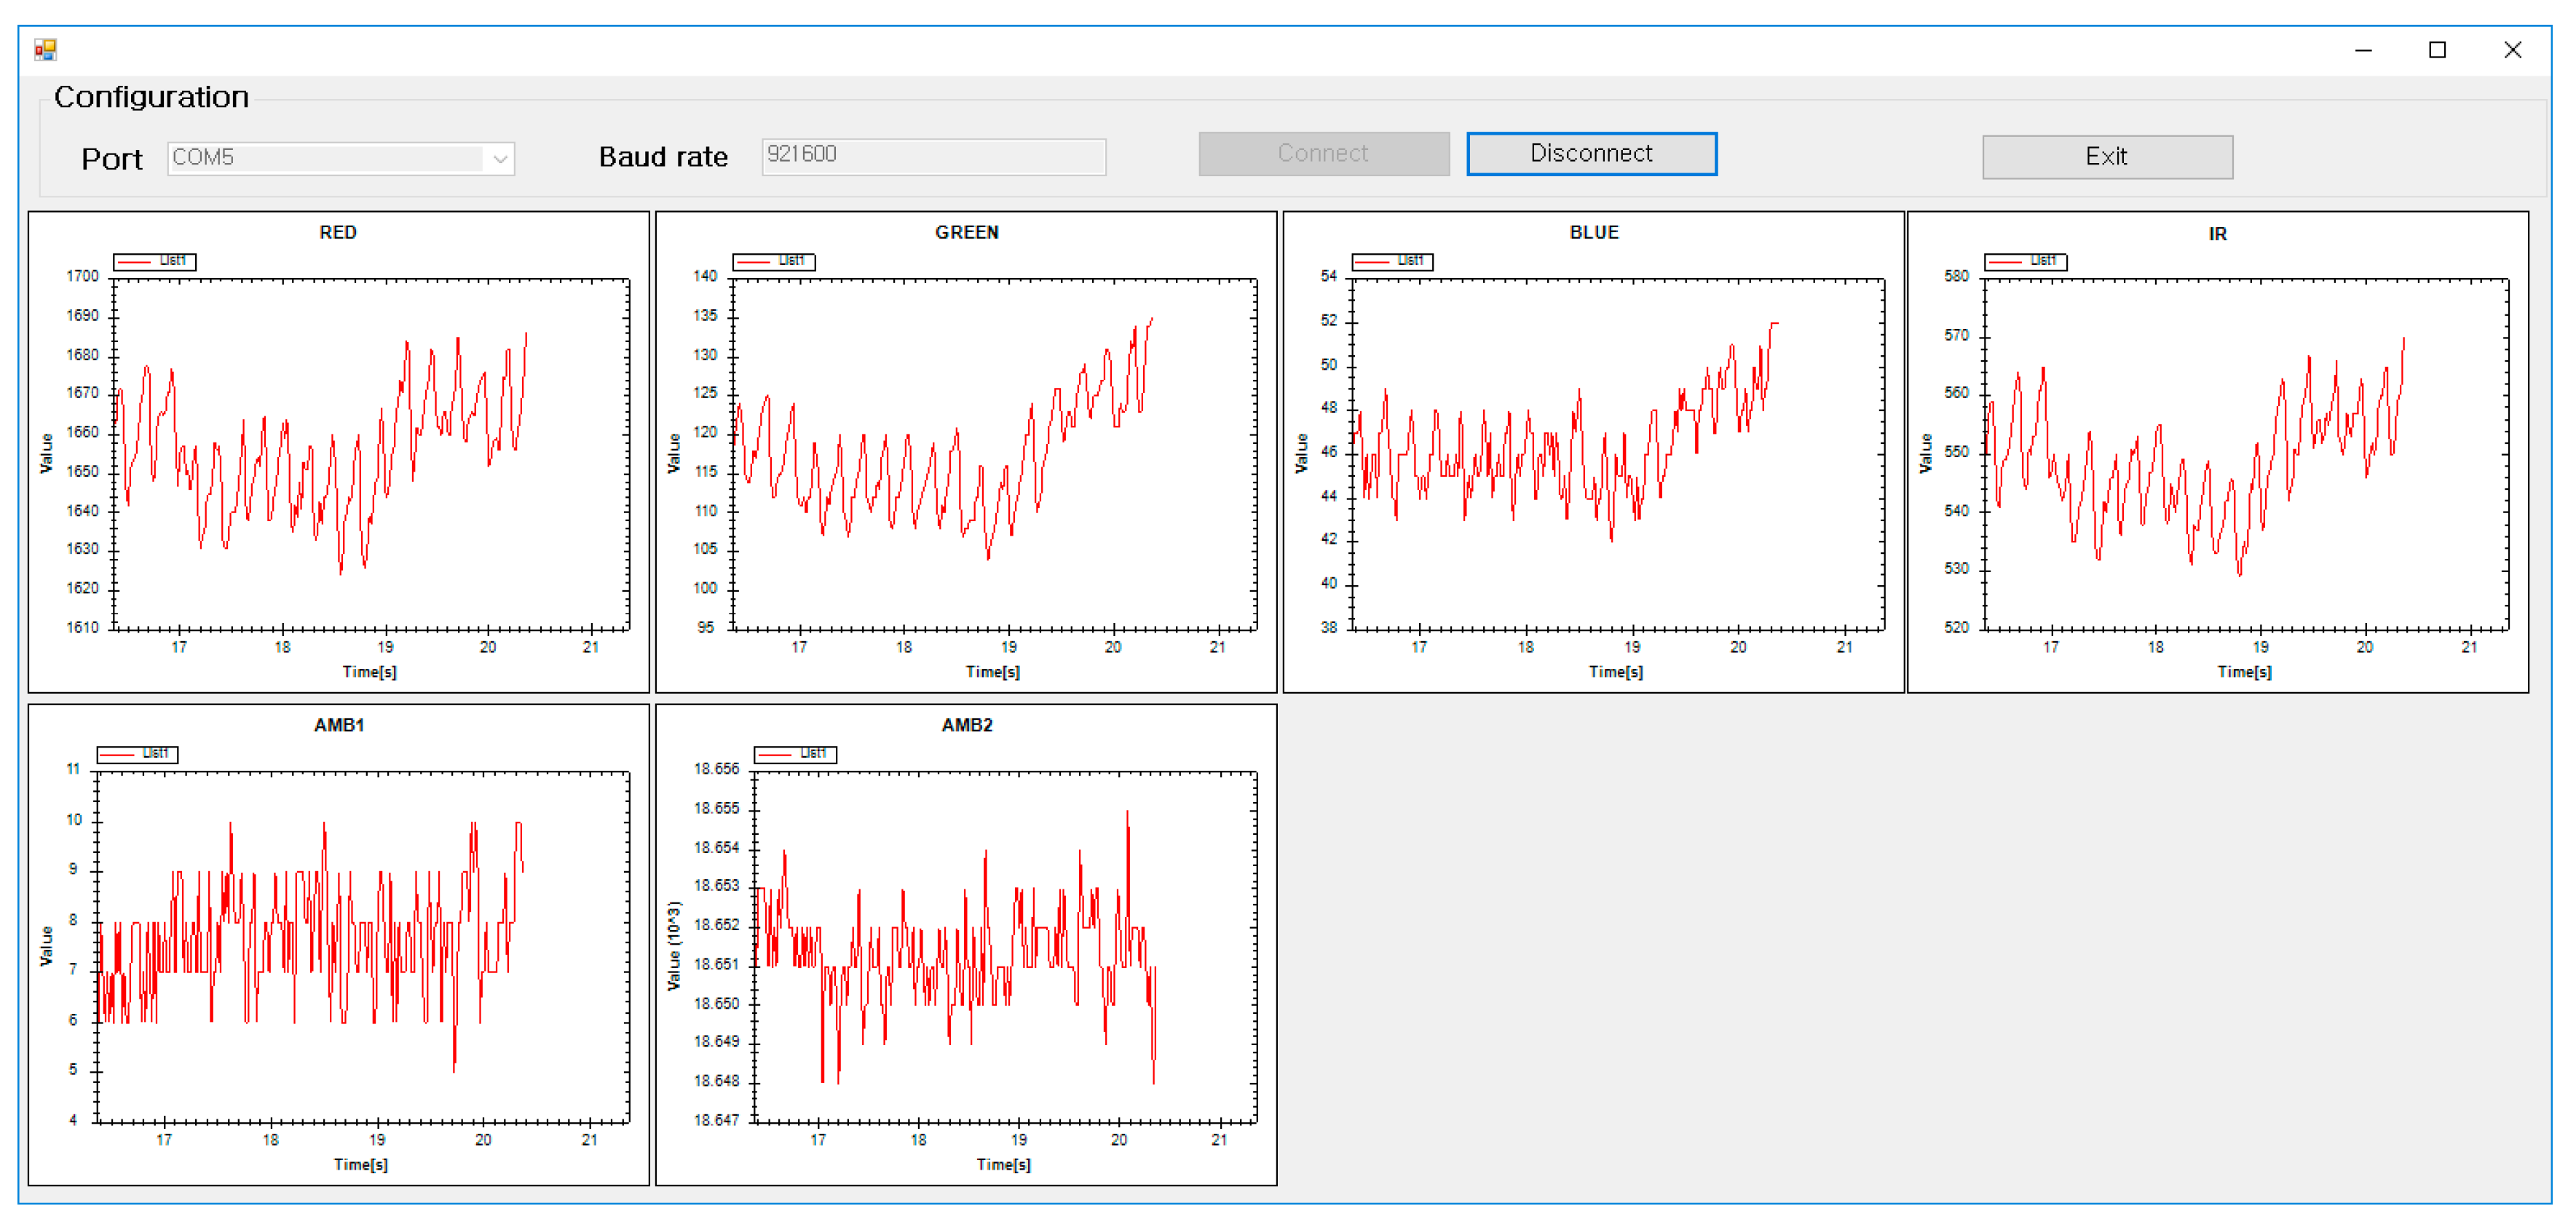
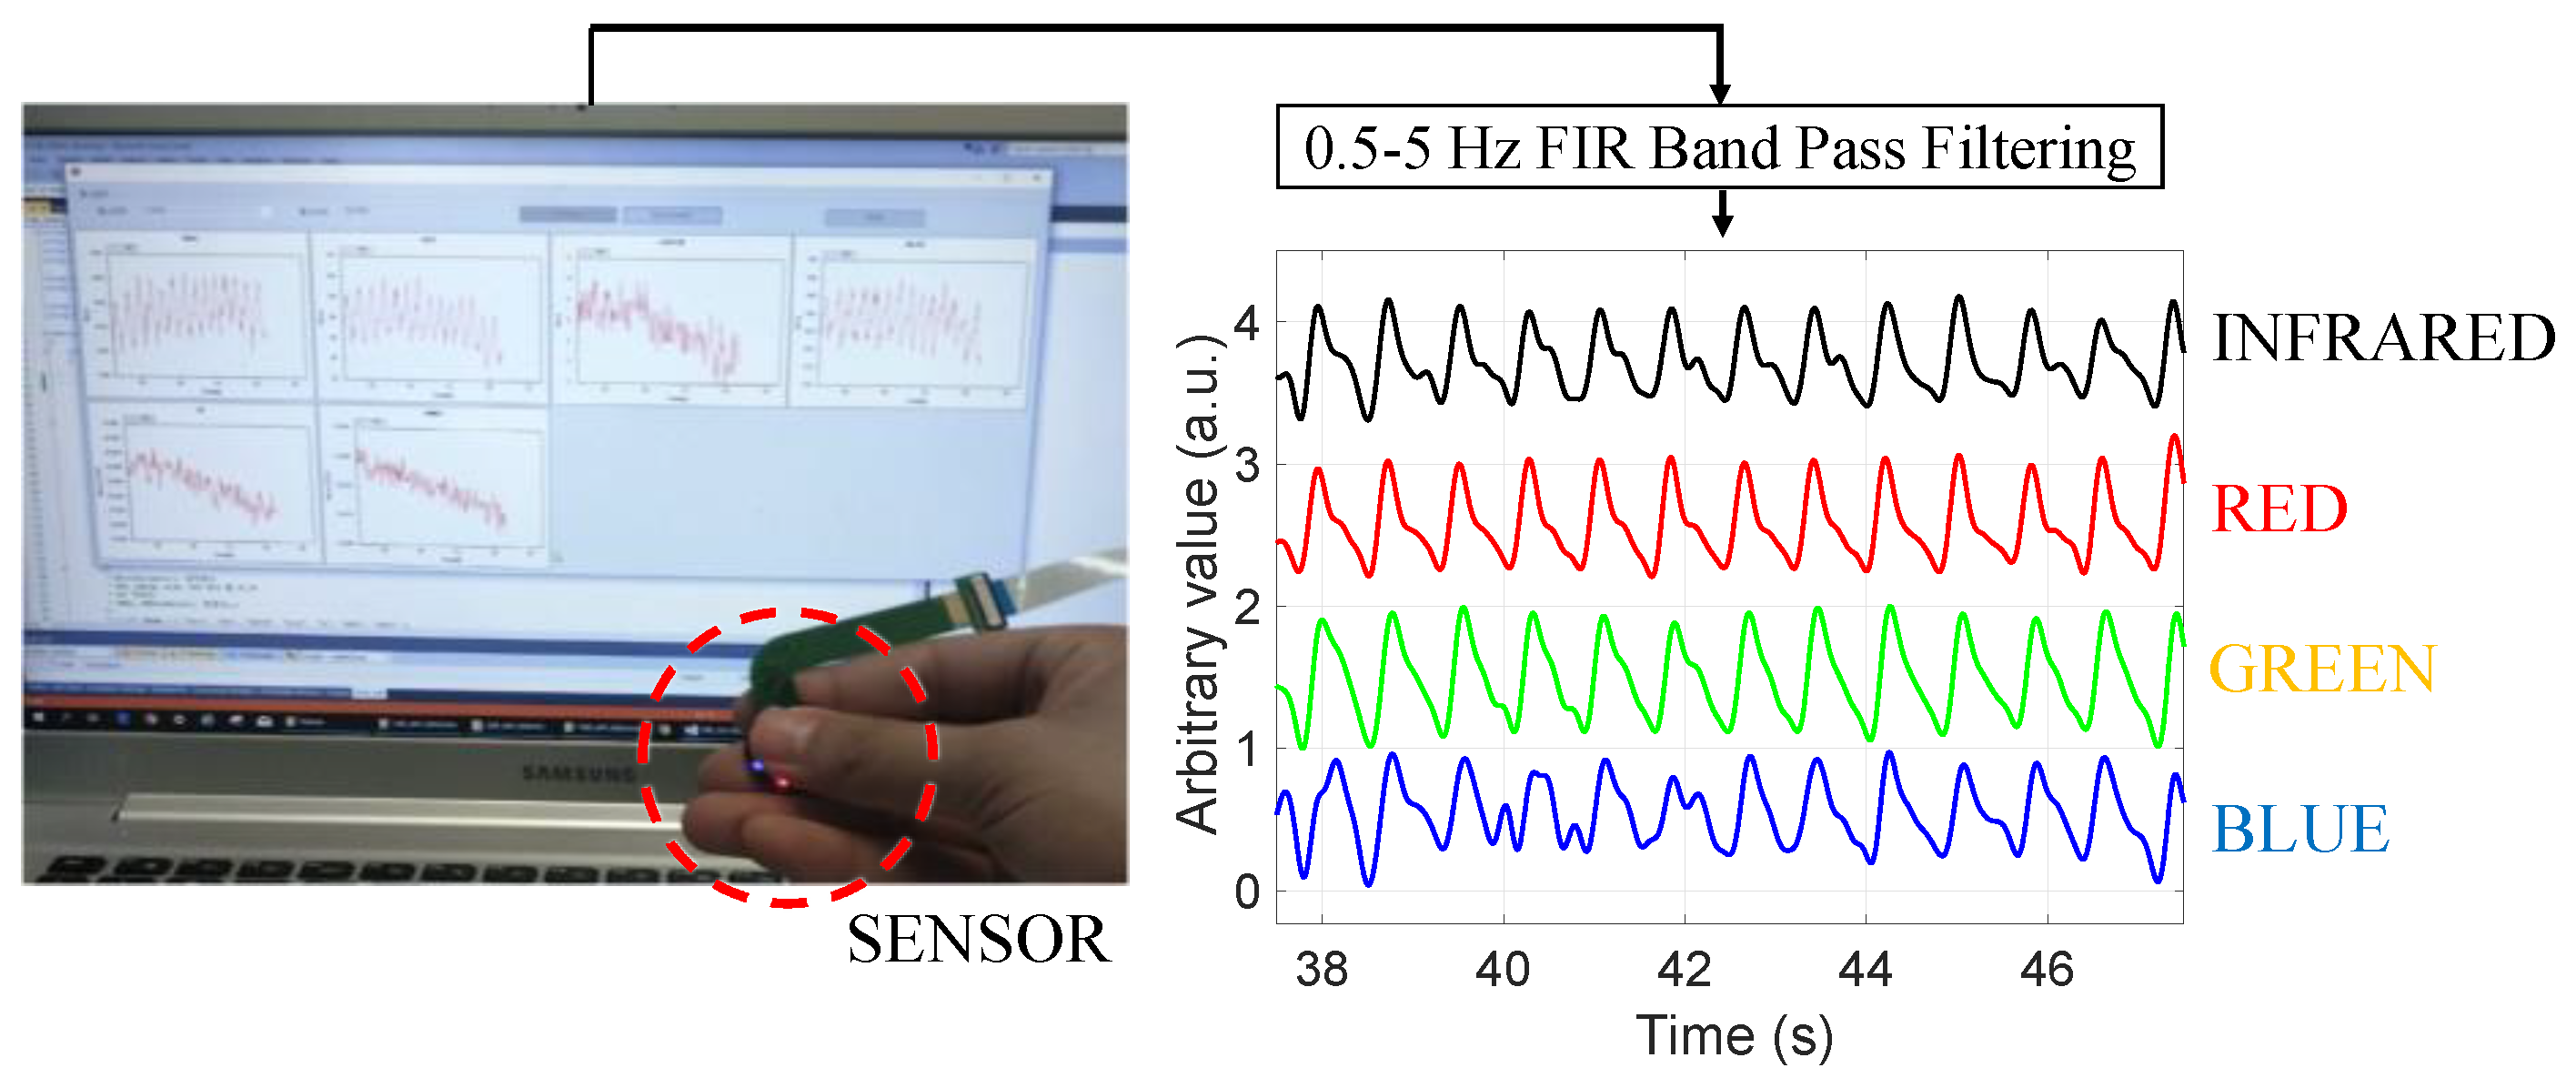
2.3. Pulse Measurement Test
3. Results and Discussion
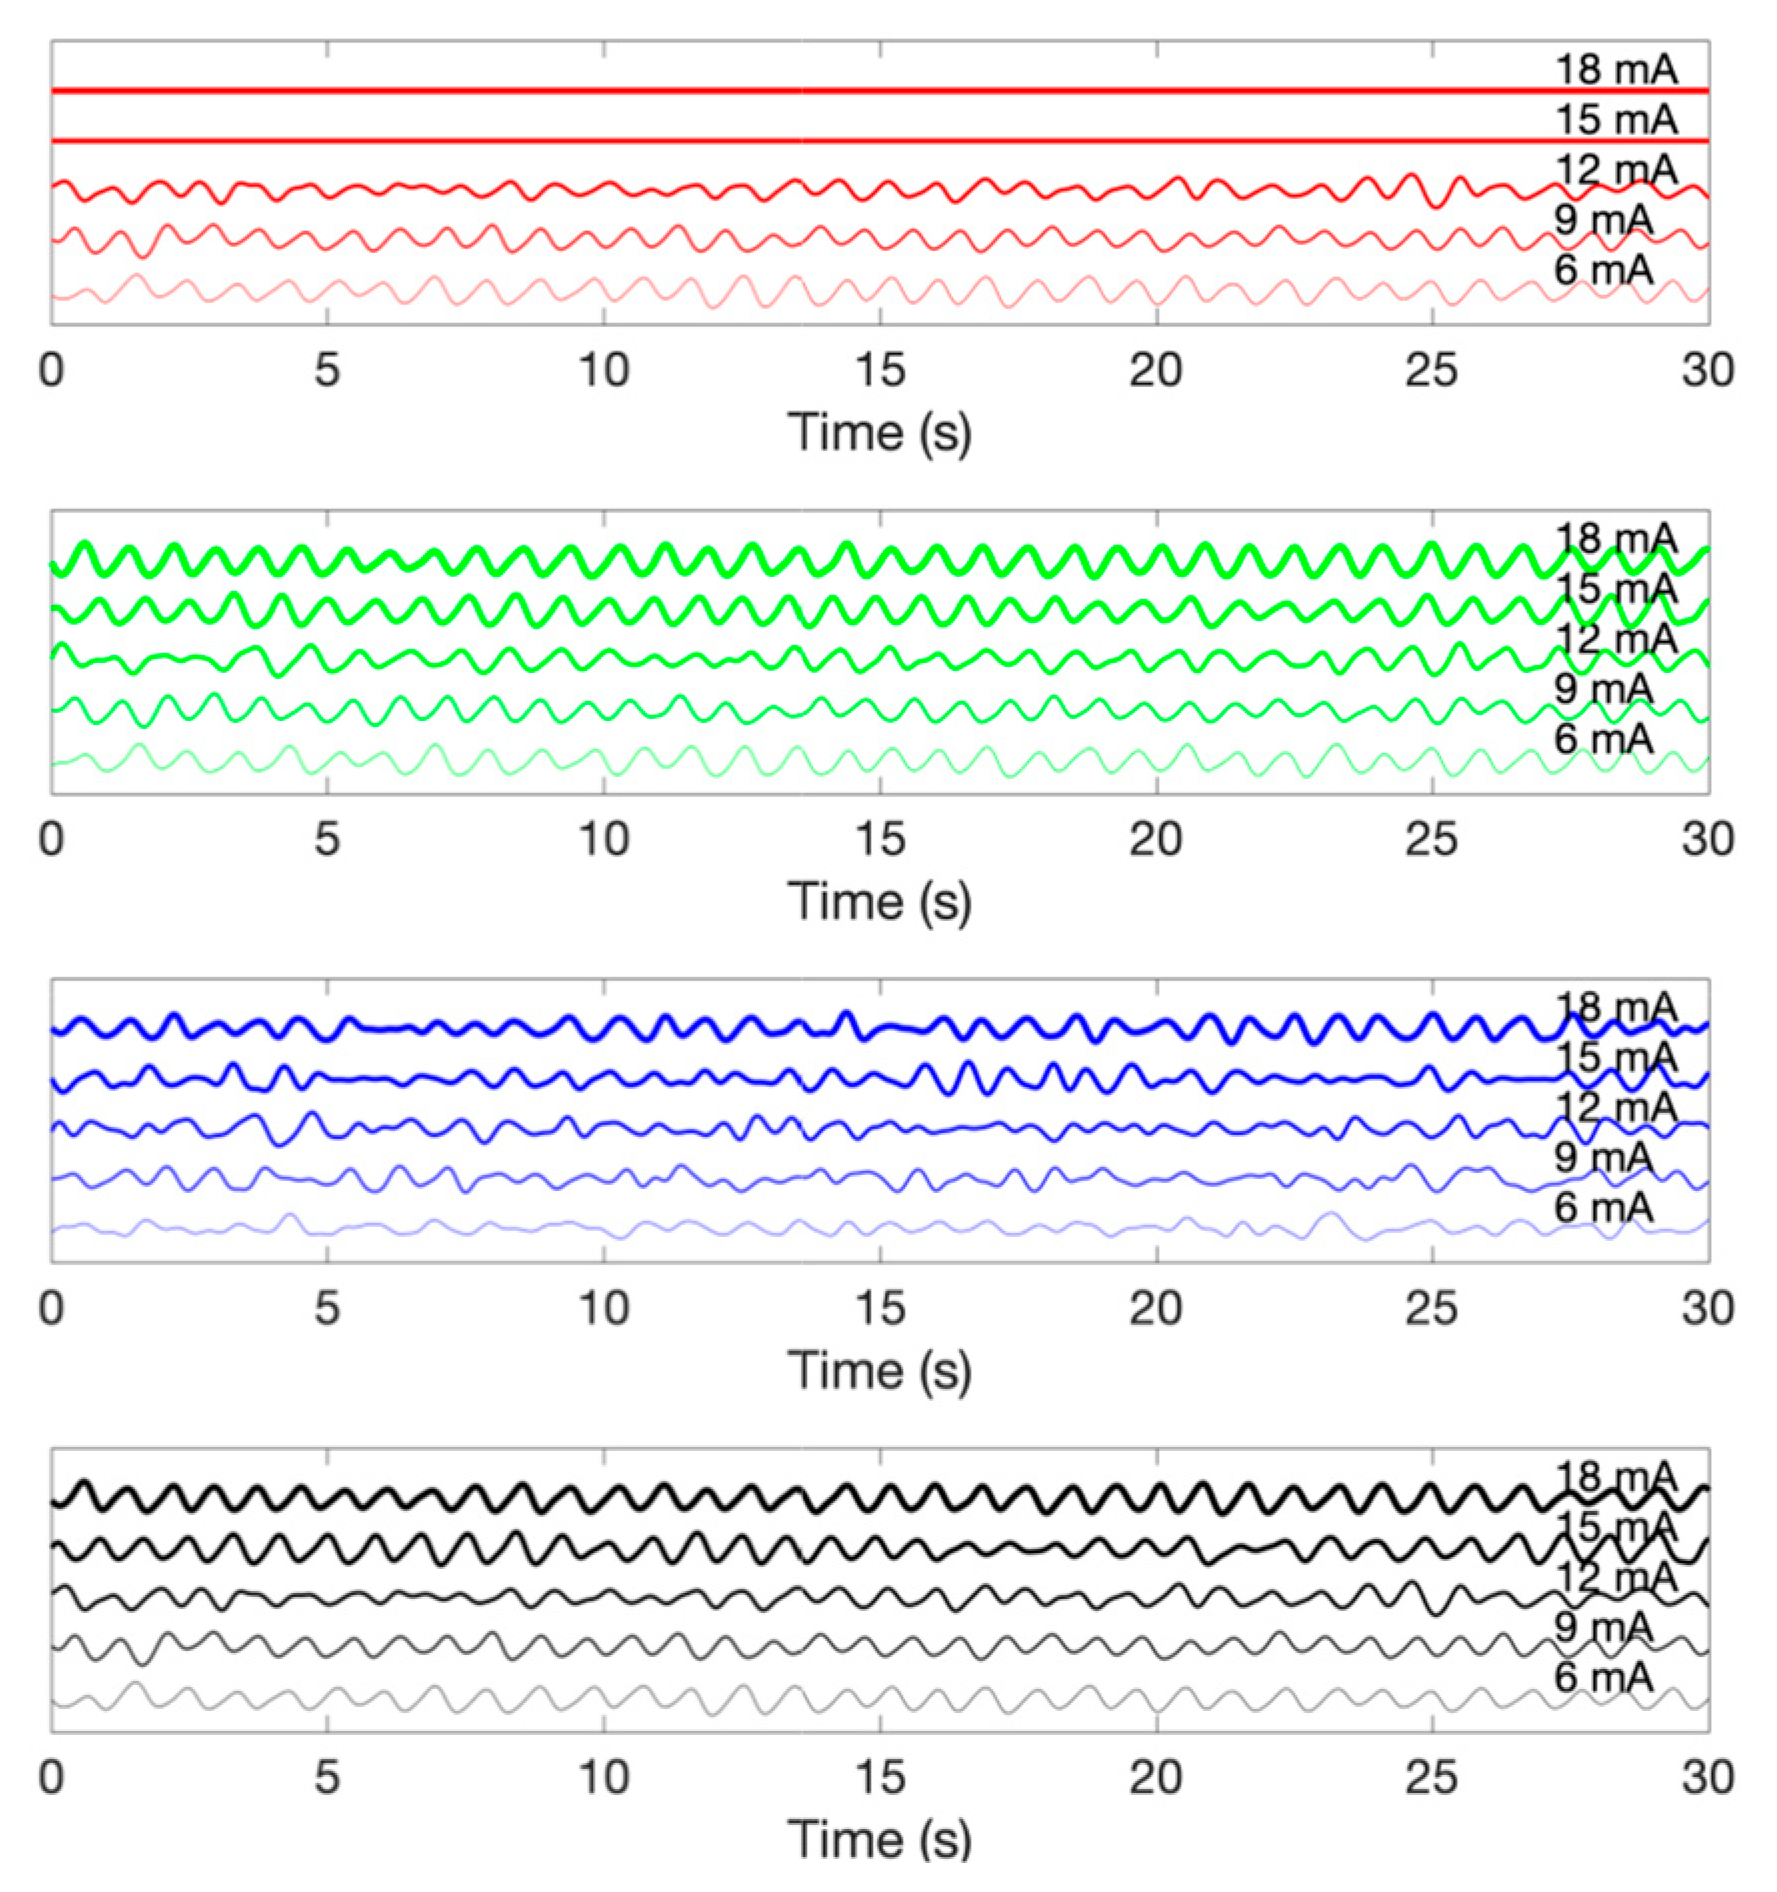
3.1. Photopluminescence Test
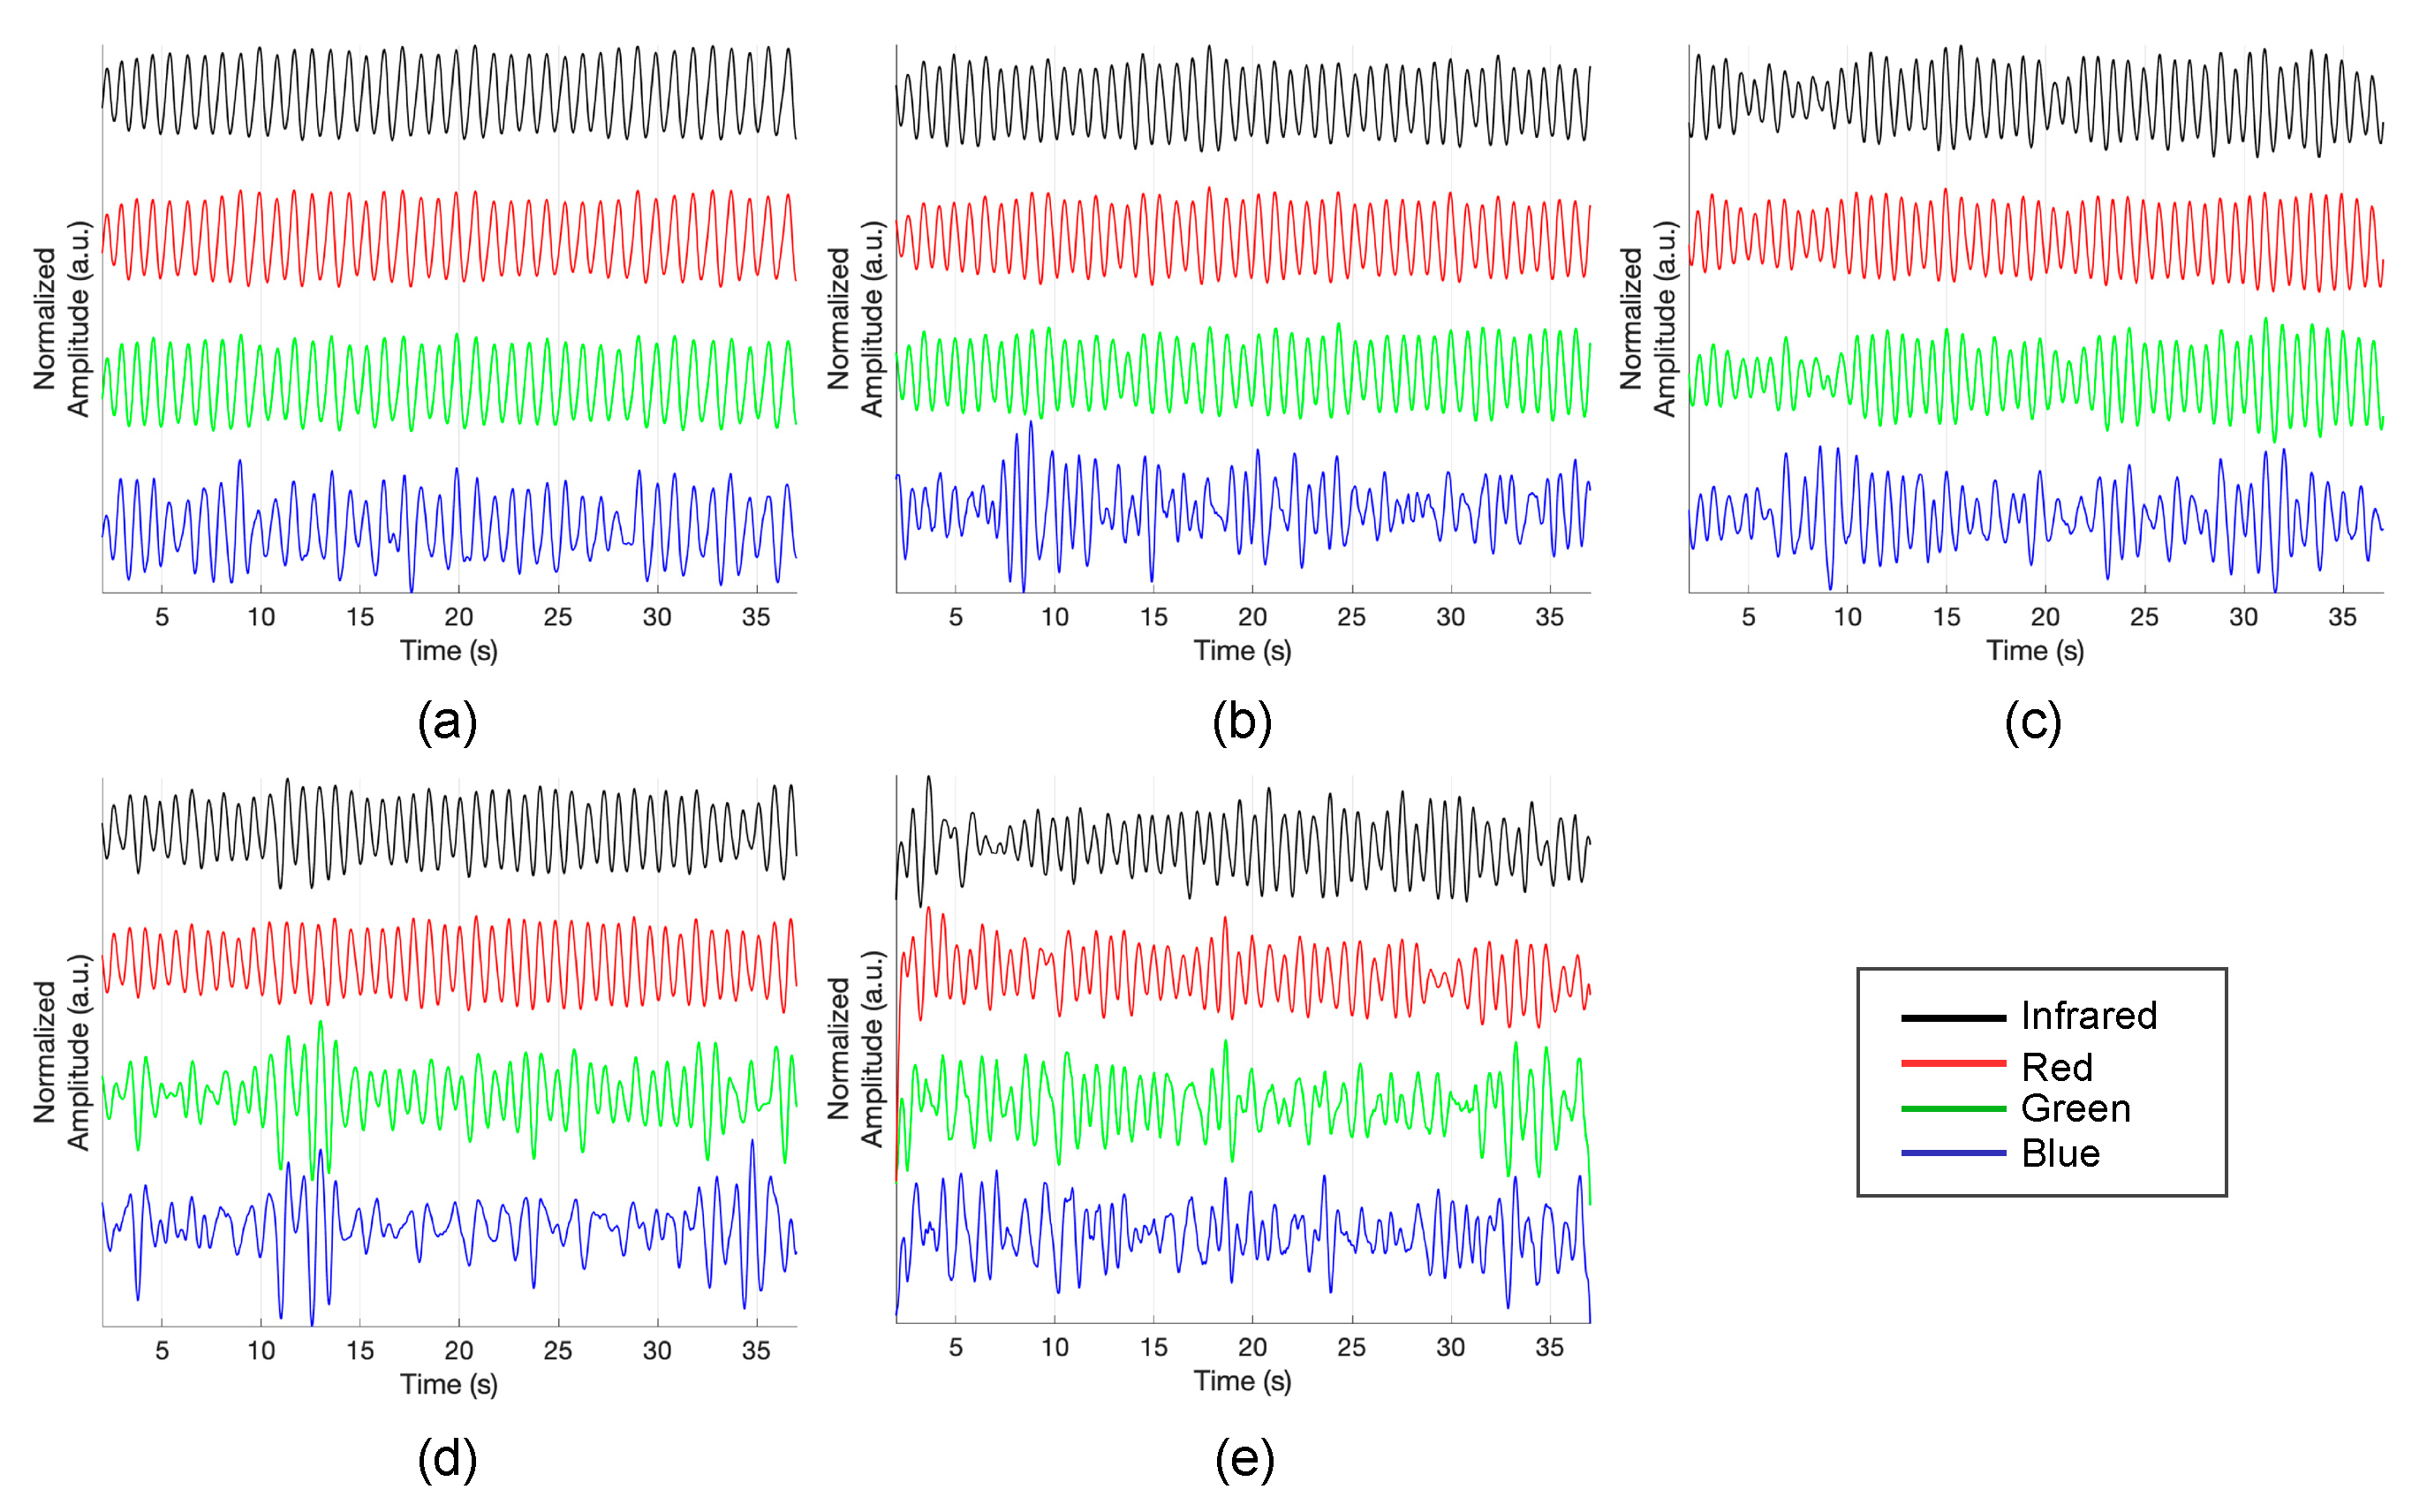
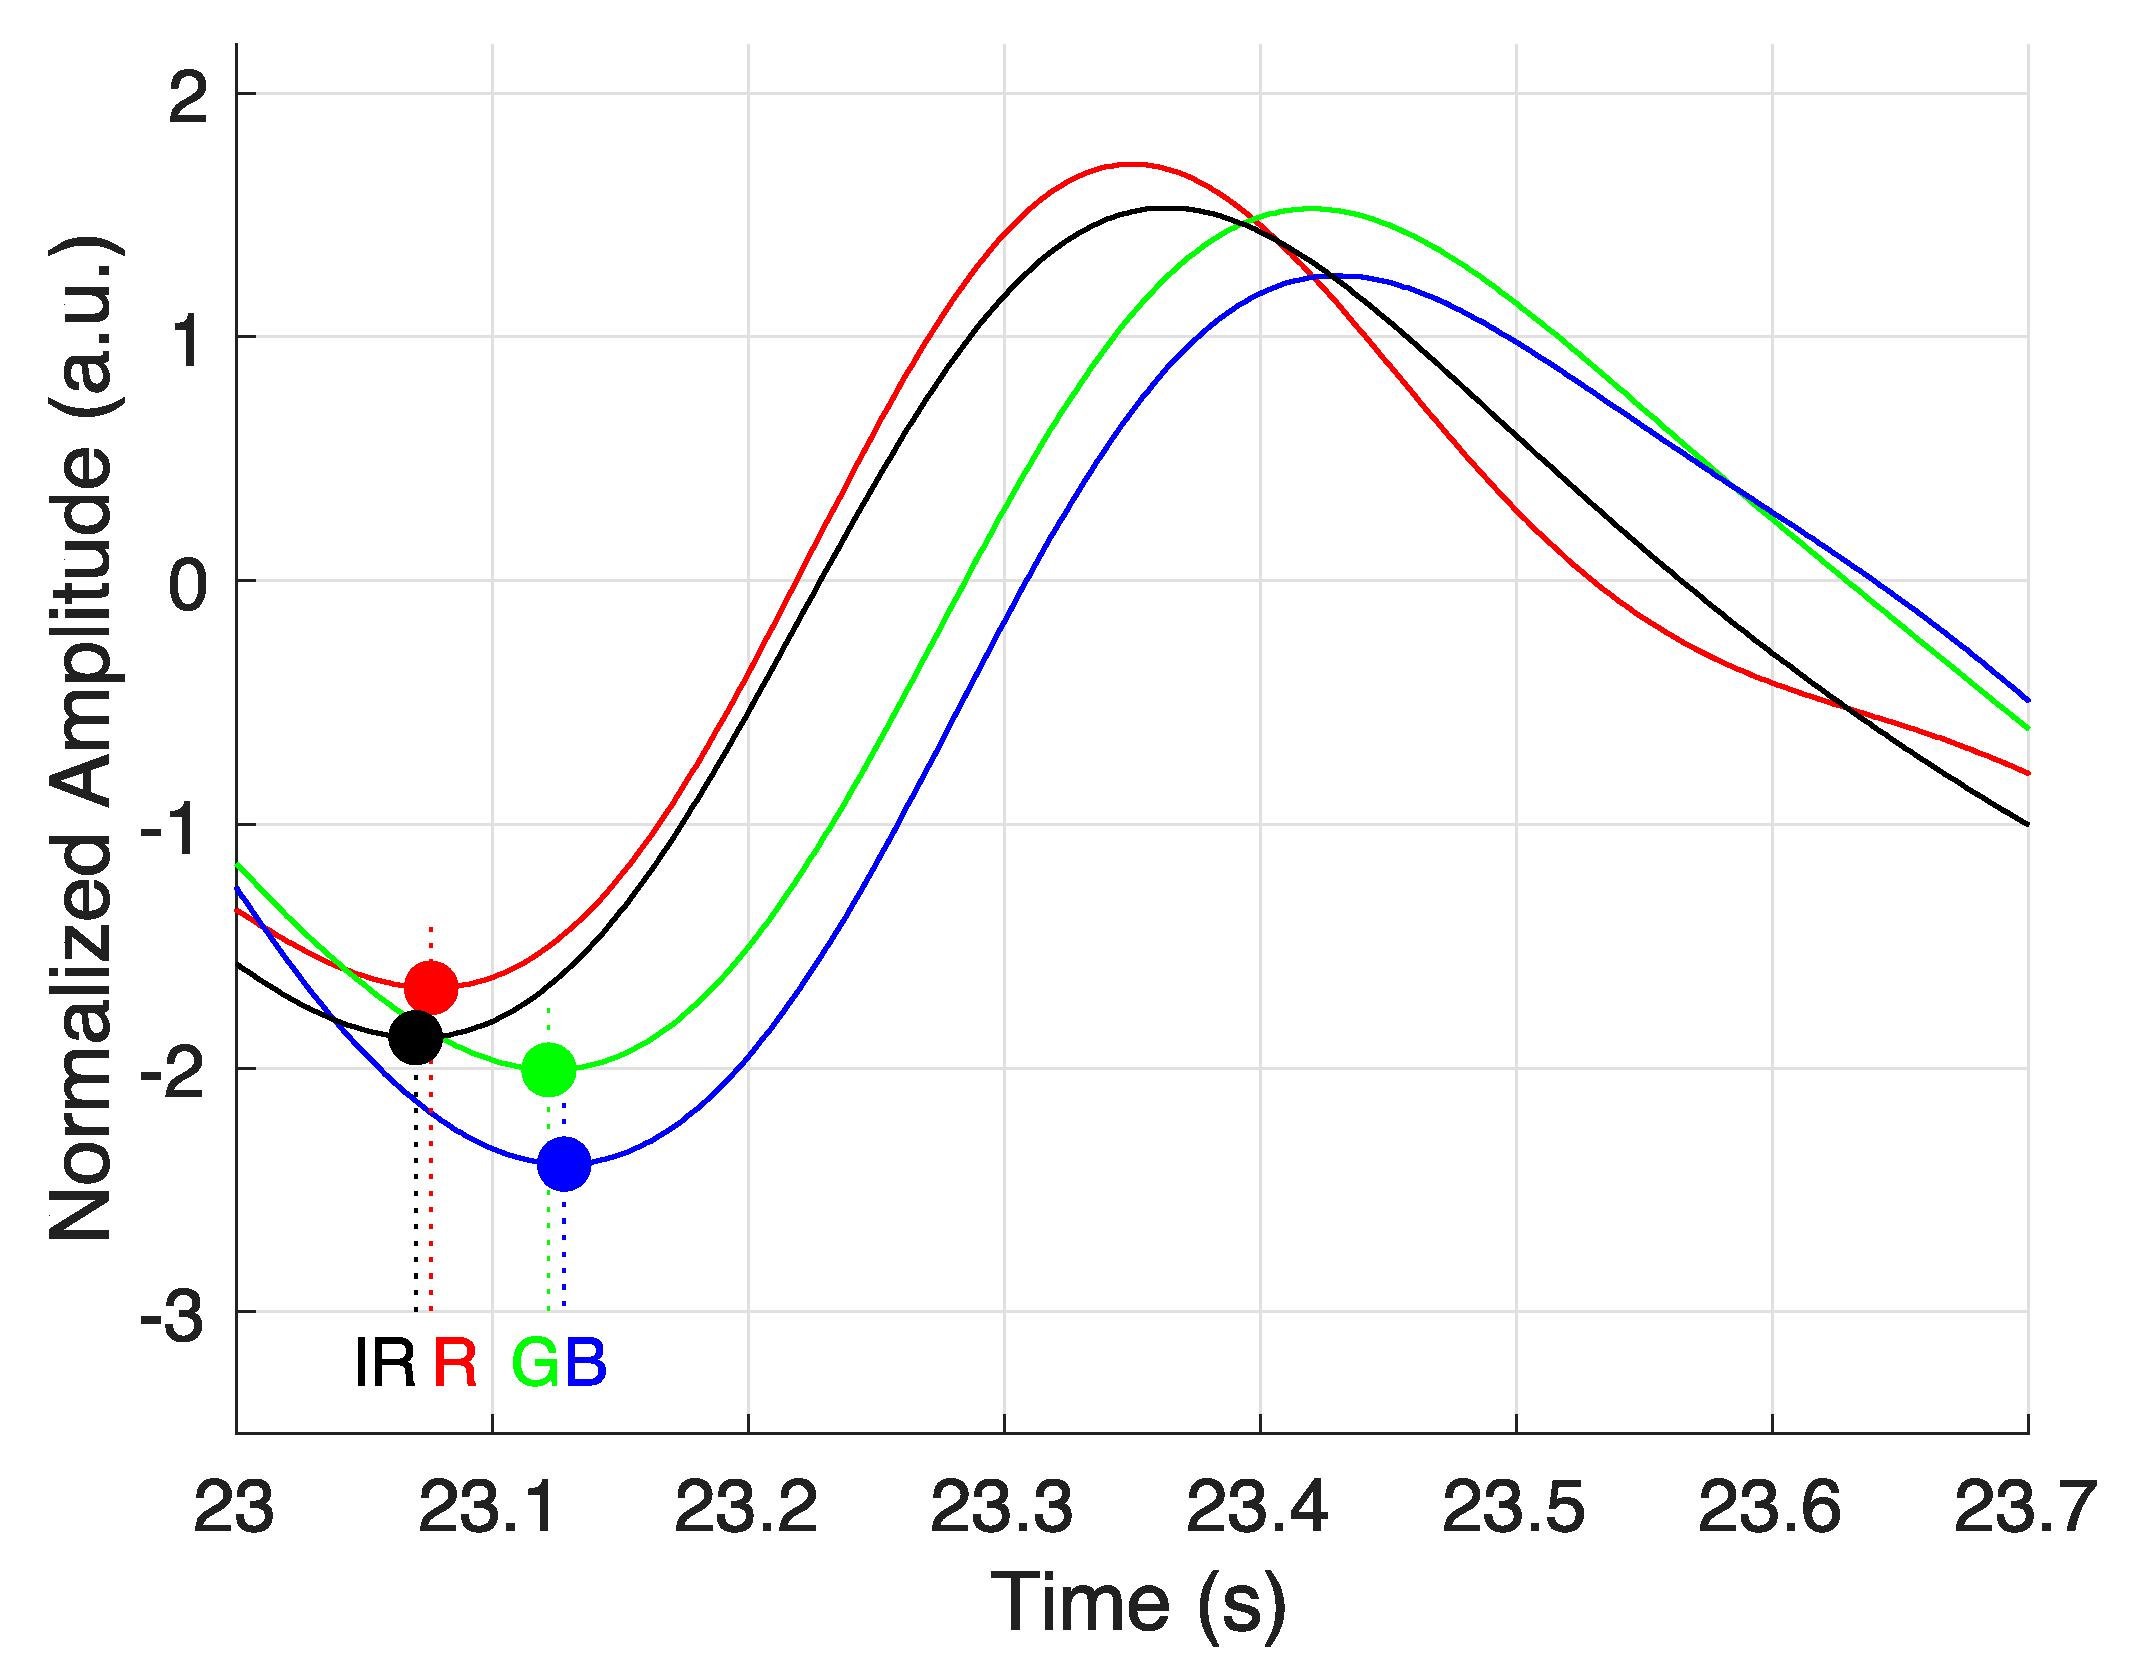
3.2. Pulse Measuerment Test
4. Conclusions
Author Contributions
Funding
Conflicts of Interest
References
- Allen, J. Photoplethysmography and its application in clinical physiological measurement. Physiol. Meas. 2007, 28, R1. [Google Scholar] [CrossRef] [PubMed] [Green Version]
- Delpy, D.T.; Cope, M.; van der Zee, P.; Arridge, S.; Wray, S.; Wyatt, J. Estimation of optical pathlength through tissue from direct time of flight measurement. Phys. Med. Biol. 1988, 33, 1433–1442. [Google Scholar] [CrossRef] [PubMed] [Green Version]
- Ingle, J.D., Jr.; Crouch, S.R. Spectrochemical Analysis; Prentice Hall College Book Division: Old Tappan, NJ, USA, 1988. [Google Scholar]
- Ruggiero, E.; Alonso-de Castro, S.; Habtemariam, A.; Salassa, L. Upconverting nanoparticles for the near infrared photoactivation of transition metal complexes: New opportunities and challenges in medicinal inorganic photochemistry. Dalton Trans. 2016, 45, 13012–13020. [Google Scholar] [CrossRef] [PubMed] [Green Version]
- Liu, J.; Li, Y.; Ding, X.-R.; Dai, W.-X.; Zhang, Y.-T. Effects of cuff inflation and deflation on pulse transit time measured from ECG and multi-wavelength PPG. In Proceedings of the 2015 37th Annual International Conference of the IEEE Engineering in Medicine and Biology Society (EMBC), Milan, Italy, 25–29 August 2015; pp. 5973–5976. [Google Scholar]
- Liu, J.; Yan, B.P.; Zhang, Y.-T.; Ding, X.-R.; Su, P.; Zhao, N. Multi-wavelength photoplethysmography enabling continuous blood pressure measurement with compact wearable electronics. IEEE Trans. Biomed. Eng. 2018, 66, 1514–1525. [Google Scholar] [CrossRef] [PubMed]
- Liu, J.; Yan, B.P.-Y.; Dai, W.-X.; Ding, X.-R.; Zhang, Y.-T.; Zhao, N. Multi-wavelength photoplethysmography method for skin arterial pulse extraction. Biomed. Opt. Express 2016, 7, 4313–4326. [Google Scholar] [CrossRef] [PubMed] [Green Version]
- Liu, J.; Zhang, Y.-T.; Ding, X.-R.; Dai, W.-X.; Zhao, N. A preliminary study on multi-wavelength PPG based pulse transit time detection for cuffless blood pressure measurement. In Proceedings of the 2016 38th Annual International Conference of the IEEE Engineering in Medicine and Biology Society (EMBC), Orlando, FL, USA, 16–20 August 2016; pp. 615–618. [Google Scholar]
- Spigulis, J.; Gailite, L.; Lihachev, A. Multi-wavelength photoplethysmography for simultaneous recording of skin blood pulsations at different vascular depths. In Proceedings of the Advanced Biomedical and Clinical Diagnostic Systems V, San Jose, CA, USA, 6 February 2007; p. 64301. [Google Scholar]
- Spigulis, J.; Gailite, L.; Lihachev, A.; Erts, R. Simultaneous recording of skin blood pulsations at different vascular depths by multiwavelength photoplethysmography. Appl. Opt. 2007, 46, 1754–1759. [Google Scholar] [CrossRef] [PubMed] [Green Version]
- Avci, P.; Gupta, A.; Sadasivam, M.; Vecchio, D.; Pam, Z.; Pam, N.; Hamblin, M.R. Low-level laser (light) therapy (LLLT) in skin: Stimulating, healing, restoring. Semin. Cutan. Med. Surg. 2013, 32, 41–45. [Google Scholar] [PubMed]
- Pries, A.; Secomb, T.W.; Gaehtgens, P. Relationship between structural and hemodynamic heterogeneity in microvascular networks. Am. J. Physiol. Heart Circ. Physiol. 1996, 270, H545–H553. [Google Scholar] [CrossRef] [PubMed]
- Baek, H.J.; Sim, S.Y.; Kim, J.S.; Park, K.S. Effect of sensor configurations on indirect-contact photoplethysmogram measurement system. In Proceedings of the 2010 5th Cairo International Biomedical Engineering Conference, Cairo, Egypt, 16–18 December 2010; pp. 244–246. [Google Scholar]
- Photodiode, S. S1337 Series Technical Data Sheet; Hamamatsu Photonics KK, Solid State Division: Hamamatsu City, Japan, 2001. [Google Scholar]
- Chatterjee, S.; Kyriacou, P.A. Monte Carlo Analysis of Optical Interactions in Reflectance and Transmittance Finger Photoplethysmography. Sensors 2019, 19, 789. [Google Scholar] [CrossRef] [PubMed] [Green Version]


| Property | Value |
|---|---|
| Spectral range | 200−920 nm |
| Spectral resolution | 0.07 nm |
| Wavelength | ± 0.3 nm |
| VIS sensitivity range for irradiance | 2 · 10−15 W/nm |
| VIS signal sensitivity at 1s integration time | 1 · 10−7 W/m2nm |
| Scan speed | 10−100 msec/nm |
| Intensity | 0.01 mcd–800 cd or over |
| Luminance flux | 0.02 mlm–400 lm |
| VIS, visible spectrum; CRI, color rendering index | |
| Number of LED | Color | Radiant Flux According to the Current (mW) | ||||
|---|---|---|---|---|---|---|
| 6 mA | 9 mA | 12 mA | 15 mA | 18 mA | ||
| 1 | R | 0.721 ± 0.081 | 1.231 ± 0.098 | 1.733 ± 0.121 | 2.228 ± 0.153 | 2.740 ± 0.173 |
| G | 0.376 ± 0.052 | 0.601 ± 0.074 | 0.803 ± 0.072 | 0.991 ± 0.074 | 1.158 ± 0.083 | |
| B | 0.914 ± 0.032 | 1.439 ± 0.048 | 1.975 ± 0.036 | 2.471 ± 0.034 | 2.910 ± 0.130 | |
| 2 | R | 1.393 ± 0.043 | 2.270 ± 0.076 | 3.149 ± 0.095 | 4.059 ± 0.110 | 4.919 ± 0.124 |
| G | 0.980 ± 0.023 | 1.422 ± 0.027 | 1.826 ± 0.039 | 2.191 ± 0.017 | 2.524 ± 0.038 | |
| B | 1.477 ± 0.041 | 2.292 ± 0.029 | 3.060 ± 0.046 | 3.817 ± 0.020 | 4.536 ± 0.036 | |
| 4 | R | 2.930 ± 0.105 | 4.653 ± 0.213 | 6.365 ± 0.295 | 8.068 ± 0.368 | 9.815 ± 0.498 |
| G | 1.718 ± 0.024 | 2.433 ± 0.030 | 3.086 ± 0.034 | 3.650 ± 0.030 | 4.201 ± 0.029 | |
| B | 2.961 ± 0.052 | 4.487 ± 0.046 | 5.956 ± 0.068 | 7.372 ± 0.064 | 8.719 ± 0.068 | |
| Property/Color | Red | Green | Blue |
|---|---|---|---|
| Peak wavelength (nm) | 660.8 ± 1.0 | 528.6 ± 24.5 | 448.0 ± 0.4 |
| Centroid wavelength (nm) | 653.5 ± 3.8 | 513.0 ± 1.6 | 432.8 ± 15.2 |
| Dominant wavelength (nm) | 644.4 ± 3.2 | 538.2 ± 1.2 | 453.5 ± 0.5 |
© 2019 by the authors. Licensee MDPI, Basel, Switzerland. This article is an open access article distributed under the terms and conditions of the Creative Commons Attribution (CC BY) license (http://creativecommons.org/licenses/by/4.0/).
Share and Cite
Han, S.; Roh, D.; Park, J.; Shin, H. Design of Multi-Wavelength Optical Sensor Module for Depth-Dependent Photoplethysmography. Sensors 2019, 19, 5441. https://doi.org/10.3390/s19245441
Han S, Roh D, Park J, Shin H. Design of Multi-Wavelength Optical Sensor Module for Depth-Dependent Photoplethysmography. Sensors. 2019; 19(24):5441. https://doi.org/10.3390/s19245441
Chicago/Turabian StyleHan, Sangjin, Donggeun Roh, Junyung Park, and Hangsik Shin. 2019. "Design of Multi-Wavelength Optical Sensor Module for Depth-Dependent Photoplethysmography" Sensors 19, no. 24: 5441. https://doi.org/10.3390/s19245441