Hydrazine-Selective Fluorescent Turn-On Probe Based on Ortho-Methoxy-Methyl-Ether (o-MOM) Assisted Retro-aza-Henry Type Reaction


Abstract
:1. Introduction
2. Materials and Methods
2.1. Materials
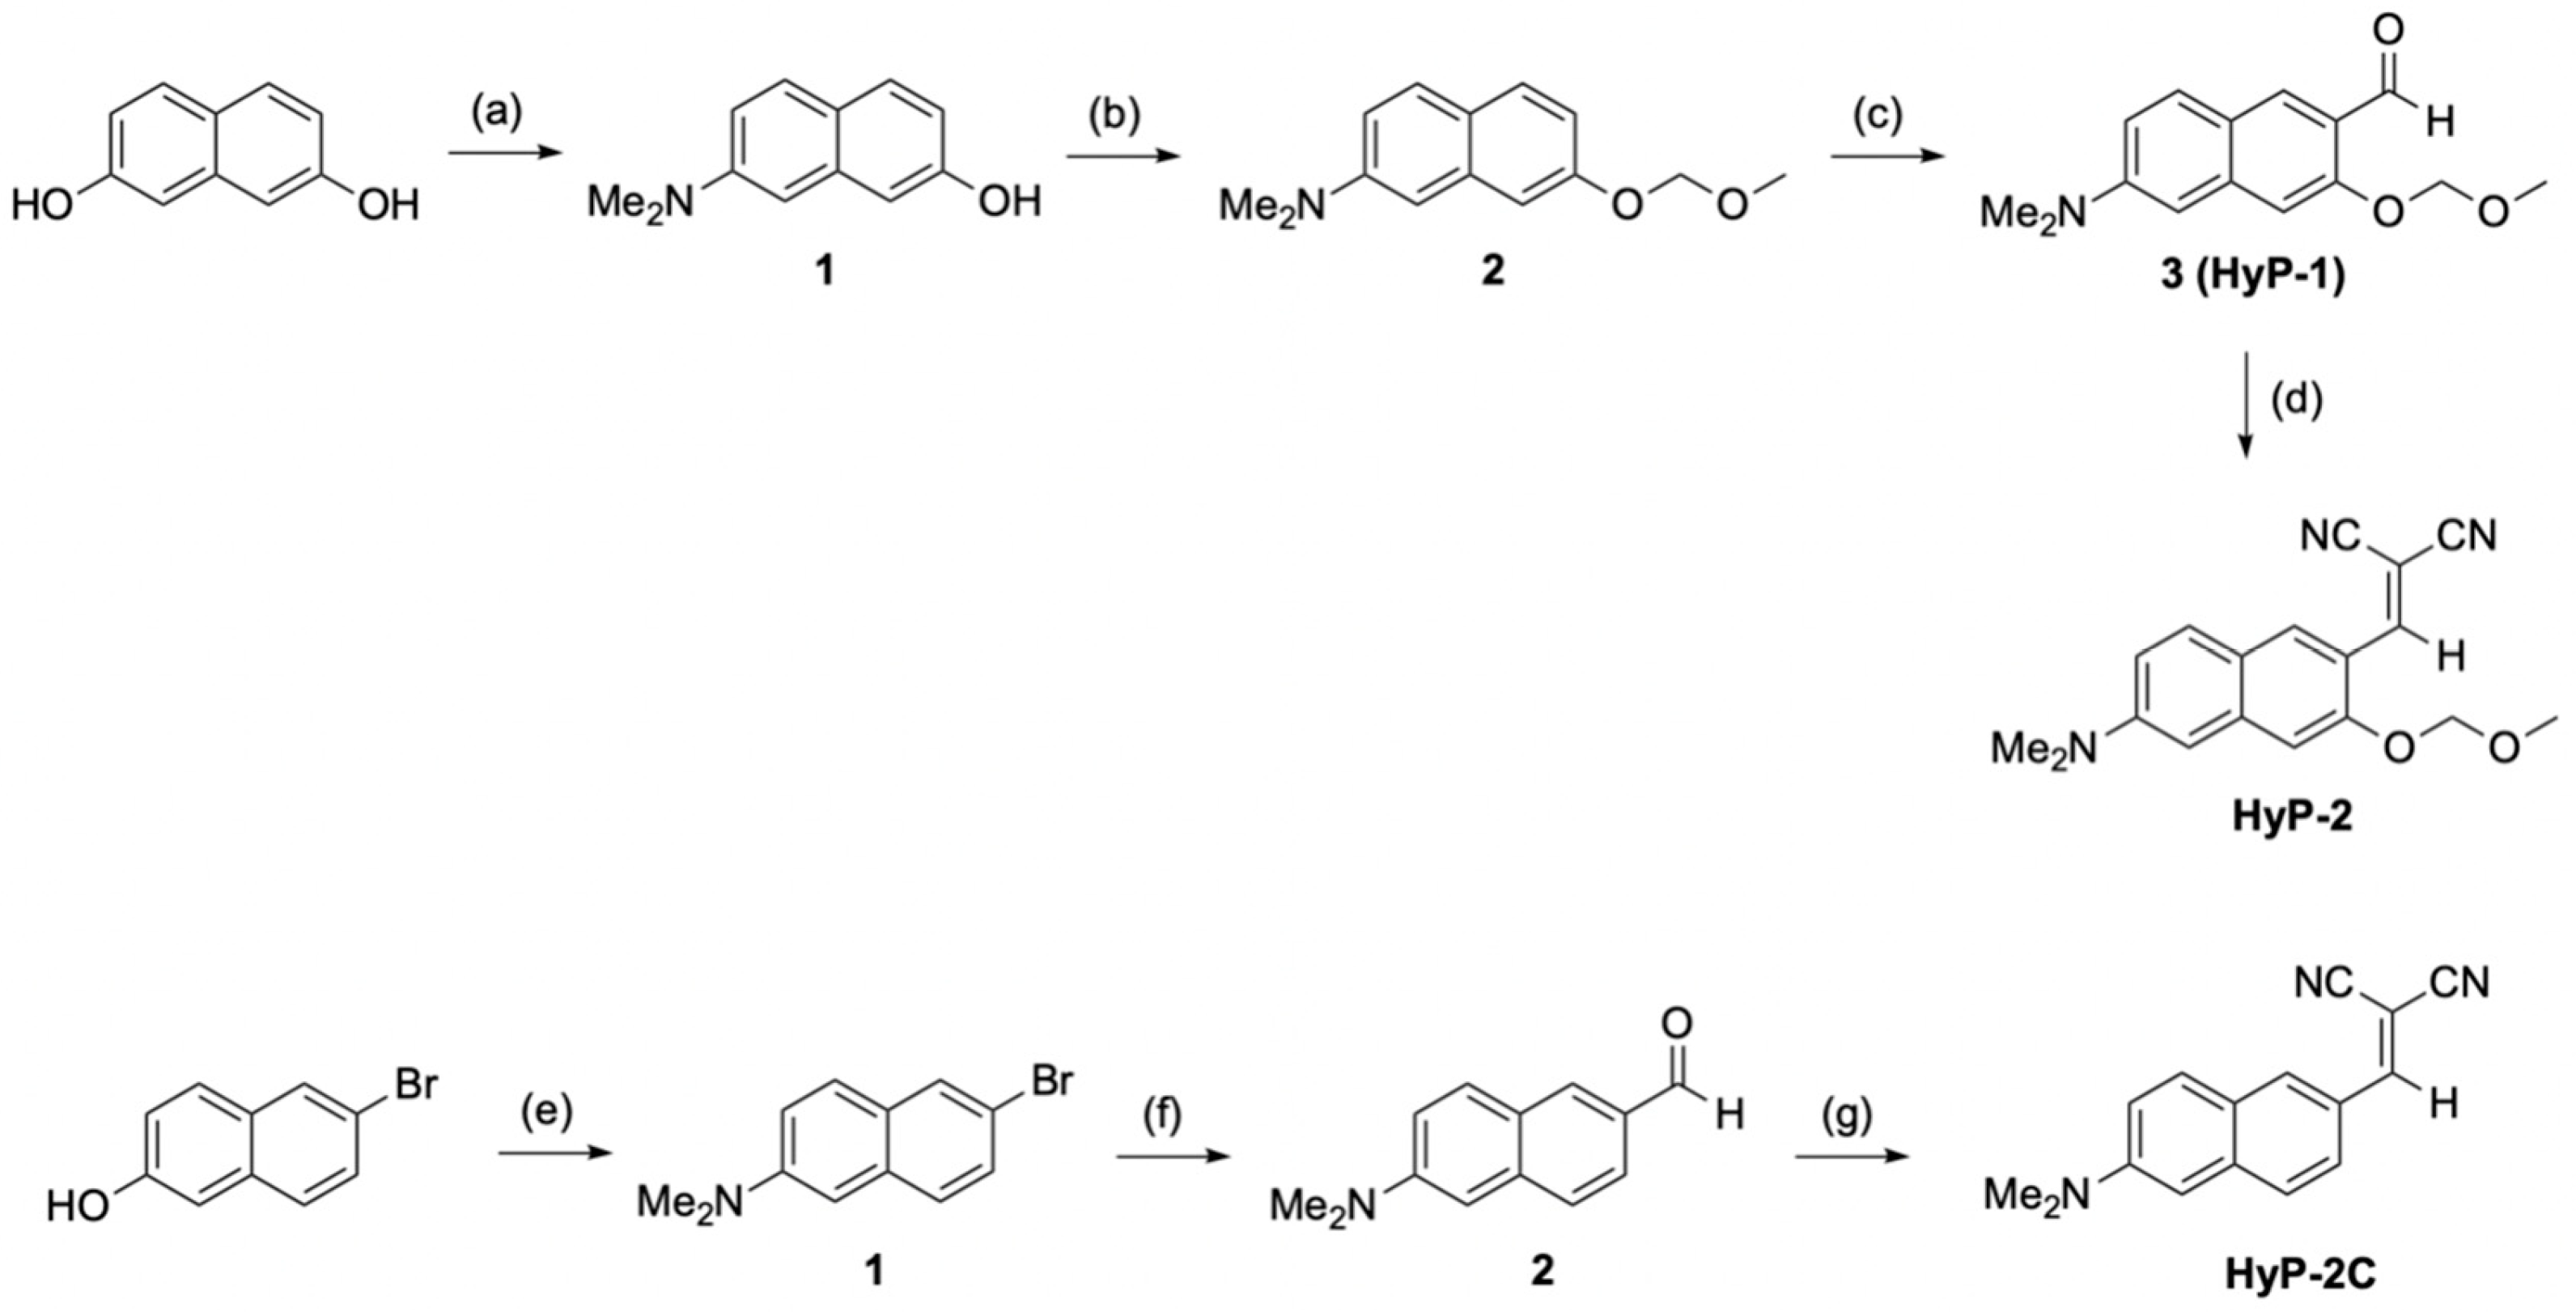
2.2. Synthesis
2.3. UV/Vis Absorption and Emission Measurement
2.4. NMR and Mass Analysis
2.5. Paper Strip Test
2.6. Vapor Test
2.7. Soil Analysis
3. Results and Discussion
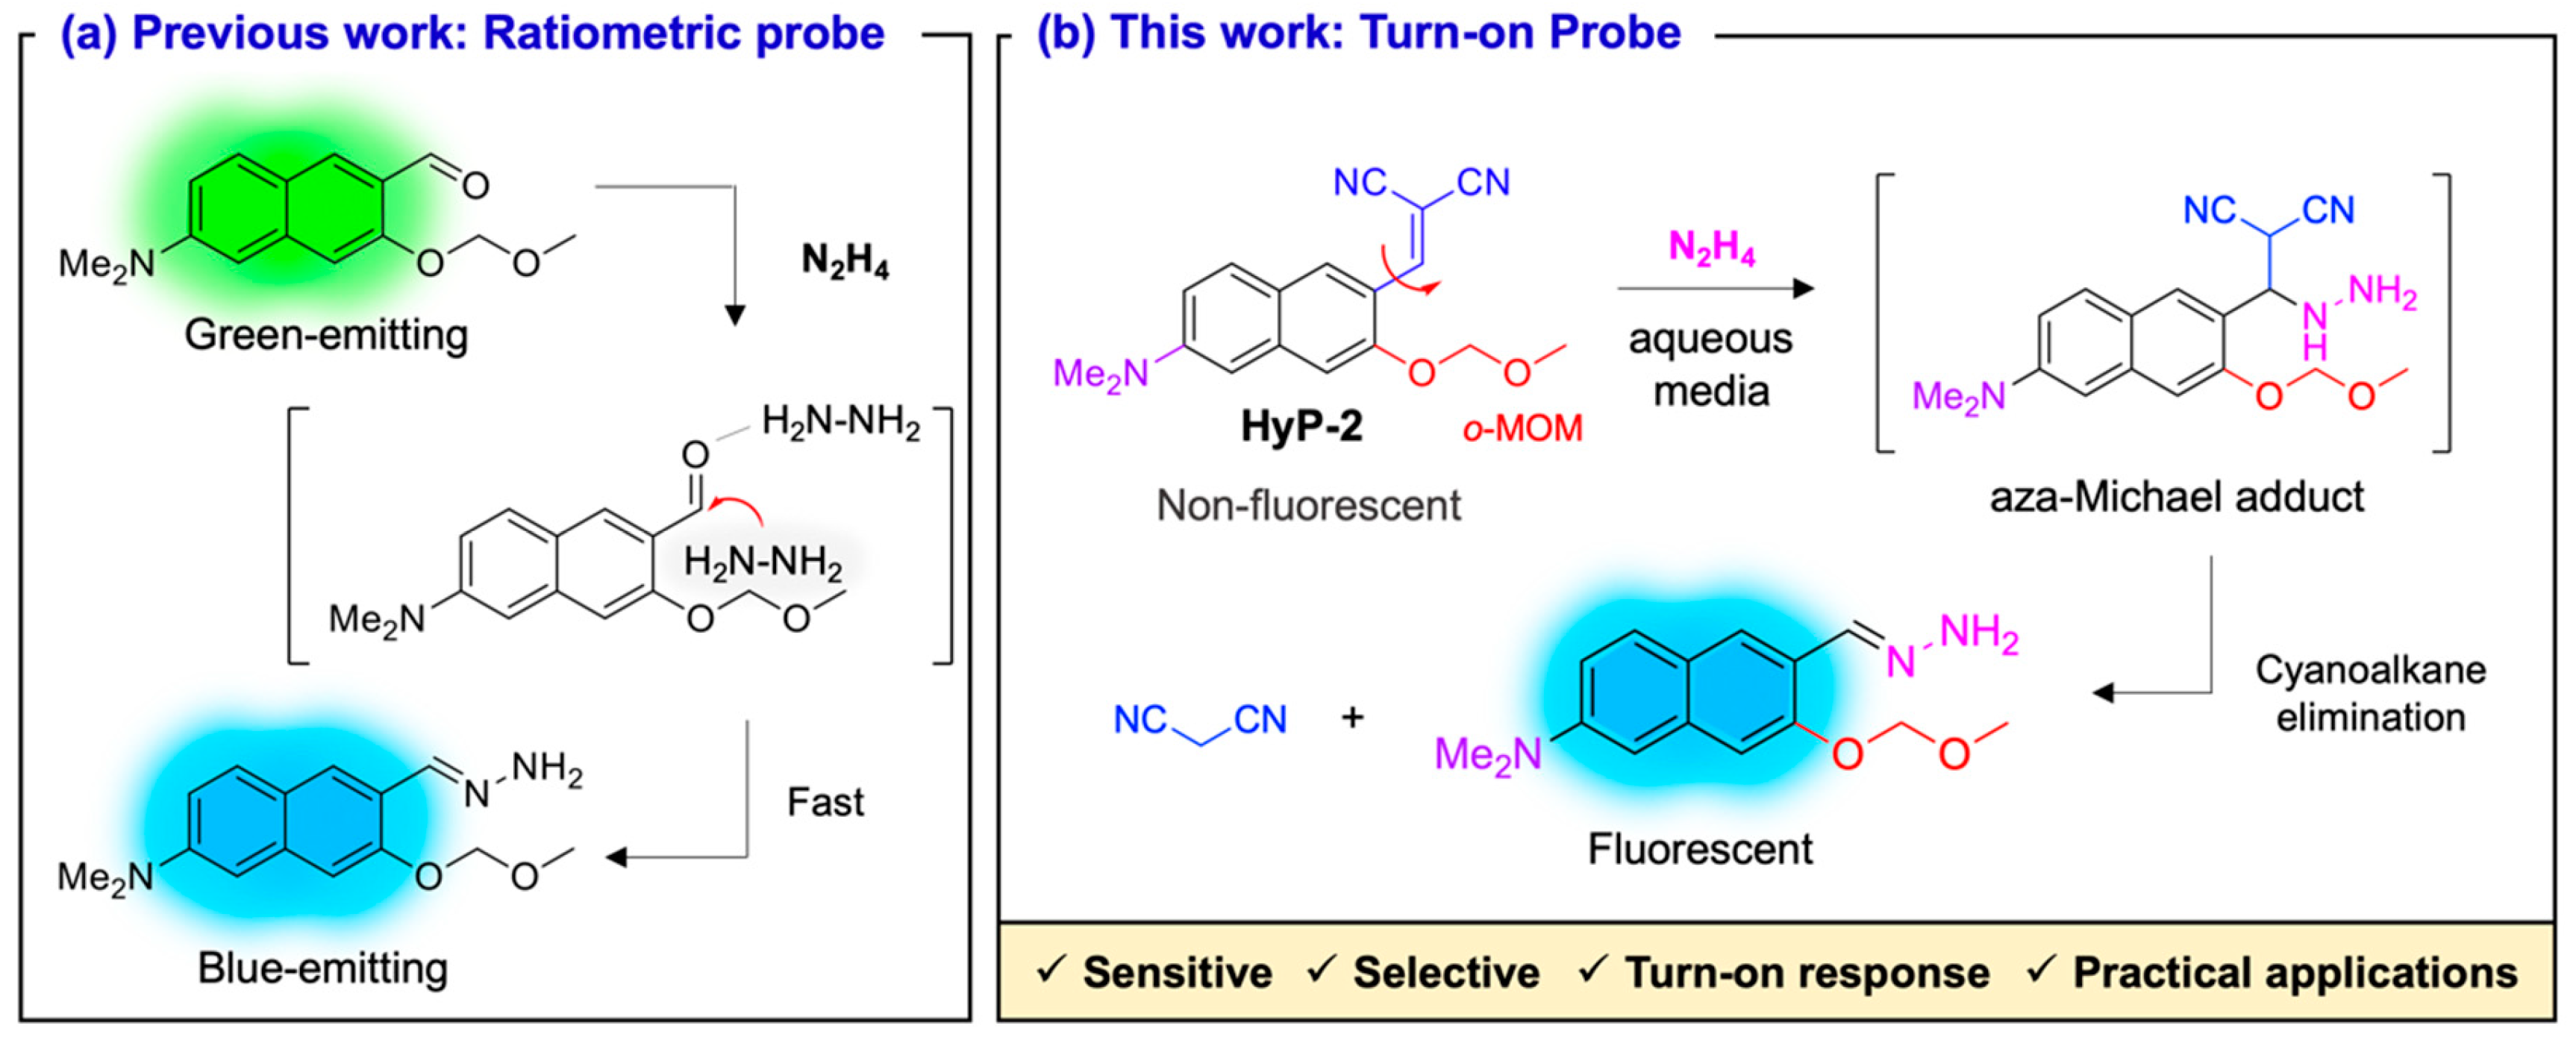
3.1. Probe Design
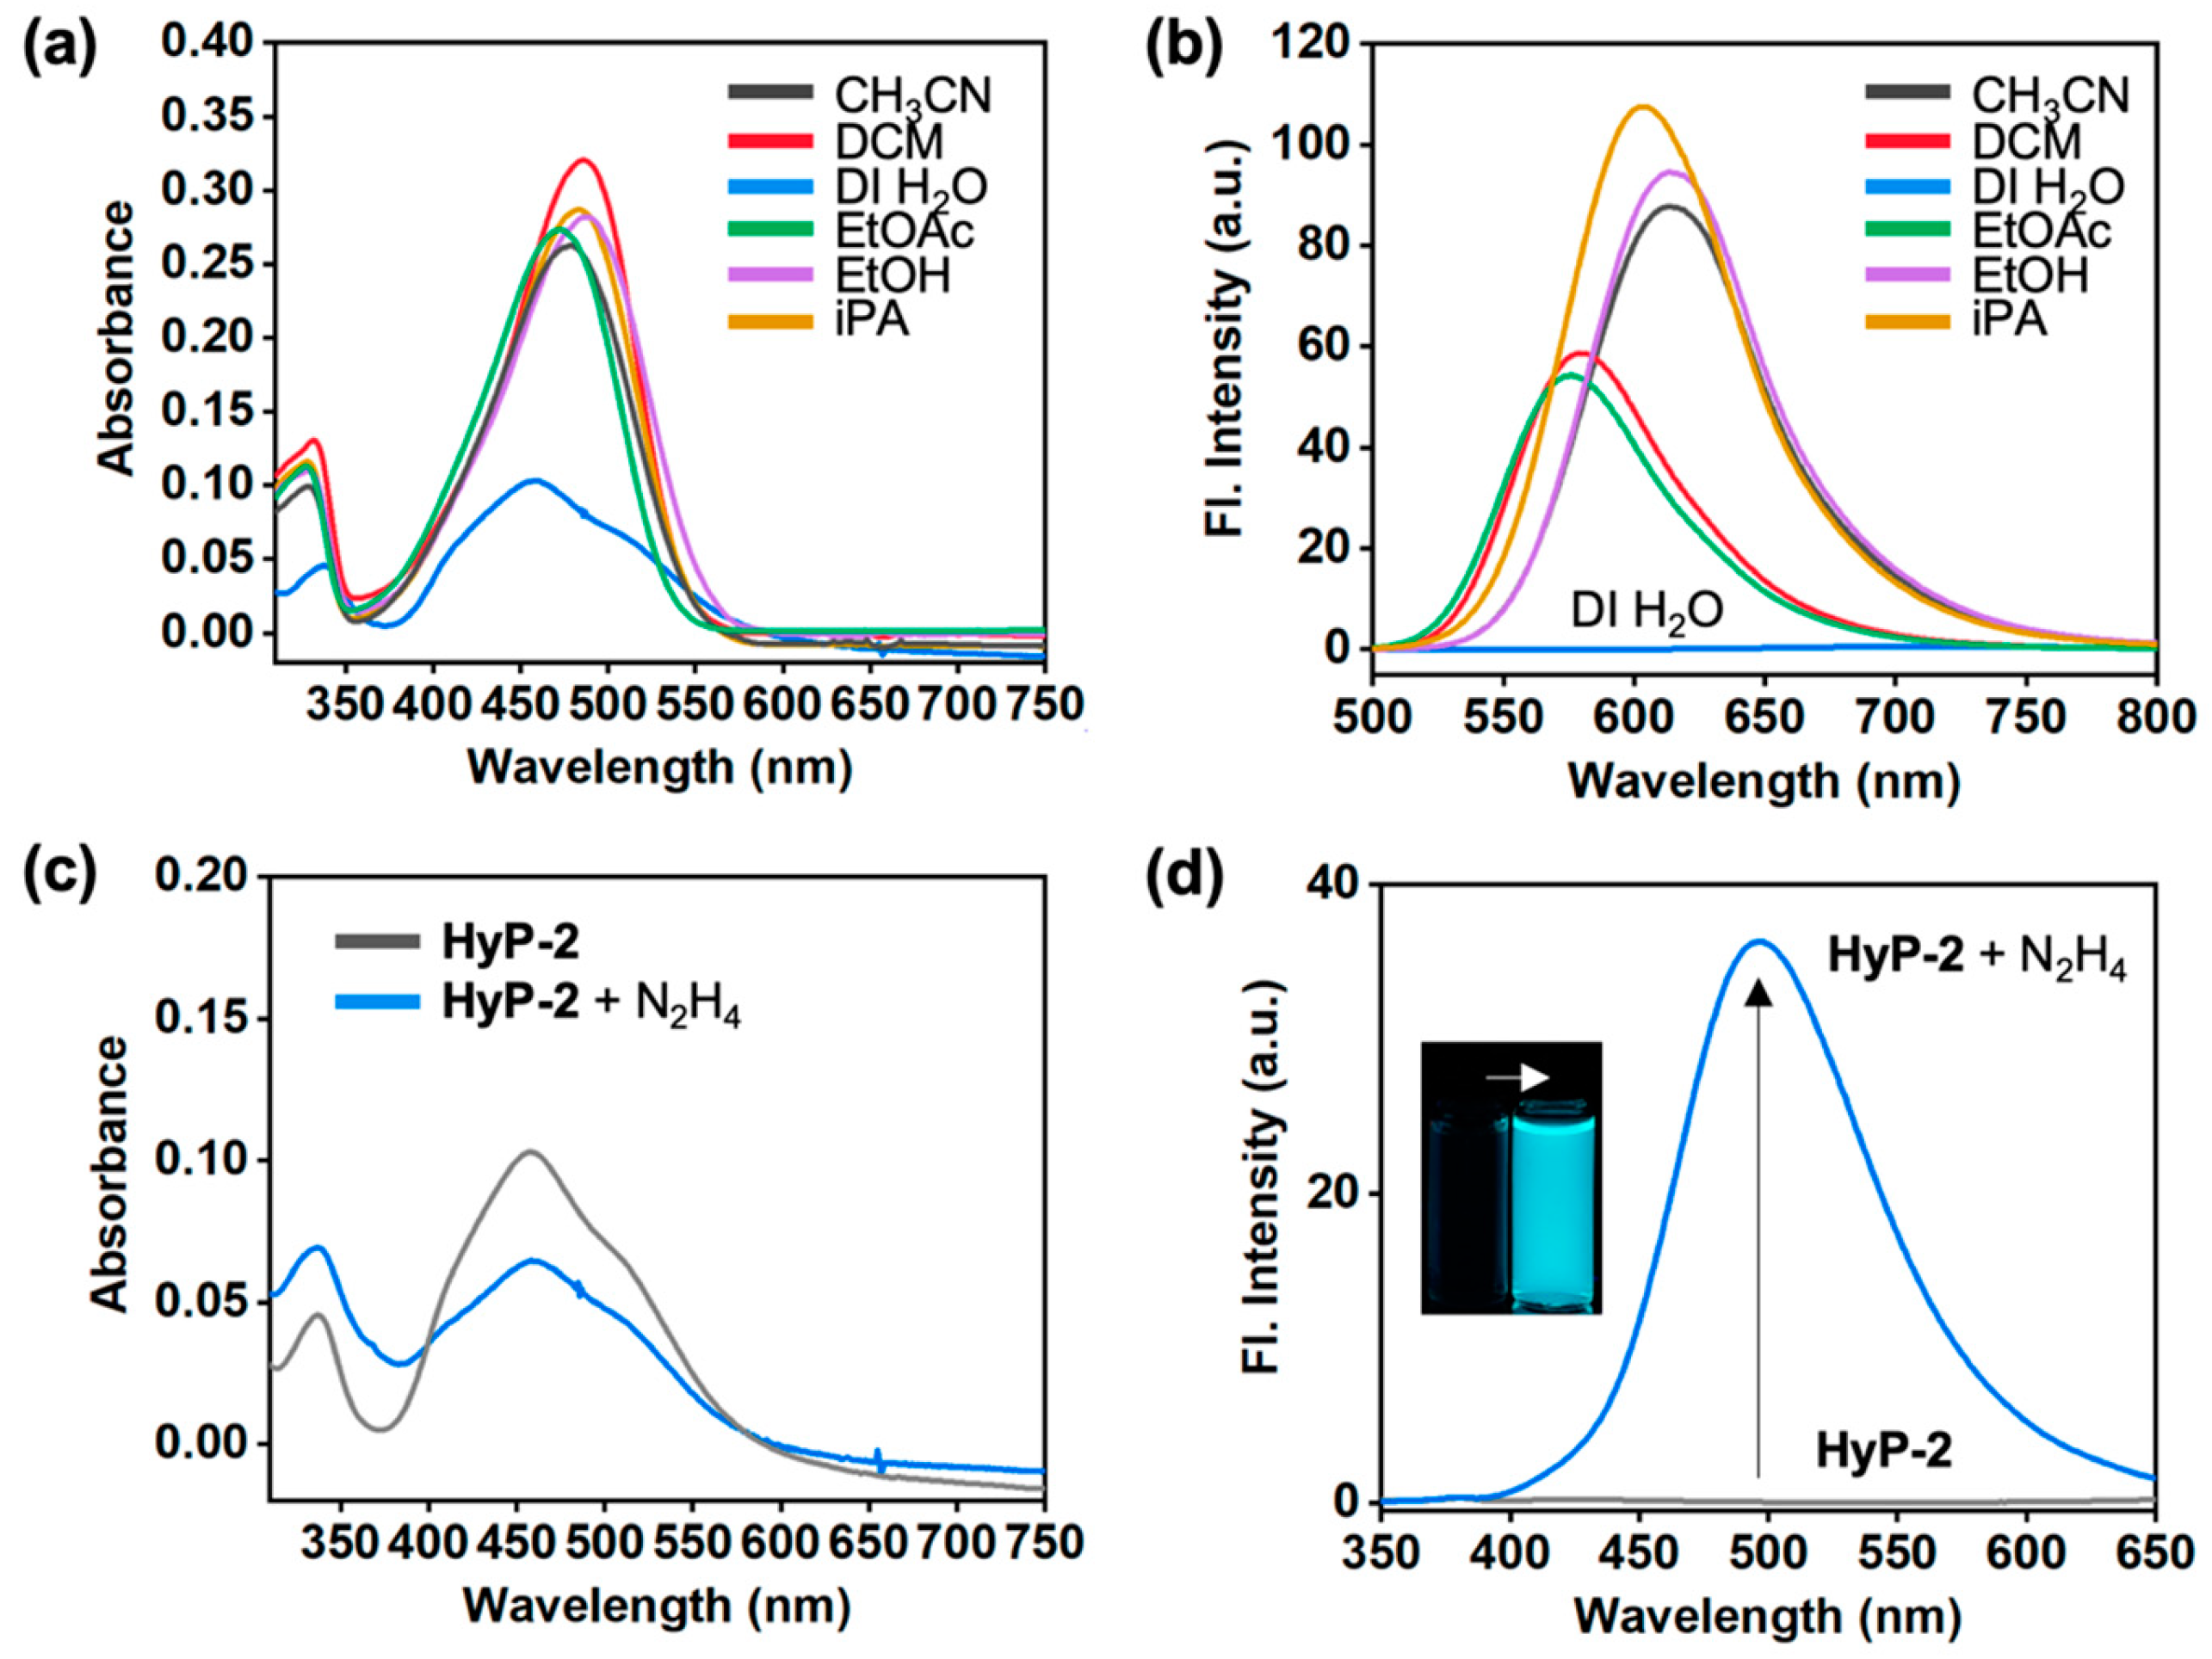
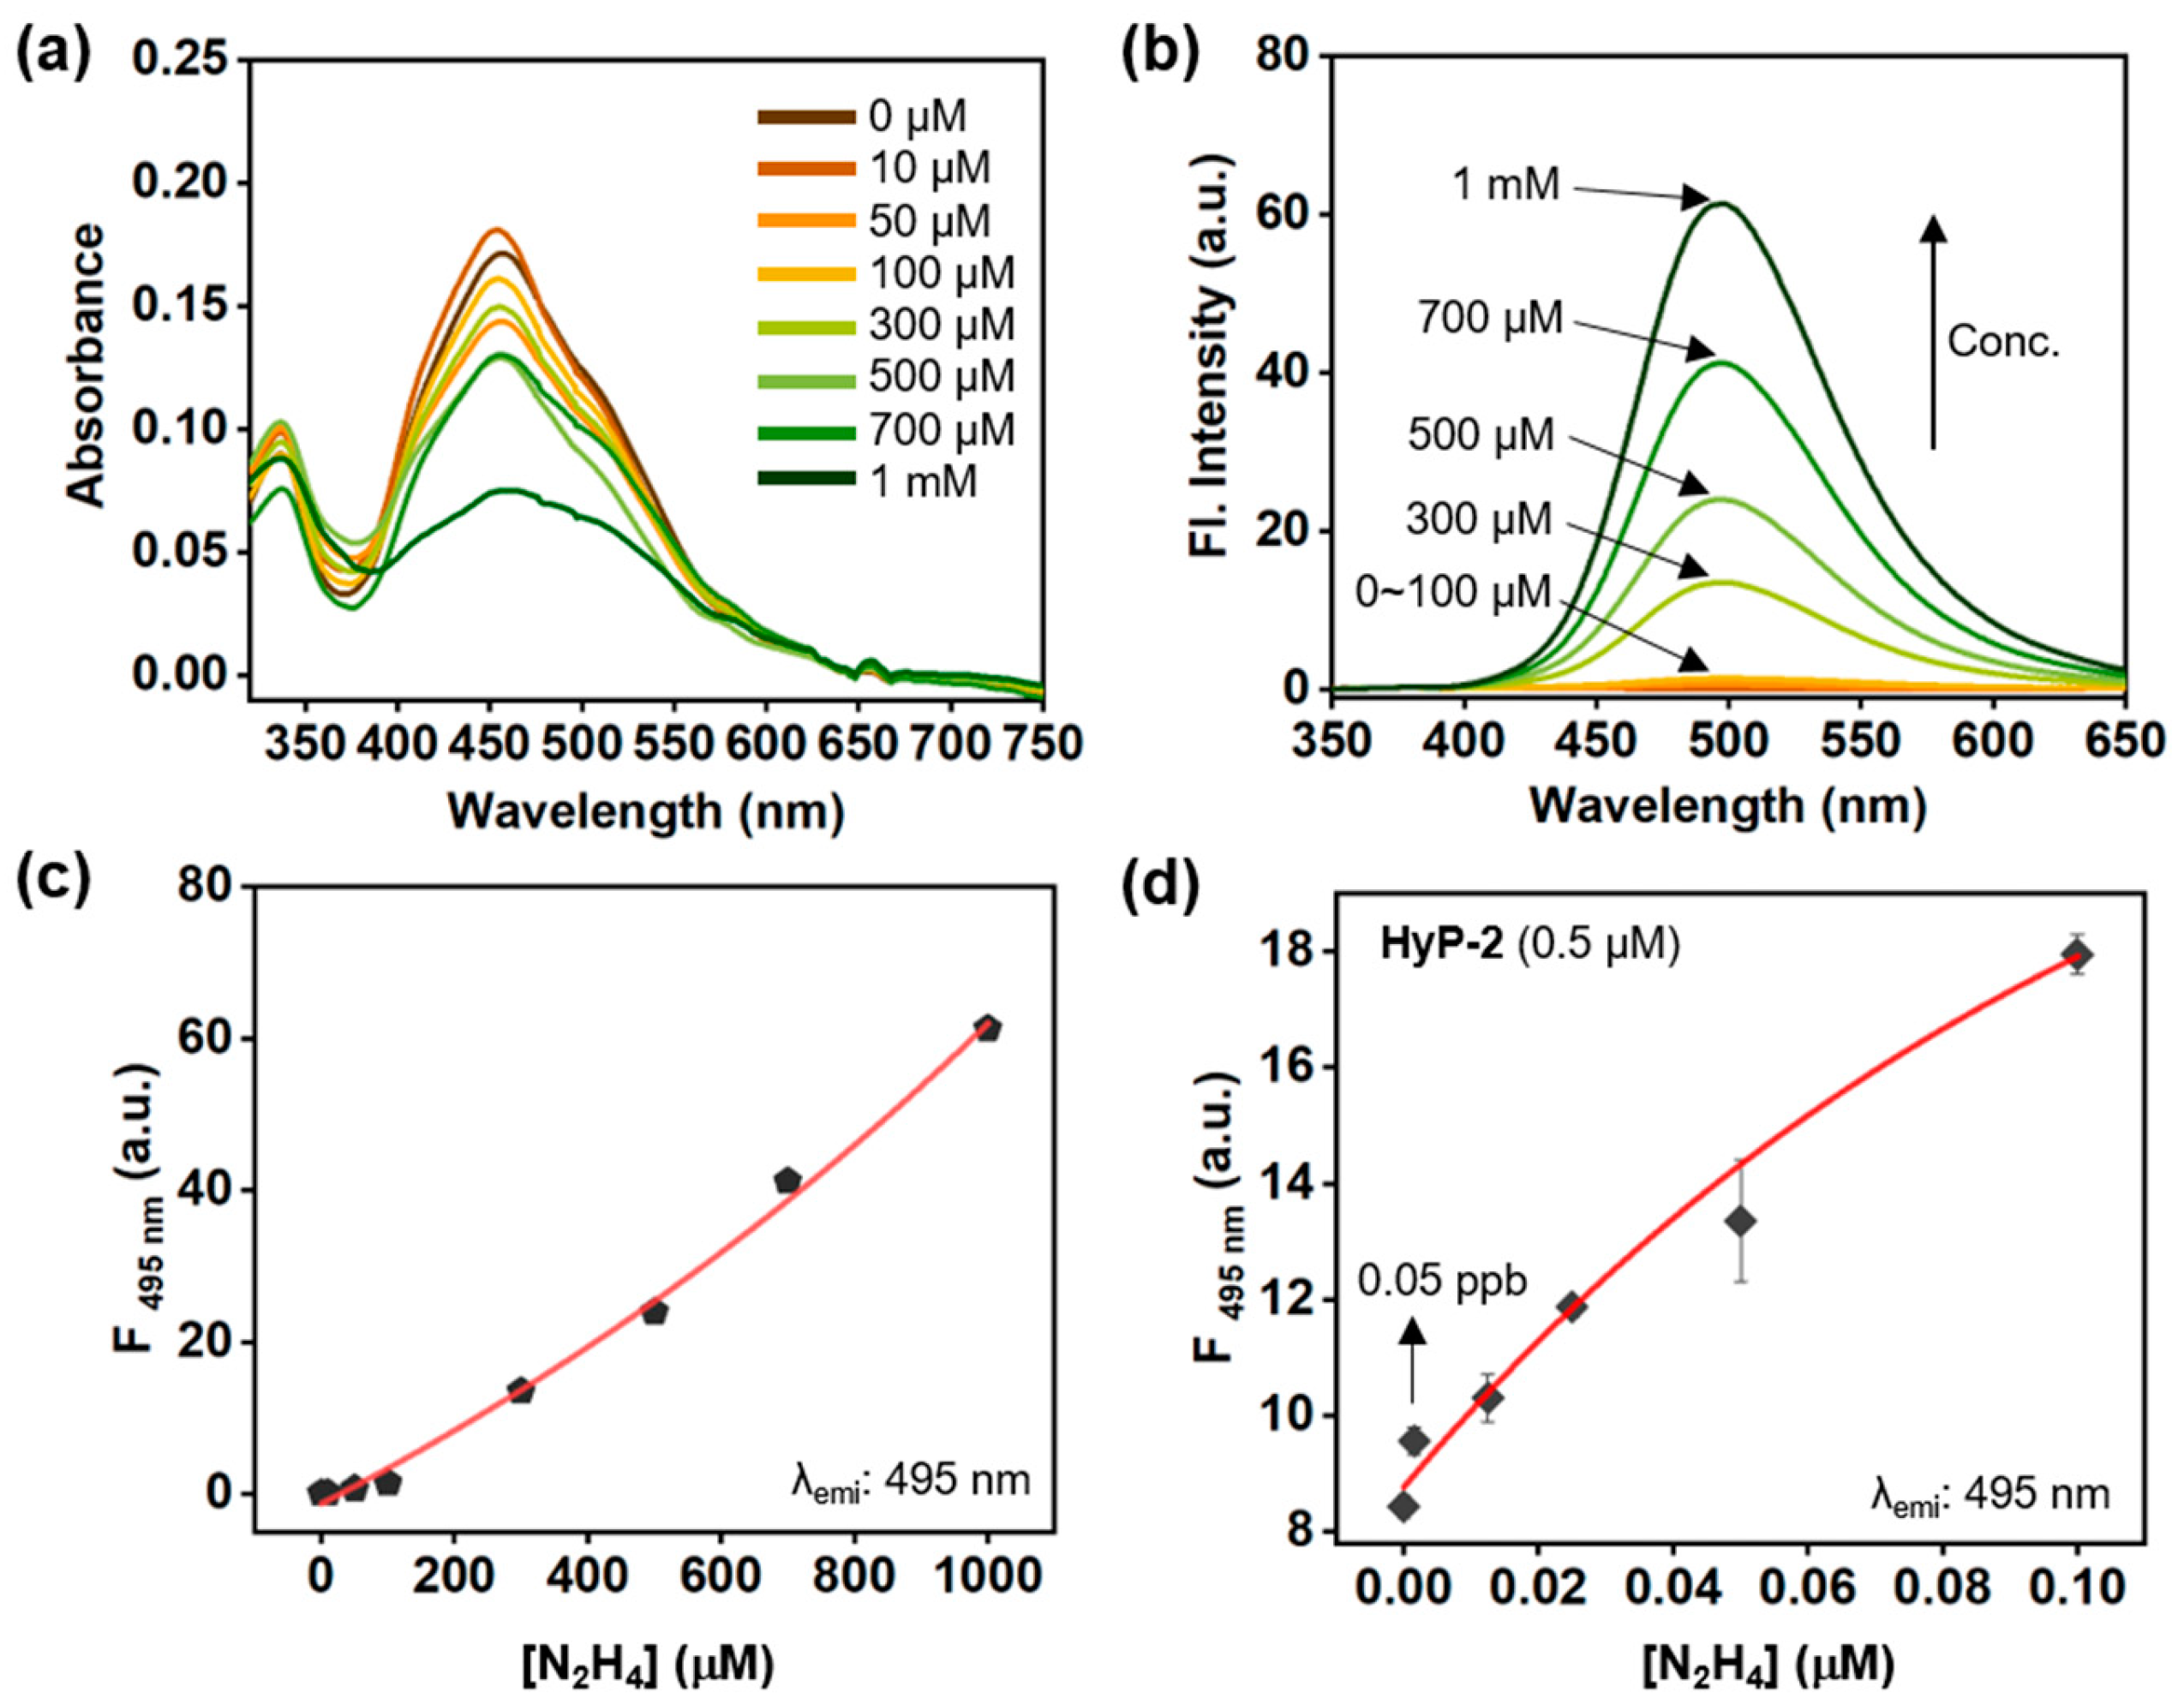
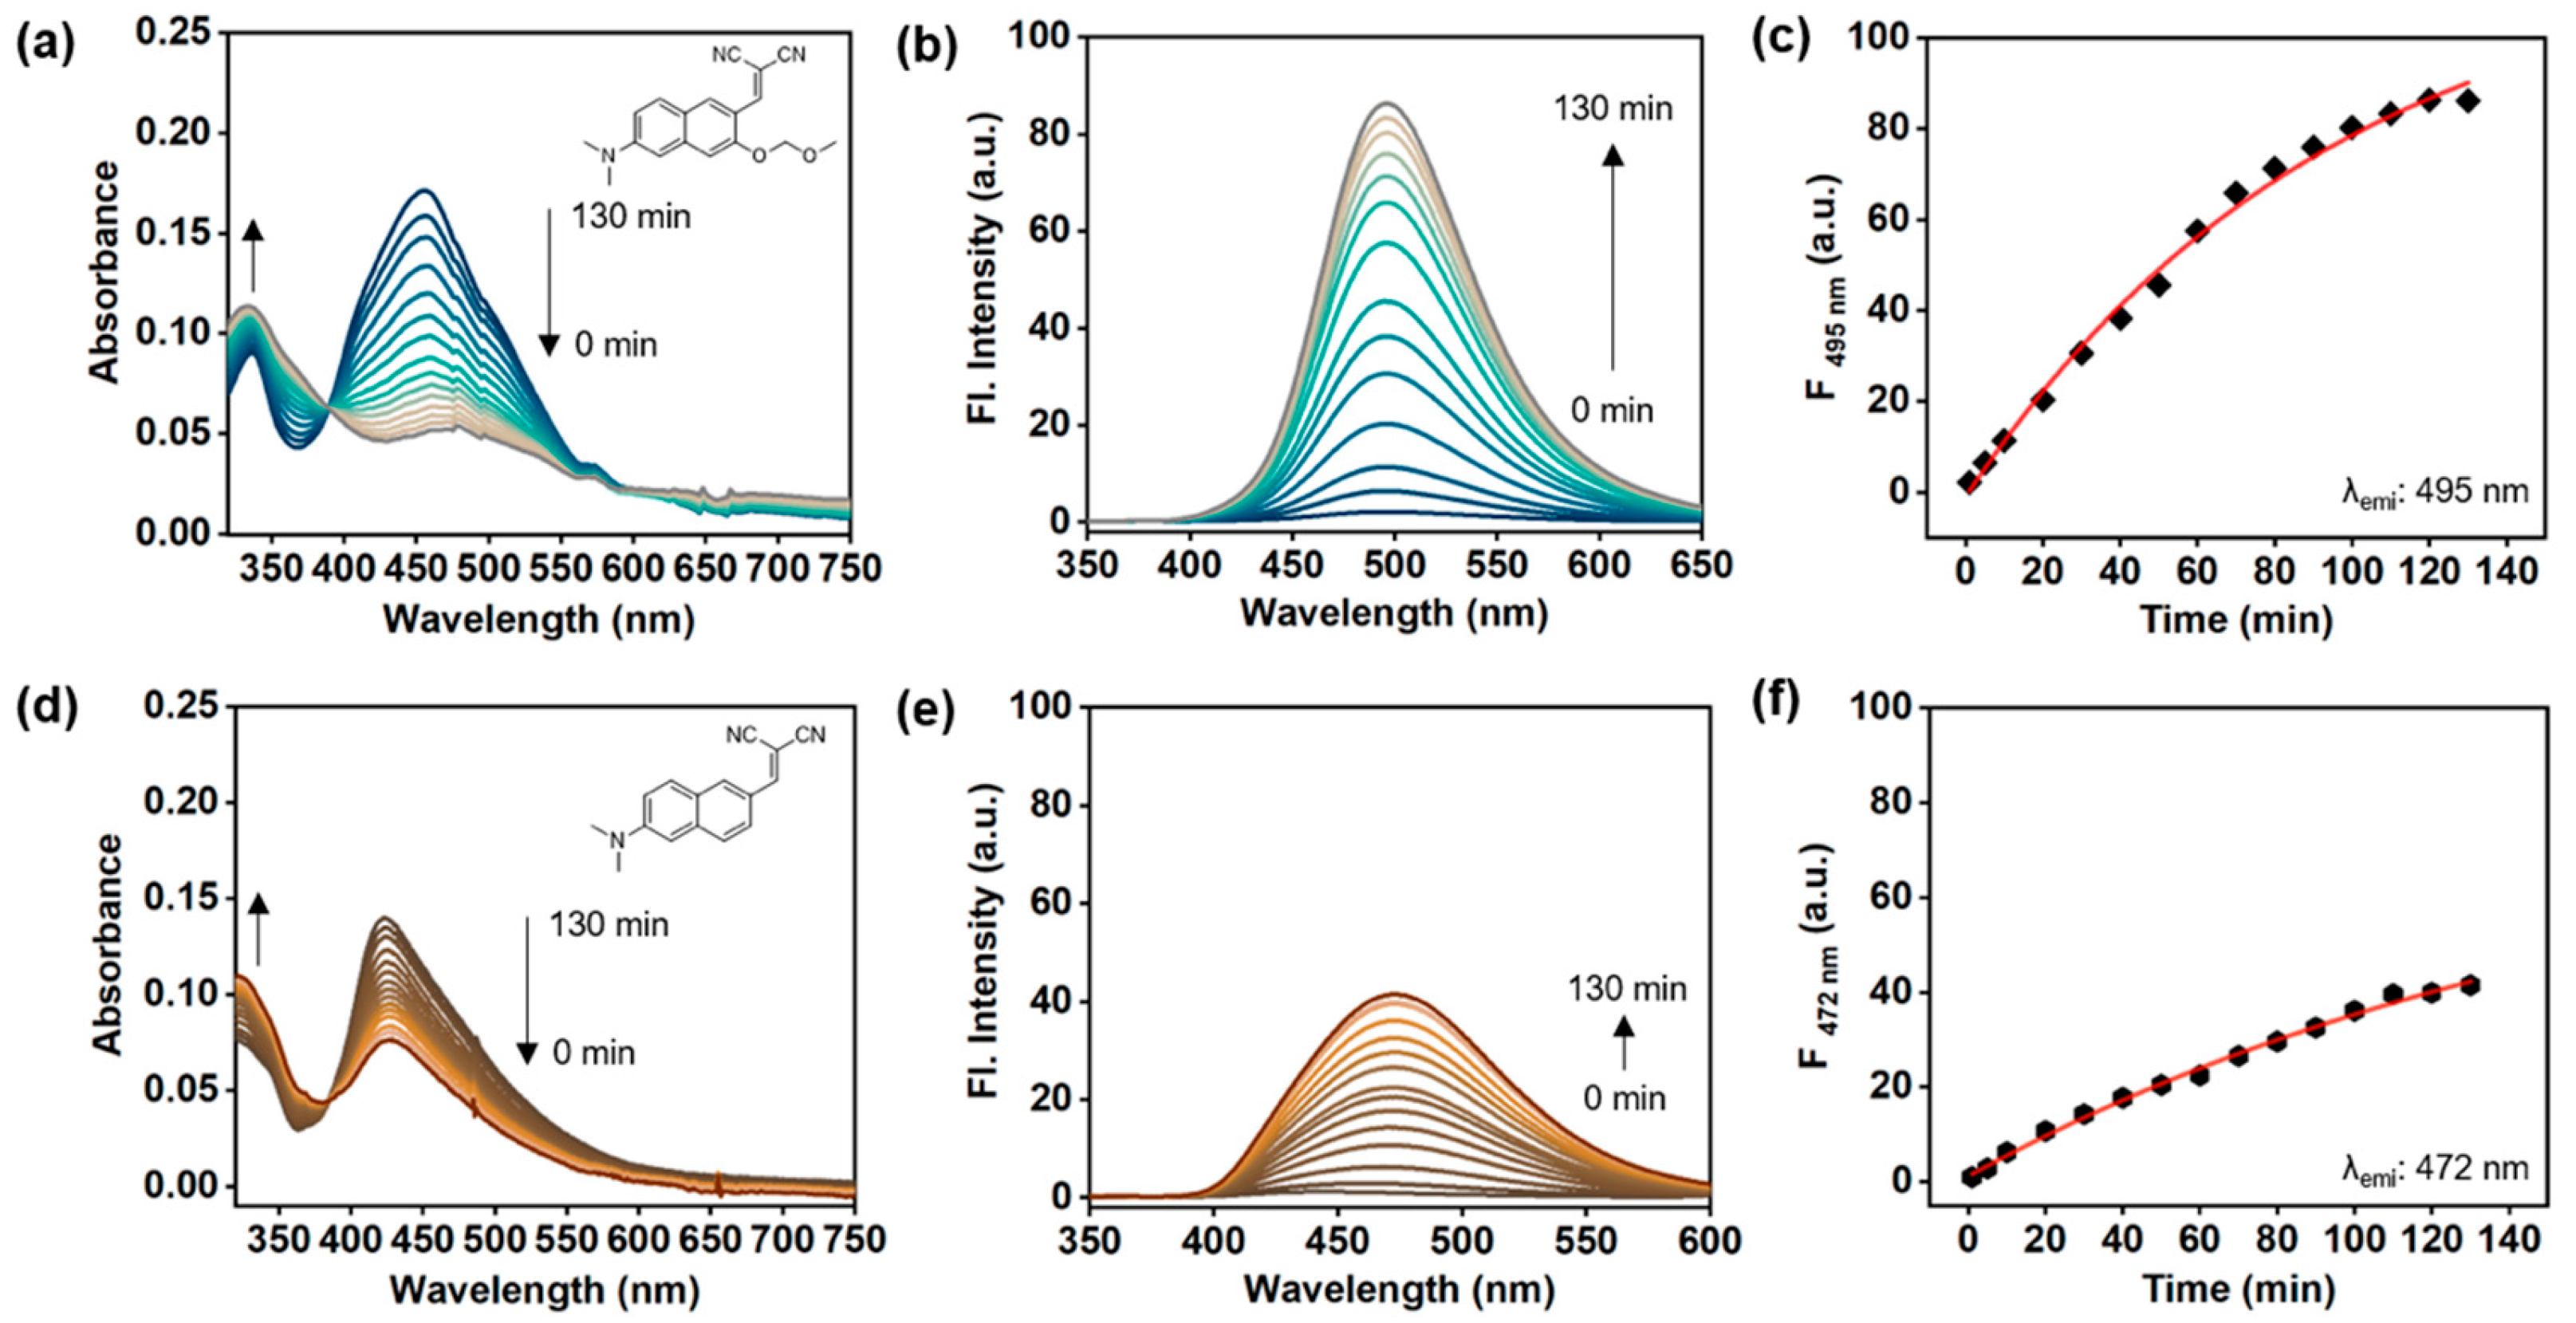
3.2. Photophysical Property Analysis and Hydrazine Sensing Study of HyP-2
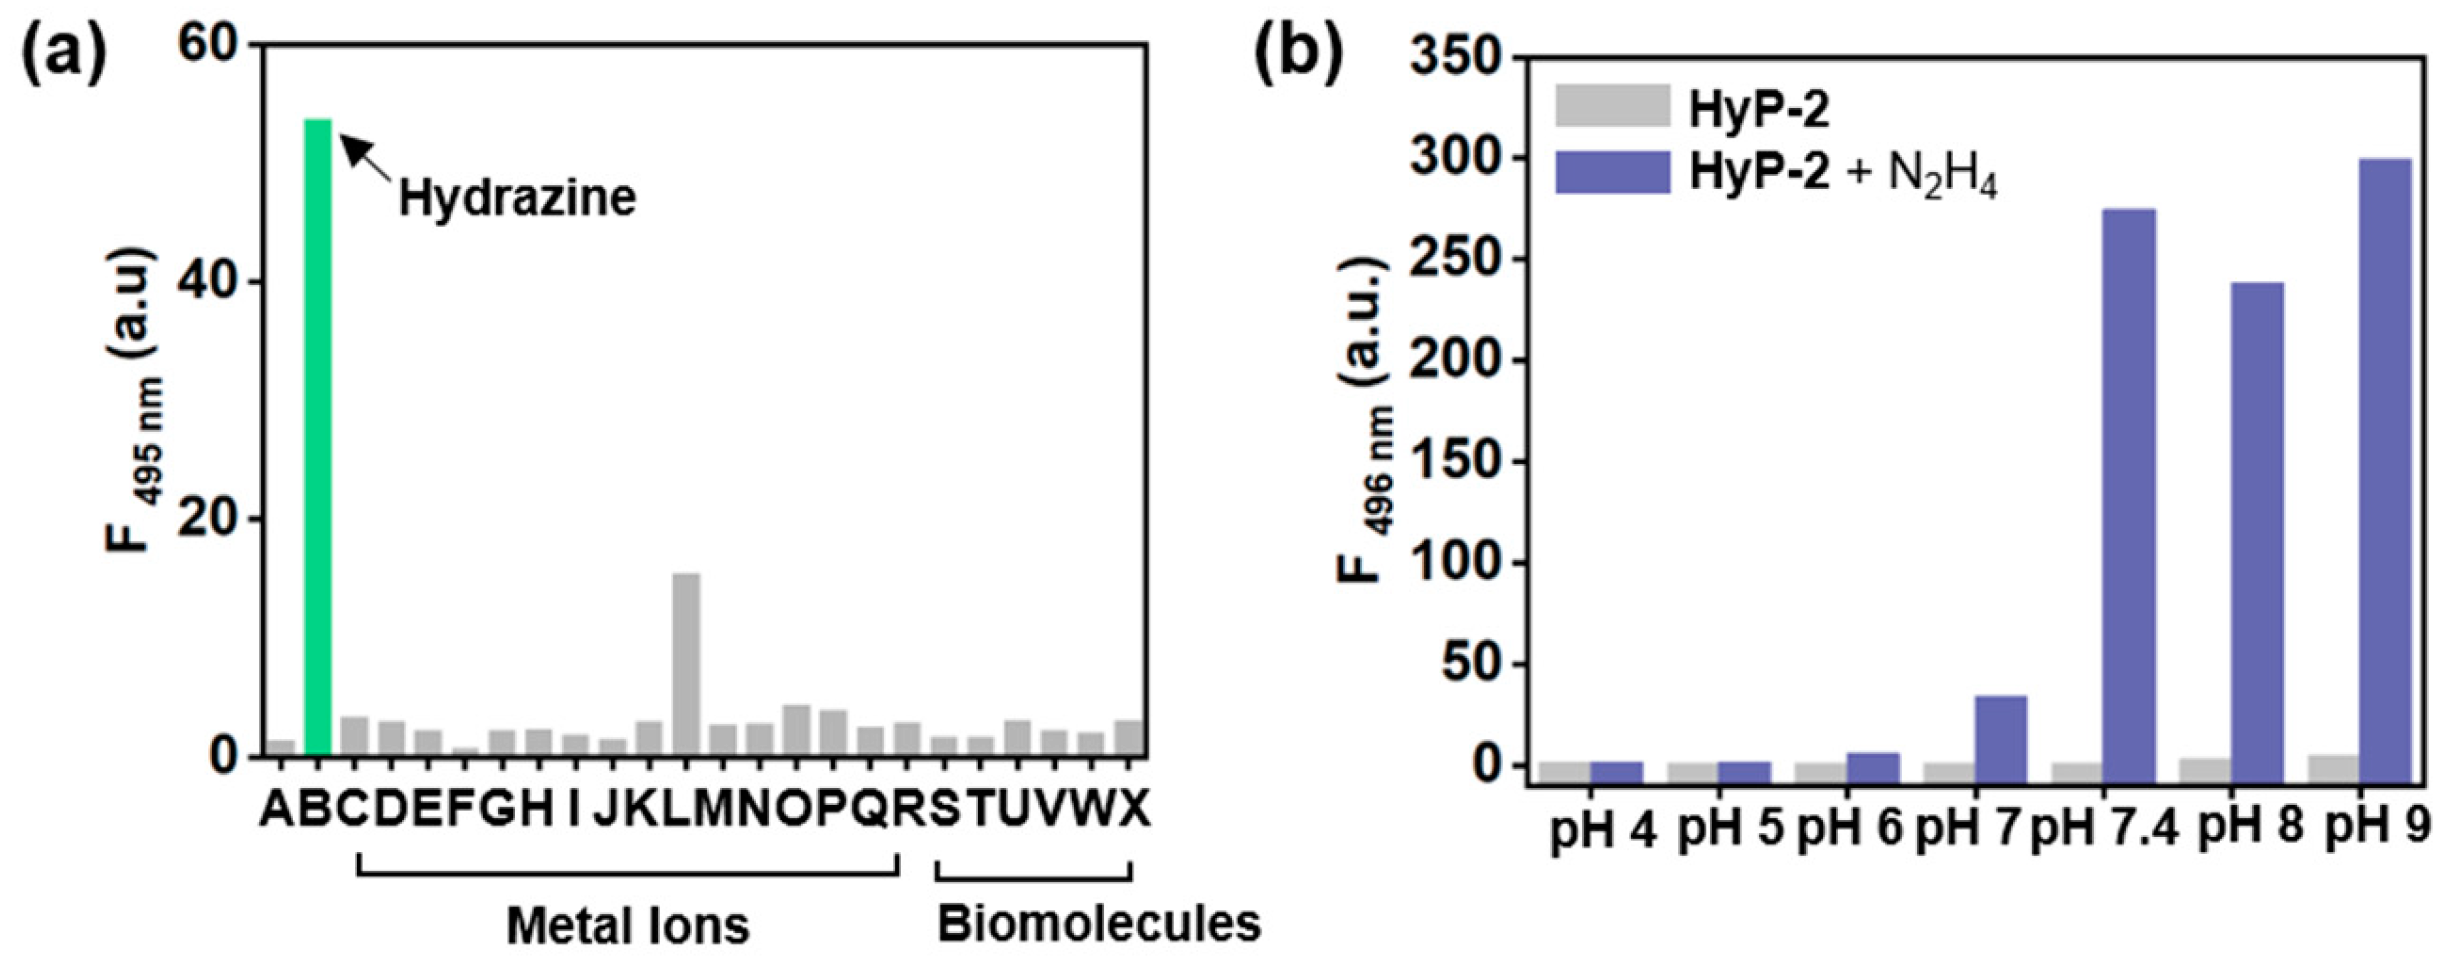
3.3. Selectivity and pH Screening
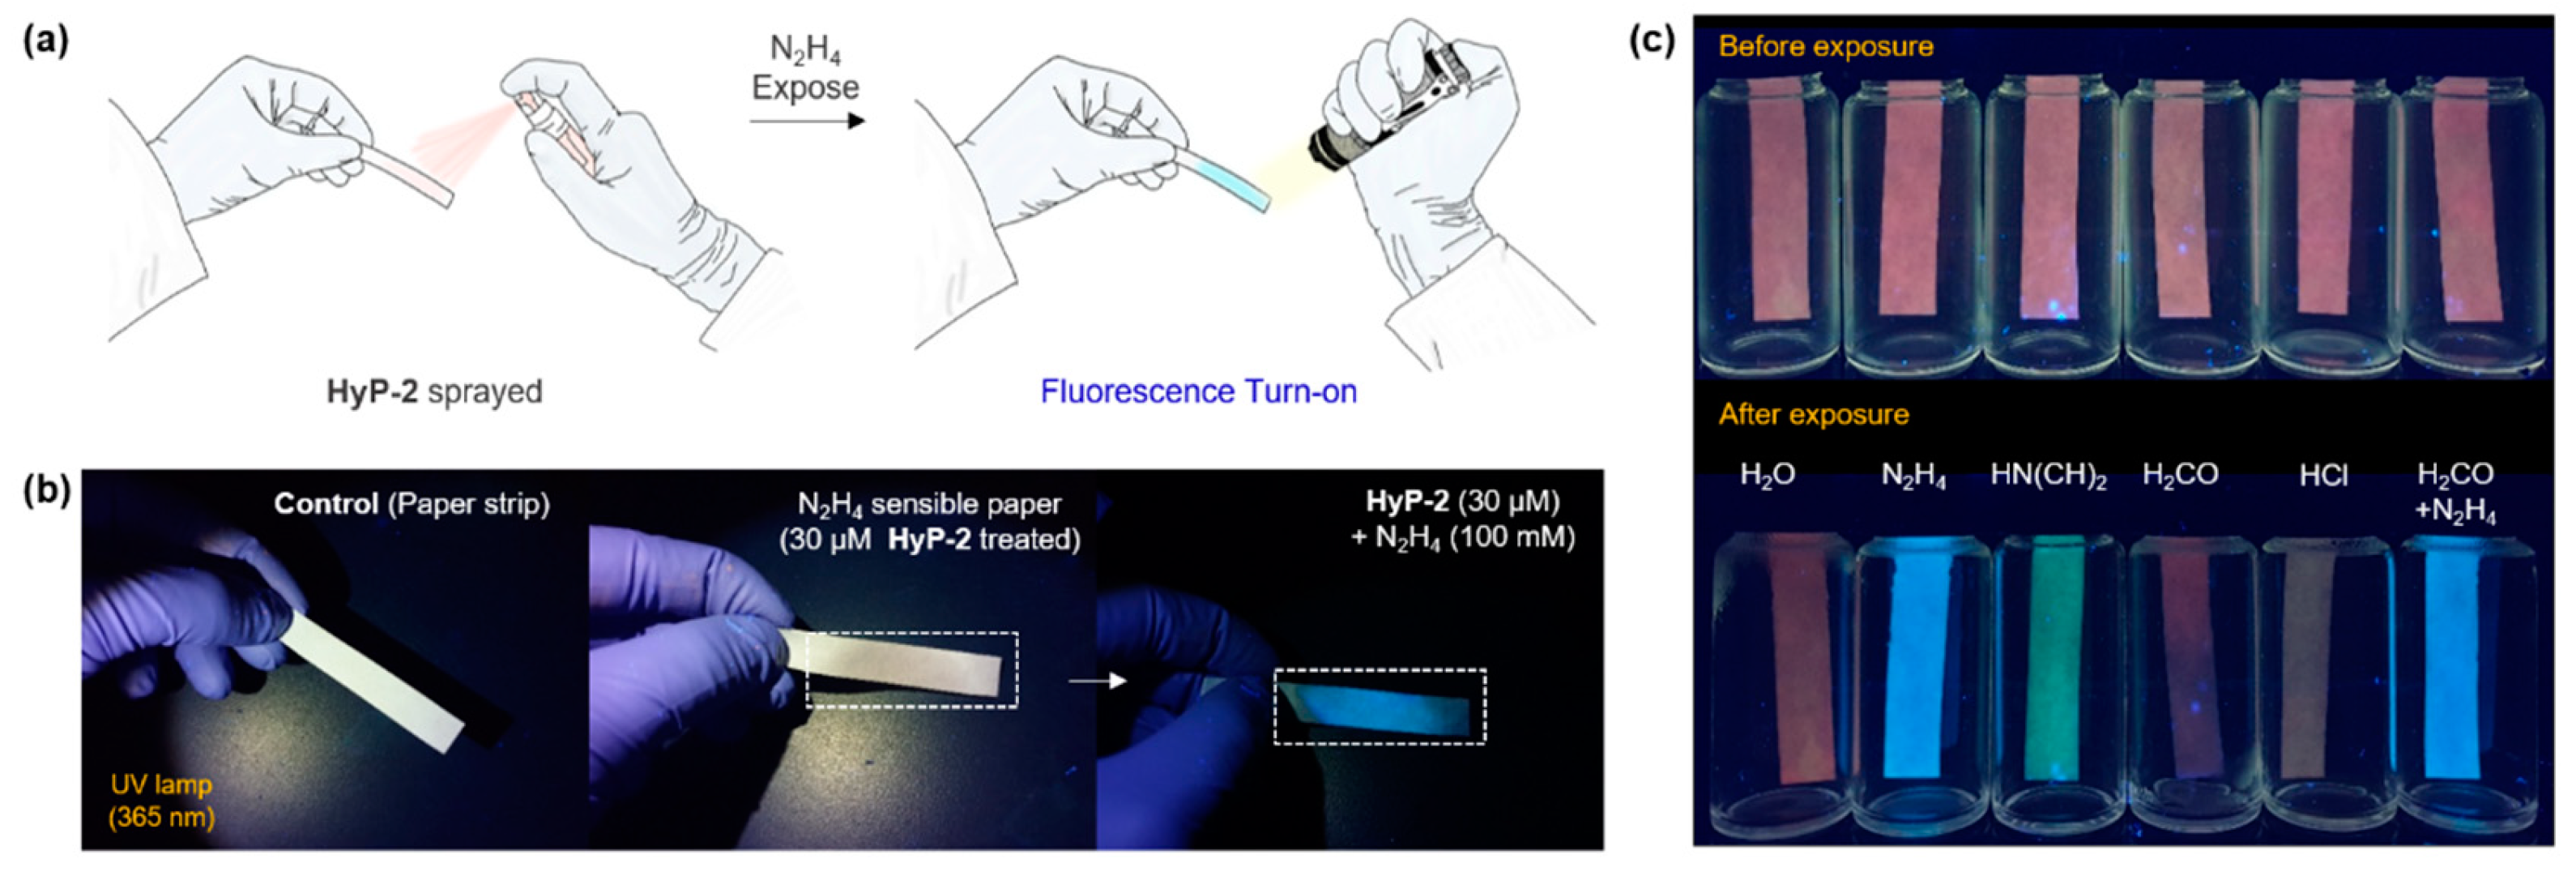
3.4. Paper Strip Spray Assay
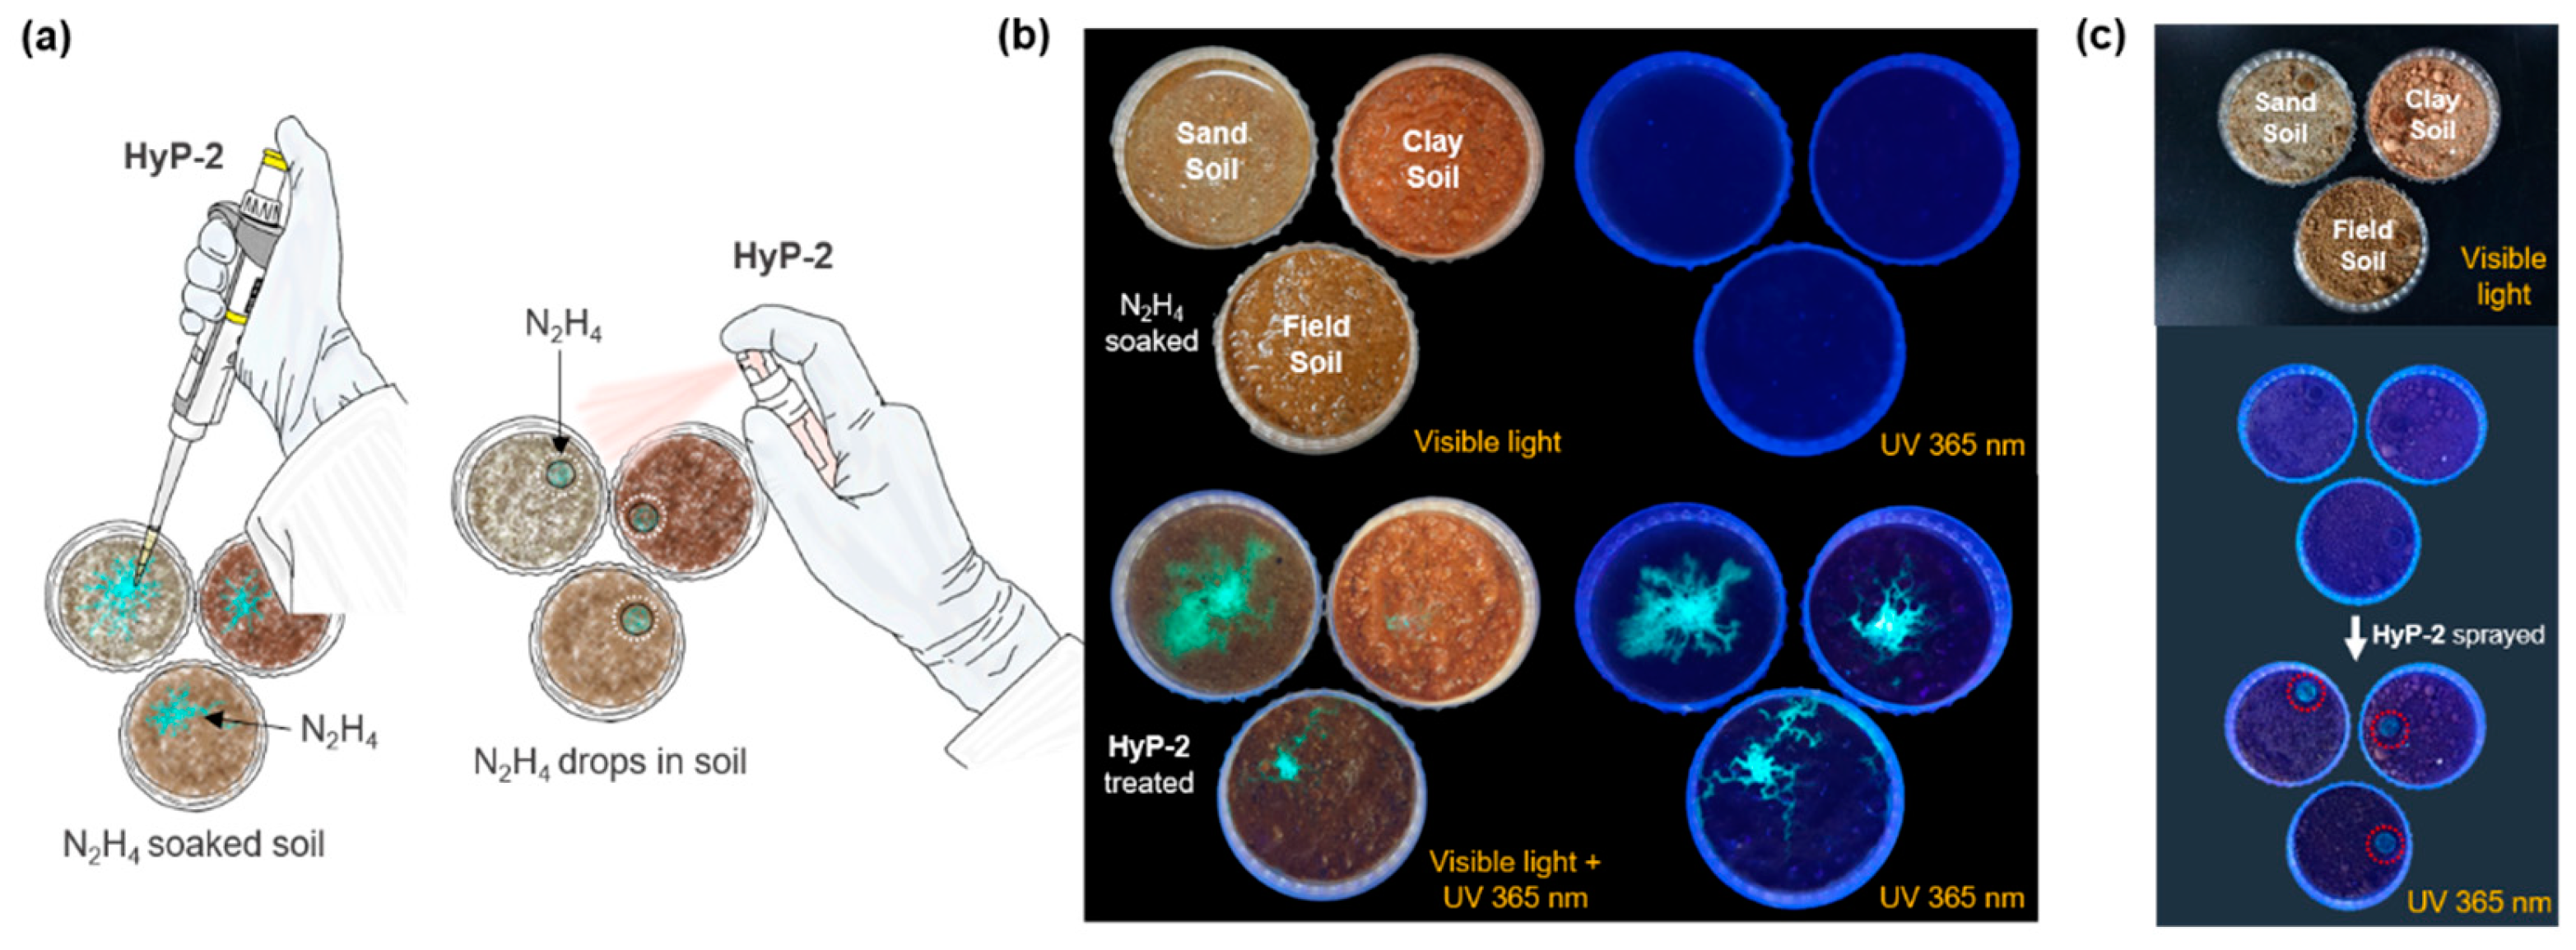
3.5. Hydrazine Sensing Application in Soils
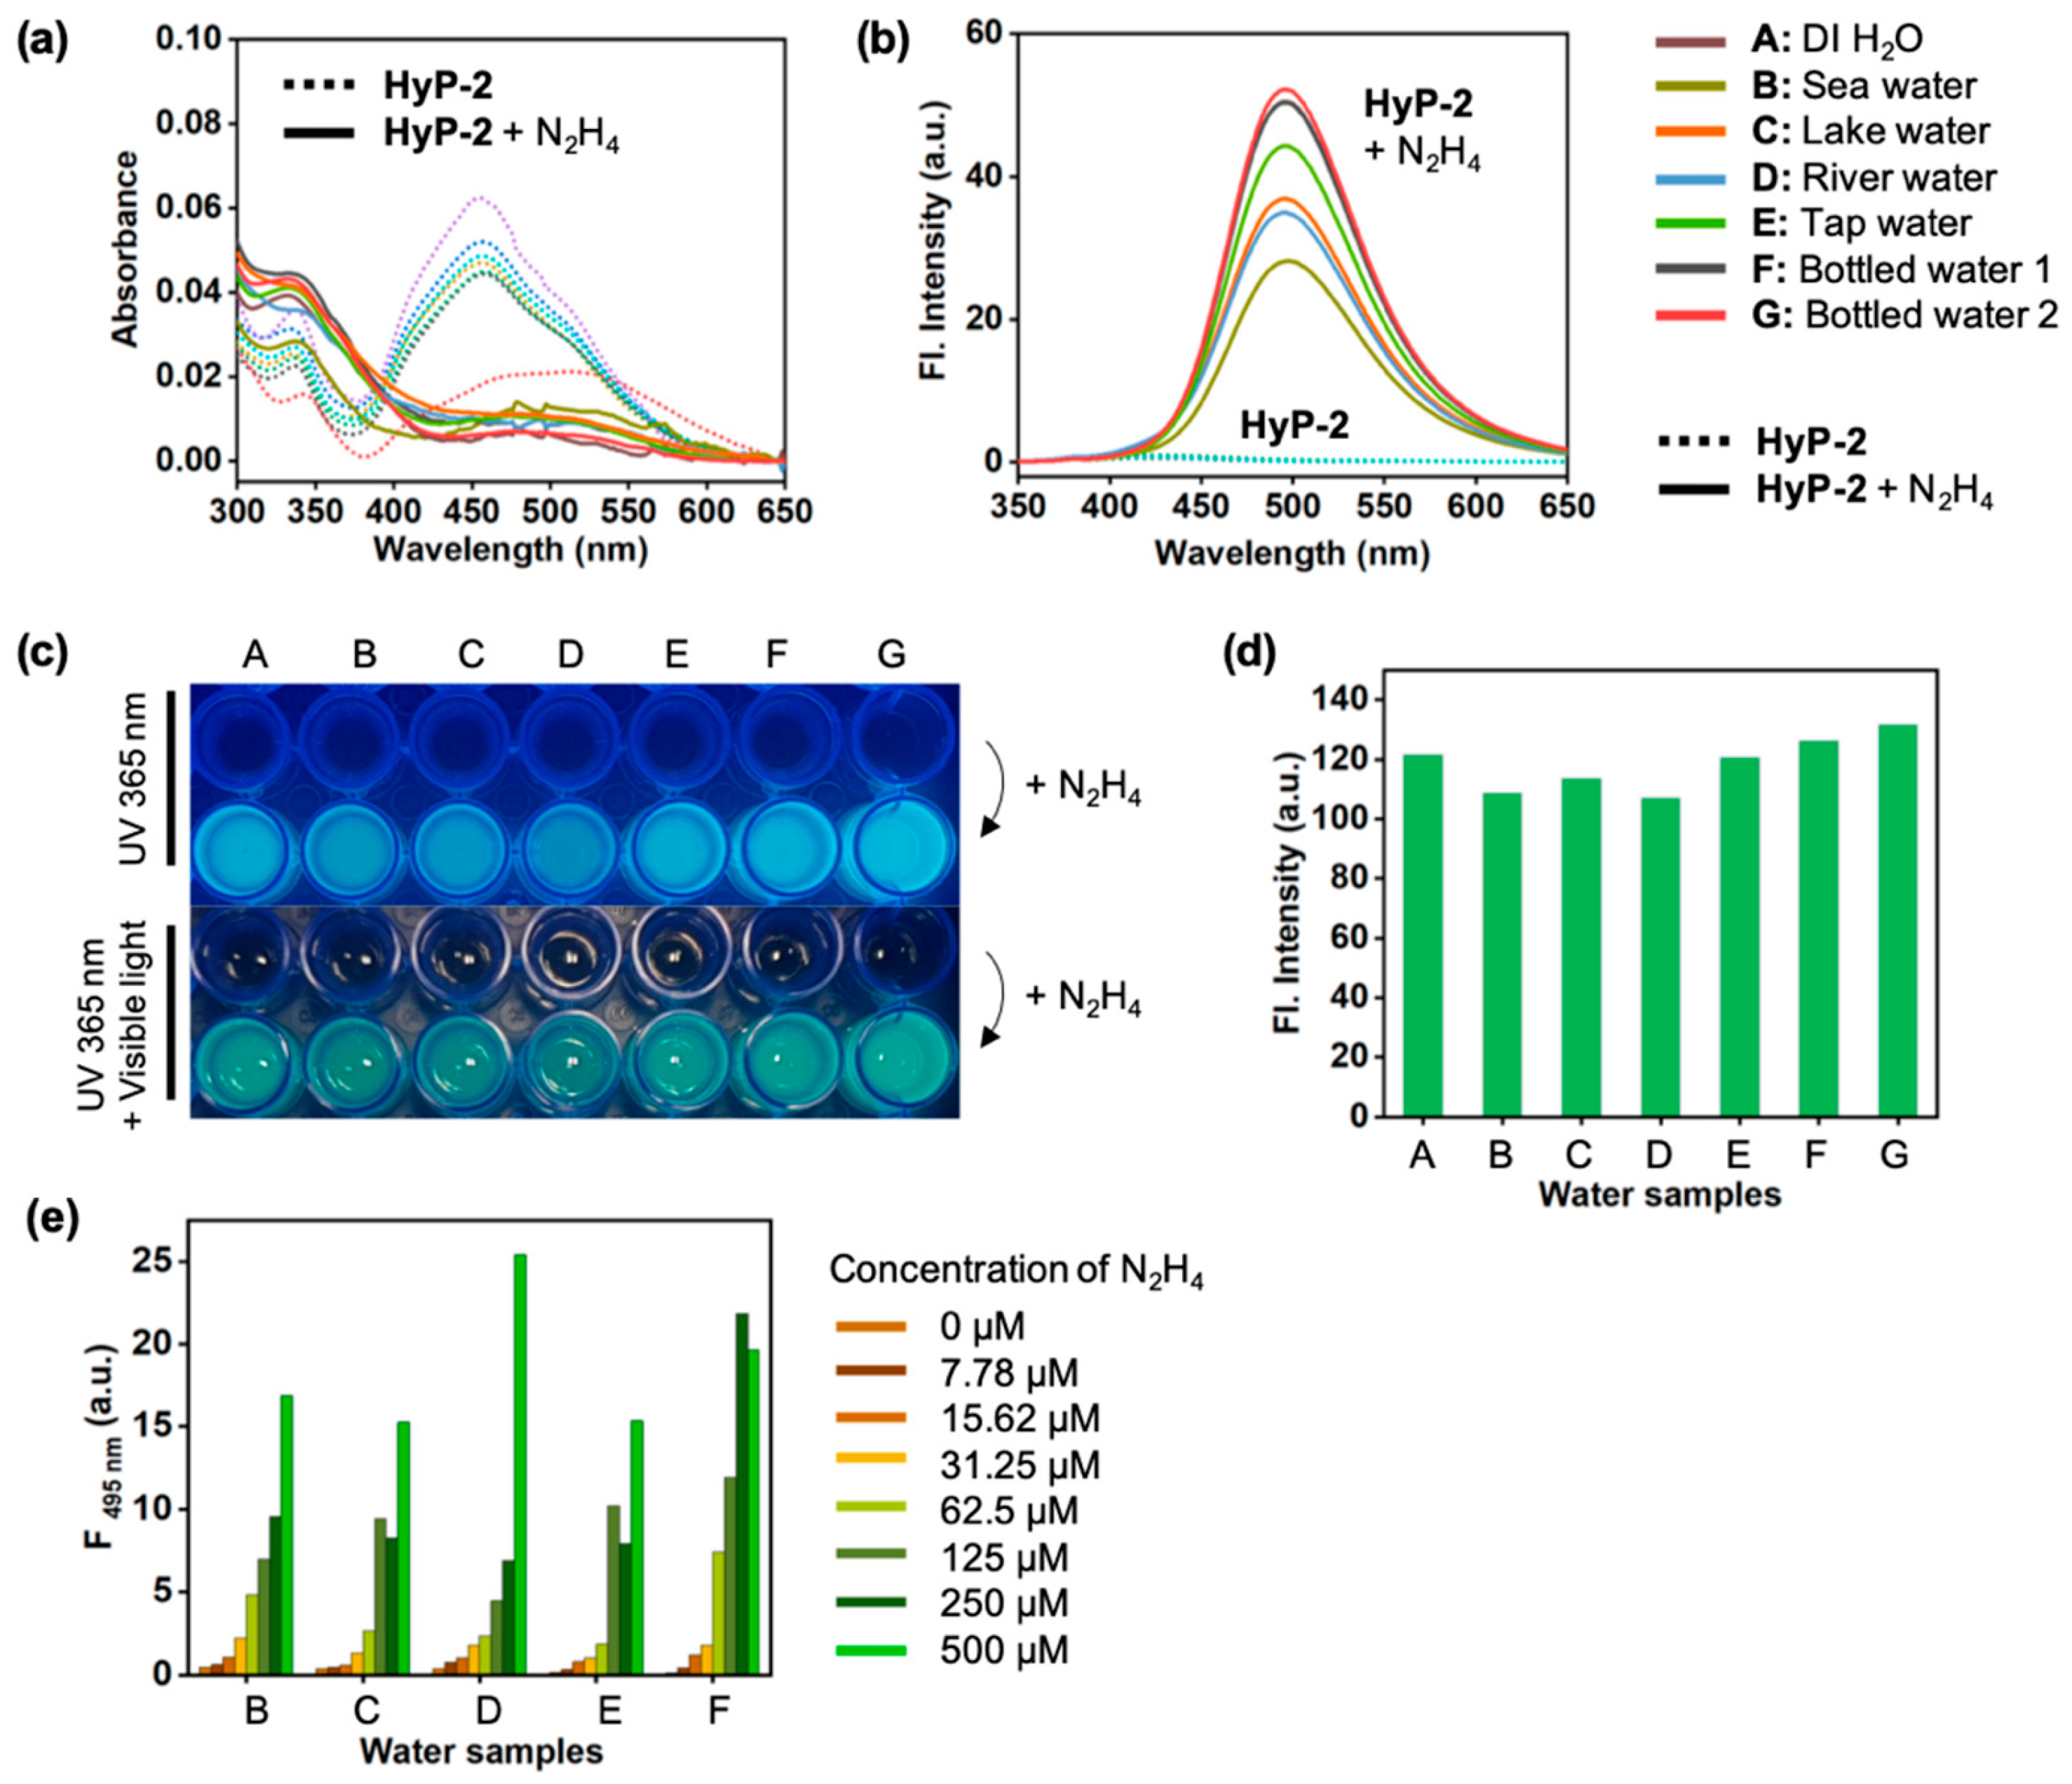
3.6. Hydrazine Sensing Application in Real Water Samples
4. Conclusions
Supplementary Materials
Author Contributions
Funding
Acknowledgments
Conflicts of Interest
References
- Yuan, L.; Lin, W.; Zheng, K.; He, L.; Huang, W. Far-red to near infrared analyte-responsive fluorescent probes based on organic fluorophore platforms for fluorescence imaging. Chem. Soc. Rev. 2013, 42, 622–661. [Google Scholar] [CrossRef] [PubMed]
- Tang, Y.; Lee, D.; Wang, J.; Li, G.; Yu, J.; Lin, W.; Yoon, J. Development of fluorescent probes based on protection–deprotection of the key functional groups for biological imaging. Chem. Soc. Rev. 2015, 44, 5003–5015. [Google Scholar] [CrossRef] [PubMed]
- Kim, H.N.; Ren, W.X.; Kim, J.S.; Yoon, J. Fluorescent and colorimetric sensors for detection of lead, cadmium, and mercury ions. Chem. Soc. Rev. 2012, 41, 3210–3244. [Google Scholar] [CrossRef] [PubMed]
- Guo, S.-H.; Guo, Z.-Q.; Wang, C.-Y.; Shen, Y.; Zhu, W.-H. An ultrasensitive fluorescent probe for hydrazine detection and its application in water samples and living cells. Tetrahedron 2019, 75, 2642–2646. [Google Scholar] [CrossRef]
- Han, X.; Tian, C.; Yuan, M.S.; Li, Z.X.; Wang, W.J.; Li, T.B.; Chen, S.W.; Wang, J.Y. Colorimetric hydrazine detection and fluorescent hydrogen peroxide imaging by using a multifunctional chemical probe. Anal. Chim. Acta 2019, 1052, 137–144. [Google Scholar] [CrossRef]
- Reja, S.I.; Gupta, N.; Bhalla, V.; Kaur, D.; Arora, S.; Kumar, M. A charge transfer based ratiometric fluorescent probe for detection of hydrazine in aqueous medium and living cells. Sens. Actuators B Chem. 2016, 222, 923–929. [Google Scholar] [CrossRef]
- Manna, S.K.; Gangopadhyay, A.; Maiti, K.; Mondal, S.; Mahapatra, A.K. Recent Developments in Fluorometric and Colorimetric Chemodosimeters Targeted towards Hydrazine Sensing: Present Success and Future Possibilities. ChemistrySelect 2019, 4, 7219–7245. [Google Scholar] [CrossRef]
- Garrod, S.; Bollard, M.E.; Nicholls, A.W.; Connor, S.C.; Connelly, J.; Nicholson, J.K.; Holmes, E. Integrated Metabonomic Analysis of the Multiorgan Effects of Hydrazine Toxicity in the Rat. Chem. Res. Toxicol. 2005, 18, 115–122. [Google Scholar] [CrossRef]
- Reilly, C.A.; Aust, S.D. Peroxidase Substrates Stimulate the Oxidation of Hydralazine to Metabolites Which Cause Single-Strand Breaks in DNA. Chem. Res. Toxicol. 1997, 10, 328–334. [Google Scholar] [CrossRef]
- Toth, B. Synthetic and Naturally Occurring Hydrazines as Possible Cancer Causative Agents. Cancer Res. 1975, 35, 3693–3697. [Google Scholar]
- Oh, J.-A.; Park, J.-H.; Shin, H.-S. Sensitive determination of hydrazine in water by gas chromatography–mass spectrometry after derivatization with ortho-phthalaldehyde. Anal. Chim. Acta 2013, 769, 79–83. [Google Scholar] [CrossRef] [PubMed]
- He, Z.K.; Fuhrmann, B.; Spohn, U. Coulometric microflow titrations with chemiluminescent and amperometric equivalence point detection: Bromimetric titration of low concentrations of hydrazine and ammonium. Anal. Chim. Acta 2000, 409, 83–91. [Google Scholar] [CrossRef]
- Liu, J.; Li, Y.; Jiang, J.; Huang, X. C@ZnO nanorod array-based hydrazine electrochemical sensor with improved sensitivity and stability. Dalton Trans. 2010, 39, 8693–8697. [Google Scholar] [CrossRef] [PubMed]
- Lu, Z.L.; Shi, X.M.; Ma, Y.F.; Fan, W.L.; Lu, Y.N.; Wang, Z.; Fan, C.H. A simple two-output near-infrared fluorescent probe for hydrazine detection in living cells and mice. Sens. Actuators B-Chem. 2018, 258, 42–49. [Google Scholar] [CrossRef]
- Zhang, Y.; Huang, Y.; Yue, Y.; Chao, J.; Huo, F.; Yin, C. A compact fluorescent probe based on o-phthalaldehyde for ultrasensitive detection of hydrazine in gas and solution phases. Sens. Actuators B Chem. 2018, 273, 944–950. [Google Scholar] [CrossRef]
- Nguyen, K.H.; Hao, Y.; Chen, W.; Zhang, Y.; Xu, M.; Yang, M.; Liu, Y.-N. Recent progress in the development of fluorescent probes for hydrazine. Luminescence 2018, 33, 816–836. [Google Scholar] [CrossRef]
- Shi, X.R.; Huo, F.J.; Chao, J.B.; Yin, C.X. A ratiometric fluorescent probe for hydrazine based on novel cyclization mechanism and its application in living cells. Sens. Actuators B-Chem. 2018, 260, 609–616. [Google Scholar] [CrossRef]
- Jung, Y.; Ju, I.G.; Choe, Y.H.; Kim, Y.; Park, S.; Hyun, Y.-M.; Oh, M.S.; Kim, D. Hydrazine Exposé: The Next-Generation Fluorescent Probe. ACS Sens. 2019, 4, 441–449. [Google Scholar] [CrossRef]
- Kallitsakis, M.G.; Tancini, P.D.; Dixit, M.; Mpourmpakis, G.; Lykakis, I.N. Mechanistic Studies on the Michael Addition of Amines and Hydrazines To Nitrostyrenes: Nitroalkane Elimination via a Retro-aza-Henry-Type Process. J. Org. Chem. 2018, 83, 1176–1184. [Google Scholar] [CrossRef]
- Kim, D.; Xuan, Q.P.; Moon, H.; Jun, Y.W.; Ahn, K.H. Synthesis of Benzocoumarins and Characterization of Their Photophysical Properties. Asian J. Org. Chem. 2014, 3, 1089–1096. [Google Scholar] [CrossRef]
- Kim, N.H.; Lee, J.; Park, S.; Jung, J.; Kim, D. A Schiff Base Fluorescence Enhancement Probe for Fe(III) and Its Sensing Applications in Cancer Cells. Sensor 2019, 19, 2500. [Google Scholar] [CrossRef] [PubMed]
- Shin, J.; Verwilst, P.; Choi, H.; Kang, S.; Han, J.; Kim, N.H.; Choi, J.G.; Oh, M.S.; Hwang, J.S.; Kim, D.; et al. Harnessing Intramolecular Rotation To Enhance Two-photon Imaging of Aβ Plaques through Minimizing Background Fluorescence. Angew. Chem. Int. Ed. 2019, 58, 5648–5652. [Google Scholar] [CrossRef] [PubMed]
- Moon, H.; Jung, Y.; Kim, Y.; Kim, B.W.; Choi, J.G.; Kim, N.H.; Oh, M.S.; Park, S.; Kim, B.M.; Kim, D. High Stability of a Donor–Acceptor Type Oxazepine-Containing Fluorophore and Its Applications in Cellular Imaging and Two-Photon Deep Tissue Imaging. Org. Lett. 2019, 21, 3891–3894. [Google Scholar] [CrossRef] [PubMed]
- Kim, D.; Baik, S.H.; Kang, S.; Cho, S.W.; Bae, J.; Cha, M.-Y.; Sailor, M.J.; Mook-Jung, I.; Ahn, K.H. Close Correlation of Monoamine Oxidase Activity with Progress of Alzheimer’s Disease in Mice, Observed by in Vivo Two-Photon Imaging. ACS Cent. Sci. 2016, 2, 967–975. [Google Scholar] [CrossRef] [PubMed]
- Jung, Y.; Kim, Y.; Kim, N.H.; Lee, J.; Kim, K.-H.; Jung, J.; Huh, Y.; Jang, H.-J.; Joo, J.; Park, S.; et al. A wavelength-tunable and facilely functionable D-A type naphthalene core skeleton: Synthesis, photophysical property, and bio-imaging applications for cells and tissues. Dyes Pigment. 2019, 162, 104–111. [Google Scholar] [CrossRef]
- Chen, B.; Sun, X.; Li, X.; Ågren, H.; Xie, Y. TICT based fluorescence “turn-on” hydrazine probes. Sens. Actuators B Chem. 2014, 199, 93–100. [Google Scholar] [CrossRef]
- Kim, D.; Ryu, H.G.; Ahn, K.H. Recent development of two-photon fluorescent probes for bioimaging. Org. Biomol. Chem. 2014, 12, 4550–4566. [Google Scholar] [CrossRef] [Green Version]
- Kung, C.E.; Reed, J.K. Fluorescent molecular rotors: A new class of probes for tubulin structure and assembly. Biochemistry 1989, 28, 6678–6686. [Google Scholar] [CrossRef]
- Haidekker, M.A.; Theodorakis, E.A. Environment-sensitive behavior of fluorescent molecular rotors. J. Biol. Eng. 2010, 4, 11. [Google Scholar] [CrossRef]
- Lee, S.-C.; Heo, J.; Woo, H.C.; Lee, J.-A.; Seo, Y.H.; Lee, C.-L.; Kim, S.; Kwon, O.-P. Fluorescent Molecular Rotors for Viscosity Sensors. Chem. Eur. J. 2018, 24, 13706–13718. [Google Scholar] [CrossRef]
- Singha, S.; Kim, D.; Roy, B.; Sambasivan, S.; Moon, H.; Rao, A.S.; Kim, J.Y.; Joo, T.; Park, J.W.; Rhee, Y.M.; et al. A structural remedy toward bright dipolar fluorophores in aqueous media. Chem. Sci. 2015, 6, 4335–4342. [Google Scholar] [CrossRef] [PubMed] [Green Version]
- Paul, S.; Ghoshal, K.; Bhattacharyya, M.; Maiti, D.K. Detection of HSO3−: A Rapid Colorimetric and Fluorimetric Selective Sensor for Detecting Biological SO2 in Food and Living Cells. ACS Omega 2017, 2, 8633–8639. [Google Scholar] [CrossRef] [PubMed]


© 2019 by the authors. Licensee MDPI, Basel, Switzerland. This article is an open access article distributed under the terms and conditions of the Creative Commons Attribution (CC BY) license (http://creativecommons.org/licenses/by/4.0/).
Share and Cite
Jung, Y.; Park, N.K.; Kang, J.S.; Kim, D. Hydrazine-Selective Fluorescent Turn-On Probe Based on Ortho-Methoxy-Methyl-Ether (o-MOM) Assisted Retro-aza-Henry Type Reaction. Sensors 2019, 19, 4525. https://doi.org/10.3390/s19204525
Jung Y, Park NK, Kang JS, Kim D. Hydrazine-Selective Fluorescent Turn-On Probe Based on Ortho-Methoxy-Methyl-Ether (o-MOM) Assisted Retro-aza-Henry Type Reaction. Sensors. 2019; 19(20):4525. https://doi.org/10.3390/s19204525
Chicago/Turabian StyleJung, Yuna, Nam Kyoo Park, Jae Seung Kang, and Dokyoung Kim. 2019. "Hydrazine-Selective Fluorescent Turn-On Probe Based on Ortho-Methoxy-Methyl-Ether (o-MOM) Assisted Retro-aza-Henry Type Reaction" Sensors 19, no. 20: 4525. https://doi.org/10.3390/s19204525