Design and Experimental Validation of a LoRaWAN Fog Computing Based Architecture for IoT Enabled Smart Campus Applications †

 ,
,  ,
,  ,
,  ,
,  ,
,  , ,
, ,  and
and 
Abstract
:1. Introduction
- To establish the basics, it presents the main characteristics of the so-called smart campuses together with a detailed review of the state of the art of the main and the latest communications architectures and technologies, previous academic deployments, novel potential LPWAN applications and relevant tools for radio propagation modeling and planning.
- It thoroughly details the design, implementation, and practical evaluation of a scalable LPWAN-based communications architecture for supporting the smart campus IoT applications.
- The article presents the 3D modeling of a real 26,000 m campus whose LoRaWAN wireless propagation characteristics are evaluated with an in-house developed 3D Ray-launching radio-planning simulator. The results obtained by such a simulator are validated by comparing them with empirical LoRaWAN measurements obtained throughout the campus.
- It details how the radio-planning tool can be used to design the deployment of LoRaWAN infrastructure for three smart campus applications: a mobility pattern detection system, a smart irrigation solution, and a smart traffic-monitoring deployment. Thus, it demonstrates the usefulness of the proposed tools and methodology, which are able to provide fast guidelines to smart campus designers and developers, and that can also be used for easing LoRaWAN network deployment and research in other large environments such as smart cities.
2. Related Work
2.1. Characteristics of a Smart Campus
- Smart governance. It provides users with mechanisms to participate in decision-making or in public services.
- Smart people. It deals with social issues, including the engagement in campus events and learning activities.
- Smart mobility. This field is related to the accessibility of the campus, including the use of efficient, clean, safe, and intelligent transport means.
- Smart environment. It contemplates the monitoring and protection of the environment, as well as the sustainable management of the available resources.
- Smart economy. It is related to the competitiveness of the campus in terms of entrepreneurship, innovation, or productivity.
- Smart living services: room occupation, classroom/lab equipment access control, health monitoring and alert services, classroom attendance systems, teaching interaction services, or context-aware applications (e.g., guidance or navigation solutions).
- Smart environment solutions: they include solutions for monitoring waste, water consumption, air quality (e.g., pollution) or the status of the campus green areas.
- Smart energy systems: they control and monitor the production, distribution, and consumption of energy in a campus.
2.2. Smart Campus Communications Architectures and Technologies
2.3. Smart Campus Deployments
2.4. Potential Smart Campus LPWAN Applications
- Smart mobility and intelligent transport services. These applications require ubiquitous outdoor coverage to provide continuous data streams. For instance, in [71] researchers of Soochow University (China) propose the deployment of different smart mobility applications for their campuses, which include automatic vehicle access systems, a parking guidance service, a bus tracking system, or a bicycle rental service. Other authors also proposed similar solutions for providing campus services for smart parking [72], electric mobility [73,74], smart electric charging [75], the use of autonomous vehicles [76] or bus tracking [77].
- Smart energy and smart grid monitoring. Certain energy sources (e.g., renewable sources such as photo-voltaic panels or windmills) and smart grid components may be in remote locations, so it would be helpful to make use of LPWAN technologies to monitor them. For this reason, in recent years, special attention has been given to smart campus microgrids [78], smart grids [79] and smart energy systems [80].
- Campus user profiling. It is interesting for the campus managers to determine user patterns and behaviors to optimize the provided services. Thus, user profiling can be helpful to obtain mobility patterns, student daily walks, user activities, or social interactions, which can be obtained through opportunistic messaging apps [85], Wi-Fi monitoring [86] or on-board mobile phone sensors [87].
- Outdoor guidance and context-aware applications. This kind of systems are usually based on sensors and actuators spread throughout the campus and help people to reach their destination. There are examples in the literature of systems for guiding hearing and visually impaired people [88] or for navigating through the campus paths [89]. There are also augmented reality guidance applications [90], but it is important to note that LPWAN technologies could only help in small packet exchanges (e.g., for transmitting certain telemetry or positioning data), since the real-time multimedia content that can be demanded by augmented reality applications requires high-speed rates to preserve a good user experience.
- Classroom attendance. Some university events are carried out outdoors, what makes it difficult to control classroom attendance. To tackle such an issue, some researchers have proposed different sensor-based student monitoring systems that can be repurposed to be used outdoors [91].
- Infrastructure monitoring. It is possible to monitor remotely the status of certain assets that are scattered throughout the campus. For example, some authors presented smart campus solutions for managing campus greenhouses [92] or for monitoring high power lines with Unmanned Aerial Vehicles (UAVs) [93].
2.5. Smart Campus Modeling and Planning Simulators
2.6. Key Findings
3. Design and Implementation of the Smart Campus System
3.1. Architecture for Outdoor Applications
3.2. Operational Requirements for Outdoor Applications
- Coverage capabilities. The coverage of the smart campus should be maximized. The typically expected coverage should be around 1 km considering both Line-of-Sight (LoS) and No-Line-of-Sight (NLoS) scenarios.
- Robustness capabilities. The system should provide robustness to signal interference and/or loss of network operation. The network should provide redundancy and thus be robust against single points of failure.
- Supported services and applications. The previously mentioned applications (in Section 2.4) should be supported. Quality of Service (QoS) requirements should include support for high-peak rate demand, latency-sensitive traffic, and location-aware IoT applications. A transmission speed of up to 50 Kbps should be expected.
- Deployment features and cost. It should be expected that the deployment will depend largely on low-cost IoT nodes resource-constrained in terms of memory, battery, computing capabilities, and energy consumption.
- Network topology. The network architecture should support Point-To-Multipoint (PMP) and Point-to-Point (PtP) links. The system should be capable of establishing ad-hoc networking for specific scenarios (i.e., by using star or mesh topologies).
3.3. LoRaWAN Testbed Implementation
- Coding Rate: .
- RX1 delay: 1.
- RX2 delay: 2.
- Power: 14 dBm.
- RX Frequency: 869.5 MHz.
4. LoRaWAN Planning Simulator Setup
4.1. Planning Simulator
4.2. Scenario under Analysis
5. Experiments
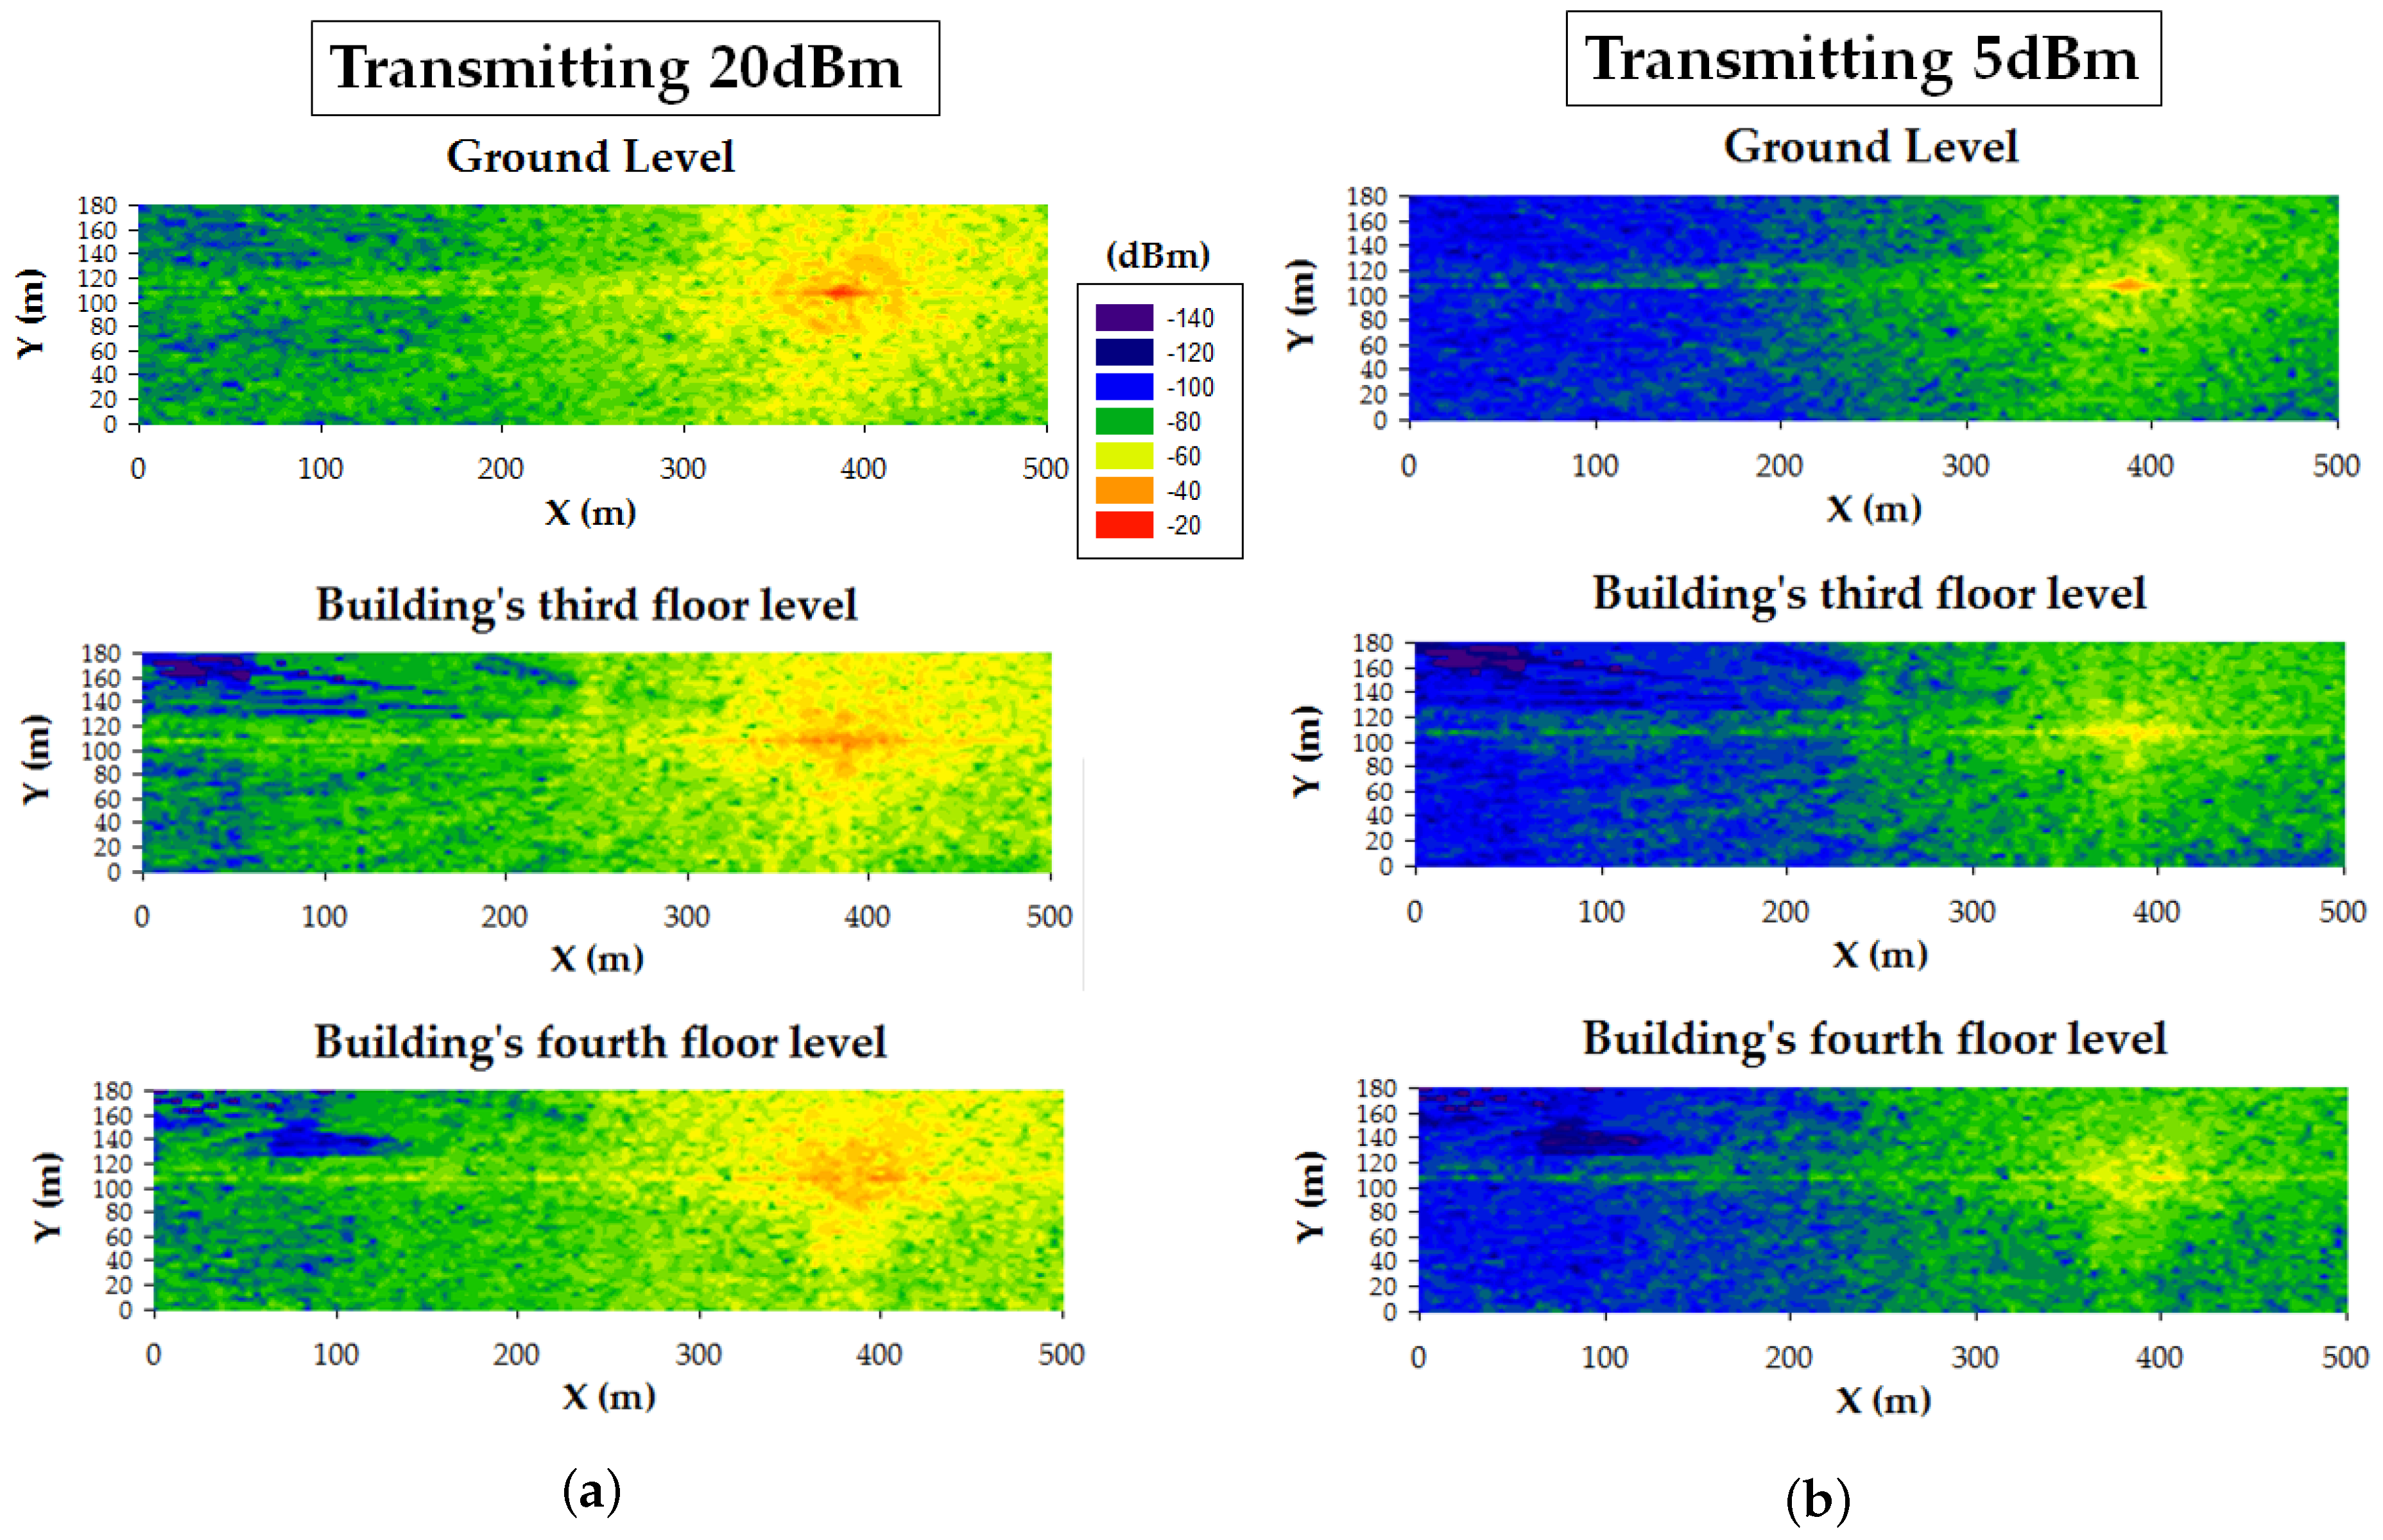
5.1. Empirical Validation: LoRaWAN Testbed
5.2. Planning of Smart Campus Use Cases
- Crowdsensing/Mobility pattern detection. The purple dots depicted in Figure 9 represent the location of SBC-type devices (e.g., Raspberry Pi) that act as Bluetooth and Wi-Fi sniffers that will help to determine the mobility patterns of the users that move throughout the campus, what will optimize the deployed location-based services. In the same way, the devices could also help in crowdsensing tasks in certain areas.
- Smart irrigation. In this case, due to the location of the campus green areas, devices will be deployed only in one of the modeled scenarios. The device locations are represented by yellow dots shown in Figure 10. The aim of this system is to remotely control and automate the irrigation of green areas where the deployment of wired infrastructure to control the valves is very expensive or even unfeasible.
- Smart traffic monitoring. To detect vehicular traffic, sensors are deployed at the points represented by blue dots in Figure 11. In this way, the traffic behavior within the campus can be analyzed and the degree of parking occupancy could be inferred. Sustainability and ecological measurements to boost public transportation, to optimize routes and resources, and to adapt to real-time demand could be taken.
6. Discussion
7. Conclusions
- The provided coverage is roughly 1 km.
- The system provides robustness against signal losses and interference by being able to deploy redundant gateways.
- The use of fog computing nodes supports low-latency and location-aware IoT applications.
- The maximum provided transmission speed reaches 50 Kbps.
- The system has been devised to make use of low-cost resource-constrained IoT nodes.
- The network topology support both PMP and PtP links.
Author Contributions
Funding
Conflicts of Interest
References
- Fortes, S.; Santoyo-Ramón, J.A.; Palacios, D.; Baena, E.; Mora-García, R.; Medina, M.; Mora, P.; Barco, R. The Campus as a Smart City: University of Málaga Environmental, Learning, and Research Approaches. Sensors 2019, 19, 1349. [Google Scholar] [CrossRef] [PubMed]
- Abuarqoub, A.; Abusaimeh, H.; Hammoudeh, M.; Uliyan, D.; Abu-Hashem, M.A.; Murad, S.; Al-Fayez, F. A survey on internet of things enabled smart campus applications. In Proceedings of the International Conference on Future Networks and Distributed Systems, Cambridge, UK, 19–20 July 2017; p. 50. [Google Scholar]
- Hernández-Rojas, D.L.; Fernández-Caramés, T.M.; Fraga-Lamas, P.; Escudero, C.J. Design and Practical Evaluation of a Family of Lightweight Protocols for Heterogeneous Sensing through BLE Beacons in IoT Telemetry Applications. Sensors 2018, 18, 57. [Google Scholar] [CrossRef] [PubMed]
- Sivanathan, A.; Sherratt, D.; Gharakheili, H.H.; Radford, A.; Wijenayake, C.; Vishwanath, A.; Sivaraman, V. Characterizing and classifying IoT traffic in smart cities and campuses. In Proceedings of the 2017 IEEE Conference on Computer Communications Workshops (INFOCOM WKSHPS), Atlanta, GA, USA, 1–4 May 2017; pp. 559–564. [Google Scholar]
- Bates, O.; Friday, A. Beyond Data in the Smart City: Repurposing Existing Campus IoT. IEEE Pervasive Comput. 2017, 16, 54–60. [Google Scholar] [CrossRef] [Green Version]
- Froiz-Míguez, I.; Fernández-Caramés, T.M.; Fraga-Lamas, P.; Castedo, L. Design, Implementation and Practical Evaluation of an IoT Home Automation System for Fog Computing Applications Based on MQTT and ZigBee-WiFi Sensor Nodes. Sensors 2018, 18, 2660. [Google Scholar] [CrossRef] [PubMed]
- Berry College Official Web Page on Its Campus Extension. Available online: https://www.berry.edu/eaglecam/learn/ (accessed on 31 March 2019).
- Duke University Official Web Page on Its Campus Extension. Available online: https://today.duke.edu/2011/11/onlinemaplaunch (accessed on 31 March 2019).
- Stanford University Web Page on the Extension of Its Lands. Available online: https://facts.stanford.edu/about/lands/ (accessed on 31 March 2019).
- Gumprecht, B. The campus as a public space in the American college town. J. Hist. Geogr. 2007, 33, 72–103. [Google Scholar] [CrossRef]
- National Institute for Education Policy Reseach, Guide to the Creation of a Strategic Campus Master Plan. Available online: https://www.nier.go.jp/shisetsu/pdf/e-masterplan.pdf (accessed on 31 March 2019).
- Princeton University Campus Plan. Available online: https://pr.princeton.edu/doc/PrincetonCampusPlan2017.pdf (accessed on 31 March 2019).
- Wollongong Campus Master Plan. Available online: https://www.uow.edu.au/content/groups/public/@web/@pmcd/@smc/documents/doc/uow220188.pdf (accessed on 31 March 2019).
- Sanchez-Iborra, R.; Cano, M.-D. State of the Art in LP-WAN Solutions for Industrial IoT Services. Sensors 2016, 16, 708. [Google Scholar] [CrossRef]
- 3GPP Completed the Standardization of NB-IOT. Available online: http://www.3gpp.org/news-events/3gpp-news/1785-nb_iot_complete (accessed on 31 March 2019).
- Sigfox Official Webpage. Available online: https://www.sigfox.com/ (accessed on 31 March 2019).
- Ingenu Official Webpage. Available online: https://www.ingenu.com/ (accessed on 31 March 2019).
- Weightless Official Webpage. Available online: http://www.weightless.org/ (accessed on 31 March 2019).
- LoRa-Alliance. LoRaWAN What is it? A Technical Overview of LoRa and LoRaWAN; White Paper; The LoRa Alliance: San Ramon, CA, USA, 2015. [Google Scholar]
- Adelantado, F.; Vilajosana, X.; Tuset-Peiro, P.; Martinez, B.; Melia-Segui, J.; Watteyne, T. Understanding the Limits of LoRaWAN. IEEE Commun. Mag. 2017, 55, 34–40. [Google Scholar] [CrossRef] [Green Version]
- Yang, G.; Liang, H. A Smart Wireless Paging Sensor Network for Elderly Care Application Using LoRaWAN. IEEE Sens. J. 2018, 22, 9441–9448. [Google Scholar] [CrossRef]
- Luvisotto, M.; Tramarin, F.; Vangelista, L.; Vitturi, S. On the Use of LoRaWAN for Indoor Industrial IoT Applications. Wirel. Commun. Mob. Comput. 2018, 18. [Google Scholar] [CrossRef]
- Semtech AN 120022 LoRa Modulation Basics, May 2015. Available online: https://www.semtech.com/uploads/documents/an1200.22.pdf (accessed on 31 March 2019).
- Suárez-Albela, M.; Fernández-Caramés, T.; Fraga-Lamas, P.; Castedo, L. A Practical Evaluation of a High-Security Energy-Efficient Gateway for IoT Fog Computing Applications. Sensors 2017, 17, 1978. [Google Scholar] [CrossRef]
- Wang, S.; Chen, Y.-R.; Chen, T.-Y.; Chang, C.-H.; Cheng, Y.-H.; Hsu, C.-C.; Lin, Y.-B. Performance of LoRa-Based IoT Applications on Campus. In Proceedings of the 2017 IEEE 86th Vehicular Technology Conference (VTC-Fall), Toronto, ON, Canada, 24–27 September 2017; pp. 1–6. [Google Scholar]
- Cesana, M.; Redondi, A.; Ort‘ın, J. A Framework for Planning LoRaWan Networks. In Proceedings of the 2018 IEEE 29th Annual International Symposium on Personal, Indoor and Mobile Radio Communications (PIMRC), Bologna, Italy, 9–12 September 2018; pp. 1–7. [Google Scholar]
- Sadowski, S.; Spachos, P. RSSI-Based Indoor Localization with the Internet of Things. IEEE Access 2018, 6, 30149–30161. [Google Scholar] [CrossRef]
- Casino, F.; Azpilicueta, L.; Lopez-Iturri, P.; Aguirre, E.; Falcone, F.; Solanas, A. Optimized Wireless Channel Characterization in Large Complex Environments by Hybrid Ray Launching-Collaborative Filtering Approach. IEEE Antennas Wirel. Propag. Lett. 2017, 16, 780–783. [Google Scholar] [CrossRef]
- Vargas, C.E.O.; Silva, M.M.; Arnez, J.J.A.; Mello, L.D.S. Initial Results of Millimeter Wave Outdoor Propagation Measurements in a Campus Environment. In Proceedings of the 2018 IEEE-APS Topical Conference on Antennas and Propagation in Wireless Communications (APWC), Cartagena de Indias, Colombia, 10–14 September 2018; pp. 901–904. [Google Scholar]
- Chen, X.; Jin, R.; Suh, K.; Wang, B.; Wei, W. Network performance of smart mobile handhelds in a university campus Wi-Fi network. In Proceedings of the 2012 Internet Measurement Conference, Boston, MA, USA, 14–16 November 2012; pp. 315–328. [Google Scholar]
- Atif, Y.; Mathew, S.S.; Lakas, A. Building a smart campus to support ubiquitous learning. J. Ambient. Intell. Humaniz. Comput. 2015, 6, 223–238. [Google Scholar] [CrossRef]
- Hirsch, B.; Ng, J.W. Education beyond the cloud: Anytime-anywhere learning in a smart campus environment. In Proceedings of the 2011 IEEE International Conference for Internet Technology and Secured Transactions, Abu Dhabi, UAE, 11–14 December 2011; pp. 718–723. [Google Scholar]
- Bakken, J.P.; Uskov, V.L.; Penumatsa, A.; Doddapaneni, A. Smart universities, smart classrooms and students with disabilities. In Smart Education and e-Learning; Springer: Cham, Switzerland, 2016; pp. 15–27. [Google Scholar]
- Kwok, L.F. A vision for the development of i-campus. Smart Learn. Environ. 2015, 2, 1–12. [Google Scholar] [CrossRef]
- Vienna University of Technology, University of Ljubljana, Delft University of Technology, Technical Report: Smart Cities, Ranking of European Medium-Size Cities. 2007. Available online: http://www.smart-cities.eu/download/smart_cities_final_report.pdf (accessed on 31 March 2019).
- Wu, F.; Rüdiger, C.; Redouté, J.; Yuce, M.R. WE-Safe: A wearable IoT sensor node for safety applications via LoRa. In Proceedings of the 2018 IEEE 4th World Forum on Internet of Things (WF-IoT), Singapore, 5–8 February 2018; pp. 144–148. [Google Scholar]
- Blanco-Novoa, O.; Fernández-Caramés, T.M.; Fraga-Lamas, P.; Castedo, L. A Cost-Effective IoT System for Monitoring Indoor Radon Gas Concentration. Sensors 2018, 18, 2198. [Google Scholar] [CrossRef] [PubMed]
- Fernández-Caramés, T.M.; Fraga-Lamas, P. Design of a Fog Computing, Blockchain and IoT-Based Continuous Glucose Monitoring System for Crowdsourcing mHealth. Proceedings 2019, 4, 5757. [Google Scholar] [CrossRef]
- Pompei, L.; Mattoni, B.; Bisegna, F.; Nardecchia, F.; Fichera, A.; Gagliano, A.; Pagano, A. Composite Indicators for Smart Campus: Data Analysis Method. In Proceedings of the IEEE International Conference on Environment and Electrical Engineering and the IEEE Industrial and Commercial Power Systems Europe, Palermo, Italy, 12–15 June 2018. [Google Scholar]
- Cao, J.; Li, Z.; Luo, Q.; Hao, Q.; Jiang, T. Research on the Construction of Smart University Campus Based on Big Data and Cloud Computing. In Proceedings of the International Conference on Engineering Simulation and Intelligent Control (ESAIC), Changsha, China, 10–11 August 2018. [Google Scholar]
- Haghi, A.; Burney, K.; Kidd, F.S.; Valiente, L.; Peng, Y. Fast-paced development of a smart campus IoT platform. In Proceedings of the Global Internet of Things Summit, Geneva, Switzerland, 6–9 June 2017. [Google Scholar]
- Majeed, A.; Ali, M. How Internet-of-Things (IoT) making the university campuses smart? QA higher education (QAHE) perspective. In Proceedings of the IEEE 8th Annual Computing and Communication Workshop and Conference (CCWC), Las Vegas, NV, USA, 8–10 January 2018. [Google Scholar]
- Alghamdi, A.; Shetty, S. Survey Toward a Smart Campus Using the Internet of Things. In Proceedings of the IEEE 4th International Conference on Future Internet of Things and Cloud (FiCloud), Vienna, Austria, 22–24 August 2016. [Google Scholar]
- Yu, Z.; Liang, Y.; Xu, B.; Yang, Y.; Guo, B. Towards a Smart Campus with Mobile Social Networking. In Proceedings of the International Conference on Internet of Things and 4th International Conference on Cyber, Physical and Social Computing, Dalian, China, 19–22 October 2011. [Google Scholar]
- Hipwell, S. Developing smart campuses—A working model. In Proceedings of the International Conference on Intelligent Green Building and Smart Grid (IGBSG), Taipei, Taiwan, 23–25 April 2014. [Google Scholar]
- Ali, S.; Rizzo, G.; Mancuso, V.; Marsan, M.A. Persistence and availability of floating content in a campus environment. In Proceedings of the IEEE Conference on Computer Communications, Hong Kong, China, 26 April–1 May 2015. [Google Scholar]
- Popescu, D.E.; Prada, M.F.; Dodescu, A.; Hemanth, D.J.; Bungau, C. A secure confident cloud computing architecture solution for a smart campus. In Proceedings of the 7th International Conference on Computers Communications and Control (ICCCC), Oradea, Romania, 8–12 May 2018. [Google Scholar]
- Marjanović, M.; Antonić, A.; Žarko, I.P. Edge Computing Architecture for Mobile Crowdsensing. IEEE Access 2018, 6, 10662–10674. [Google Scholar] [CrossRef]
- Fernández-Caramés, T.M.; Fraga-Lamas, P.; Suárez-Albela, M.; Díaz-Bouza, M. A Fog Computing Based Cyber-Physical System for the Automation of Pipe-Related Tasks in the Industry 4.0 Shipyard. Sensors 2018, 18, 1961. [Google Scholar] [CrossRef]
- Fernández-Caramés, T.M.; Fraga-Lamas, P.; Suárez-Albela, M.; Vilar-Montesinos, M. A Fog Computing and Cloudlet Based Augmented Reality System for the Industry 4.0 Shipyard. Sensors 2018, 18, 1798. [Google Scholar] [CrossRef]
- Xu, Q.; Su, Z.; Wang, Y.; Dai, M. A Trustworthy Content Caching and Bandwidth Allocation Scheme with Edge Computing for Smart Campus. IEEE Access 2018, 6, 63868–63879. [Google Scholar] [CrossRef]
- Chang, Y.; Lai, Y. Campus Edge Computing Network Based on IoT Street Lighting Nodes. IEEE Syst. J. 2018. [Google Scholar] [CrossRef]
- Liu, Y.; Shou, G.; Hu, Y.; Guo, Z.; Li, H.; Beijing, F.P.; Seah, H.S. Towards a smart campus: Innovative applications with WiCloud platform based on mobile edge computing. In Proceedings of the 12th International Conference on Computer Science and Education (ICCSE), Houston, TX, USA, 22–25 Auguat 2017. [Google Scholar]
- Agate, V.; Concone, F.; Ferraro, P. WiP: Smart Services for an Augmented Campus. In Proceedings of the IEEE International Conference on Smart Computing (SMARTCOMP), Taormina, Italy, 18–20 July 2018. [Google Scholar]
- Ghosh, A.; Chakraborty, N. Design of smart grid in an University Campus using ZigBee mesh networks. In Proceedings of the IEEE 1st International Conference on Power Electronics, Intelligent Control and Energy Systems (ICPEICES), Delhi, India, 4–6 July 2016. [Google Scholar]
- Alvarez-Campana, M.; López, G.; Vázquez, E.; Villagrá, V.A.; Berrocal, J. Smart CEI Moncloa: An IoT-based Platform for People Flow and Environmental Monitoring on a Smart University Campus. Sensors 2017, 17, 2856. [Google Scholar] [CrossRef] [PubMed]
- Bai, S.; Chiu, C.; Hsu, J.; Leu, J. Campus-wide wireless indoor positioning with hybrid iBeacon and Wi-Fi system. In Proceedings of the 6th International Symposium on Next Generation Electronics (ISNE), Keelung, Taiwan, 23–24 May 2017. [Google Scholar]
- Wang, M.; Brassil, J. Managing large scale, ultra-dense beacon deployments in smart campuses. In Proceedings of the IEEE Conference on Computer Communications Workshops (INFOCOM WKSHPS), Hong Kong, China, 26 April–1 May 2015. [Google Scholar]
- Han, T.-D.; Cheong, C.; Ann, J.-W.; Kim, J.-Y.; Yoon, H.-M.; Lee, C.-S.; Shin, H.-G.; Lee, Y.-J.; Yook, H.-M.; Jeon, M.-H.; et al. Implementation of new services to support ubiquitous computing for campus life. In Proceedings of the Second IEEE Workshop on Software Technologies for Future Embedded and Ubiquitous Systems, Vienna, Austria, 12 May 2004. [Google Scholar]
- Xu, X.; Li, D.; Sun, M.; Yang, S.; Yu, S.; Manogaran, G.; Mastorakis, G.; Mavromoustakis, C.X. Research on Key Technologies of Smart Campus Teaching Platform Based on 5G Network. IEEE Access 2019, 7, 20664–20675. [Google Scholar] [CrossRef]
- Telensa Ultra Narrow Band (UNB) Official Webpage. Available online: https://www.telensa.com/technology#top (accessed on 31 March 2019).
- Waviot NB-Fi Official Webpage. Available online: https://waviot.com/technology/what-is-nb-fi (accessed on 31 March 2019).
- Loriot, M.; Aljer, A.; Shahrour, I. Analysis of the use of LoRaWan technology in a large-scale smart city demonstrator. In Proceedings of the 2017 Sensors Networks Smart and Emerging Technologies (SENSET), Beirut, Lebanon, 12–14 September 2017; pp. 1–4. [Google Scholar]
- Wang, S.; Zou, J.; Chen, Y.; Hsu, C.; Cheng, Y.; Chang, C. Long-Term Performance Studies of a LoRaWAN-Based PM2.5 Application on Campus. In Proceedings of the 2018 IEEE 87th Vehicular Technology Conference (VTC Spring), Porto, Portugal, 3–6 June 2018; pp. 1–5. [Google Scholar]
- Lee, H.; Ke, K. Monitoring of Large-Area IoT Sensors Using a LoRa Wireless Mesh Network System: Design and Evaluation. IEEE Trans. Instrum. Meas. 2018, 67, 2177–2187. [Google Scholar] [CrossRef]
- Webb, J.; Hume, D. Campus IoT collaboration and governance using the NIST cybersecurity framework. In Proceedings of the Living in the Internet of Things: Cybersecurity of the IoT, London, UK, 28–29 March 2018. [Google Scholar]
- Verstaevel, N.; Boes, J.; Gleizes, M. From smart campus to smart cities issues of the smart revolution. In Proceedings of the IEEE SmartWorld, Ubiquitous Intelligence & Computing, Advanced & Trusted Computed, Scalable Computing & Communications, Cloud & Big Data Computing, Internet of People and Smart City Innovation, San Francisco, CA, USA, 4–8 August 2017. [Google Scholar]
- Pagliaro, F.; Mattoni, B.; Gugliermenti, F.; Bisegna, F.; Azzaro, B.; Tomei, F.; Catucci, S. A roadmap toward the development of Sapienza Smart Campus. In Proceedings of the IEEE 16th International Conference on Environment and Electrical Engineering (EEEIC), Florence, Italy, 7–10 June 2016. [Google Scholar]
- Guo, M.; Zhang, Y. The research of smart campus based on Internet of Things & cloud computing. In Proceedings of the 11th International Conference on Wireless Communications, Networking and Mobile Computing (WiCOM 2015), Shanghai, China, 21–23 September 2015. [Google Scholar]
- Muhamad, W.; Kurniawan, N.B.; Suhardi; Yazid, S. Smart campus features, technologies, and applications: A systematic literature review. In Proceedings of the International Conference on Information Technology Systems and Innovation (ICITSI), Bandung, Indonesia, 23–24 October 2017. [Google Scholar]
- Hengliang, T.; Chuanrong, C. The Construction of Intelligent Transportation System Based on the Construction of Wisdom Campus—Take Soochow University as an Example. In Proceedings of the Eighth International Conference on Measuring Technology and Mechatronics Automation (ICMTMA), Macau, China, 11–12 March 2016. [Google Scholar]
- Bandara, H.M.A.P.K.; Jayalath, J.D.C.; Rodrigo, A.R.S.P.; Bandaranayake, A.U.; Maraikar, Z.; Ragel, R.G. Smart campus phase one: Smart parking sensor network. In Proceedings of the Manufacturing & Industrial Engineering Symposium (MIES), Colombo, Sri Lanka, 22 October 2016. [Google Scholar]
- Bracco, S.; Brenna, M.; Delfmo, F.; Foiadelli, F.; Longo, M. Preliminary study on electric mobility applied to a University Campus in North Italy. In Proceedings of the 6th International Conference on Clean Electrical Power (ICCEP), Santa Margherita Ligure, Italy, 27–29 June 2017. [Google Scholar]
- Brenna, M.; Foiadelli, F.; Longo, M.; Bracco, S.; Delfino, F. Sustainable electric mobility analysis in the Savona Campus of the University of Genoa. In Proceedings of the IEEE 16th International Conference on Environment and Electrical Engineering (EEEIC), Florence, Italy, 7–10 June 2016. [Google Scholar]
- Yagcitekin, B.; Uzunoglu, M.; Ocal, B.; Turan, E.; Tunc, A. Development of Smart Charging Strategies for Electric Vehicles in a Campus Area. In Proceedings of the European Modelling Symposium, Manchester, UK, 20–22 November 2013. [Google Scholar]
- Básaca-Preciado, L.C.; Orozco-Garcia, N.A.; Terrazas-Gaynor, J.M.; Moreno-Partida, A.S.; Rosete-Beas, O.A.; Rizzo-Aguirre, J.; Martinez-Grijalva, L.F.; Ponce-Camacho, M.A. Intelligent Transportation Scheme for Autonomous Vehicle in Smart Campus. In Proceedings of the 44th Annual Conference of the IEEE Industrial Electronics Society, Washington, DC, USA, 21–23 October 2018. [Google Scholar]
- Chit, S.M.; Chaw, L.Y.; Thong, C.L.; Lee, C.Y. A pilot study: Shuttle bus tracker app for campus users. In Proceedings of the International Conference on Research and Innovation in Information Systems (ICRIIS), Langkawi, Malaysia, 10 August 2017. [Google Scholar]
- Bracco, S.; Delfino, F.; Laiolo, P.; Rossi, M. The Smart City Energy infrastructures at the Savona Campus of the University of Genoa. In Proceedings of the AEIT International Annual Conference (AEIT), Capri, Italy, 5–7 October 2016. [Google Scholar]
- Sharma, H.; Kaur, G. Optimization and simulation of smart grid distributed generation: A case study of university campus. In Proceedings of the IEEE Smart Energy Grid Engineering (SEGE), Oshawa, ON, Canada, 21–24 August 2016. [Google Scholar]
- Lazaroiu, G.C.; Dumbrava, V.; Costoiu, M.; Teliceanu, M.; Roscia, M. Smart campus-an energy integrated approach. In Proceedings of the International Conference on Renewable Energy Research and Applications (ICRERA), Palermo, Italy, 22–25 November 2015. [Google Scholar]
- Pagliaro, F.; Mattoni, B.; Ponzo, V.; Corona, G.; Nardecchia, F.; Bisegna, F.; Gugliermetti, F. Sapienza smart campus: From the matrix approach to the applicative analysis of an optimized garbage collection system. In Proceedings of the IEEE International Conference on Environment and Electrical Engineering and the IEEE Industrial and Commercial Power Systems Europe, Milan, Italy, 6–9 June 2017. [Google Scholar]
- Verma, P.; Kumar, A.; Rathod, N.; Jain, P.; Mallikarjun, S.; Subramanian, R.; Amrutur, B.; Kumar, M.S.M.; Sundaresan, R. Towards an IoT based water management system for a campus. In Proceedings of the IEEE First International Smart Cities Conference (ISC2), Guadalajara, Mexico, 25–28 October 2015. [Google Scholar]
- Liu, R.; Kuo, C.; Yang, C.; Chen, S.; Liu, J. On Construction of an Energy Monitoring Service Using Big Data Technology for Smart Campus. In Proceedings of the 7th International Conference on Cloud Computing and Big Data (CCBD), Macau, China, 16–18 November 2016. [Google Scholar]
- Lazaroiu, G.C.; Dumbrava, V.; Costoiu, M.; Teliceanu, M.; Roscia, M. Energy-informatic-centric smart campus. In Proceedings of the IEEE 16th International Conference on Environment and Electrical Engineering (EEEIC), Florence, Italy, 7–10 June 2016. [Google Scholar]
- Bacanli, S.S.; Solmaz, G.; Turgut, D. Opportunistic Message Broadcasting in Campus Environments. In Proceedings of the IEEE Global Communications Conference (GLOBECOM), San Diego, CA, USA, 6–10 December 2015. [Google Scholar]
- Zhang, S.; Li, X. Mobility patterns of human population among university campuses. In Proceedings of the IEEE Asia Pacific Conference on Circuits and Systems, Jeju, Korea, 25–28 October 2016. [Google Scholar]
- Concone, F.; Ferraro, P.; Lo Re, G. Towards a Smart Campus Through Participatory Sensing. In Proceedings of the IEEE International Conference on Smart Computing (SMARTCOMP), Taormina, Italy, 18–20 June 2018. [Google Scholar]
- Bilgi, S.; Ozturk, O.; Gulnerman, A.G. Navigation system for blind, hearing and visually impaired people in ITU Ayazaga campus. In Proceedings of the International Conference on Computing Networking and Informatics (ICCNI), Lagos, Nigeria, 29–31 October 2017. [Google Scholar]
- Yong, Q.; Cheng, B.; Xing, Y. A Novel Quantum Ant Colony Algorithm Used for Campus Path. In Proceedings of the IEEE International Conference on Computational Science and Engineering (CSE) and IEEE International Conference on Embedded and Ubiquitous Computing (EUC), Guangzhou, China, 21–24 July 2017. [Google Scholar]
- Özcan, U.; Arslan, A.; İlkyaz, M.; Karaarslan, E. An augmented reality application for smart campus urbanization: MSKU campus prototype. In Proceedings of the 5th International Istanbul Smart Grid and Cities Congress and Fair (ICSG), Istanbul, Turkey, 19–21 April 2017. [Google Scholar]
- Sutjarittham, T.; Habibi Gharakheili, H.; Kanhere, S.S.; Sivaraman, V. Data-Driven Monitoring and Optimization of Classroom Usage in a Smart Campus. In Proceedings of the 17th ACM/IEEE International Conference on Information Processing in Sensor Networks (IPSN), Porto, Portugal, 11–13 April 2018. [Google Scholar]
- Liang, T.; Tsai, C. Application of Intelligent Monitoring System in Campus Greenhouse. In Proceedings of the International Conference on Information, Communication and Engineering (ICICE), Xiamen, China, 17–20 November 2017. [Google Scholar]
- Lu, J.; Xu, X.; Li, X.; Li, L.; Chang, C.-C.; Feng, X.; Zhang, S. Detection of Bird’s Nest in High Power Lines in the Vicinity of Remote Campus Based on Combination Features and Cascade Classifier. IEEE Access 2018, 6, 39063–39071. [Google Scholar] [CrossRef]
- Liang, Y.; Chen, Z. Intelligent and Real-Time Data Acquisition for Medical Monitoring in Smart Campus. IEEE Access 2018, 6, 74836–74846. [Google Scholar] [CrossRef]
- Gjoreski, M.; Gjoreski, H.; Lutrek, M.; Gams, M. Automatic Detection of Perceived Stress in Campus Students Using Smartphones. In Proceedings of the International Conference on Intelligent Environments, Prague, Czech Republic, 15–17 July 2015. [Google Scholar]
- Pérez, L.E.; Pardiñas-Mir, J.A.; Guerra, O.; de la Mora, J.; Pimienta, M.; Hernández, N.; de Atocha Lopez, M. A wireless sensor network system: For monitoring trees’ health related parameters in a university campus. In Proceedings of the 12th International Joint Conference on e-Business and Telecommunications (ICETE), Colmar, France, 20–22 July 2015. [Google Scholar]
- Popoola, S.I.; Atayero, A.A.; Popoola, O.A. Comparative assessment of data obtained using empirical models for path loss predictions in a university campus environment. Data Brief 2018, 18, 380–393. [Google Scholar] [CrossRef]
- Popoola, S.I.; Atayero, A.A.; Arausi, O.D.; Matthews, V.O. Path loss dataset for modeling radio wave propagation in smart campus environment. Data Brief 2018, 17, 1062–1073. [Google Scholar] [CrossRef]
- Karttunen, A.; Molisch, A.F.; Hur, S.; Park, J.; Zhang, C.J. Spatially Consistent Street-by-Street Path Loss Model for 28-GHz Channels in Micro Cell Urban Environments. IEEE Trans. Wirel. Commun. 2017, 16, 7538–7550. [Google Scholar] [CrossRef]
- Fuschini, F.; El-Sallabi, H.; Degli-Esposti, V.; Vuokko, L.; Guiducci, D.; Vainikainen, P. Analysis of Multipath Propagation in Urban Environment Through Multidimensional Measurements and Advanced Ray Tracing Simulation. IEEE Trans. Antennas Propag. 2008, 56, 848–857. [Google Scholar] [CrossRef]
- Mani, F.; Oestges, C. A Ray Based Method to Evaluate Scattering by Vegetation Elements. IEEE Trans. Antennas Propag. 2012, 60, 4006–4009. [Google Scholar] [CrossRef]
- Chio, C.H.; Pang, C.K.; Ting, S.W.; Tam, K.W. Field prediction in urban environment using ray tracing. In Proceedings of the 2013 IEEE Antennas and Propagation Society International Symposium (APSURSI), Orlando, FL, USA, 7–13 July 2013; pp. 1926–1927. [Google Scholar]
- Un, L.K.; Chio, C.; Ting, S. Mobile communication site planning in campus using ray tracing. In Proceedings of the 2014 IEEE Antennas and Propagation Society International Symposium (APSURSI), Memphis, TN, USA, 6–11 July 2014; pp. 959–960. [Google Scholar]
- Thirumaraiselvan, P.; Jayashri, S. Modeling of Wi-Fi signal propagation under tree canopy in a college campus. In Proceedings of the 2016 International Conference on Communication and Signal Processing (ICCSP), Melmaruvathur, India, 24 November 2016; pp. 2273–2277. [Google Scholar]
- Wei, S.; Ai, B.; He, D.; Guan, K.; Wang, L.; Zhong, Z. Calibration of ray-tracing simulator for millimeter-wave outdoor communications. In Proceedings of the 2017 IEEE International Symposium on Antennas and Propagation & USNC/URSI National Radio Science Meeting, San Diego, CA, USA, 9–14 July 2017; pp. 1907–1908. [Google Scholar]
- Fathurrahman, S.Z.; Rahardjo, E.T. Coverage of Radio Wave Propagation at UI Campus Surrounding Using Ray Tracing and Physical Optics Near to Far Field Method. In Proceedings of the TENCON 2018—IEEE Region 10 Conference, Jeju, Korea, 28–31 October 2018; pp. 1123–1126. [Google Scholar]
- UN Sustainable Development Goals. Available online: https://sustainabledevelopment.un.org/ (accessed on 14 July 2019).
- RHF0M301 LoRaWAN Module Datasheet. Available online: https://www.robotshop.com/media/files/pdf/915mhz-lora-gateway-raspberry-pi-hat-datasheet1.pdf (accessed on 31 March 2019).
- LoRaWAN Module RHF76-052 Datasheet. Available online: https://fccid.io/2AJUZ76052/User-Manual/Users-Manual-3211050.pdf (accessed on 31 March 2019).
- Azpilicueta, L.; Rawat, M.; Rawat, K.; Ghannouchi, F.; Falcone, F. Convergence Analysis in Deterministic 3D Ray Launching Radio Channel Estimation in Complex Environments. ACES J. 2014, 29, 256–271. [Google Scholar]
- Azpilicueta, L.; Lopez-Iturri, P.; Aguirre, E.; Vargas-Rosales, C.; León, A.; Falcone, F. Influence of Meshing Adaption in Convergence Performance of Deterministic Ray Launching Estimation in Indoor Scenarios. J. Electromagn. Waves Appl. 2017, 31, 544–559. [Google Scholar] [CrossRef]
- Ettus Research USRP B210. Available online: https://www.ettus.com/product/details/UB210-KIT (accessed on 31 March 2019).
- Allen, K.C.; DeMinco, N.; Hoffman, J.R.; Lo, Y.; Papazian, P.B. Building Penetration Loss Measurements at 900 MHz, 11.4 GHz, and 28.8 GHz; NTIA Report 94-306; U.S. Department of Commerce: Washington, DC, USA, 1994.


| Technology | Operating Frequency | Modulation | Maximum Range | Speed | Max. Payload | Bandwidth | Main Characteristics |
|---|---|---|---|---|---|---|---|
| NB-IoT | LTE in-band, guard-band | QPSK | <35 km | <250 kbit/s | 1500 bytes | 180 kHz | Low power and wide-area coverage |
| SigFox | 868–902 MHz | DBPSK | 50 km | 100 kbit/s | 12 bytes | 0.1 kHz | Global cellular network |
| LoRa, LoRaWAN | Diverse UHF ISM (Industrial, Scientific, Medical) bands (e.g., 863–870 MHz and 433 MHz in Europe) | CSS | <15 km | –50 kbit/s | 51–222 bytes | 125 kHz | Low power and wide range |
| Smart Campus | Area | Access Technology | Sensors and Actuators | IoT Hardware Platform | Software Platform | Use Cases | Fog Computing Capabilities | Network Planning | Sustainable Development Goals (SDGs) [107], KPIs or Results |
|---|---|---|---|---|---|---|---|---|---|
| School of STEM, University of Washington Bothell (United States) [41] | - | Zigbee, BLE, 6LowPAN | Sensor Tag 2.0 (accelerometer, magnetometer, gyroscope, light, humidity object and ambient temperature, microphone) | COTS hardware, Arduino | AWS, Microsoft Azure cloud services | - | No | No | Built in 3 months, it includes monthly cloud service bill |
| QA Higher Education (QAHE), University of Business and Technology, Birmingham (United Kingdom) [42] | - | - | NFC and RFID tags, QR codes | Wearables | Cisco Physical Access Control technology | Learning applications, access control systems | No | No | Deliver high quality services, protect the environment, and save costs |
| Tennessee State University, Nashville (United States) [43] | - | - | - | - | - | Survey on intelligent buildings, smart grid, learning environment, waste and water management and other applications | No | No | - |
| Northwestern Polytechnical University (China) [44] | - | Wi-Fi, Bluetooth | Built-in smartphone sensors | - | Android 2.1 platform, Big Data techniques and SOA | Where2Study, I-Sensing (participatory sensing), BlueShare (media sharing application) | No | No | - |
| Birmingham City University (United Kingdom) [45] | Two campuses of circa 18,000 and 24,000 m, respectively | - | - | - | Microsoft’s BizTalk Server as ESB, SOA | Business systems, smart buildings | No | No | Cost savings; improved energy rating from F to B; 40% reduction in CO emissions |
| IMDEA Networks Institute (Spain) [46] | - | Wi-Fi, Bluetooth | - | - | Mobility model | Opportunistic Floating Content (FC) communication paradigm | No | Performance of the service in terms of content persistence, availability and efficiency | |
| University of Oradea (Romania) [47] | - | 4G, Zigbee | - | RFID labels, mobile devices, sensor equipment | Private/public cloud with steganography | No. Only architecture design | No | No | - |
| [51] | - | - | - | Edge computing devices | Network model and bandwidth allocation scheme for mobile users | Trustworthy content caching | Edge caching reverse auction game and bandwidth allocation for multiple contents in Mobile Social Networks | No | Resource efficiency |
| [52] | - | MESH Wi-Fi | Environmental sensors, IP cameras, emergency buttons | - | Neural network learning algorithms | Street lighting | Edge Computing | No | Workload prediction accuracy, resource management dashboard |
| WiCloud [53] | - | Wi-Fi | - | Servers, mobile phone base stations or wireless access points | Network Functions Virtualization (NFV), Software-Defined Network (SDN) | Semantic information analysis, smart class | Mobile Edge Computing paradigm | No | Historical data |
| WiP [54] | - | 3G/4G/5G, Wi-Fi | Smartcam, smart cards, light and temperature sensor, smartphone, tablet, smartwatch | - | - | Energy consumption savings, virtual support to students, augmented reality for museum collections | Yes | No | - |
| Smart CEI Moncloa, Universidad Politécnica de Madrid (Spain) [56] | 5.5 km, 144 buildings, daily flow up to 120,000 people | Wi-Fi, Ethernet | Smart Citizen Kit (SCK) | Raspberry Pi, Arduino | Cloud, SOA paradigm | Smart emergency management and traffic restriction | No | No | Dashboard with historical data |
| West Texas A&M University (United States) [66] | 176 acres (0.71 km) campus that connects 42 buildings and a 2393 acres (9.68 km) working ranch | LoRAWAN, 4G/LTE | Temperature, air pressure, relative humidity and partial concentrations | Arduino | NIST Cybersecurity Framework, standards such as COBIT and ISO | Connect cattle across the feed yard; monitor environmental conditions for network equipment; campus-wide environmental monitoring system; water irrigation; smart parking (GPS data, 800 video surveillance cameras and OpenCV-based) | No | No | - |
| Sapienza smart campus, University of Rome (Italy) [68] | - | N/A | N/A | N/A | Theoretical and methodological framework | Living, economy, energy, environment and mobility | No | No | Set of smart campus indicators and incidence matrix |
| Wuhan University of Technology (China) [69] | - | Cable, wireless, 3G/4G | Perception layer with RFID, cameras and sensors | - | Framework design, cloud computing and virtualization (Oracle 10G RAC) | Learning and living | No | No | - |
| Wisdom Campus, Soochow University (China) [71] | 4058 acres (16.42 km), 5263 staff and more than 50,000 people | - | - | - | - | Automatic vehicle access systems, parking guidance service, bus tracking system and bicycle rental service | No | No | - |
| IISc campus [82] | 2 km × 1 km | sub-GHz radios | Low-cost ultrasonic water level sensors, solar panels | Microcontroller TI MSP432P401R | - | Water management | No | No | RSSI and Packet Error Rate (PER) performance, power budget |
| Ottawa City and APEC campus [104] | - | Wi-Fi | - | - | - | - | No | RT approach | Measurements and predictions of Path Loss |
| Universitas Indonesia [106] | Urban area | 800 MHz, 2.3 GHz, and 38 GHz | - | - | RT simulators for millimeter-wave propagation analyses based on the measured results in a university campus | - | No | RT approach and physical optic near-to-far field methods | Path Loss models |
| University of A Coruña (This work) | 26,000 m | LoRaWAN | - | IoT nodes and SBCs (Raspberry Pi 3) | Simulations | Scalable architecture for multiple outdoor use cases | Yes | Yes (3D RL) | Planning simulator and empirical validation |
| Parameter | Value |
|---|---|
| Operation frequency | 868.3 MHz |
| Output power level | 14 dBm |
| Permitted reflections | 6 |
| Cuboid resolution | 4 m × 4 m × 2 m |
| Launched ray resolution | 1° |
| Antenna type and gain | Monopole, 0 dBi |
| LoRaWAN Device | Sensitivity |
|---|---|
| Seeeduino LoRaWAN | −137 dBm |
| Seeeduino LoRa/GPS Shield for Arduino with LoRa BEE | −148 dBm |
| Dragino LoRa Shield | −148 dBm |
| Grove—LoRa Radio | −148 dBm |
| DF Robot’s LoRa MESH Radio Module | −148 dBm |
| Arduino MKR WAN 1300 | −135.5 dBm |
| Adafruit RFM95W LoRa Radio Transceiver | −148 dBm |
| Adafruit Feather 32u4 RFM95 LoRa Radio | −148 dBm |
| Microchip LoRa Mote RN2483 | −148 dBm |
| The Things Network TTN-UN-868 | −148 dBm |
| The Things Network TTN-ND-868 | −148 dBm |
© 2019 by the authors. Licensee MDPI, Basel, Switzerland. This article is an open access article distributed under the terms and conditions of the Creative Commons Attribution (CC BY) license (http://creativecommons.org/licenses/by/4.0/).
Share and Cite
Fraga-Lamas, P.; Celaya-Echarri, M.; Lopez-Iturri, P.; Castedo, L.; Azpilicueta, L.; Aguirre, E.; Suárez-Albela, M.; Falcone, F.; Fernández-Caramés, T.M. Design and Experimental Validation of a LoRaWAN Fog Computing Based Architecture for IoT Enabled Smart Campus Applications. Sensors 2019, 19, 3287. https://doi.org/10.3390/s19153287
Fraga-Lamas P, Celaya-Echarri M, Lopez-Iturri P, Castedo L, Azpilicueta L, Aguirre E, Suárez-Albela M, Falcone F, Fernández-Caramés TM. Design and Experimental Validation of a LoRaWAN Fog Computing Based Architecture for IoT Enabled Smart Campus Applications. Sensors. 2019; 19(15):3287. https://doi.org/10.3390/s19153287
Chicago/Turabian StyleFraga-Lamas, Paula, Mikel Celaya-Echarri, Peio Lopez-Iturri, Luis Castedo, Leyre Azpilicueta, Erik Aguirre, Manuel Suárez-Albela, Francisco Falcone, and Tiago M. Fernández-Caramés. 2019. "Design and Experimental Validation of a LoRaWAN Fog Computing Based Architecture for IoT Enabled Smart Campus Applications" Sensors 19, no. 15: 3287. https://doi.org/10.3390/s19153287