Deep ECG-Respiration Network (DeepER Net) for Recognizing Mental Stress

Abstract
:1. Introduction
2. Related Works
2.1. Machine Learning Approaches
2.2. Deep Learning Approaches
3. Methods
3.1. Subjects
3.2. Experiments
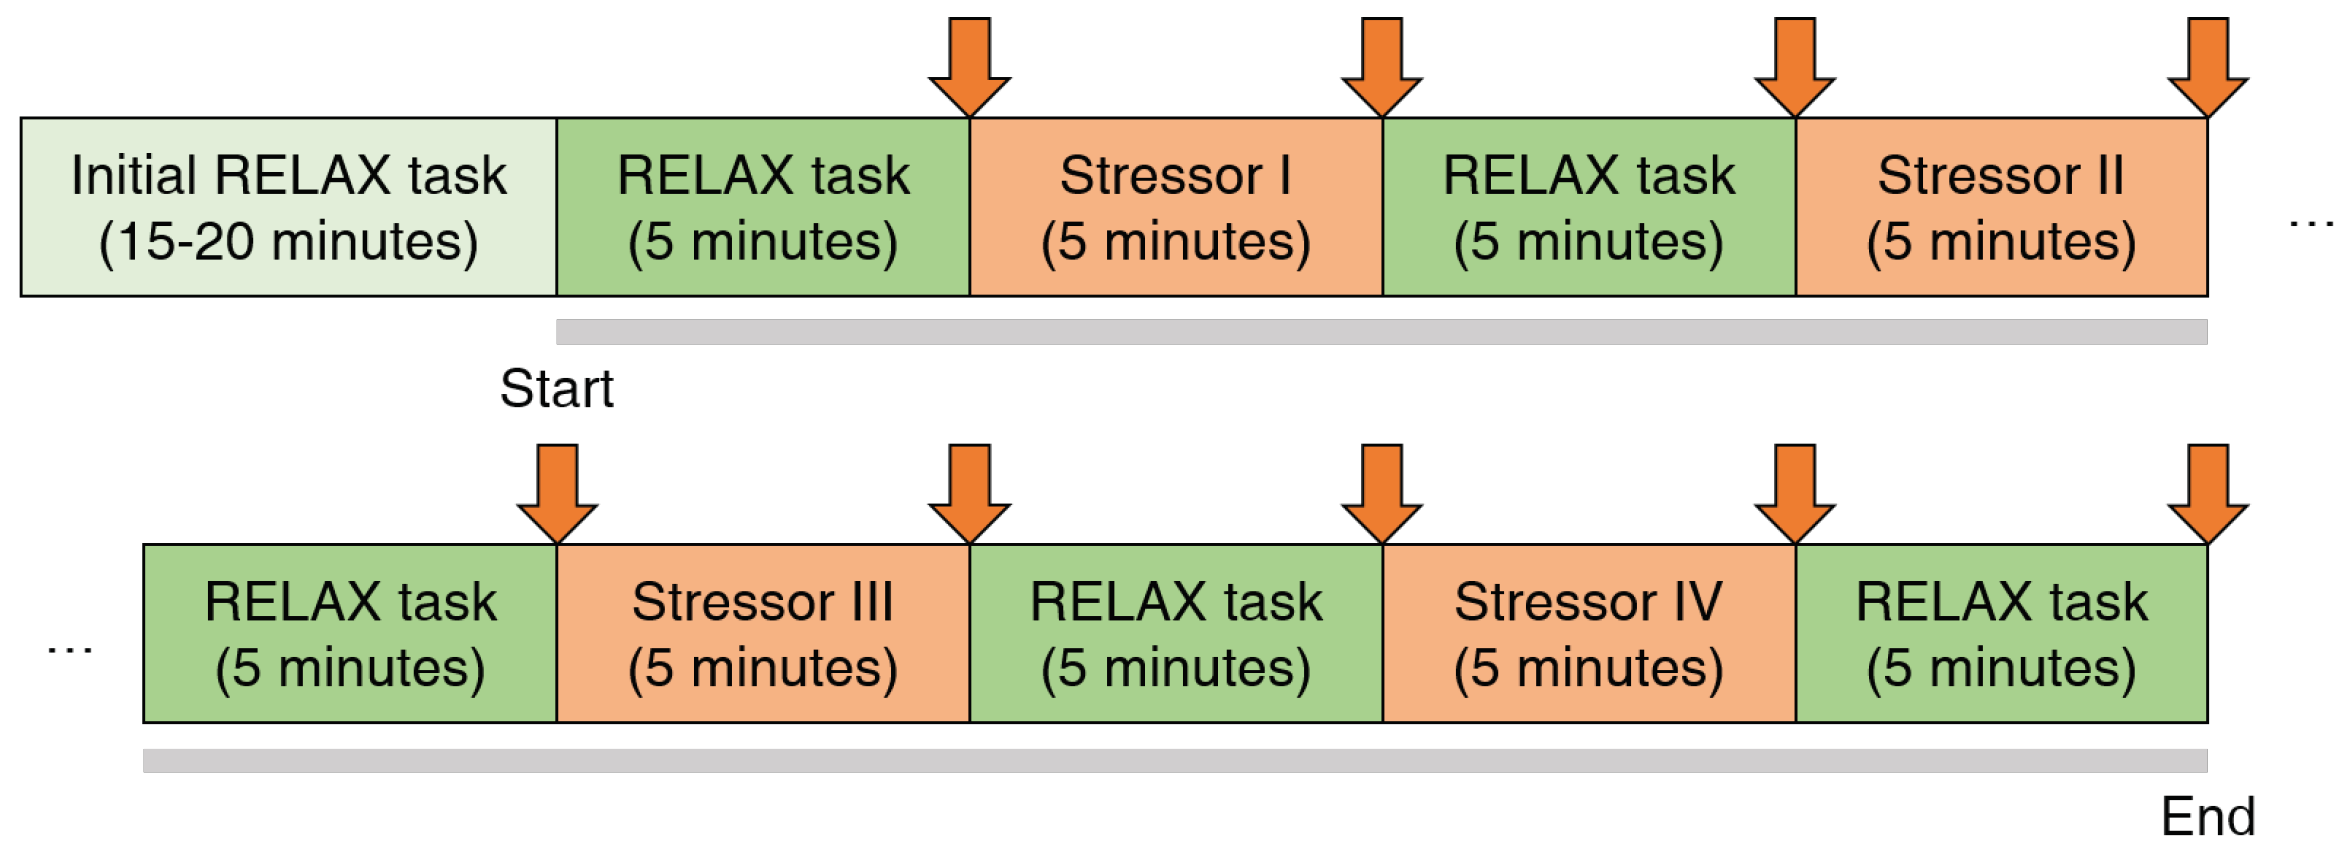
3.2.1. Protocol
3.2.2. Experimental Setup
3.2.3. Data Preprocessing
3.3. Machine Learning Approaches
3.4. Deep Learning Approaches
3.5. Metrics
4. Results
4.1. Performance
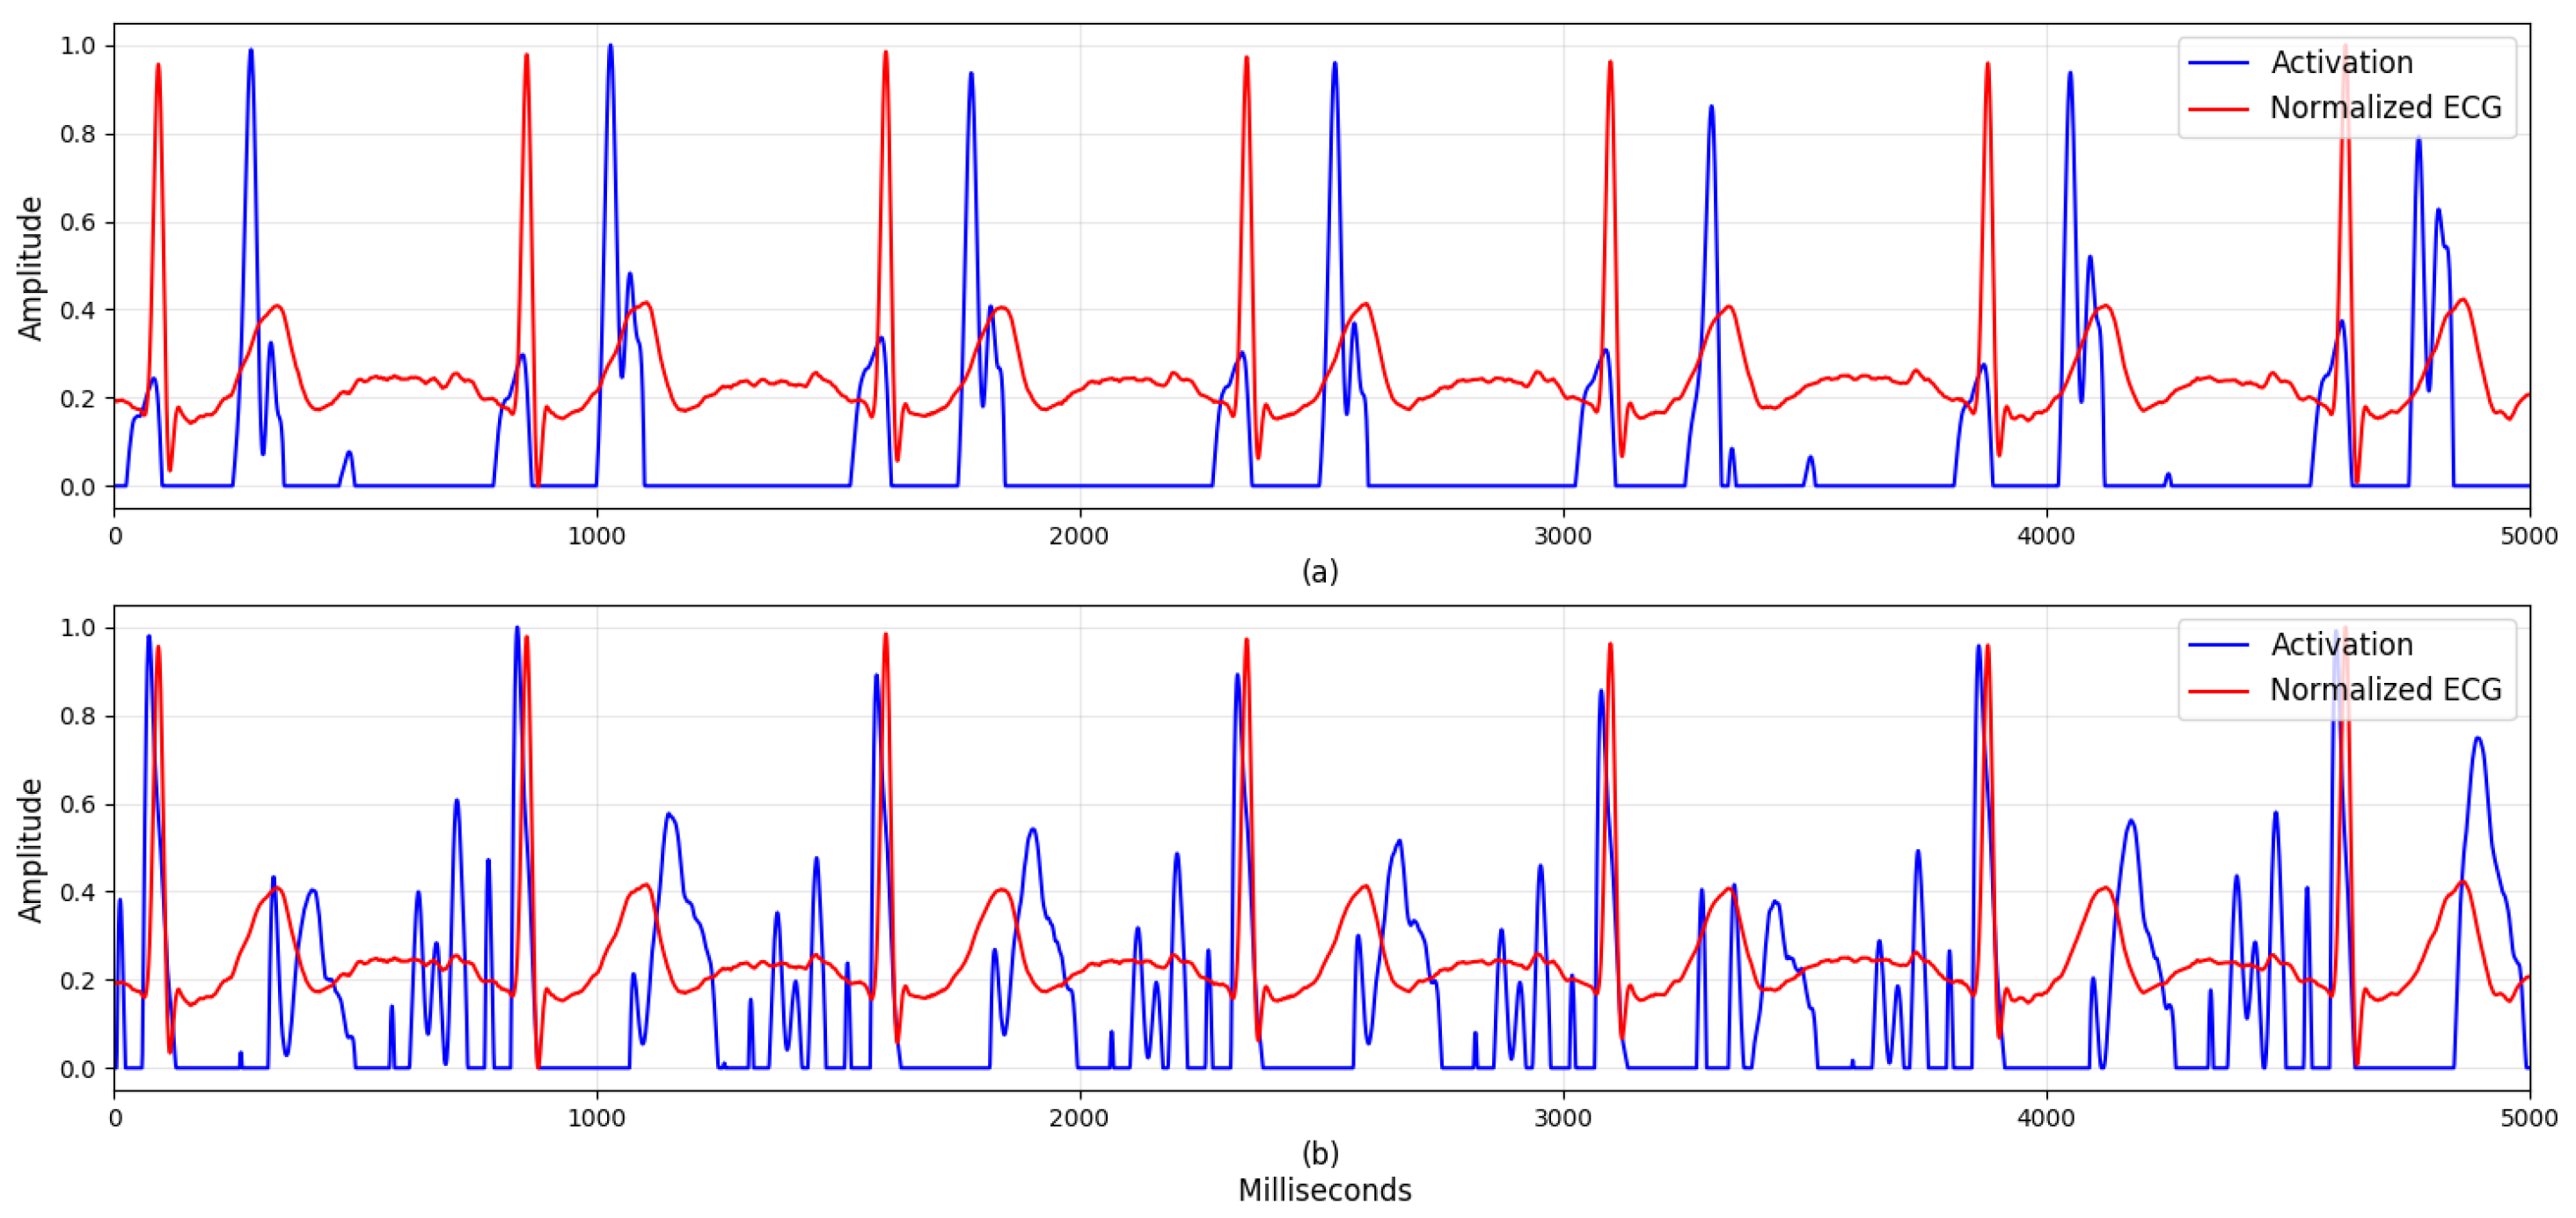
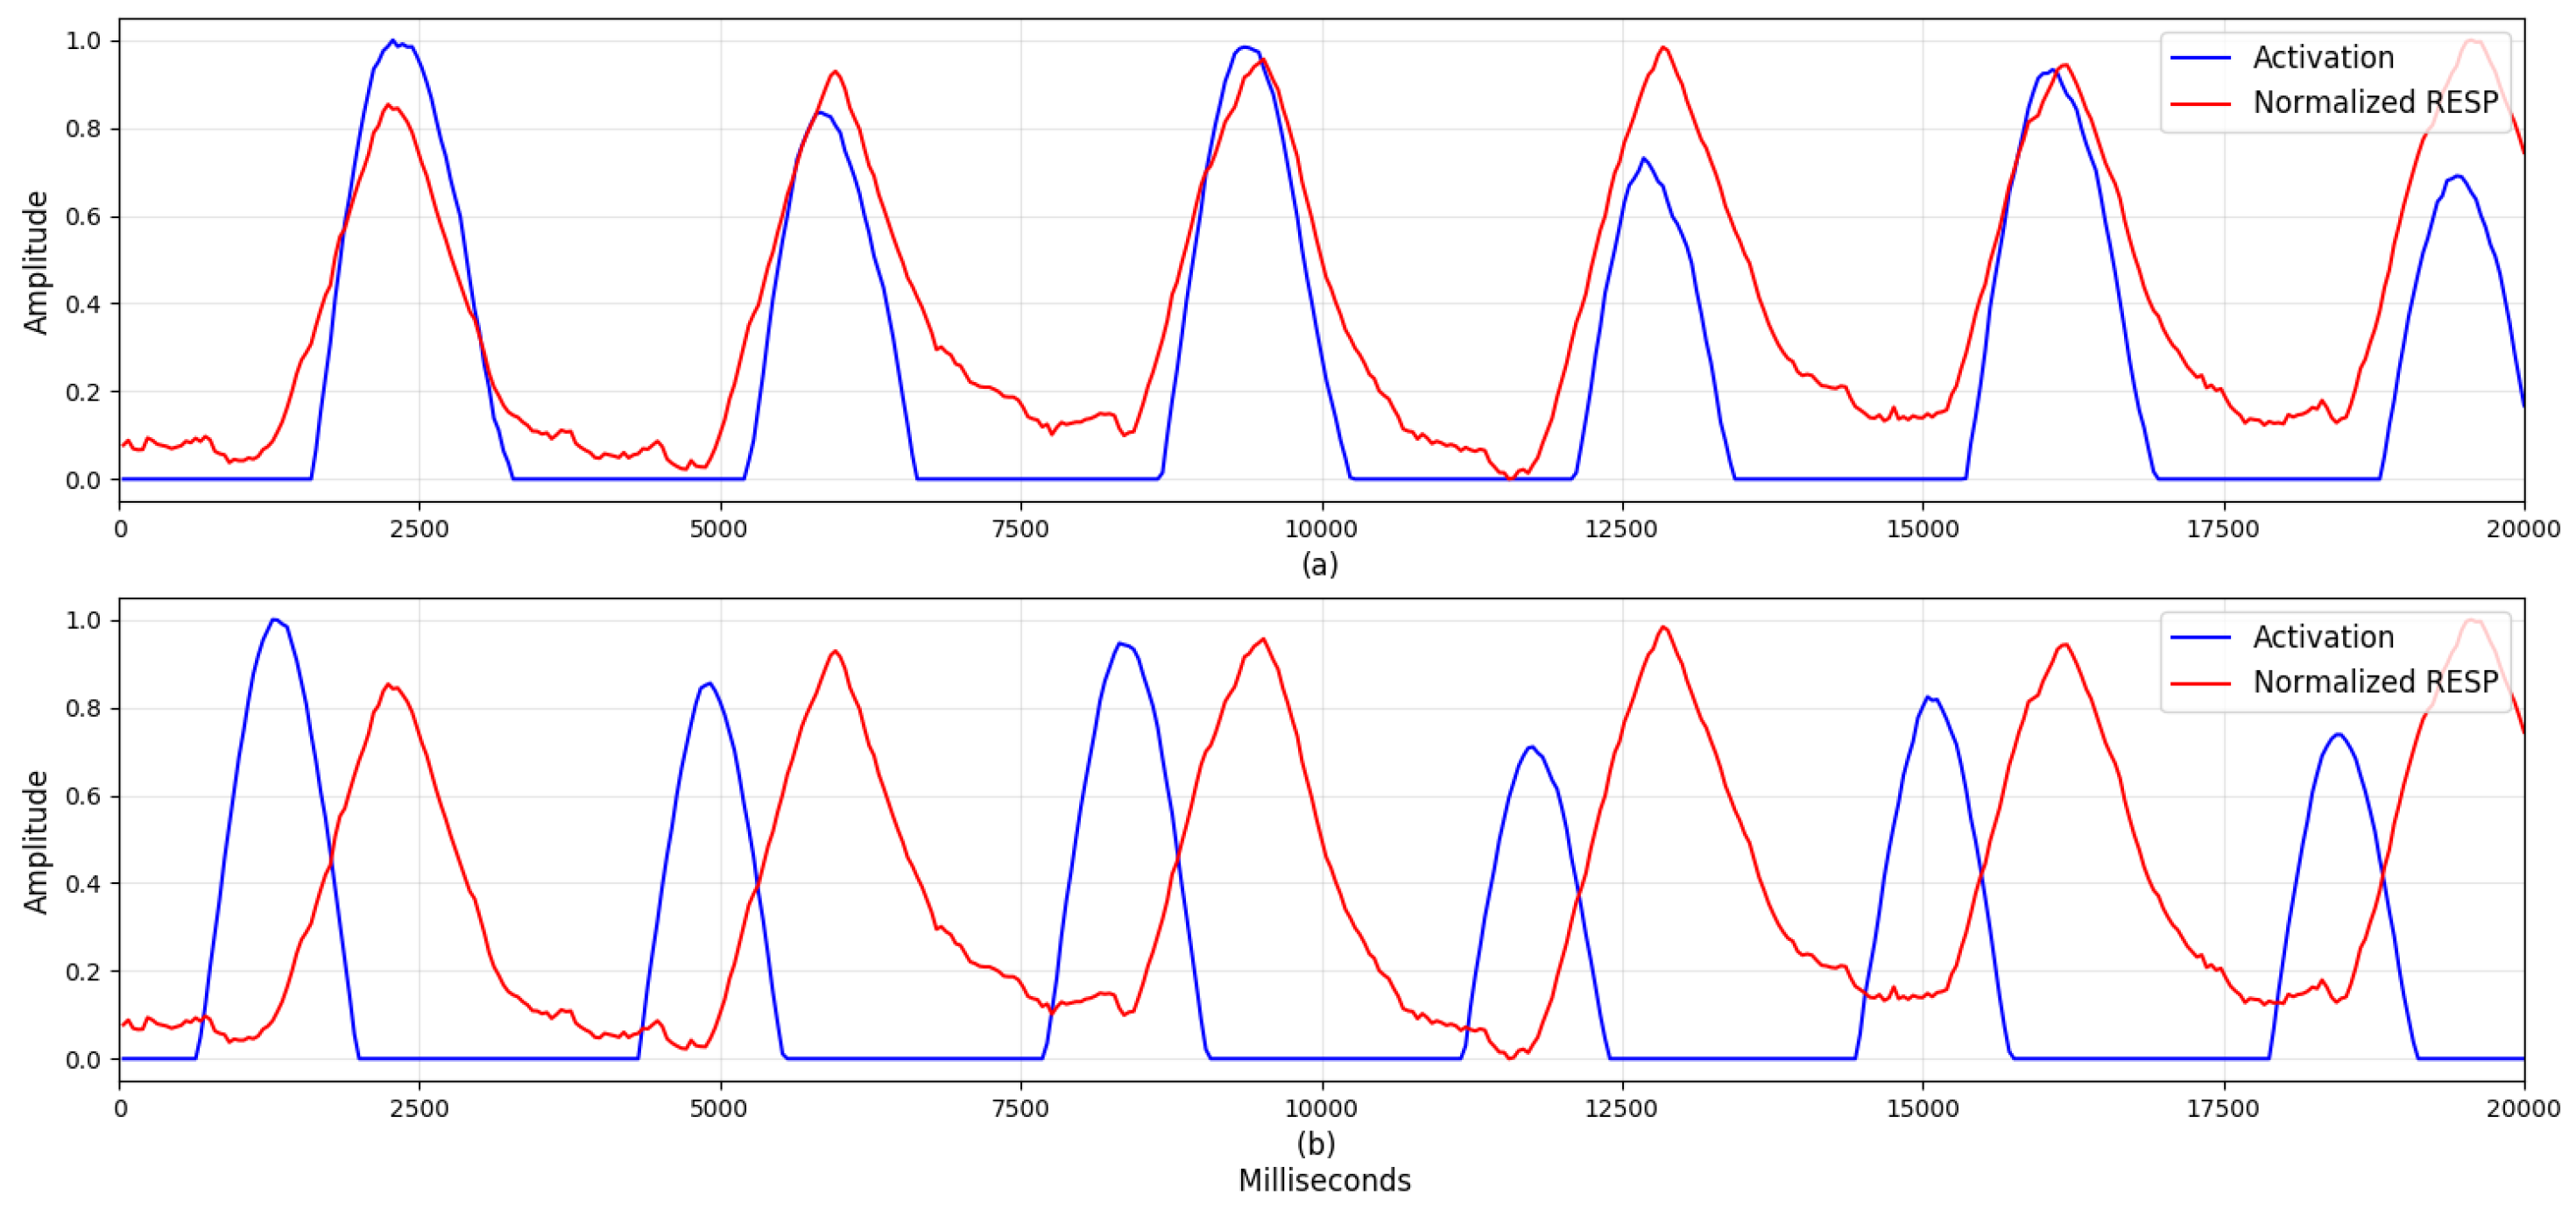
4.2. Visualization
5. Discussion
5.1. Visualization
5.2. Comparison with Previous Studies
5.3. Possibility of Personalized Models
5.4. Multiple Physiological Datasets
5.5. Limitations and Future Work
6. Conclusions
Supplementary Materials
Author Contributions
Funding
Conflicts of Interest
Ethical Statements
References
- Joyce, S.; Modini, M.; Christensen, H.; Mykletun, A.; Bryant, R.; Mitchell, P.B.; Harvey, S.B. Workplace interventions for common mental disorders: A systematic meta-review. Psychol. Med. 2016, 46, 683–697. [Google Scholar] [CrossRef] [PubMed]
- Hajera, S.; Ali, M.M. A Comparative analysis of psychological stress detection methods. IJCEM 2018, 21, 1–8. [Google Scholar]
- Elzeiny, S.; Qaraqe, M. Machine learning approaches to automatic stress detection: A review. In Proceedings of the 2018 IEEE/ACS 15th International Conference on Computer Systems and Applications (AICCSA), Aqaba, Jordan, 28 October–1 November 2018; pp. 1–6. [Google Scholar]
- Mozos, O.M.; Andrews, S.; Ferrandez, J.M.; Ellis, D.; Bellotto, N.; Sandulescu, V.; Dobrescu, R. Stress detection using wearable physiological and sociometric sensors. Int. J. Neural Syst. 2017, 27, 1650041. [Google Scholar] [CrossRef] [PubMed]
- He, J.; Li, K.; Liao, X.; Zhang, P.; Jiang, N. Real-time detection of acute cognitive stress using a convolutional neural network from electrocardiographic signal. IEEE Access 2019, 7, 42710–42717. [Google Scholar] [CrossRef]
- Reis, R.S.; Hino, A.A.; Añez, C.R. Perceived Stress Scale. J. Health Psychol. 2010, 15, 107–114. [Google Scholar] [CrossRef] [PubMed]
- Buysse, D.J.; Reynolds, C.F.; Monk, T.H.; Berman, S.R.; Kupfer, D.J. The Pittsburgh sleep quality index: A new instrument for psychiatric practice and research. Psychiatry Res. 1989, 28, 193–213. [Google Scholar] [CrossRef]
- Sriramprakash, S.; Prasanna, V.D.; Murthy, O.V.R. Stress detection in working people. Proc. Procedia Comput. Sci. 2017, 115, 359–366. [Google Scholar] [CrossRef]
- Cheon, D.; Choi, I.; Lee, J.; Moon, J.; Kye, S.; Lee, K. Multimodal data collection framework for mental stress monitoring. In Proceedings of the 2017 ACM International Joint Conference on Pervasive and Ubiquitous Computing and Wearable Computers, Maui, HI, USA, 11–15 September 2017. [Google Scholar]
- Healey, J.A.; Picard, R.W. Detecting stress during real-world driving tasks using physiological sensors. IEEE Trans. Intell. Transp. Syst. 2005, 6, 156–166. [Google Scholar] [CrossRef]
- Betti, S.; Lova, R.M.; Rovini, E.; Acerbi, G.; Santarelli, L.; Cabiati, M.; Del Ry, S.; Cavallo, F. Evaluation of an integrated system of wearable physiological sensors for stress monitoring in working environments by using biological markers. IEEE Trans. Biomed. Eng. 2017, 65, 1748–1758. [Google Scholar]
- Hwang, B.; You, J.; Vaessen, T.; Myin-Germeys, I.; Park, C.; Zhang, B.T. Deep ECGNet: An optimal deep learning framework for monitoring mental stress using ultra short-term ECG signals. Telemed. e-Health 2018, 24, 753–772. [Google Scholar] [CrossRef] [PubMed]
- Acharya, U.R.; Fujita, H.; Oh, S.L.; Hagiwara, Y.; Tan, J.H.; Adam, M. Application of deep convolutional neural network for automated detection of myocardial infarction using ECG signals. Inf. Sci. 2017, 415–416, 190–198. [Google Scholar] [CrossRef]
- Lecun, Y.; Bengio, Y.; Hinton, G. Deep learning. Nature 2015, 521, 436–444. [Google Scholar] [CrossRef] [PubMed]
- Cho, Y.; Bianchi-Berthouze, N.; Julier, S.J. DeepBreath: Deep learning of breathing patterns for automatic stress recognition using low-cost thermal imaging in unconstrained settings. In Proceedings of the 2017 7th International Conference on Affective Computing and Intelligent Interaction, ACII 2017, San Antonio, TX, USA, 23–26 October 2017. [Google Scholar]
- Ghaderi, A.; Frounchi, J.; Farnam, A. Machine learning-based signal processing using physiological signals for stress detection. In Proceedings of the 2015 22nd Iranian Conference on Biomedical Engineering (ICBME), Tehran, Iran, 25–27 November 2015; pp. 93–98. [Google Scholar]
- Salahuddin, L.; Cho, J.; Jeong, M.G.; Kim, D. Ultra short term analysis of heart rate variability for monitoring mental stress in mobile settings. In Proceedings of the Annual International Conference of the IEEE Engineering in Medicine and Biology, Lyon, France, 22–26 August 2007. [Google Scholar]
- Ciabattoni, L.; Ferracuti, F.; Longhi, S.; Pepa, L.; Romeo, L.; Verdini, F. Real-time mental stress detection based on smartwatch. In Proceedings of the 2017 IEEE International Conference on Consumer Electronics, ICCE 2017, Las Vegas, NV, USA, 8–11 January 2017. [Google Scholar]
- Wijsman, J.; Grundlehner, B.; Liu, H.; Penders, J.; Hermens, H. Wearable physiological sensors reflect mental stress state in office-like situations. In Proceedings of the 2013 Humaine Association Conference on Affective Computing and Intelligent Interaction, ACII 2013, Washington, DC, USA, 2–5 September 2013. [Google Scholar]
- Munla, N.; Khalil, M.; Shahin, A.; Mourad, A. Driver stress level detection using HRV analysis. In Proceedings of the 2015 International Conference on Advances in Biomedical Engineering, ICABME 2015, Beirut, Lebanon, 16–18 September 2015. [Google Scholar]
- Faust, O.; Hagiwara, Y.; Hong, T.J.; Lih, O.S.; Acharya, U.R. Deep learning for healthcare applications based on physiological signals: A review. Comput. Methods Programs Biomed. 2018, 161, 1–13. [Google Scholar] [CrossRef] [PubMed]
- Sherwood, L. Fundamentals of Physiology: A Human Perspective; Thomson Brooks/Cole Belmont: New York, NY, USA, 2006; Volume 380. [Google Scholar]
- Kingma, D.P.; Ba, J. Adam: A method for stochastic optimization. arXiv 2014, arXiv:1412.6980. [Google Scholar]
- Akobeng, A.K. Understanding diagnostic tests 3: Receiver operating characteristic curves. Acta Paediatr. 2007, 69, 644–647. [Google Scholar] [CrossRef] [PubMed]
- Liu, Y.; Du, S. Psychological stress level detection based on electrodermal activity. Behav. Brain Res. 2018, 341, 50–53. [Google Scholar] [CrossRef] [PubMed]


| Signal | Domain | Features | Description |
|---|---|---|---|
| ECG | Time | HR mean | Mean of heartrate |
| sdNN | Standard deviation of NN intervals | ||
| rmssd | Root mean square of successive difference of RR intervals | ||
| pNN50 | Percentage of differences between adjacent RR intervals that are greater than 50 ms | ||
| ECG | Frequency | VLF | Power of NN interval (0.00–0.04 Hz) |
| LF | Power of NN interval (0.04–0.15 Hz) | ||
| HF | Power of NN interval (0.15–0.40 Hz) | ||
| TF | Power of NN interval (0.14–0.40 Hz) | ||
| nLF | LF to (LF + HF) ratio | ||
| nHF | HF to (LF + HF) ratio | ||
| LF2HF | LF to HF ratio | ||
| RESP | Time | RMS | Square root of mean of squared RESP |
| IQR | Interquartile range of RESP | ||
| MDA | Square root of mean of squared differences between adjacent elements | ||
| RESP | Frequency | LF1 | Power of RESP (0.00–1.00 Hz) |
| LF2 | Power of RESP (1.00–2.00 Hz) | ||
| HF1 | Power of RESP (2.00–3.00 Hz) | ||
| HF2 | Power of RESP (3.00–4.00 Hz) | ||
| L2H | (LF1+LF2) to (HF1 + HF2) ratio |
| Task | Average Value |
|---|---|
| Relax | 0.24 |
| Easy math | 0.51 |
| Easy stroop | 0.61 |
| Hard math | 0.80 |
| Hard stroop | 0.52 |
| Task | Average Value |
|---|---|
| Easy math | 0.12 |
| Easy Stroop | 0.42 |
| Hard math | 0.55 |
| Hard Stroop | 0.32 |
| Model | Accuracy (%) | F1 Score | AUC |
|---|---|---|---|
| DeepER Net | 83.9 ± 2.3 | 0.81 ± 0.05 | 0.92 ± 0.01 |
| SVM | 61.7 ± 3.4 | 0.62 ± 0.04 | 0.68 ± 0.05 |
| RF | 71.8 ± 2.3 | 0.67 ± 0.04 | 0.80 ± 0.02 |
| KNN | 64.0 ± 3.2 | 0.60 ± 0.02 | 0.67 ± 0.04 |
| LR | 59.1 ± 2.5 | 0.55 ± 0.05 | 0.63 ± 0.04 |
| DT | 68.8 ± 1.6 | 0.66 ± 0.02 | 0.70 ± 0.02 |
| Models | Physiological Signal | Model | Accuracy |
|---|---|---|---|
| Hwang et al. [12] | ECG | CNN and LSTM | 80.7% |
| Cho et al. [15] | Thermal respiration images | CNN | 84.6% |
| He et al. [5] | Lomb Periodogram spectrum extracted from zero-one transformed NN intervals | CNN | 82.7% |
| Proposed DeepER Net | ECG and RESP | CNN and LSTM | 83.9% |
© 2019 by the authors. Licensee MDPI, Basel, Switzerland. This article is an open access article distributed under the terms and conditions of the Creative Commons Attribution (CC BY) license (http://creativecommons.org/licenses/by/4.0/).
Share and Cite
Seo, W.; Kim, N.; Kim, S.; Lee, C.; Park, S.-M. Deep ECG-Respiration Network (DeepER Net) for Recognizing Mental Stress. Sensors 2019, 19, 3021. https://doi.org/10.3390/s19133021
Seo W, Kim N, Kim S, Lee C, Park S-M. Deep ECG-Respiration Network (DeepER Net) for Recognizing Mental Stress. Sensors. 2019; 19(13):3021. https://doi.org/10.3390/s19133021
Chicago/Turabian StyleSeo, Wonju, Namho Kim, Sehyeon Kim, Chanhee Lee, and Sung-Min Park. 2019. "Deep ECG-Respiration Network (DeepER Net) for Recognizing Mental Stress" Sensors 19, no. 13: 3021. https://doi.org/10.3390/s19133021