An Appraisal of Lung Nodules Automatic Classification Algorithms for CT Images


Abstract
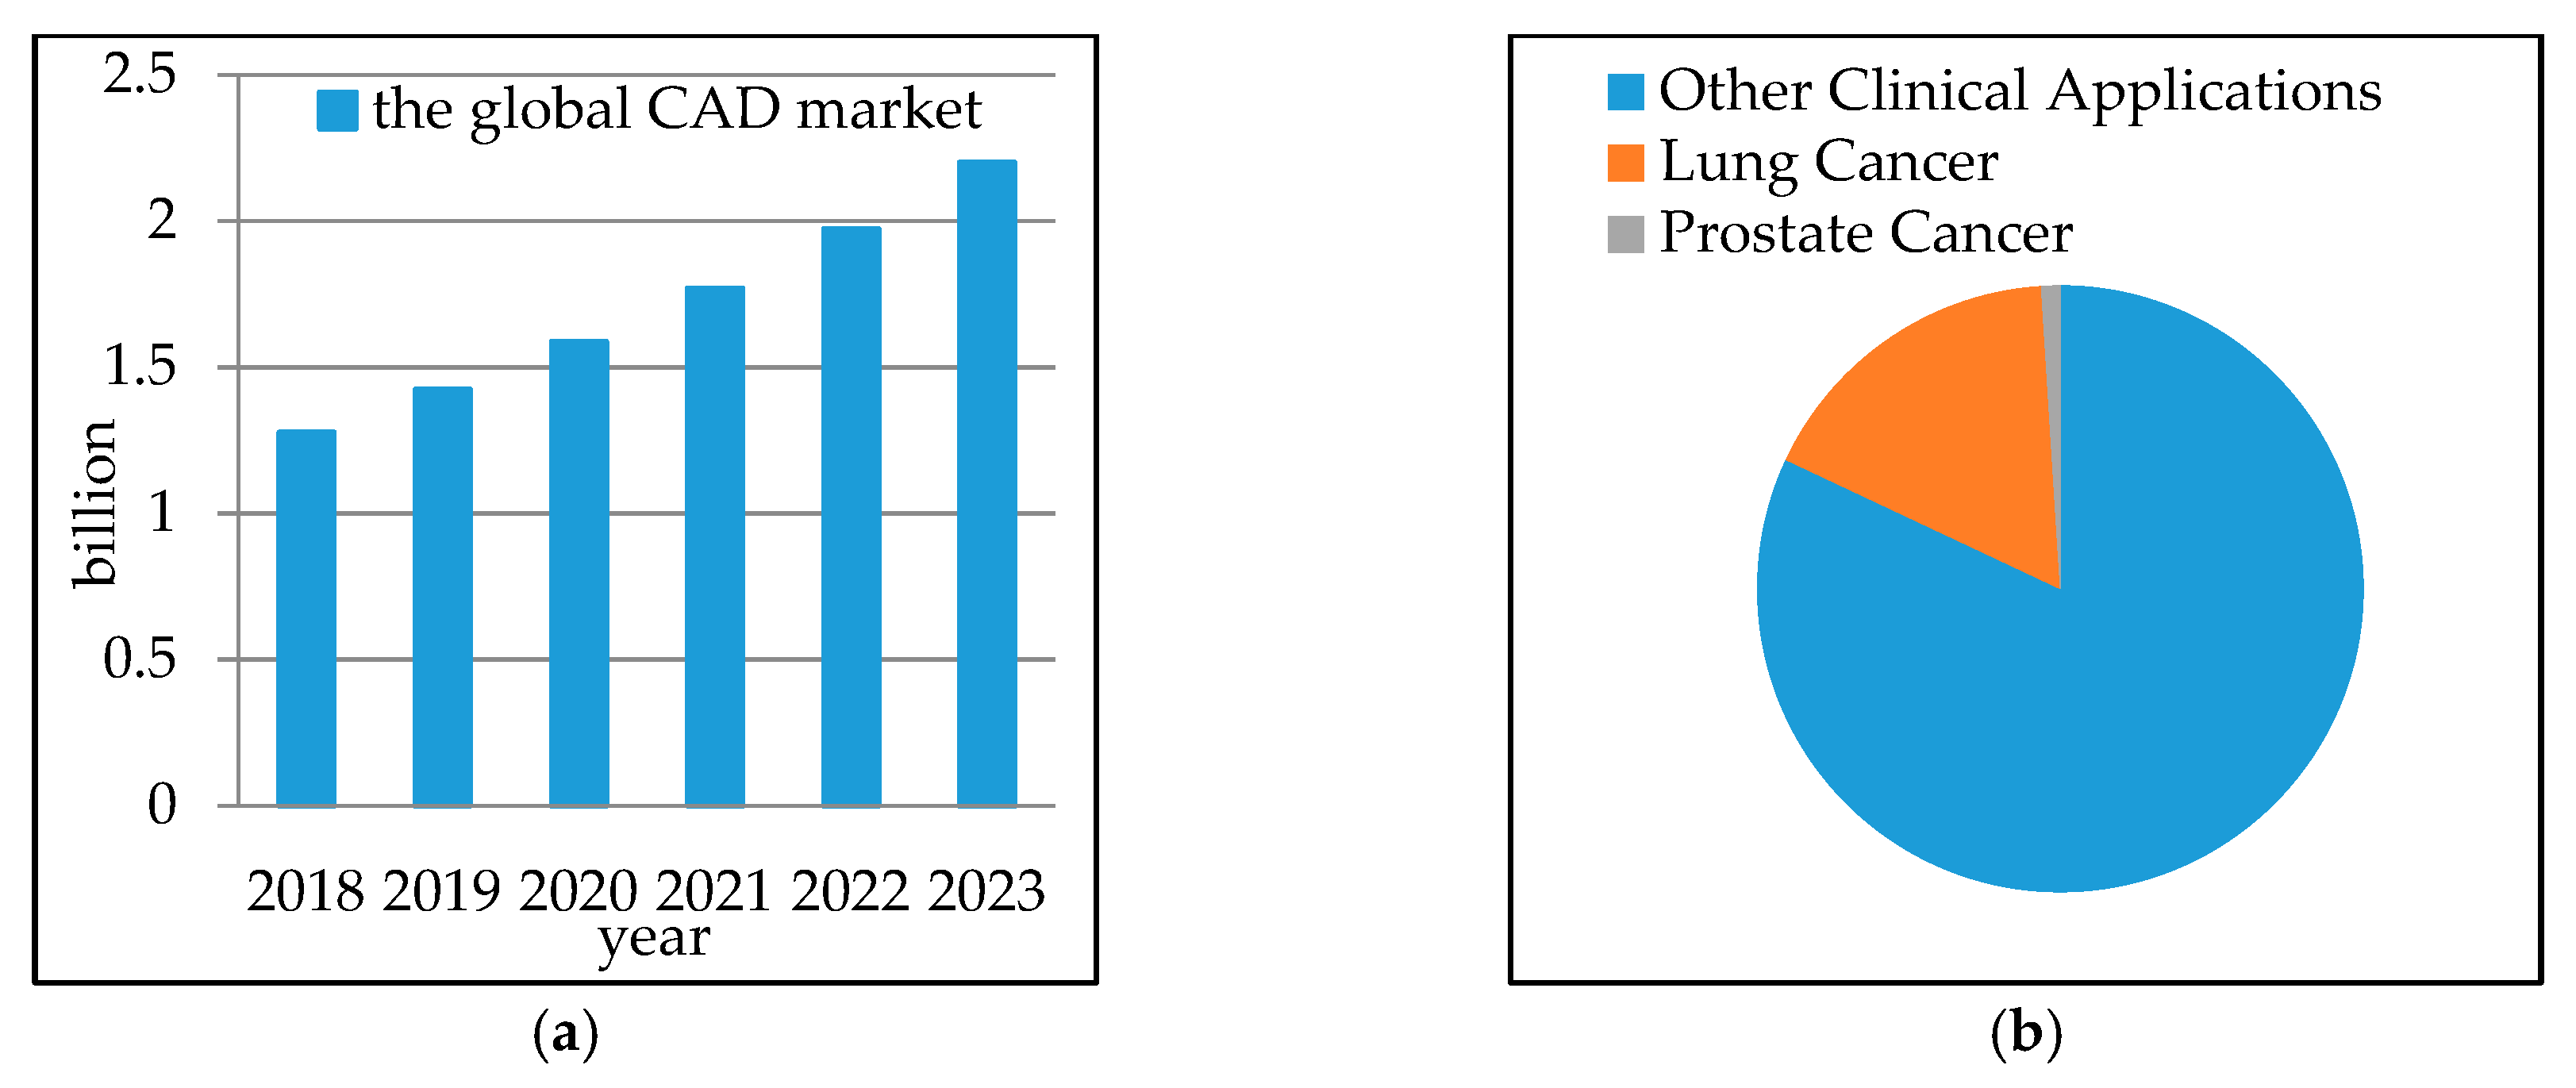
:1. Introduction
2. Work Selection Criteria
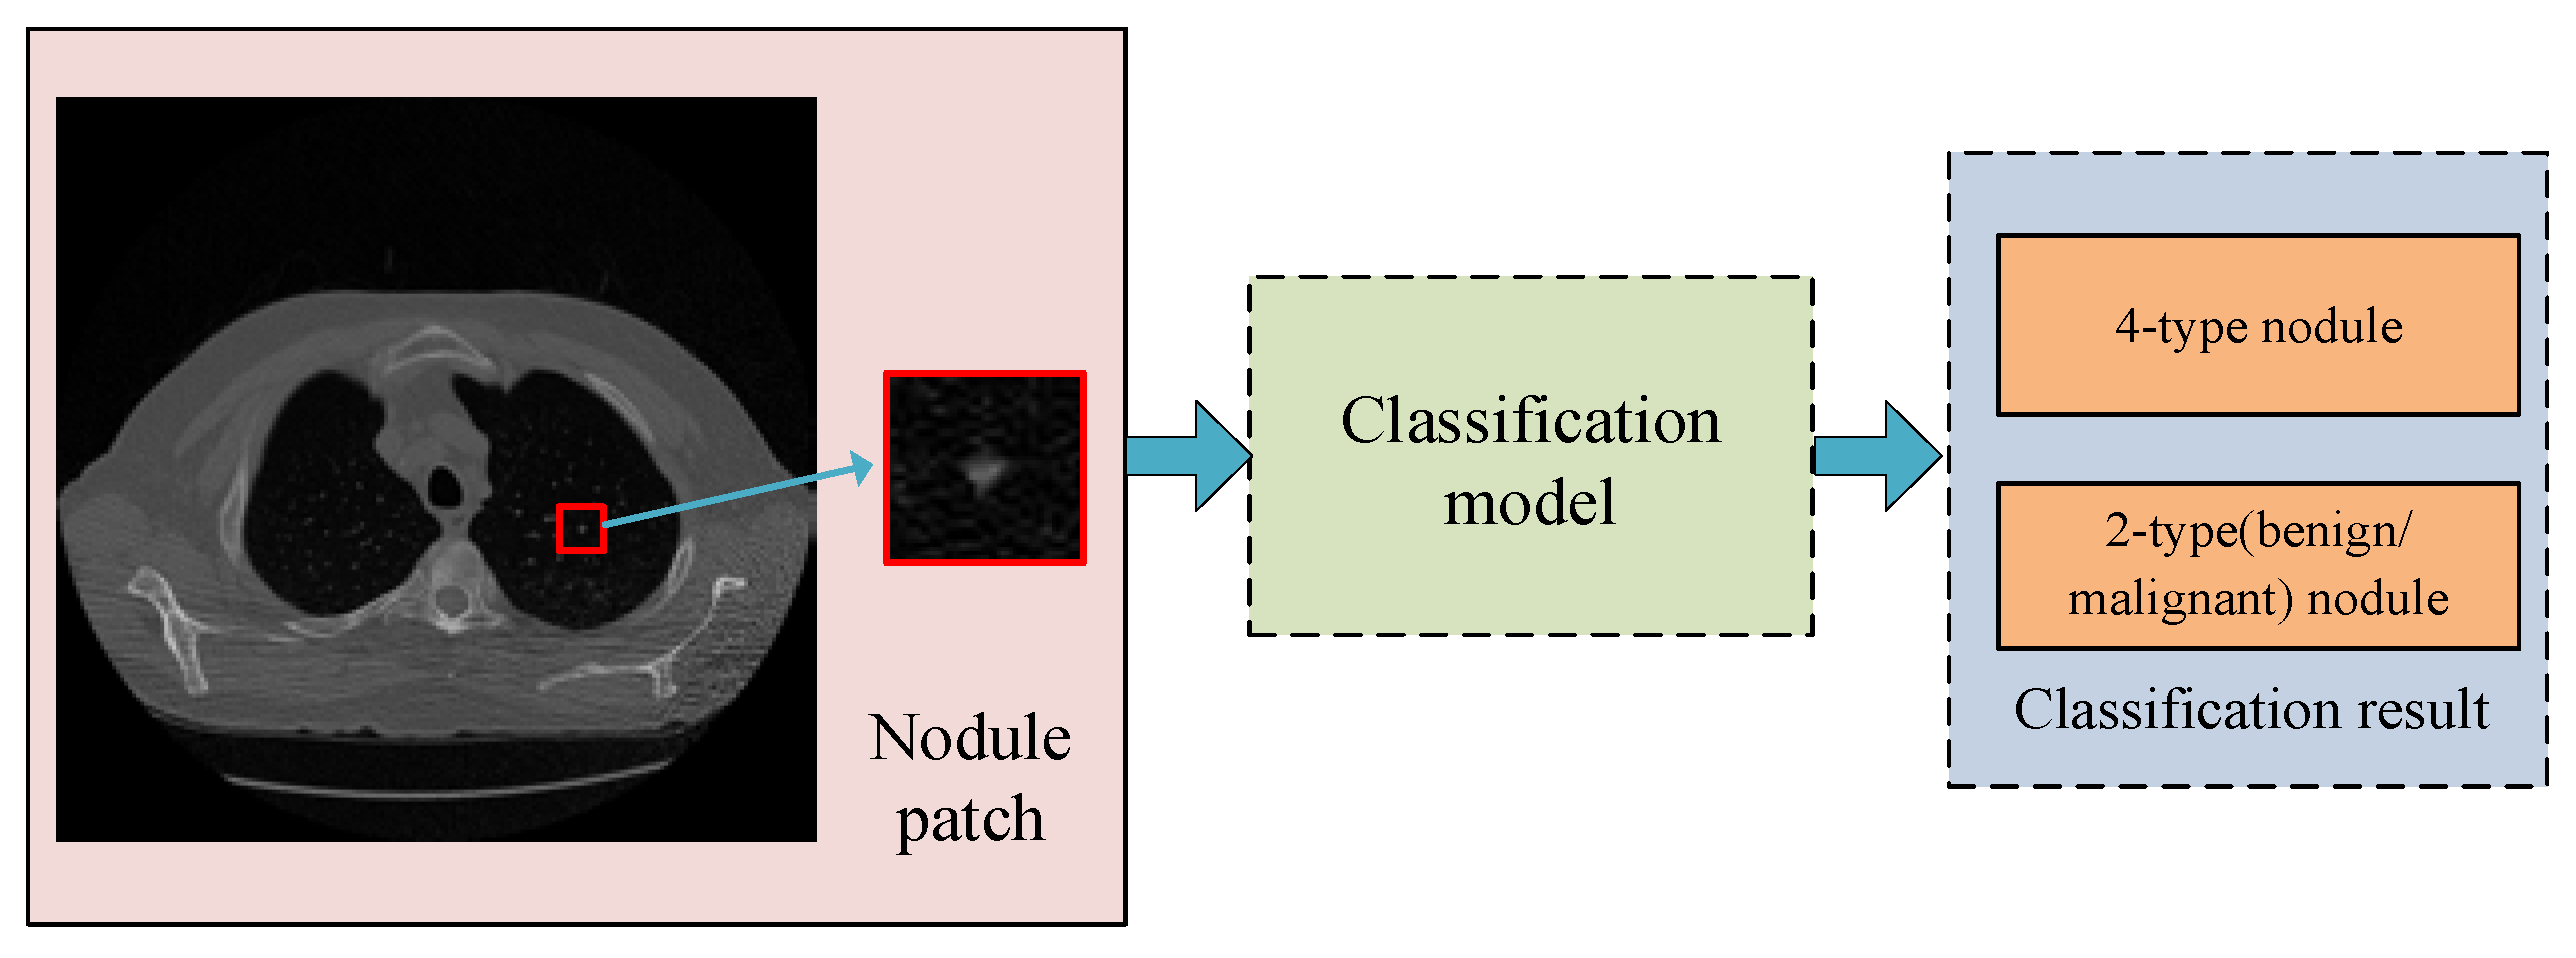
3. Nodule Classification Statements
3.1. Four-Type Nodule Classification
3.2. 2-Type Nodule Classification
4. Main Datasets
4.1. LIDC and LIDC-IDRI
4.2. ELCAP Public Lung Image Database
4.3. Others
5. Main Process Introduction
5.1. Feature Extractions and Selection
5.2. Classifier
5.3. Measurement
6. Analysis of Selected Work
6.1. User-Defined Features
6.2. Generic Features
6.3. Deep Features
6.4. 3D Image Based Features
6.5. Other Methods
6.6. Summarization
7. Discussion
7.1. Discussion on Classification Performance
7.2. Discussion on the Adopted Method
7.3. Discussion on Benchmark Datasets
7.4. Proposals for Future Research
- (i)
- Develop unified and open platform. Datasets can be shared and all researchers make studies under the same standard.
- (ii)
- Study together with lung nodule detection or other tasks. The accurate diagnosis requires comprehensive information. Future research studies should not only be based on local regions for classification, but also on the anatomical location of regions.
- (iii)
- Deal with noise and uncertain annotations. For example, malignant levels of nodules given in LIDC-IDRI did not reach a consensus. The number of uncertain samples is larger than the number of certain samples. Researchers should make effective use of these uncertain data to improve classification.
- (iv)
- Combine knowledge in the field of computer vision and data analysis. With the development of computer vision, it is important to relate these advanced algorithms with general medical image analysis.
- (v)
- Focus on research studies of transfer learning and unsupervised learning. Try to conduct deep network training by bypassing the requirement of large datasets.
- (vi)
- Fuse the guidance of professional doctors with deep feature. The interpretability of the classification model requires greater attention. It can provide in-depth understanding of disease for radiologists, which might be the ultimate objective.
- (vii)
- Mobile platform application. Design high-speed and automated method to decrease model complexity, training cost, and prediction time.
8. Conclusions
Author Contributions
Funding
Conflicts of Interest
References
- Siegel, R.L.; Miller, K.D.; Jemal, A. Cancer statistics. CA A Cancer J. Clin. 2017, 67, 7–30. [Google Scholar] [CrossRef]
- Chen, W.Q.; Zheng, R.S.; Baade, P.D.; Zhang, S.W.; Zeng, H.M.; Bray, F.; Jemal, A.; Yu, X.Q.; He, J. Cancer statistics in China. CA A Cancer J. Clin. 2015, 66, 115–132. [Google Scholar] [CrossRef]
- Rehman, M.Z.; Javaid, M.; Shah, S.I.A.; Gilani, S.O.; Jamil, M.; Butt, S.I. An appraisal of nodules detection techniques for lung cancer in CT images. Biomed. Signal Proc. Control 2018, 41, 140–151. [Google Scholar] [CrossRef]
- Kundel, H.L.; Revesz, G. Lesion conspicuity, tructured noise, and film reader error. Am. J. Roentgenol. 1976, 126, 1233–1238. [Google Scholar] [CrossRef]
- Berbaum, K.S.; Franken, E.A.; Dorfman, D.D.; Rooholamini, S.A.; Kathol, H.; Barloon, T.J.; Behlke, F.M.; Sato, Y.; Lu, C.H.; El-Khoury, G.Y. Satisfaction of search in diagnostic radiology. Investig. Radiol. 1990, 25, 133–140. [Google Scholar] [CrossRef]
- Renfrew, D.L.; Franken, E.A.; Berbaum, K.S.; Weigelt, F.H.; Abu-Yousef, M.M. Classification and lessons in 182 cases presented at a problem case conference. Radiology 1992, 183, 145–150. [Google Scholar] [CrossRef]
- Firmino, M. Computer-aided detection system for lung cancer in computed tomography scans: A review. Curr. Med. Imaging Rev. 2017, 13, 1–16. [Google Scholar] [CrossRef] [PubMed]
- Valente, I.R.S.; Cortez, P.C.; Neto, E.C.; Soares, J.M.; de Albuquerque, V.H.C.; Tavares, J.M.R.S. Automatic 3D pulmonary nodule detection in CT images. Comput. Methods Programs Biomed. 2016, 124, 91–107. [Google Scholar] [CrossRef] [PubMed]
- Gillies, R.J.; Kinahan, P.E.; Hricak, H. Radiomics: Images Are More than Pictures, They Are Data. Radiology 2016, 278, 563–577. [Google Scholar] [CrossRef] [PubMed]
- Global Computer-Aided Detection (CAD) Market US$ 2.2 Billion by 2023. Available online: https://www.ihealthcareanalyst.com/pre-screening-diagnostic-technology-adoption-computer-aided-detection-market/ (accessed on 11 January 2018).
- Diciotti, S.; Picozzi, G.; Falchini, M.; Mascalchi, M.; Villari, N.; Valli, G. 3-D Segmentation Algorithm of Small Lung Nodules in Spiral CT Images. Inf. Technol. Biomed. 2008, 12, 7–19. [Google Scholar] [CrossRef] [Green Version]
- ELCAP Public Lung Image Database. Available online: http://www.via.cornell.edu/databases/lungdb.html (accessed on 18 May 2018).
- Armato, S.G.; McLennan, G.; Bidaut, L.; McNitt-Gray, M.F.; Meyer, C.R.; Reeves, A.P.; Clarke, L.P. Data From LIDC-IDRI. The Cancer Imaging Archive. Available online: http://doi.org/10.7937/K9/TCIA.2015.LO9QL9SX (accessed on 20 May 2018).
- Tangaro, S.; Bellotti, R.; Decarlo, F.; Gargano, G.; Lattanzio, E.; Monno, P.; Massafra, R.; Delogu, P.; Fantacci, M.E.; Retico, A.; et al. MAGIC-5: An Italian mammographic database of digitised images for research. La Radiol. Med. 2008, 113, 477–485. [Google Scholar] [CrossRef]
- Armato, S.G., III; McLennan, G.; Bidaut, L.; McNitt-Gray, M.F.; Meyer, C.R.; Reeves, A.P.; Zhao, B.; Aberle, D.R.; Henschke, C.I.; Hoffman, E.A.; et al. The Lung Image Database Consortium (LIDC) and Image Database Resource Initiative (IDRI): A completed reference database of lung nodules on CT scans. Med. Phys. 2011, 38, 915–931. [Google Scholar] [CrossRef]
- Henschke, C.I.; McCauley, D.I.; Yankelevitz, D.F.; Naidich, D.P.; McGuinness, G.; Miettinen, O.S.; Libby, D.M.; Pasmantier, M.W.; Koizumi, J.; Altorki, N.K.; et al. Early Lung Cancer Action Project: Overall design and findings from baseline screening. Lancet 1999, 354, 99–105. [Google Scholar] [CrossRef]
- Zhang, F.; Cai, W.D.; Song, Y.; Lee, M.Z.; Shan, S.; Feng, D.D. Overlapping node discovery for improving classification of lung nodules. In Proceedings of the EMBC, Osaka, Japan, 3–7 July 2013; pp. 5461–5464. [Google Scholar]
- Liu, X.L.; Hou, F.; Hao, A. Multi-view multi-scale CNNs for lung nodule type classification from CT images. Pattern Recognit. 2018, 77, 262–275. [Google Scholar] [CrossRef]
- Shiraishi, J. Development of a digital image database for chest radiographs with and without a lung nodule: Receiver operating characteristic analysis of radiologists’ detection of pulmonary nodules. Am. J. Roentgenol. 2000, 174, 71–74. [Google Scholar] [CrossRef]
- Zhao, Y.R.; Xie, X.; de Koning, H.J.; Mali, W.P.; Vliegenthart, R.; Oudkerk, M. NELSON lung cancer screening study. Cancer Imaging. 2011, 11, 79–84. [Google Scholar] [CrossRef]
- Consortium for Open Medical Image Computing, Automatic Nodule Detection. Available online: http://anode09.grand-challenge.org/ (accessed on 27 May 2015).
- Ginneken, B.V.; Armato, S.G.; de Hoop, B.; Amelsvoort-van, V.S.; Duindam, T.; Niemeijer, M.; Murphy, K.; Schilham, A.; Retico, A.; Fantacci, M.E.; et al. Comparing and combining algorithms for computer-aided detection of pulmonary nodules in computed tomography scans: The ANODE09 study. Med. Image Anal. 2010, 14, 707–722. [Google Scholar] [CrossRef] [Green Version]
- Armato, S.G.; Drukker, K.; Li, F.; Hadjiiski, L.; Tourassi, G.D.; Engelmann, R.M.; Giger, M.L.; Redmond, G.; Farahani, K.; Kirby, J.S.; et al. LUNGx Challenge for computerized lung nodule classification. J. Med. Imaging 2016, 3, 044506. [Google Scholar] [CrossRef] [PubMed] [Green Version]
- SPIE-AAPM Lung CT Challenge. Available online: https://wiki.cancerimagingarchive.net/display/Public/SPIE-AAPM+Lung+CT+Challenge (accessed on 12 May 2018).
- NSCLC-Radiomics-Genomics. Available online: https://wiki.cancerimagingarchive.net/display/Public/NSCLC-Radiomics-Genomics (accessed on 12 May 2018).
- Aerts, H.J.W.L.; Velazquez, E.R.; Leijenaar, R.T.H.; Parmar, C.; Grossmann, P.; Cavalho, S.; Lambin, P. Decoding tumour phenotype by noninvasive imaging using a quantitative radiomics approach. Nat. Commun. 2014, 5, 4006. [Google Scholar] [CrossRef] [Green Version]
- LUNA16—Data. Available online: https://luna16.grand-challenge.org/data/ (accessed on 15 May 2018).
- Danish Lung Nodule Screening Trial (DLCST). Available online: https://clinicaltrials.gov/ct2/show/study/NCT00496977 (accessed on 18 May 2012).
- Jiang, H.Y.; Ma, H.; Qian, W.; Wei, G.H.; Zhao, X.Z.; Gao, M. A novel pixel value space statistics map of the pulmonary nodule for classification in computerized tomography images. In Proceedings of the 2017 39th Annual International Conference of the IEEE Engineering in Medicine and Biology Society (EMBC), Jeju Island, Korea, 11–15 July 2017; pp. 556–559. [Google Scholar]
- Ma, J.C.; Wang, Q.; Ren, Y.; Hu, H.; Zhao, J. Automatic Lung Nodule Classification with Radiomics Approach. In Proceedings of the Medical Imaging 2016: PACS and Imaging Informatics: Next Generation and Innovations, San Diego, CA, USA, 5 April 2016; Volume 6. [Google Scholar]
- Song, J.Q.; Liu, H.; Geng, F.H.; Zhang, C.M. Weakly-Supervised Classification of Pulmonary Nodules Based on Shape Characters. In Proceedings of the 2016 IEEE 14th Intl Conf on Dependable, Autonomic and Secure Computing, 14th Intl Conf on Pervasive Intelligence and Computing, 2nd Intl Conf on Big Data Intelligence and Computing and Cyber Science and Technology Congress (DASC/PiCom/DataCom/CyberSciTech), Auckland, New Zealand, 8–12 August 2016; pp. 228–232. [Google Scholar]
- Iwano, S.; Nakamura, T.; Kamioka, Y.; Ishigak, M.T. Computer-aided diagnosis: A shape classification of pulmonary nodules imaged by high-resolution CT. Comput. Med. Imaging Graph. 2005, 29, 565–570. [Google Scholar] [CrossRef]
- McNitt-Gray, M.F.; Har, E.M.; Wyckoff, N. A pattern classification approach to characterizing solitary pulmonary nodules imaged on high resolution CT: Preliminary results. Med. Phys. 1999, 26, 880–888. [Google Scholar] [CrossRef] [PubMed]
- Dhara, A.K.; Mukhopadhyay, S.; Dutta, A.; Garg, M.; Khandelwal, N.; Kumar, P. Classification of pulmonary nodules in lung CT images using shape and texture features. Medical Imaging. In Proceedings of the Computer-Aided Diagnosis, San Diego, CA, USA, 24 March 2016. [Google Scholar]
- Rendon-Gonzalez, E.; Ponomaryov, V. Automatic Lung nodule segmentation and classification in CT images based on SVM. In Proceedings of the 2016 9th International Kharkiv Symposium on Physics and Engineering of Microwaves, Millimeter and Submillimeter Waves (MSMW), Kharkiv, Ukraine, 20–24 June 2016; pp. 1–4. [Google Scholar]
- Wang, J.; Liu, X.; Dong, D.; Song, J.D.; Xu, M.; Zang, Y.L.; Tian, J. Prediction of malignant and benign of lung tumor using a quantitative radiomic method. In Proceedings of the 2016 38th Annual International Conference of the IEEE Engineering in Medicine and Biology Society (EMBC), Orlando, FL, USA, 16–20 August 2016; pp. 1272–1275. [Google Scholar]
- Chen, C.H.; Chang, C.K.; Tu, C.Y.; Liao, W.C.; Wu, B.R.; Chou, K.T.; Chiou, Y.R.; Yang, S.N.; Zhang, G.; Huang, T.C. Radiomic features analysis in computed tomography images of lung nodule classification. PLoS ONE 2018, 13, e0192002. [Google Scholar] [CrossRef] [PubMed]
- Hu, H.H.; Ni, S.D. Classification of malignant-benign pulmonary nodules in lung CT images using an improved random forest. In Proceedings of the 2017 13th International Conference on Natural Computation, Fuzzy Systems and Knowledge Discovery (ICNC-FSKD), Guilin, China, 29–31 July 2017; pp. 2285–2290. [Google Scholar]
- Aggarwal, P.; Vig, R.; Sardana, H.K. Patient-Wise Versus Nodule-Wise Classification of Annotated Pulmonary Nodules using Pathologically Confirmed Cases. J. Comput. 2013, 8, 2245–2255. [Google Scholar] [CrossRef]
- Mukherjee, J.; Chakrabarti, A.; Skaikh, S.H.; Kar, M. Automatic Detection and Classification of Solitary Pulmonary Nodules from Lung CT Images. In Proceedings of the 2014 Fourth International Conference of Emerging Applications of Information Technology, Kolkata, India, 19–21 December 2014; pp. 294–299. [Google Scholar]
- Amal, A.F.; Ali, A.; Elshazly, S.; Farag, A.A. Feature fusion for lung nodule classification. Int. J. Comput. Assist. Radiol. Surg. 2017, 12, 1809–1818. [Google Scholar]
- Xie, Y.T.; Xia, Y.; Zhang, J.P.; Feng, D.D.; Fulham, M.J.; Cai, W.D. Transferable Multi-model Ensemble for Benign-Malignant Lung Nodule Classification on Chest CT. In Proceedings of the Medical Image Computing and Computer-Assisted Intervention (MICCAI), Quebec City, QC, Canada, 11–13 September 2017; pp. 656–664. [Google Scholar]
- Chen, S.H.; Qin, J.; Ji, X.; Lei, B.Y.; Wang, T.F.; Ni, D.; Cheng, J.Z. Automatic Scoring of Multiple Semantic Attributes with Multi-Task Feature Leverage: A Study on Pulmonary Nodules in CT Images. IEEE Trans. Med. Imaging 2017, 36, 802–814. [Google Scholar] [CrossRef]
- Xie, Y.T.; Zhang, J.P.; Liu, S.D.; Cai, W.D.; Xia, Y. Lung Nodule Classification by Jointly Using Visual Descriptors and Deep Features. In Proceedings of the Medical Computer Vision and Bayesian and Graphical Models for Biomedical Imaging, Athens, Greece, 21 October 2016; pp. 116–125. [Google Scholar]
- Xie, Y.T.; Zhang, J.P.; Xia, Y.; Zhang, Y.N. Fusing texture, shape and deep model-learned information at decision level for automated classification of lung nodules on chest CT. Inf. Fusion 2018, 42, 102–110. [Google Scholar] [CrossRef]
- Gong, J.; Liu, J.Y.; Sun, X.W.; Zheng, B.; Nie, S.D. Computer-aided diagnosis of lung cancer: The effect of training data sets on classification accuracy of lung nodules. Phys. Med. Biol. 2018, 63, 035036. [Google Scholar] [CrossRef]
- Dhara, A.K.; Mukhopadhyay, S.; Dutta, A.; Garg, M.; Khandelwal, N. A Combination of Shape and Texture Features for Classification of Pulmonary Nodules in Lung CT Images. J. Digit. Imaging 2016, 29, 466–475. [Google Scholar] [CrossRef] [Green Version]
- Gierada, D.S.; Politte, D.G.; Zheng, J. Quantitative Computed Tomography Classification of Lung Nodules: Initial Comparison of 2-and 3-Dimensional Analysis. Comput. Assist. Tomogr. 2016, 40, 589–595. [Google Scholar] [CrossRef]
- Fernandes, V.P.M.; Kanehisa, R.F.A.; Junior, G.B.; Silva, A.C.; de Paiva, D.C. Lung nodule classification based on shape distributions. In Proceedings of the 31st Annual ACM Symposium on Applied Computing, Pisa, Italy, 4–8 April 2016; pp. 84–86. [Google Scholar]
- Dilger, S.K.; Judisch, A.; Uthoff, J.; Hammond, E.; Newell, J.D.; Sieren, J.C. Improved pulmonary nodule classification utilizing lung parenchyma texture features. In Proceedings of the Medical Imaging: Computer-Aided Diagnosis, Orlando, FL, USA, 21–26 February 2015. [Google Scholar]
- El-Baz, A.; Nitzken, M.; Vanbogaert, E.; Gimel’farb, G.L.; Falk, R.; El-Ghar, M.A. A novel shape-based diagnostic approach for early diagnosis of lung nodules. In Proceedings of the 2011 IEEE International Symposium on Biomedical Imaging: From Nano to Macro, Chicago, IL, USA, 30 March–2 April 2011; pp. 137–140. [Google Scholar]
- El-Baz, A.; Nitzken, M.; Khalifa, F.; Elnakib, A.; Gimel’farb, G.L.; Falk, R.; El-Ghar, M.A. 3D Shape Analysis for Early Diagnosis of Malignant Lung Nodules. Inf. Process. Med. Imaging 2011, 22, 772–783. [Google Scholar]
- Namin, S.T.; Moghaddam, H.A.; Jafari, R.; Esmaeil-Zadeh, M.; Gity, M. Automated detection and classification of pulmonary nodules in 3D thoracic CT images. In Proceedings of the 2010 IEEE International Conference on Systems, Man and Cybernetics (SMC), Istanbul, Turkey, 10–13 October 2010; pp. 3774–3779. [Google Scholar]
- Way, T.W.; Sahiner, B.; Chan, H.P. Computer-aided diagnosis of pulmonary nodules on CT scans: Improvement of classification performance with nodule surface features. Med. Phys. 2009, 36, 3086–3098. [Google Scholar] [CrossRef] [PubMed]
- Lo, S.C.B.; Hsu, L.Y.; Freedman, M.T.; Zhao, H. Classification of lung nodules in diagnostic CT: An approach based on 3-D vascular features, nodule density distributions, and shape features. SPIE 2003, 5032, 183–189. [Google Scholar]
- Kawata, Y.; Niki, N.; Ohmatsu, H. Example-based assisting approach for pulmonary nodule classification in three-dimensional thoracic computed tomography images. Acad. Radiol. 2003, 10, 1402–1415. [Google Scholar] [CrossRef]
- Kawata, Y.; Niki, N.; Ohmatsu, H.Y.; Kusumoto, M.; Kakinuma, R.; Mori, L.; Nishiyama, H.; Eguchi, K.; Kaneko, M.; Moriyama, N. Hybrid Classification Approach of Malignant and Benign Pulmonary Nodules Based on Topological and Histogram Features. In Proceedings of the MICCAI 2000: Medical Image Computing and Computer-Assisted Intervention, Pittsburgh, PA, USA, 11–14 October 2000; pp. 297–306. [Google Scholar]
- Kawata, Y.; Niki, N.; Ohmatsu, H.; Kusumoto, M.; Kakinuma, R.; Mori, K.; Nishiyama, H.; Eguchi, K.; Kaneko, M.; Moriyama, N. Computer-aided differential diagnosis of pulmonary nodules based on a hybrid classification approach. Med. Imaging: Image Process. 2001, 4322, 1796–1806. [Google Scholar]
- Wyckoff, N.; McNitt-Gray, M.F.; Goldin, J.G.; Suh, R.D.; Sayre, J.W.; Aberle, D.R. Classification of solitary pulmonary nodules (SPNs) imaged on high-resolution CT using contrast enhancement and three-dimensional quantitative image features. Med. Imaging Image Process. 2000, 1107–1115. [Google Scholar] [CrossRef]
- Xie, Y.T.; Xia, Y.; Zhang, J.P.; Song, Y.; Feng, D.G.; Fulham, M.; Cai, W.D. Knowledge-based Collaborative Deep Learning for Benign-Malignant Lung Nodule Classification on Chest CT. IEEE Trans. Med. Imaging 2018. [Google Scholar] [CrossRef]
- Wei, G.H.; Ma, H.; Qian, W.; Han, F.F.; Jiang, H.Y.; Qi, S.L.; Qiu, M. Lung nodule classification using local kernel regression models with out-of-sample extension. Biomed. Signal Proc. Control 2018, 40, 1–9. [Google Scholar] [CrossRef]
- Sergeeva, M.; Ryabchikov, I.; Glaznev, M.; Gusarova, N.F. Classification of pulmonary nodules on computed tomography scans. Evaluation of the effectiveness of application of textural features extracted using wavelet transform of image. In Proceedings of the 2016 18th Conference of Open Innovations Association and Seminar on Information Security and Protection of Information Technology (FRUCT-ISPIT), St. Petersburg, Russia, 18–22 April 2016; pp. 291–299. [Google Scholar]
- Nascimento, L.B.; de Paiva, A.; Silva, A.C. Lung Nodules Classification in CT Images Using Shannon and Simpson Diversity Indices and SVM. In Proceedings of the MLDM 2012: Machine Learning and Data Mining in Pattern Recognition, Berlin, Germany, 13–20 July 2012; pp. 454–466. [Google Scholar]
- Song, C.; Stephanie, H.; Timothy, P. Diagnostic classification of solitary pulmonary nodules using dual time F-18-FDG PET/CT image texture features in granuloma-endemic regions. Sci. Rep. 2017, 7, 9370. [Google Scholar]
- Li, X.C.; Shen, L.L.; Luo, S.H. A Solitary Feature-Based Lung Nodule Detection Approach for Chest X-Ray Radiographs. IEEE J. Biomed. Health Inform. 2018, 22, 516–524. [Google Scholar] [CrossRef]
- Dandil, E.; Çakiroglu, M.; Eksi, Z.; Ozkan, M.; Kurt, O.K.; Canan, A. Artificial neural network-based classification system for lung nodules on computed tomography scans. In Proceedings of the 2014 6th International Conference of Soft Computing and Pattern Recognition (SoCPaR), Tunis, Tunisia, 11–14 August 2014; pp. 382–386. [Google Scholar]
- Htwe, K.Z.; Yamamori, K.; Katayama, T.; Kyi, T.M. Automated lung nodule classification by artificial neural network and fuzzy inference system. In Proceedings of the 2016 IEEE 5th Global Conference on Consumer Electronics (GCCE), Kyoto, Japan, 11–14 October 2016; pp. 1–2. [Google Scholar]
- McNitt-Gray, M.F.; Wyckoff, N.; Sayre, J.W. The effects of co-occurrence matrix based texture parameters on the classification of solitary pulmonary nodules imaged on computed tomography. Comput. Med. Imaging Graph. 1999, 23, 339–348. [Google Scholar] [CrossRef]
- Narayanan, L.A.; Jeeva, J.B. A Computer Aided Diagnosis for detection and classification of lung nodules. In Proceedings of the 2015 IEEE 9th International Conference on Intelligent Systems and Control (ISCO), Coimbatore, India, 9–10 January 2015; pp. 1–5. [Google Scholar]
- Zhang, F.; Song, Y.; Cai, W.D.; Lee, M.Z.; Zhou, Y.; Huang, H.; Shan, S.M.; Fulham, M.J.; Feng, D.D. Lung Nodule Classification with Multilevel Patch-Based Context Analysis. IEEE Trans. Biomed. Eng. 2014, 61, 1155–1166. [Google Scholar] [CrossRef] [PubMed]
- Song, Y.; Cai, W.D.; Wang, Y.; Feng, D.D. Location classification of lung nodules with optimized graph construction. In Proceedings of the 2012 9th IEEE International Symposium on Biomedical Imaging (ISBI), Barcelona, Spain, 2–5 May 2012; pp. 1439–1442. [Google Scholar]
- Farag, A.; Elhabian, S.; Graham, J.; Farag, A.; Falk, R. Toward Precise Pulmonary Nodule Descriptors for Nodule Type Classification. In Proceedings of the International Conference on Medical Image Computing and Computer-Assisted Intervention, Beijing, China, 20–24 September 2010; Volume 3, pp. 626–633. [Google Scholar]
- Li, X.X.; Li, B.; Tian, L.F.; Zhang, L. Automatic benign and malignant classification of pulmonary nodules in thoracic computed tomography based on RF algorithm. IET Image Process. 2018, 12, 1253–1264. [Google Scholar] [CrossRef]
- Wei, G.H.; Cao, H.; Ma, H.; Qi, S.L.; Qian, W.; Ma, Z.Q. Content-based image retrieval for Lung Nodule Classification Using Texture Features and Learned Distance Metric. J. Med. Syst. 2018, 42, 13. [Google Scholar] [CrossRef] [PubMed]
- Sasidhar, B.; Geetha, G.; Khodanpur, B.I.; Babu, D.R.R. Automatic Classification of Lung Nodules into Benign or Malignant Using SVM Classifier. In Proceedings of the 5th International Conference on Frontiers in Intelligent Computing: Theory and Applications, Bhubaneswar, India, 16–17 September 2016; pp. 551–559. [Google Scholar]
- Farag, A.A.; Ali, A.M.; Graham, J.H.; Elhabian, S.Y.; Farag, A.A.; Falk, R. Feature-Based Lung Nodule Classification. In Proceedings of the International Symposium on Visual Computing, Las Vegas, NV, USA, 29 November–1 December 2010; Volume 3, pp. 79–88. [Google Scholar]
- Chen, H.; Wu, W.F.; Xia, H.; Du, J.; Yang, M.; Ma, B. Classification of Pulmonary Nodules Using Neural Network Ensemble. In Proceedings of the 8th International Conference on Advances in Neural Networks, Guilin, China, 29 May–1 June 2011; Volume 3, pp. 460–466. [Google Scholar]
- Felix, A.; Oliveira, M.C.; Machado, A.; Ferreira, J.R. Using 3D Texture and Margin Sharpness Features on Classification of Small Pulmonary Nodules. In Proceedings of the 2016 29th SIBGRAPI Conference on Graphics, Patterns and Images (SIBGRAPI), Sao Paulo, Brazil, 4–7 October 2016; pp. 394–400. [Google Scholar]
- Dilger, S.; Judisch, A.; Hoffman, E.A. The Use of Surrounding Lung Parenchyma For The Automated Classification Of Pulmonary Nodules. Am. J. Respir. Crit. Care Med. 2013, 187. [Google Scholar] [CrossRef]
- Han, F.F.; Zhang, G.P.; Wang, H.F.; Song, B.W.; Lu, H.B.; Zhao, D.Z.; Zhao, H.; Liang, Z.R. A texture feature analysis for diagnosis of pulmonary nodules using LIDC-IDRI database. In Proceedings of the 2013 IEEE International Conference on Medical Imaging Physics and Engineering, Shenyang, China, 19–20 October 2013; pp. 14–18. [Google Scholar]
- da Silva, C.A.; Silva, A.C.; Netto, S.M.B.; Paiva, A.C.; Junior, G.B.; Nunes, R.A. Lung Nodules Classification in CT Images Using Simpson’s Index, Geometrical Measures and One-Class SVM. In Proceedings of the MLDM 2009: Machine Learning and Data Mining in Pattern Recognition, Leipzig, Germany, 23–25 July 2009; pp. 810–822. [Google Scholar]
- Way, T.W.; Hadjiiski, L.M.; Sahiner, B. Computer-aided diagnosis of pulmonary nodules on CT scans: Segmentation and classification using 3D active contours. Med. Phys. 2006, 33, 2323–2337. [Google Scholar] [CrossRef] [PubMed] [Green Version]
- Zhu, W.T.; Liu, C.C.; Fan, W.; Xie, X.H. DeepLung: 3D Deep Convolutional Nets for Automated Pulmonary Nodule Detection and Classification. arXiv 2017, arXiv:1709.05538. [Google Scholar]
- Kim, H.; Park, C.M.; Hwang, E.J. Pulmonary subsolid nodules: Value of semi-automatic measurement in diagnostic accuracy, diagnostic reproducibility and nodule classification agreement. Eur. Radiol. 2018, 28, 2124–2133. [Google Scholar] [CrossRef]
- Jirapatnakul, A.C.; Reeves, A.P.; Apanasovich, T.V.; Biancardi, A.M.; Yankelevitz, D.F.; Henschke, C.I. Pulmonary Nodule Classification: Size Distribution Issues. In Proceedings of the 2007 4th IEEE International Symposium on Biomedical Imaging: From Nano to Macro, Arlington, VA, USA, 12–15 April 2007; pp. 1248–1251. [Google Scholar]
- Le, V.; Yang, D.; Zhu, Y.; Zheng, B.; Bai, C.; Nguyen, Q.; Shi, H. Automated Classification of Pulmonary Nodules for Lung Adenocarcinomas Risk Evaluation: An Effective CT Analysis by Clustering Density Distribution Algorithm. Med. Imaging Health Inform. 2017, 7, 1753–1758. [Google Scholar] [CrossRef]
- Wei, G.H.; Ma, H.; Qian, W.; Zhao, X.Z. A content-based image retrieval scheme for lung nodule classification. Curr. Med. Imaging Rev. 2017, 13, 210–216. [Google Scholar] [CrossRef]
- Armato, S.G.; Altman, M.B.; Wilkie, J. Automated lung nodule classification following automated nodule detection on CT: A serial approach. Med. Phys. 2003, 3, 1188–1197. [Google Scholar] [CrossRef]
- Kawata, Y.; Niki, N.; Ohmatsu, H. Pulmonary nodule classification based on CT density distribution using 3-D thoracic CT images. Prog. Biomed. Opt. Imaging 2004, 5, 413–422. [Google Scholar]
- Kawata, Y.; Niki, N.; Ohmatsu, H. Three-dimensional computer-aided diagnosis schemes for classification of benign and malignant pulmonary nodules. Comput. Assist. Radiol. Surg. Proc. 2002, 764–769. [Google Scholar] [CrossRef]
- Tartar, A.; Akan, A.; Kilic, N. A novel approach to malignant-benign classification of pulmonary nodules by using ensemble learning classifiers. In Proceedings of the 2014 36th Annual International Conference of the IEEE Engineering in Medicine and Biology Society, Chicago, IL, USA, 26–30 August 2014; pp. 4651–4654. [Google Scholar]
- Kim, B.C.; Sung, Y.S.; Suk, H.L. Deep feature learning for pulmonary nodule classification in a lung CT. In Proceedings of the 2016 4th International Winter Conference on Brain-Computer Interface (BCI), Yongpyong, South Korea, 22–24 February 2016; pp. 1–3. [Google Scholar]
- Hancock, M.C.; Magnan, J.F. Predictive capabilities of statistical learning methods for lung nodule malignancy classification using diagnostic image features: An investigation using the Lung Image Database Consortium dataset. In Proceedings of the Medical Imaging: Computer-Aided Diagnosis, Orlando, FL, USA, 3 March 2017. [Google Scholar]
- Shewaye, T.N.; Mekonnen, A.A. Benign-Malignant Lung Nodule Classification with Geometric and Appearance Histogram Features. arXiv 2016, arXiv:1605.08350. [Google Scholar]
- Mao, K.M.; Tang, R.J.; Wang, X.Q.; Zhang, W.Y.; Wu, H.X. Feature Representation Using Deep Autoencoder for Lung Nodule Image Classification. Complexity 2018, 2018, 3078374. [Google Scholar] [CrossRef]
- Yuan, J.J.; Liu, X.L.; Hou, F.; Qin, H.; Hao, A.M. Hybrid-feature-guided lung nodule type classification on CT images. Comput. Graph. 2018, 70, 288–299. [Google Scholar] [CrossRef]
- Ciompi, F.; Jacobs, C.; Scholten, E.T.; Wille, M.M.W.; de Jong, P.A.; Prokop, M.; van Ginneken, B. Bag-of-Frequencies: A Descriptor of Pulmonary Nodules in Computed Tomography Images. IEEE Trans. Med. Imaging 2015, 34, 962–973. [Google Scholar] [CrossRef] [PubMed]
- El-Baz, A.; Gimel’farb, G.L.; Falk, R.; El-Ghar, M.A. Appearance analysis for diagnosing malignant lung nodules. In Proceedings of the 2010 IEEE International Symposium on Biomedical Imaging: From Nano to Macro, Rotterdam, The Netherlands, 14–17 April 2010; pp. 193–196. [Google Scholar]
- Mao, K.M.; Deng, Z.F. Lung Nodule Image Classification Based on Local Difference Pattern and Combined Classifier. Comp. Math. Methods Med. 2016, 7, 1091279. [Google Scholar]
- Huang, P.W.; Lin, P.L.; Lee, C.H.; Lee, C.H. A Classification System of Lung Nodules in CT Images Based on Fractional Brownian Motion Model. In Proceedings of the 2013 International Conference on System Science and Engineering (ICSSE), Budapest, Hungary, 4–6 July 2013; pp. 37–40. [Google Scholar]
- Lin, P.L.; Huang, P.W.; Lee, C.H.; Wu, M.T. Automatic classification for solitary pulmonary nodule in CT image by fractal analysis based on fractional Brownian motion model. Pattern Recognit. 2013, 46, 3279–3287. [Google Scholar] [CrossRef]
- Zhang, F.; Song, Y.; Cai, W.D.; Zhou, Y.; Shan, S.; Feng, D. Context Curves for Classification of Lung Nodule Images. In Proceedings of the 2013 International Conference on Digital Image Computing: Techniques and Applications (DICTA), Hobart, TAS, Australia, 26–28 November 2013; pp. 1–7. [Google Scholar]
- Nibali, A.; He, Z.; Wollersheim, D. Pulmonary nodule classification with deep residual networks. Int. J. Comput. Assist. Radiol. Surg. 2017, 12, 1799–1808. [Google Scholar] [CrossRef]
- Penedo, M.G.; Carreira, M.J.; González, A.M.; Cabello, D. Computer-Aided Diagnosis: A Neural Network Based Approach to Lung Nodule Detection. IEEE Trans. Med. Imaging 1998, 17, 872–880. [Google Scholar] [CrossRef]
- Dou, Q.; Chen, H.; Yu, L.Q.; Qin, J.; Heng, P.A. Multilevel Contextual 3-D CNNs for False Positive Reduction in Pulmonary Nodule Detection. IEEE Trans. Biomed. Eng. 2017, 64, 1558–1567. [Google Scholar] [CrossRef] [PubMed]
- Jia, T.; Bai, Y.K.; Zhang, H.; Chen, D.Y.; Yu, X.S.; Wu, C.D. Lung Nodules Classification Based on Growth Changes and Registration Technology. In Proceedings of the 2016 Chinese Control and Decision Conference (CCDC), Yinchuan, China, 28–30 May 2016; pp. 5359–5364. [Google Scholar]
- Mao, K.M.; Deng, Z.F. Lung Nodule Image Classification Based on Ensemble Machine Learning. Med. Imaging Health Inform. 2016, 6, 1679–1685. [Google Scholar]
- Zhao, X.Z.; Liu, L.Y.; Qi, S.L.; Teng, Y.Y.; Li, J.H.; Qian, W. Agile convolutional neural network for pulmonary nodule classification using CT images. Comput. Assist. Radiol. Surg. 2018, 13, 585–595. [Google Scholar] [CrossRef] [PubMed]
- Jiang, H.Y.; Ma, H.; Qian, W.; Gao, M.D.; Li, Y. An Automatic Detection System of Lung Nodule Based on Multigroup Patch-Based Deep Learning Network. IEEE J. Biomed. Health Inform. 2018, 22, 1227–1237. [Google Scholar] [CrossRef] [PubMed]
- Shen, W.; Zhou, M.; Yang, F.; Yang, C.Y.; Tian, J. Multi-scale Convolutional Neural Networks for Lung Nodule Classification. In Information Processing in Medical Imaging; Springer: Cham, Switzerland, 2015; pp. 588–599. [Google Scholar]
- Jin, X.Y.; Ma, C.H.; Zhang, Y.C.; Li, L.J. Classification of Lung Nodules Based on Convolutional Deep Belief Network. In Proceedings of the 2017 10th International Symposium on Computational Intelligence and Design (ISCID), Hangzhou, China, 9–10 December 2017; pp. 139–142. [Google Scholar]
- Song, Q.Z.; Zhao, L.; Luo, X.K.; Dou, X.C. Using Deep Learning for Classification of Lung Nodules on Computed Tomography Images. Healthc. Eng. 2017, 2017, 8314740. [Google Scholar] [CrossRef] [PubMed]
- da Silva, G.L.F.; da Silva Neto, O.P.; Silva, A.C.; de Paiva, A.C.; Gattass, M. Lung nodules diagnosis based on evolutionary convolutional neural network. Multimed. Tools Appl. 2017, 76, 19039–19055. [Google Scholar] [CrossRef]
- Liu, K.; Kang, G.X. Multiview convolutional neural networks for lung nodule classification. Int. J. Imaging Syst. Technol. 2017, 27, 12–22. [Google Scholar] [CrossRef]
- Xu, Y.X.; Zhang, G.K.; Li, Y.; Luo, Y.; Lu, J.W. A Hybrid Model: DGnet-SVM for the Classification of Pulmonary Nodules. In Proceedings of the International Conference on Neural Information Processing, Guangzhou, China, 14–18 November 2017; Volume 4, pp. 732–741. [Google Scholar]
- Jia, T.; Zhang, H.; Bai, Y.K. Benign and Malignant Lung Nodule Classification Based on Deep Learning Feature. Med. Imaging Health Inform. 2015, 5, 1936–1940. [Google Scholar] [CrossRef]
- Thammasorn, P.; Wu, W.; Pierce, L.A.; Pipavath, S.N.; Lampe, P.D.; Houghton, A.M.; Haynor, D.R.; Chaovalitwongse, W.A.; Kinahan, P.E. Deep-learning derived features for lung nodule classification with limited datasets. In Proceedings of the Medical Imaging: Computer-Aided Diagnosis, Houston, TX, USA, 27 February 2018. [Google Scholar]
- Hua, K.L.; Hsu, C.H.; Hidayati, S.C.; Cheng, W.H.; Chen, Y.J. Computer-aided classification of lung nodules on computed tomography images via deep learning technique. OncoTargets Ther. 2015, 8, 2015–2022. [Google Scholar]
- Kumar, D.; Wong, A.; Clausi, D.A. Lung Nodule Classification Using Deep Features in CT Images. In Proceedings of the 2015 12th Conference on Computer and Robot Vision (CRV), Halifax, NS, Canada, 3–5 June 2015; pp. 133–138. [Google Scholar]
- Sun, W.Q.; Zheng, B.; Qian, W. Computer aided lung cancer diagnosis with deep learning algorithms. SPIE 2016, 9785. [Google Scholar] [CrossRef]
- Tajbakhsh, N.; Suzuki, K.J. Comparing two classes of end-to-end machine-learning models in lung nodule detection and classification: MTANNs CNNs. Pattern Recognit. 2017, 63, 476–486. [Google Scholar] [CrossRef]
- Suzuki, K.; Li, F.; Sone, S.; Doi, K. Computer-aided diagnostic scheme for distinction between benign and malignant nodules in thoracic low-dose CT by use of massive training artificial neural network. IEEE Trans. Med. Imaging 2005, 24, 1138–1150. [Google Scholar] [CrossRef] [PubMed]
- Shen, W.; Zhou, M.; Yang, F.; Yu, D.D.; Dong, Di.; Yang, C.Y.; Zang, Y.L.; Tian, J. Multi-crop Convolutional Neural Networks for lung nodule malignancy suspiciousness classification. Pattern Recognit. 2017, 61, 663–673. [Google Scholar] [CrossRef]
- Dey, R.; Lu, Z.J.; Hong, Y. Diagnostic Classification of Lung Nodules Using 3D Neural Networks. In Proceedings of the 2018 IEEE 15th International Symposium on Biomedical Imaging (ISBI 2018), Washington, DC, USA, 4–7 April 2018. [Google Scholar]
- Causey, J.; Zhang, J.; Ma, S.Q.; Jiang, B.; Qualls, J.; Politte, D.G.; Prior, F.W.; Zhang, S.Z.; Huang, X.Z. Highly accurate model for prediction of lung nodule malignancy with CT scans. Sci. Rep. 2018, 8, 9286. [Google Scholar] [CrossRef] [PubMed]
- Zhu, W.T.; Liu, C.C.; Fan, W.; Xie, X.H. DeepLung: Deep 3D Dual Path Nets for Automated Pulmonary Nodule Detection and Classification. In Proceedings of the 2018 IEEE Winter Conference on Applications of Computer Vision (WACV), Lake Tahoe, NV, USA, 12–15 March 2018; pp. 673–681. [Google Scholar]
- Kang, G.X.; Liu, K.; Hou, B.B.; Zhang, N. 3D multi-view convolutional neural networks for lung nodule classification. PLoS ONE 2017, 12, e0188290. [Google Scholar] [CrossRef]
- Yan, X.J.; Pang, J.N.; Qi, H.; Zhu, Y.X.; Bai, C.X.; Geng, X.; Liu, M.N.; Terzopoulos, D.; Ding, X.W. Classification of Lung Nodule Malignancy Risk on Computed Tomography Images Using Convolutional Neural Network:A Comparison Between 2D and 3D Strategies. In Computer Vision—ACCV 2016 Workshops; Springer: Cham, Switzerland, 2016; pp. 91–101. [Google Scholar]
- Setio, A.A.A.; Ciompi, F.; Litjens, G.J.S.; Gerke, P.K.; Jacobs, C.; van Riel, S.J.; Wille, M.M.W.; Naqibullah, M.; Sánchez, C.I.; van Ginneken, B. Pulmonary Nodule Detection in CT Images: False Positive Reduction Using Multi-View Convolutional Networks. IEEE Trans. Med. Imaging 2016, 35, 1160–1169. [Google Scholar] [CrossRef] [PubMed]
- Paing, M.P.; Choomchuay, S. Classification of Margin Characteristics from 3D Pulmonary Nodules. In Proceedings of the 2017 10th Biomedical Engineering International Conference, Hokkaido, Japan, 31 August–2 September 2017; pp. 1–5. [Google Scholar]
- Huang, W.; Tu, S. Malignancy Classification for Small Pulmonary Nodules with Radiomics and Logistic Regression. Med. Phys. 2016, 43, 3377–3378. [Google Scholar] [CrossRef]
- Zhang, F.; Song, Y.; Cai, W.D.; Zhou, Y.; Fulham, M.J.; Eberl, S.; Shan, S.; Feng, D. A ranking-based lung nodule image classification method using unlabeled image knowledge. In Proceedings of the 2014 IEEE 11th International Symposium on Biomedical Imaging (ISBI), Beijing, China, 29 April–2 May 2014; pp. 1356–1359. [Google Scholar]
- Antonelli, M.; Cococcioni, M.; Lazzerini, B.; Marcelloni, F.; Stefanescu, D.C. A Multi-Classifier System for Pulmonary Nodule Classification. In Proceedings of the 2008 21st IEEE International Symposium on Computer-Based Medical Systems (CBMS), Jyvaskyla, Finland, 17–19 June 2008; pp. 587–589. [Google Scholar]
- Dilger, S.K.N.; Judisch, A.; Uthoff, J.; Hoffman, E.A.; Newell, J.D.; Sieren, J.C. A Systematic Investigation into Lung Tissue Feature Extraction to Improve The Classification Of Pulmonary Nodules. Am. J. Respir. Crit. Care Med. 2014, 189. [Google Scholar] [CrossRef]
- Leksir, Y.L.D.; Mansour, M.; Moussaoui, A. Localization of thermal anomalies in electrical equipment using Infrared Thermography and support vector machine. Infrared Phys. Technol. 2018, 89, 120–128. [Google Scholar] [CrossRef]
- Glowacz, A.; Glowacz, Z. Recognition of images of finger skin with application of histogram, image filtration and K-NN classifier. Biocybern. Biomed. Eng. 2016, 36, 95–101. [Google Scholar] [CrossRef]
- Chen, M.T.; Wang, X.G.; Feng, B. Structured random forest for label distribution learning. Neurocomputing 2018, 320, 171–182. [Google Scholar] [CrossRef]
- Koprowski, R.; Lanza, M.; Irregolare, C. Corneal power evaluation after myopic corneal refractive surgery using artificial neural networks. Biomed. Eng. Online 2016, 15, 121. [Google Scholar] [CrossRef] [PubMed]
- Clark, K.; Vendt, B.; Smith, K.; Freymann, J.; Kirby, J.; Koppel, P.; Moore, S.; Phillips, S.; Maffitt, D.; Pringle, M.; et al. The Cancer Imaging Archive (TCIA): Maintaining and Operating a Public Information Repository. J. Digit. Imaging 2013, 26, 1045–1057. [Google Scholar] [CrossRef] [PubMed]
- Zhang, C.Y.; Bengio, S.; Hardt, M.; Recht, B.; Vinyals, O. Understanding deep learning requires rethinking generalization. arXiv, 2017; arXiv:1611.03530v2. [Google Scholar]
- LeCun, Y.; Bengio, Y.; Hinton, G.E. Deep learning. Nature 2015, 521, 436–444. [Google Scholar] [CrossRef] [PubMed]


| Case | Nodule ID | X Loc. | Y Loc. | Z Loc. | Contour of the Nodule | Malignancy |
|---|---|---|---|---|---|---|
| 0007 | Nodule 001 | 194 | 290 | 37 | ((189,280), (188,281), …, (190,281), (189,280)) | 5 |
| 0007 | IL057_159747 | 293 | 266 | 30 | ((289,280), (290,279), …, (288,279), (289,280)) | 5 |
| 0092 | Nodule 004 | 179 | 282 | 12 | ||
| 0092 | Nodule 005 | 361 | 333 | 108 |
| Scan | Type | X | Y | Slice |
|---|---|---|---|---|
| W0001 | Nodule | 98 | 218 | 54 |
| W0001 | Nodule | 54 | 224 | 170 |
| W0003 | Nodule | 158 | 356 | 80 |
| W0005 | Nodule | 120 | 247 | 66 |
| W0006 | Nodule | 109 | 258 | 129 |
| W0007 | Nodule | 70 | 224 | 111 |
| Database | Sample Number | Classification |
|---|---|---|
| Shanghai Zhongshan hospital database (ZSDB) | CT images from 350 patients | MIA, AAH, AIS, IA |
| SPIE-AAPM Lung CT Challenge [23,24] | 22,489 CT images from 70 series | malignant and benign |
| General Hospital of Guangzhou Military Command (GHGMC) dataset | 180 benign and 120 malignant lung nodules | malignant and benign |
| NSCLC-Radiomics database [25,26] | 13,482 CT images from 89 patients | malignant and benign |
| Lung Nodule Analysis challenge 2016 (LUNA16) [27] | 888 CT scans | subset of LIDC-IDRI |
| Danish Lung Nodule Screening Trial (DLCST) [28] | CT images from 4104 participants | Nodule and non-nodule |
| Authors | Year | Database | Features | Classifier | Performance |
|---|---|---|---|---|---|
| Xie et al. [45] | 2018 | LIDC-IDRI | U, D | ANNs | AUC:0.9665, 0.9445 and 0.8124 |
| Wei et al. [61] | 2018 | LIDC-IDRI | U | Spectral clustering | Error rate: 10.9%, 17.5% |
| Wei et al. [74] | 2018 | LIDC-IDRI | G | CBIR | AUC: 0.986, Acc: 91.8% |
| Dey et al. [124] | 2018 | LIDC-IDRI, Private | D, 3D | CNNs | Acc: 90.4%, AUC: 0.9548 |
| Xie et al. [60] | 2018 | LIDC-IDRI | U, D, 3D | CNNs | AUC: 0.9570, Acc: 91.6% |
| Chen et al. [37] | 2018 | 72 patients, 75 nodules | U | SVM | Acc: 84%, Sen: 92.85% Spe: 72.73% |
| Gong et al. [46] | 2018 | Private | U, 3D | SVM, LDA, Naïve Bayes | AUC: 0.94, 0.90, 0.99 |
| Zhao et al. [108] | 2018 | LIDC-IDRI | D | CNNs | Acc: 82.2%, AUC: 0.877 |
| Li et al. [73] | 2018 | LIDC-IDRI, private | G | RF | Sen: 92%, AUC: 0.95 |
| Causey et al. [125] | 2018 | LIDC-IDRI | U, D,3D | RF | AUC: 0.99 |
| Zhu et al. [126] | 2018 | LIDC-IDRI, LUNA16 | D, 3D | CNNs, GBM | Acc: 90.44% |
| Tajbakhsh et al. [121] | 2017 | 415 cases, 489 nodules | D | MTANNs, CNNs | AUC: 0.8806 and 0.7755 |
| Shen et al. [123] | 2017 | LIDC-IDRI | 3D, D | CNNs | Acc: 87.14%, AUC: 0.93 |
| Hancock et al. [93] | 2017 | LIDC-IDRI | U | Linear classifier | Acc: 88.08%, AUC: 0.949 |
| Xie et al. [42] | 2017 | LIDC-IDRI | U, D | CNNs | Acc: 93.40% |
| Le et al. [86] | 2017 | ZSDB, LIDC-IDRI | U | RF | AUC: 0.9144 and 0.8234 Acc: 89.20% and 82.92% |
| Kang et al. [127] | 2017 | LIDC-IDRI | D, 3D | CNNs | Error rate: 4.59% |
| Wei et al. [87] | 2017 | LIDC-IDRI | U | CBIR | AUC: 0.751, Acc: 71.3% |
| Jin et al. [111] | 2017 | LIDC | D | CDBNs | Acc: 92.83% |
| Song et al. [112] | 2017 | LIDC-IDRI | D | CNNs, DNN, SAEs | Acc: 84.15%, Sen: 83.96% Spe: 84.32% |
| Silva et al. [113] | 2017 | LIDC-IDRI | D | CNNs | Sen: 94.66%, Spe: 95.14% Acc: 94.78%, AUC: 0.949 |
| Nibali et al. [103] | 2017 | LIDC-IDRI | D | CNNs | Acc: 89.90% |
| Xu et al. [115] | 2017 | LIDC-IDRI | D | SVM | Acc: 89%, AUC: 0.95 |
| Jiang et al. [29] | 2017 | LIDC-IDRI | U | SVM, RF, KNN, CNNs | Acc: 77.29%, 80.07%, 84.21%; AUC: 0.913 |
| Paing et al. [130] | 2017 | TCIA [139] | U, 3D | SVM | Acc: 90.9% |
| Shen et al. [123] | 2017 | LIDC-IDRI | 3D, D | CNNs | Acc: 87.14%, AUC: 0.93 |
| Dhara et al. [47] | 2016 | LIDC-IDRI | U, 3D | SVM | AUC: 0.9505, 0.8822 and 0.8848 |
| Yan et al. [128] | 2016 | LIDC-IDRI | D, 3D | CNNs | Acc: 86.7%, 87.3%, and 87.4% |
| Sasidhar et al. [75] | 2016 | LIDC-IDRI | U, G | SVM | Acc: 92% |
| Htwe et al. [67] | 2016 | LIDC-IDRI, SPIE-AAPM | U | Fuzzy system | Sen: 87%, Acc: 78% |
| Dhara et al. [34] | 2016 | LIDC-IDRI | U | SVM | AUC: 0.9465 |
| Gierada et al. [48] | 2016 | 94 patients, 96 nodules | U, 3D | Regression analysis | AUC: from 0.79 to 0.83 |
| Sergeeva et al. [62] | 2016 | LIDC-IDRI | U | KNN | Acc: 81.3% |
| Fernandes et al. [49] | 2016 | 754 nodules | U, 3D | SVM | Sen: 87.94%, Spe: 94.32% Acc: 91.05% |
| Shewaye et al. [94] | 2016 | LIDC-IDRI, Private | U, G | SVM, KNN, RF, Logistic Regression, AdaBoost | Acc: 82% of malignant and 93% of benign |
| Rendon-Gonzalez et al. [35] | 2016 | SPIE-AAPM | U | SVM | Acc: 78.08%, Sen: 84.93% Spe: 80.92% |
| Kim et al. [92] | 2016 | Private | U, D | SVM | Acc: 95.5%, Sen: 94.4% AUC: 0.987 |
| Ma et al. [30] | 2016 | TCIA | U | RF | Acc: 82.7% |
| Liu et al. [114] | 2016 | LIDC-IDRI | D | CNNs | Error rate: 5.41% |
| Felix et al. [78] | 2016 | 274 nodules | U, 3D | MLP, KNN, RF | AUC: 0.82 |
| Sun et al. [120] | 2016 | LIDC-IDRI | D | CNNs,DBNs SDAE | Acc: 79.76%, 81.19% and 79.29% |
| Wang et al. [36] | 2016 | LIDC-IDRI | U | SVM | Acc: 76.1% |
| Huang et al. [131] | 2016 | 100 series | U | Logistic regression | Acc: 79%; AUC: 0.81 |
| Song et al. [31] | 2016 | LIDC | U | Acc: 83.4% | |
| Xie et al. [44] | 2016 | LIDC-IDRI | U, D | CNNs | Acc: 86.79%; |
| Aggarwal et al. [39] | 2015 | Private | U | SVM | Acc: 82.32% |
| Narayanan et al. [69] | 2015 | LIDC | U | ANNs | Acc: 92.2%, FP: 0.9% |
| Dilger et al. [50] | 2015 | 50 nodules | U, G, 3D | ANNs | AUC: 0.935, Acc: 92% |
| Hua et al. [118] | 2015 | LIDC | D | CNNs | Sen: 73.4% and 73.3% Spe: 82.2% and 78.7% |
| Kumar et al. [119] | 2015 | LIDC-IDRI | D | binary decision tree | Acc: 75.01%, Sen: 83.35% |
| Shen et al. [110] | 2015 | LIDC-IDRI | 3D, D | SVM, RF | Acc: 86.84% |
| Tartar et al. [91] | 2014 | Private | U | AdaBoost, Bagging, RSS | Sen: 94.7%, 90.0%, 77.8% Acc: 89.5% |
| Dandil et al. [66] | 2014 | 47 patients, 128 nodules | U | ANNs | Acc: 90.63%, Sen: 92.30% Spe: 89.47% |
| Huang et al. [100] | 2013 | 107 images | U | SVM | Acc: 83.11%, AUC: 0.8437 |
| Dilger et al. [79] | 2013 | 27 nodules | U, 3D | NN | Acc: 92.6% |
| Han et al. [80] | 2013 | LIDC-IDRI | U, 3D | SVM | AUC: 0.9441 |
| Lin et al. [101] | 2013 | 107 scans | U | SVM | AUC: 0.9019, Acc: 88.82% Sen: 93.92%, Spe: 82.90% |
| Nascimento et al. [63] | 2012 | LIDC | U | SVM | Sen: 85.64, Spe: 97.89% Acc: 92.78% |
| El-Baz et al. [51] | 2011 | LIDC | U, 3D | KNN | Acc: 94.4% |
| Chen et al. [77] | 2011 | 47 nodules | D | BPNN, RBPNN, LVQNN | Acc: 78.7% |
| El-Baz et al. [52] | 2011 | LIDC | U, 3D | KNN | Acc: 93.6% |
| Namin et al. [53] | 2010 | LIDC | U, 3D | KNN | Sen: 88% |
| El-Baz et al. [98] | 2010 | LIDC | U, 3D | Bayes | Acc: 96.3% |
| Silva et al. [81] | 2009 | Private | U, 3D | SVM | Acc: 100%, Spe: 100% Sen: 100% |
| Way et al. [54] | 2009 | Private | U, 3D | AUC: 0.863 | |
| Antonelli et al. [133] | 2008 | 66 nodules | O | Sen: 95%, Spe: 91.33% | |
| Way et al. [82] | 2006 | LIDC | U, 3D | LDA | AUC: 0.83 |
| Suzuki et al. [122] | 2005 | 489 nodules | D | ANNs | AUC: 0.882 |
| Armato et al. [88] | 2003 | 393 scans, 470 nodules | U, 3D | k-means | AUC: 0.79 |
| Lo et al. [55] | 2003 | 48 cases | U, 3D | ANNs | AUC: 0.89 |
| Kawata et al. [56] | 2003 | 107 cases | U, 3D | Sen: 91.4%, Spe: 51.4% Acc: 77.6% | |
| Kawata et al. [58] | 2001 | 248 nodules | U, 3D | k-means, LDA | AUC: 0.97 |
| Kawata et al. [57] | 2000 | 210 nodules | U, 3D | k-means, LDA | AUC: 0.97 |
| Wyckoff et al. [59] | 2000 | 21 cases | 3D, U | Acc: 81% | |
| McNitt et al. [33] | 1999 | 31 cases | U | LDA | Acc: 90.3% |
| Author | Year | Database | Features | Classifier | Performance |
|---|---|---|---|---|---|
| Liu et al. [18] | 2018 | LIDC-IDRI, ELCAP | U, D, 3D | CNNs | Acc: 92.3% and 90.3% |
| Yuan et al. [96] | 2018 | U, G, D, 3D | SVM | Acc: 93.1% and 93.9% | |
| Mao et al. [95] | 2018 | ELCAP | U, D | Softmax | Acc: 95.5% |
| Mao et al. [99] | 2016 | ELCAP | U | SVM, clustering | Acc: over 90% |
| Mao et al. [107] | 2016 | ELCAP | G | Ensemble classifier | Acc: 92% |
| Zhang et al. [70] | 2014 | ELCAP | U, G | SVM, pLSA | Acc: 89% |
| Zhang et al. [132] | 2014 | ELCAP | O | Acc: about 88% | |
| Zhang et al. [102] | 2013 | ELCAP | U | SVM | Acc: 82.5% |
| Zhang et al. [17] | 2013 | ELCAP | G | CPMw | Precision: 0.916 |
| Song et al. [71] | 2012 | ELCAP | U, G | SVM | Acc: about 87.5% |
| Farag et al. [76] | 2010 | ELCAP | G | LDA | Acc: 81.5% |
| Farag et al. [72] | 2010 | ELCAP | G | LDA | Acc: 78.23% |
© 2019 by the authors. Licensee MDPI, Basel, Switzerland. This article is an open access article distributed under the terms and conditions of the Creative Commons Attribution (CC BY) license (http://creativecommons.org/licenses/by/4.0/).
Share and Cite
Wang, X.; Mao, K.; Wang, L.; Yang, P.; Lu, D.; He, P. An Appraisal of Lung Nodules Automatic Classification Algorithms for CT Images. Sensors 2019, 19, 194. https://doi.org/10.3390/s19010194
Wang X, Mao K, Wang L, Yang P, Lu D, He P. An Appraisal of Lung Nodules Automatic Classification Algorithms for CT Images. Sensors. 2019; 19(1):194. https://doi.org/10.3390/s19010194
Chicago/Turabian StyleWang, Xinqi, Keming Mao, Lizhe Wang, Peiyi Yang, Duo Lu, and Ping He. 2019. "An Appraisal of Lung Nodules Automatic Classification Algorithms for CT Images" Sensors 19, no. 1: 194. https://doi.org/10.3390/s19010194