Dielectric Spectroscopy and Optical Density Measurement for the Online Monitoring and Control of Recombinant Protein Production in Stably Transformed Drosophila melanogaster S2 Cells


Abstract
:1. Introduction
2. Materials and Methods
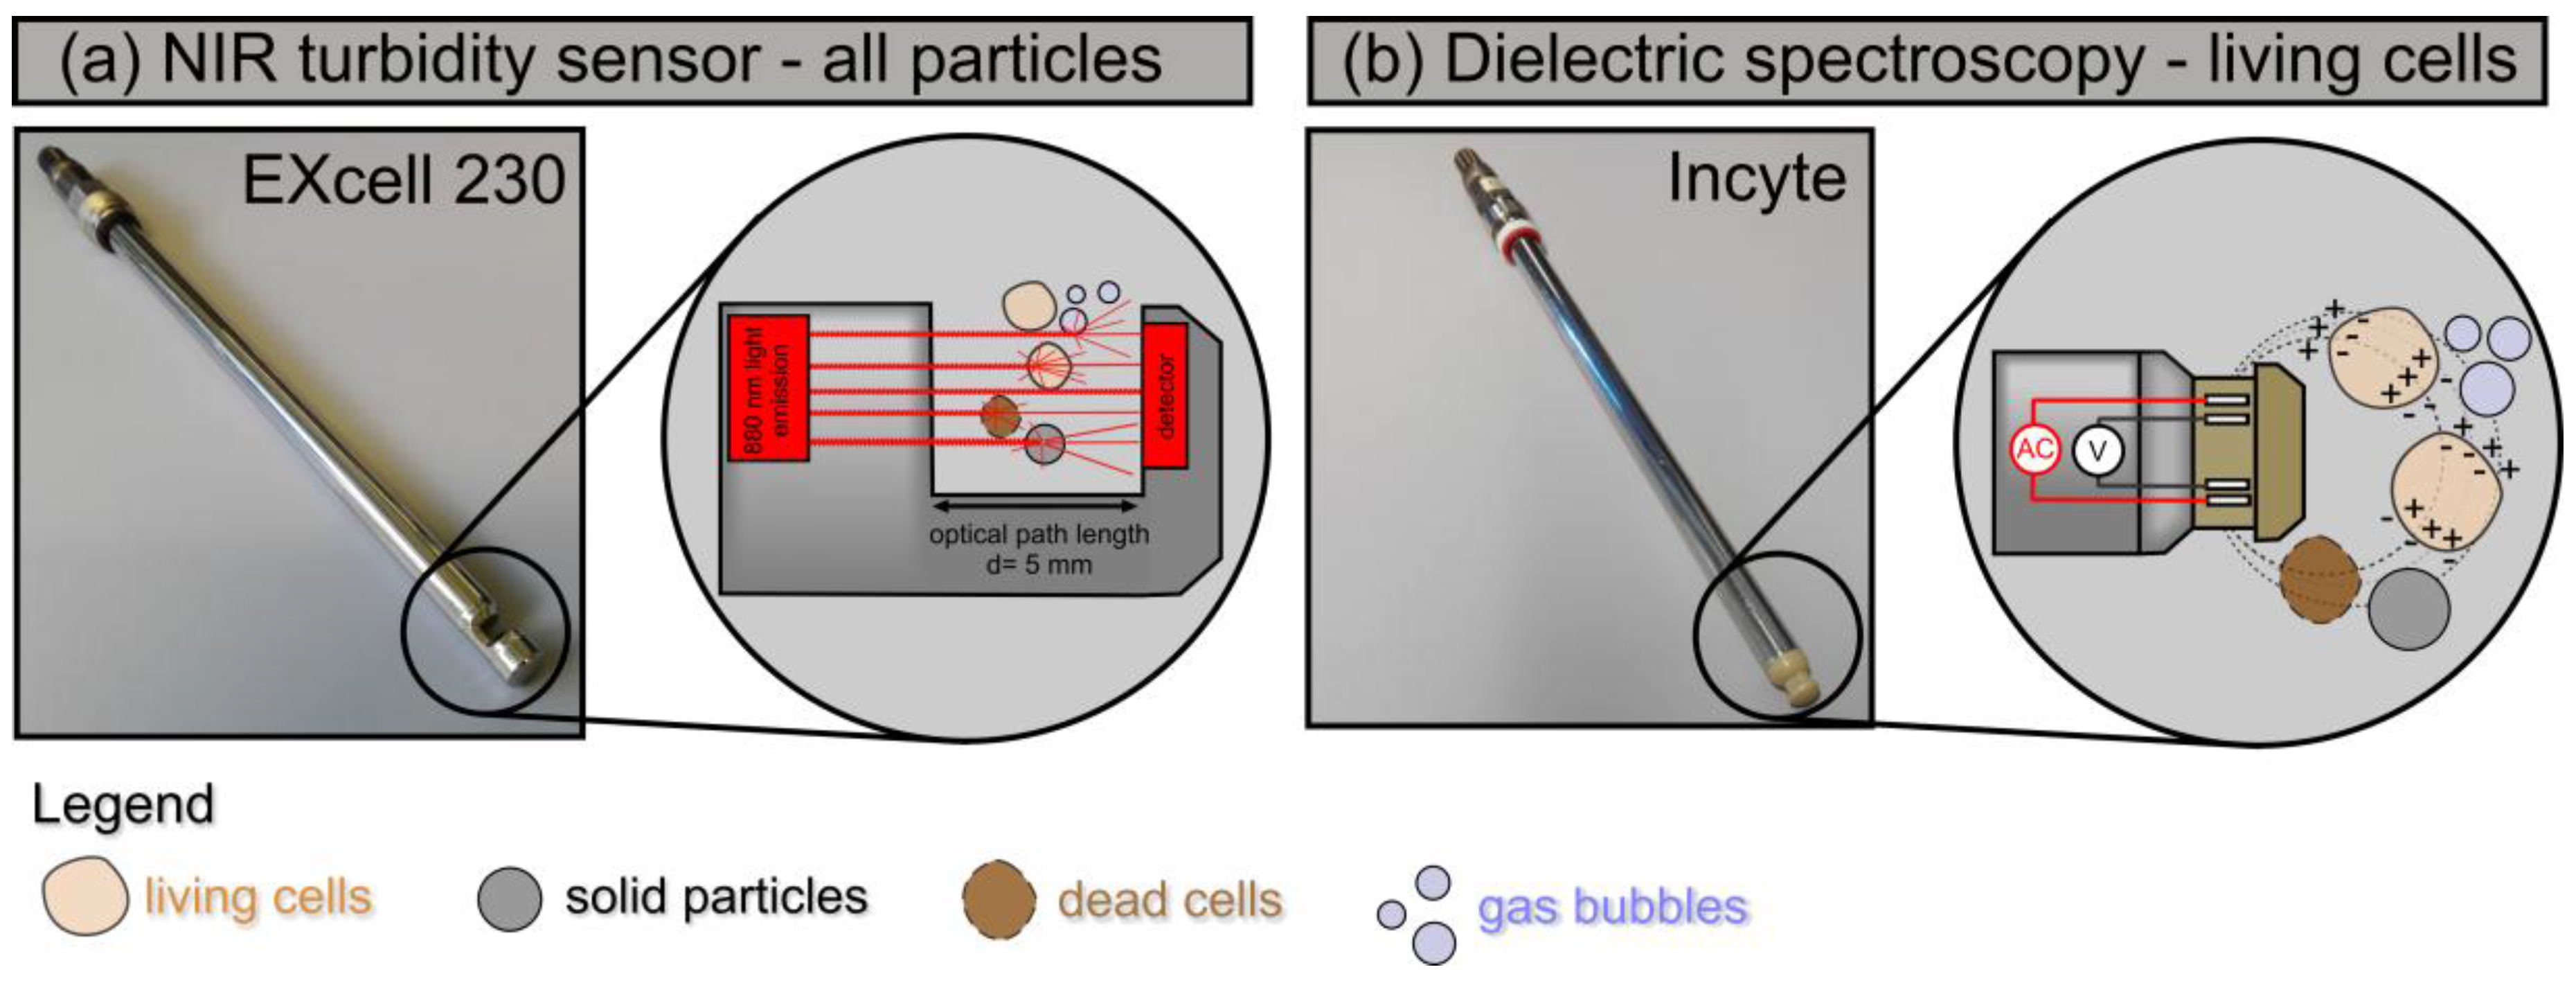
2.1. NIR Turbidity Sensor ExCell 230 and Dielectric Spectroscopy with the Incyte Sensor
2.2. Experimental Equipment for Cell Cultivation
2.2.1. Cell Culture and Strain Maintenance
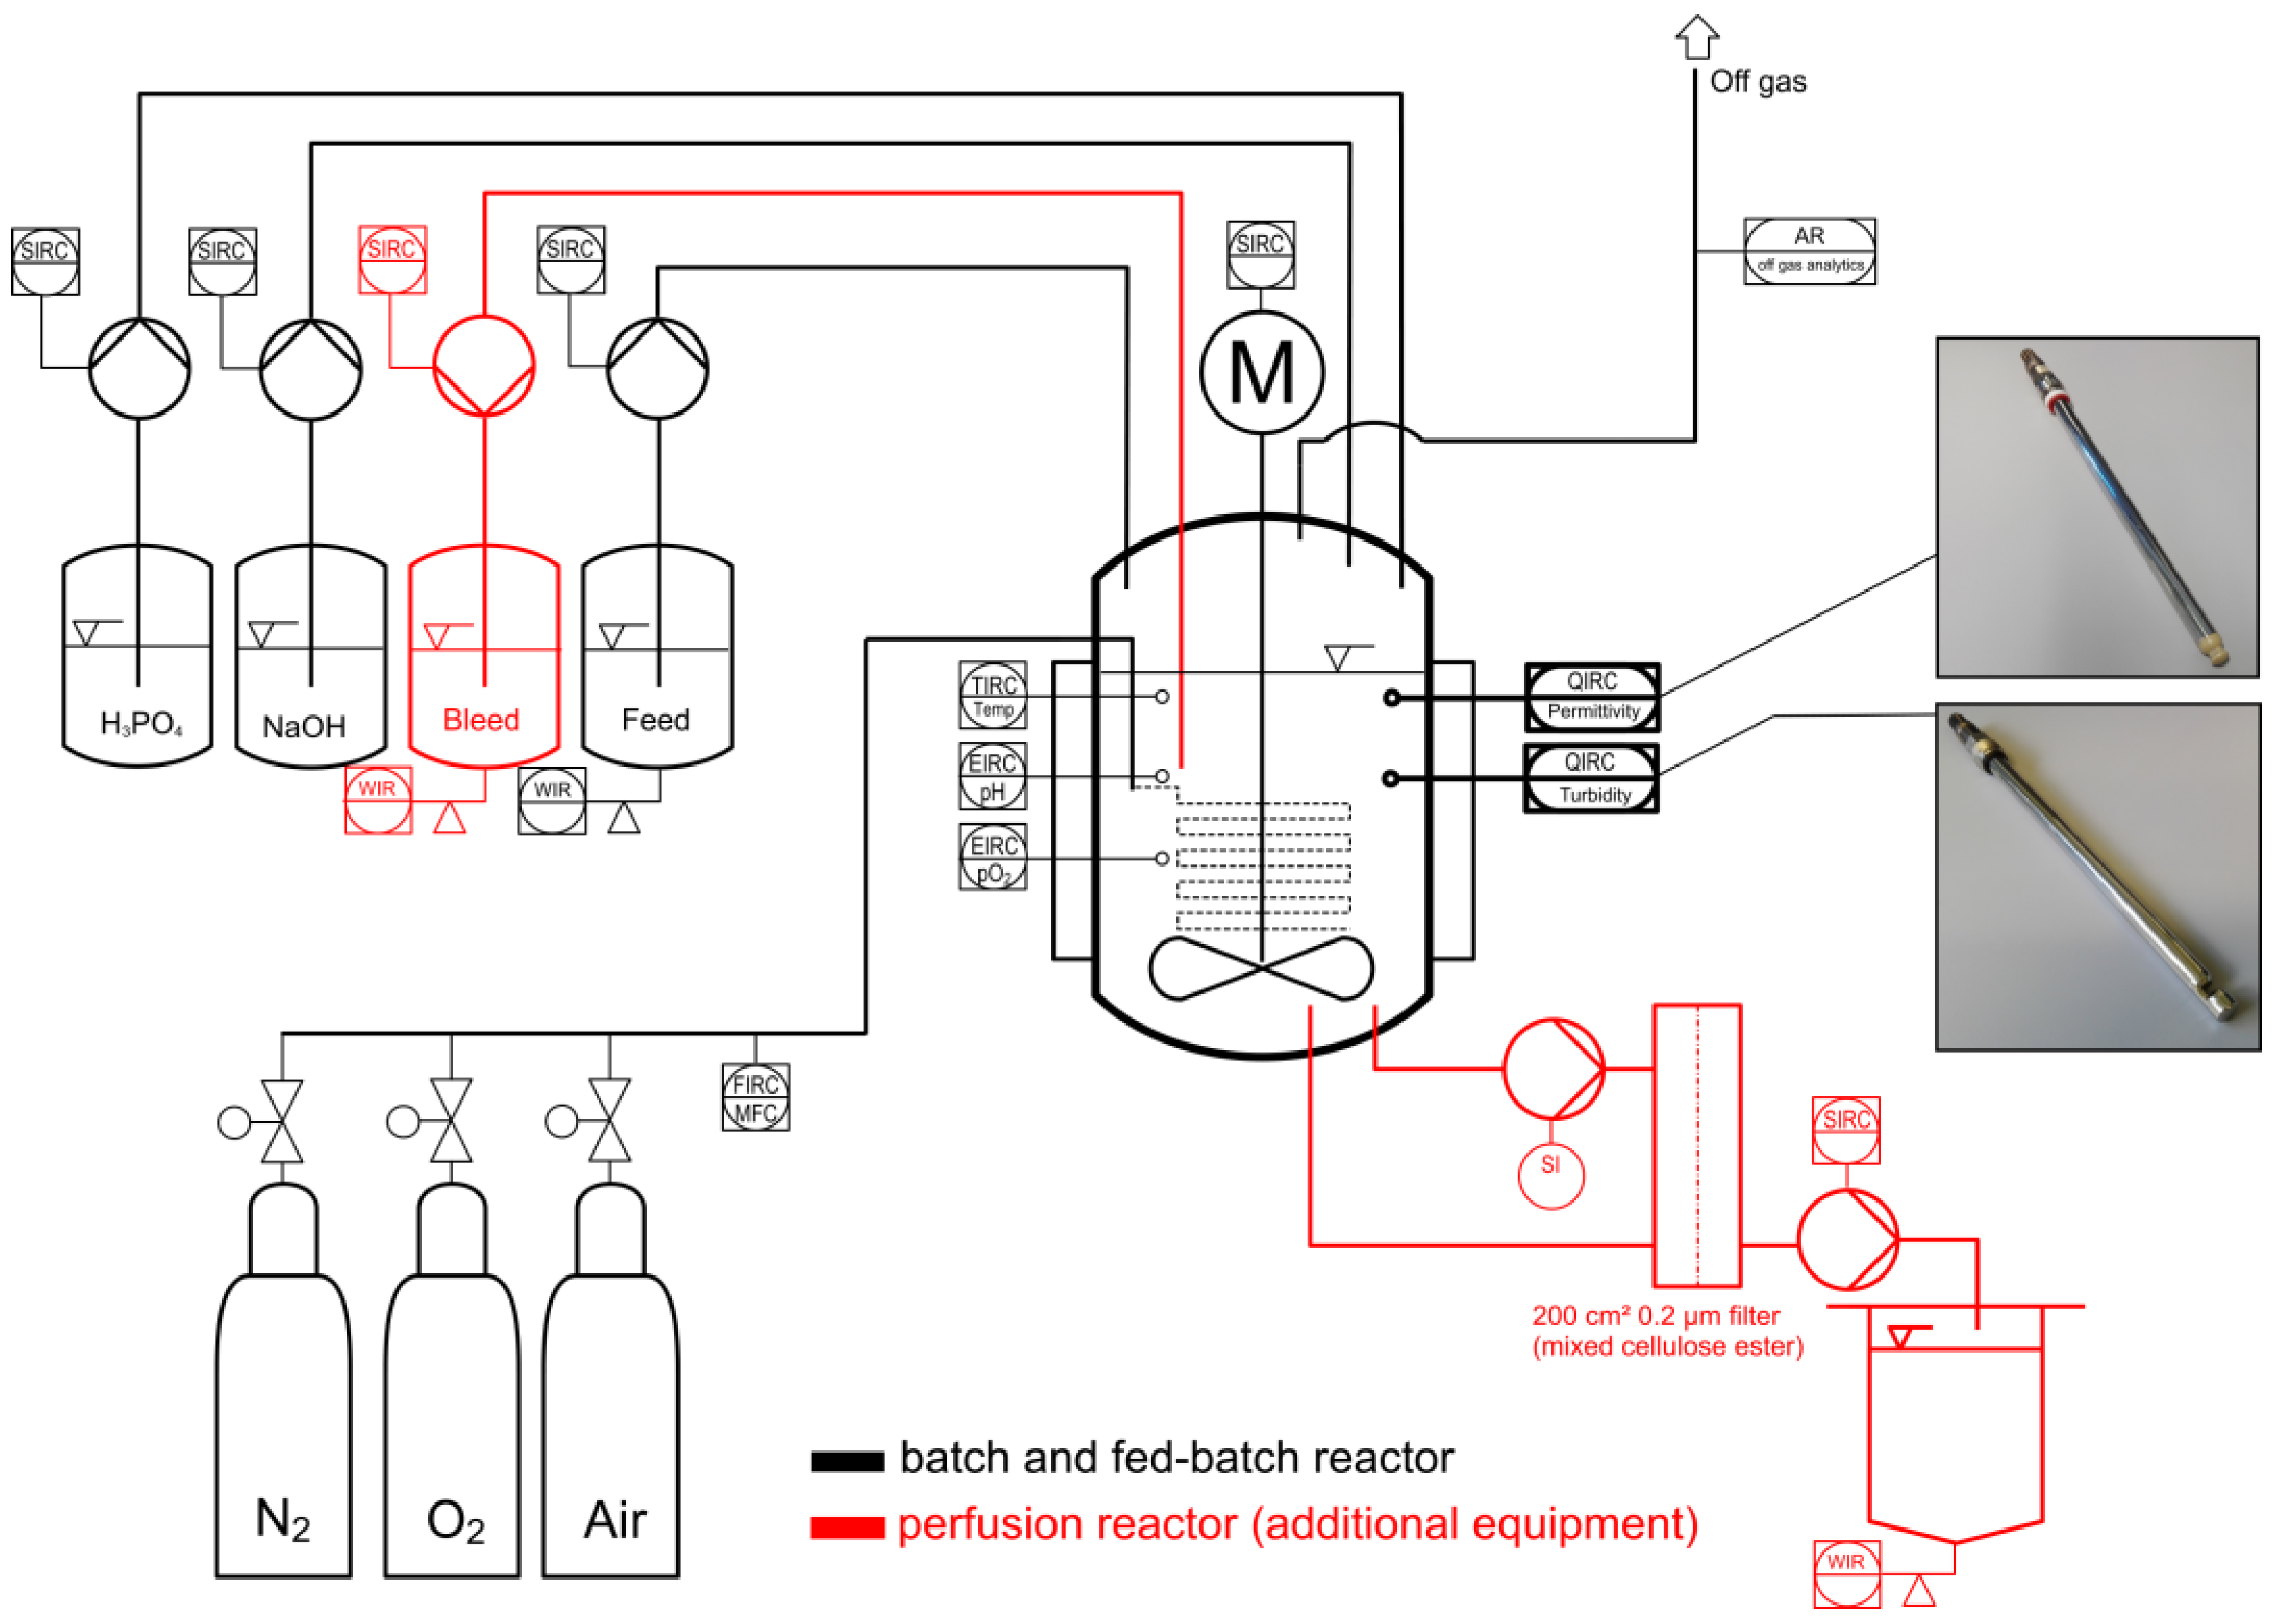
2.2.2. Bioreactor Setup
2.2.3. Parallel Measurement of Turbidity and Permittivity in a Controlled Model Environment
2.2.4. Offline Process Analytics
2.3. Data Analysis
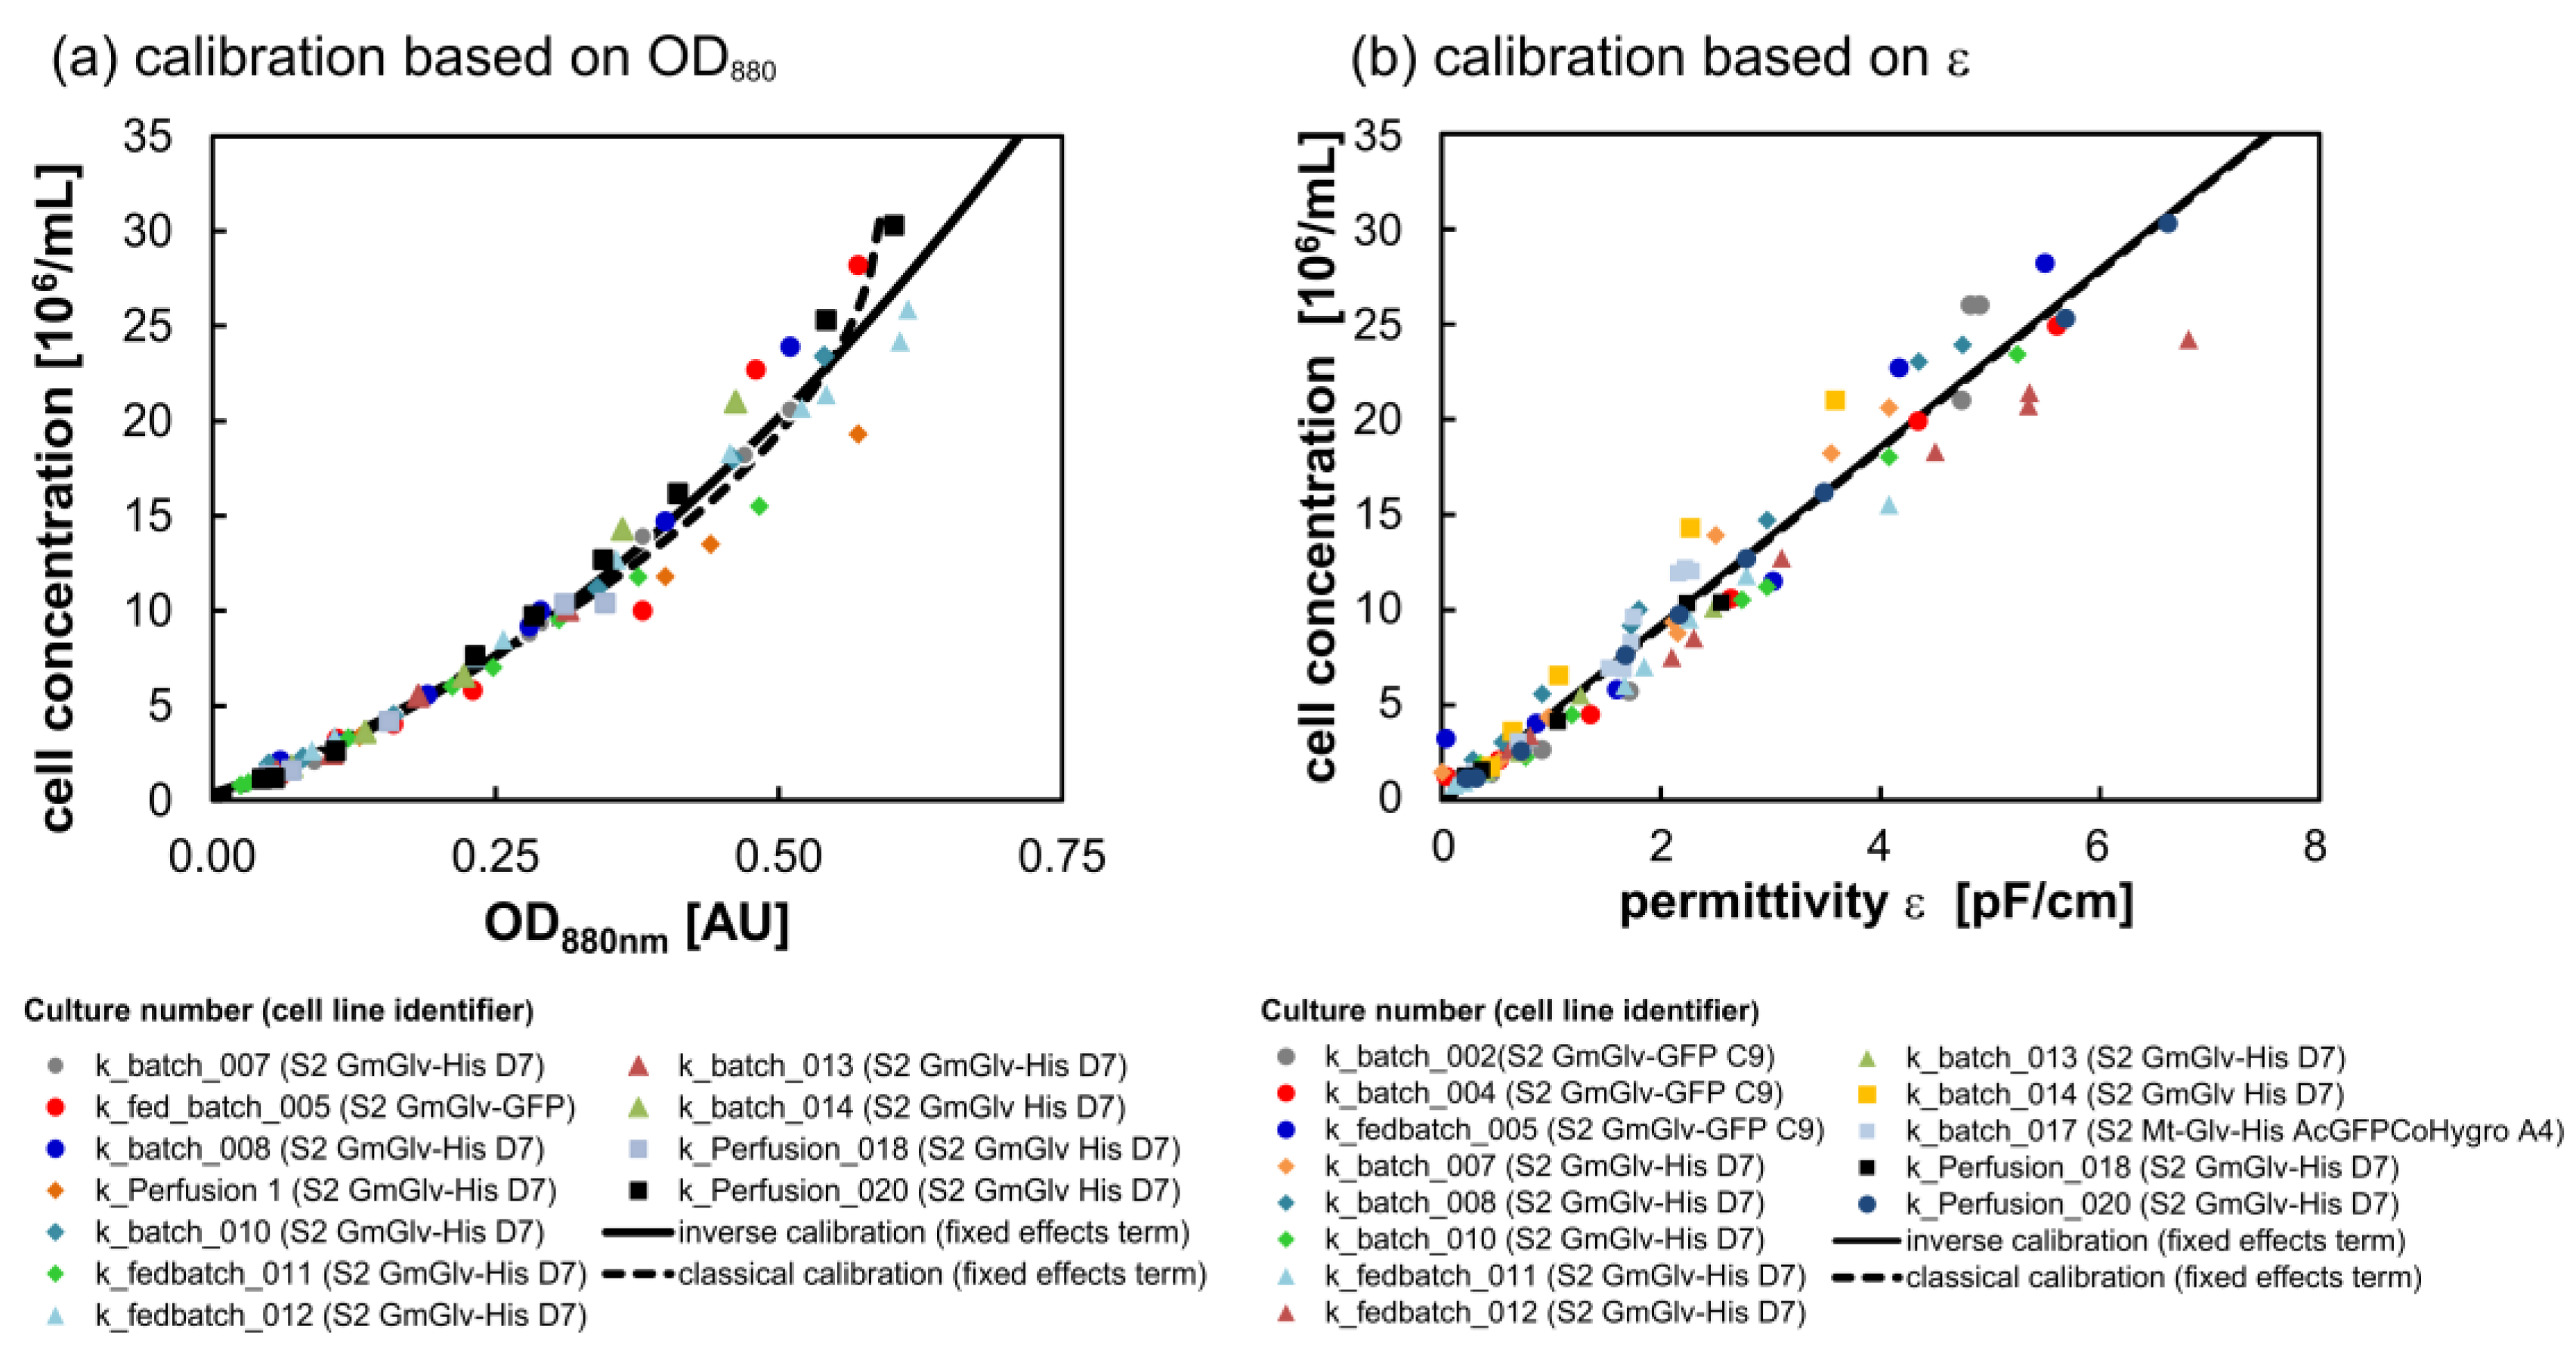
2.3.1. Calibration
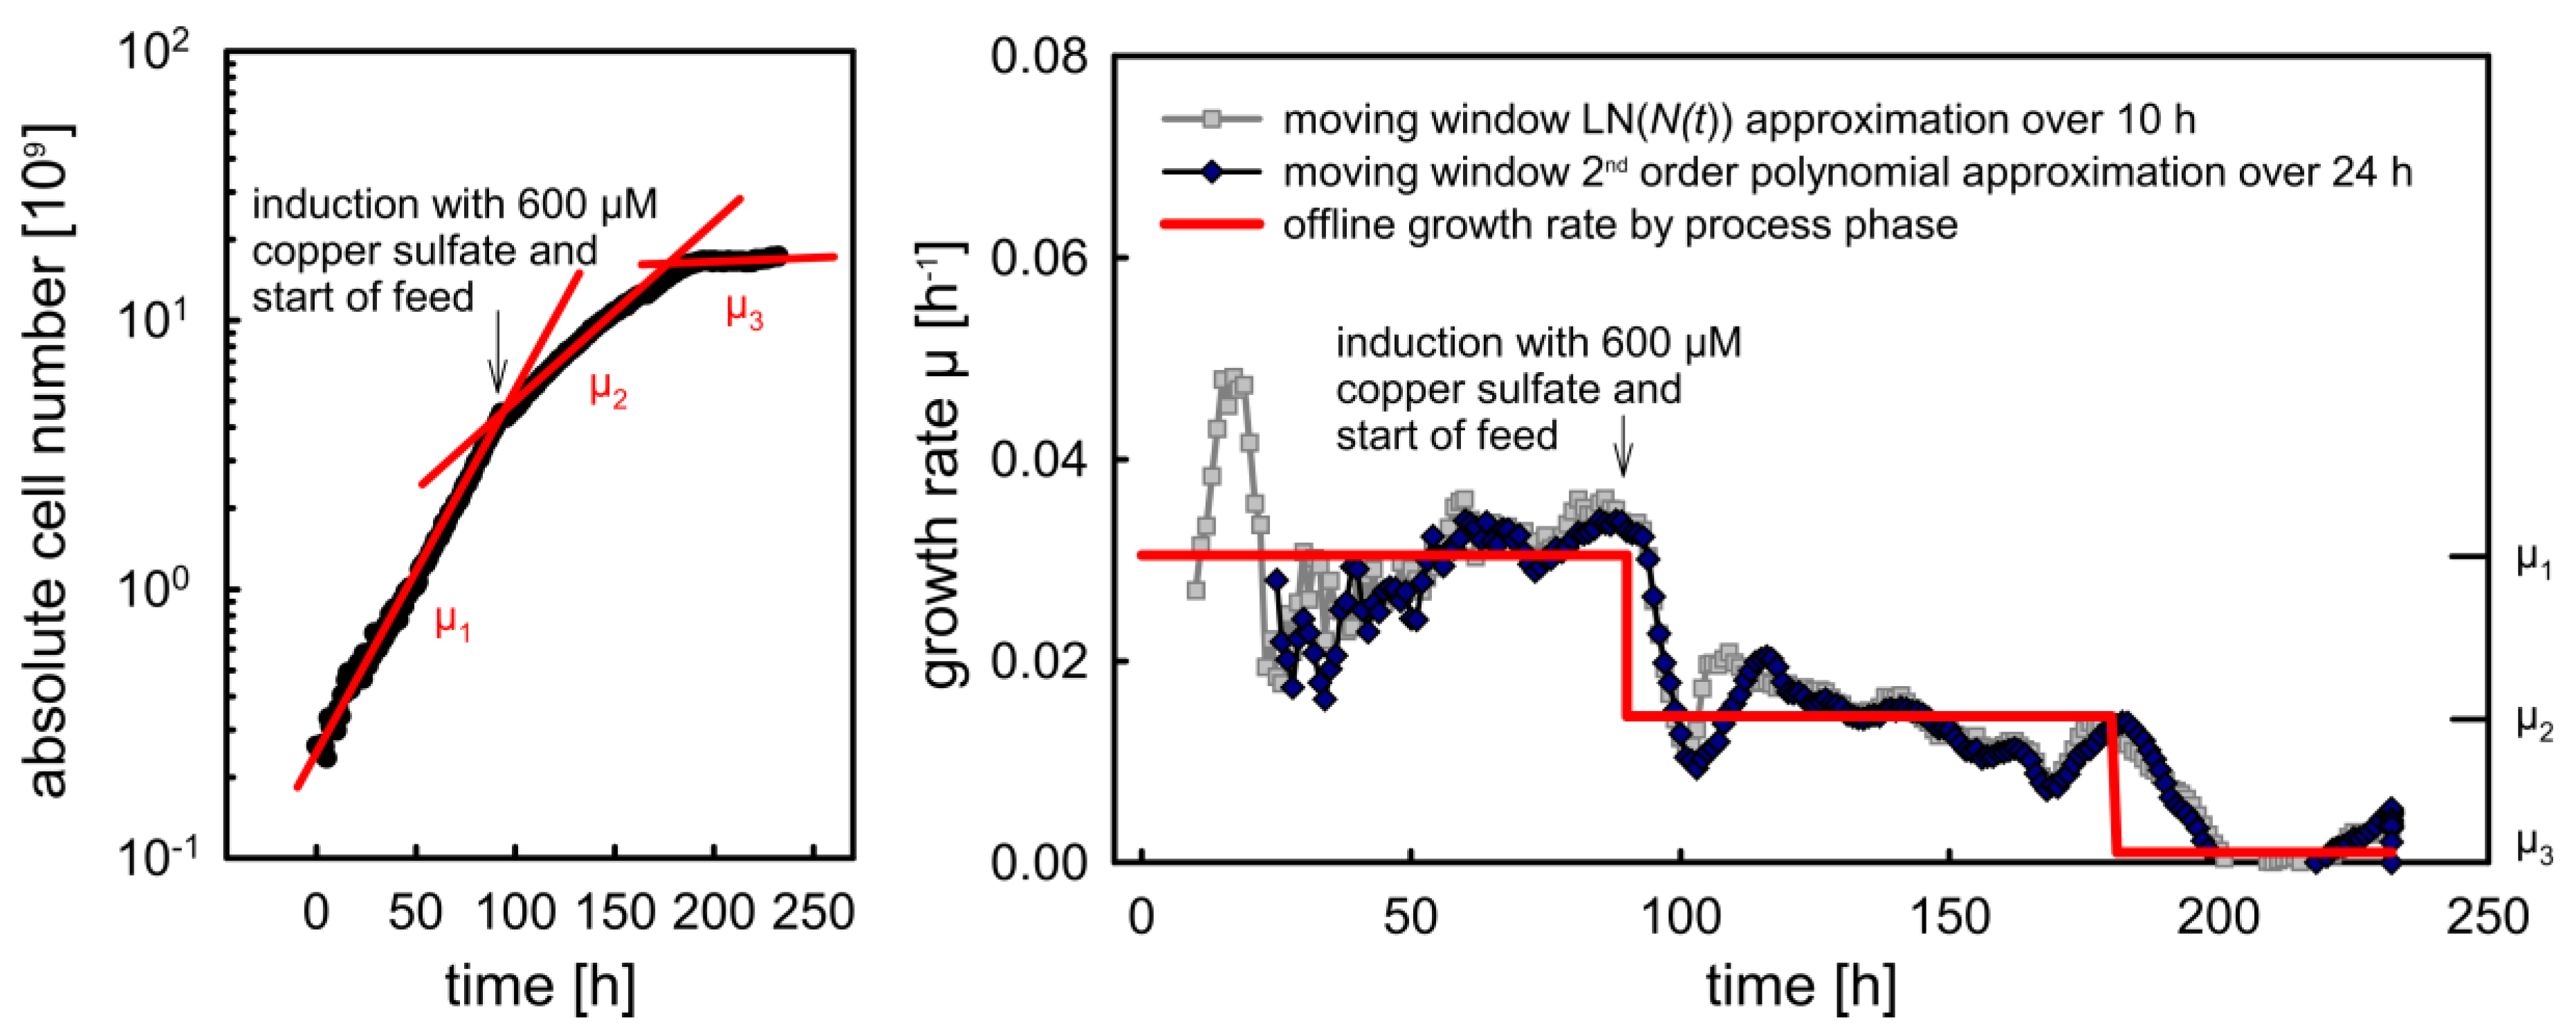
2.3.2. Calculation of the Specific Growth Rate
3. Results
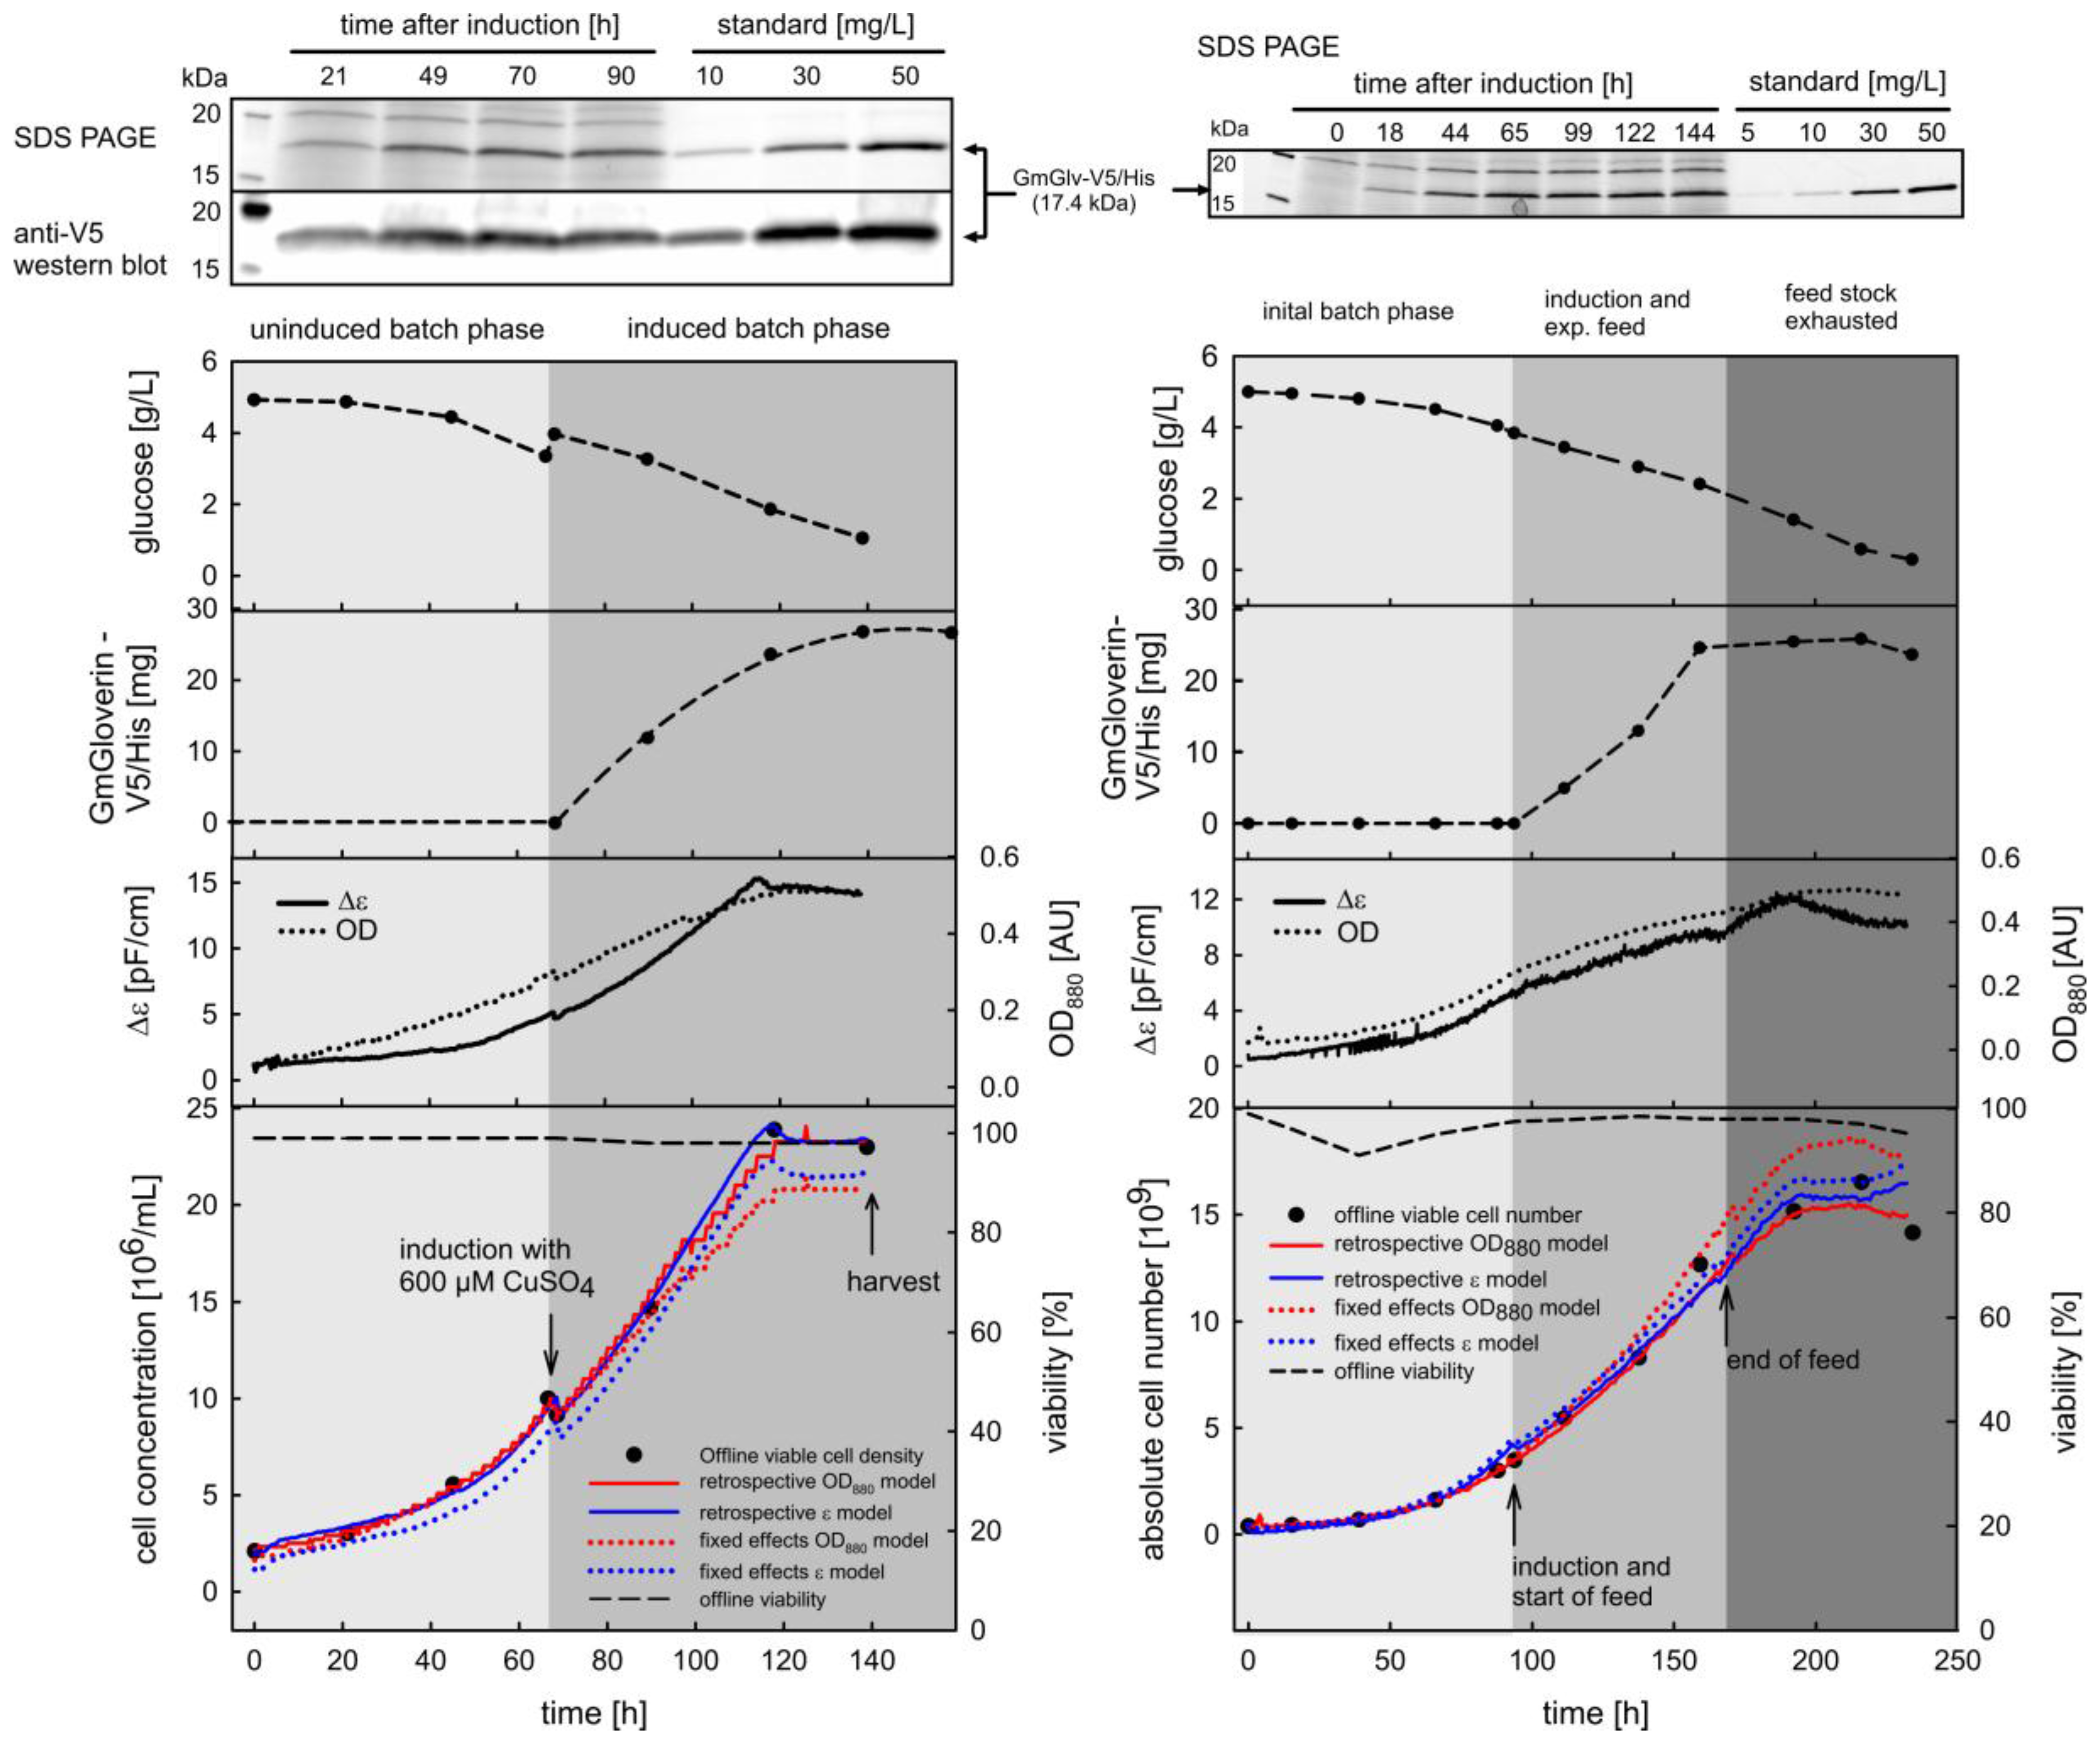
3.1. Correlation between Cell Density, Turbidity and Permittivity during Cultivation
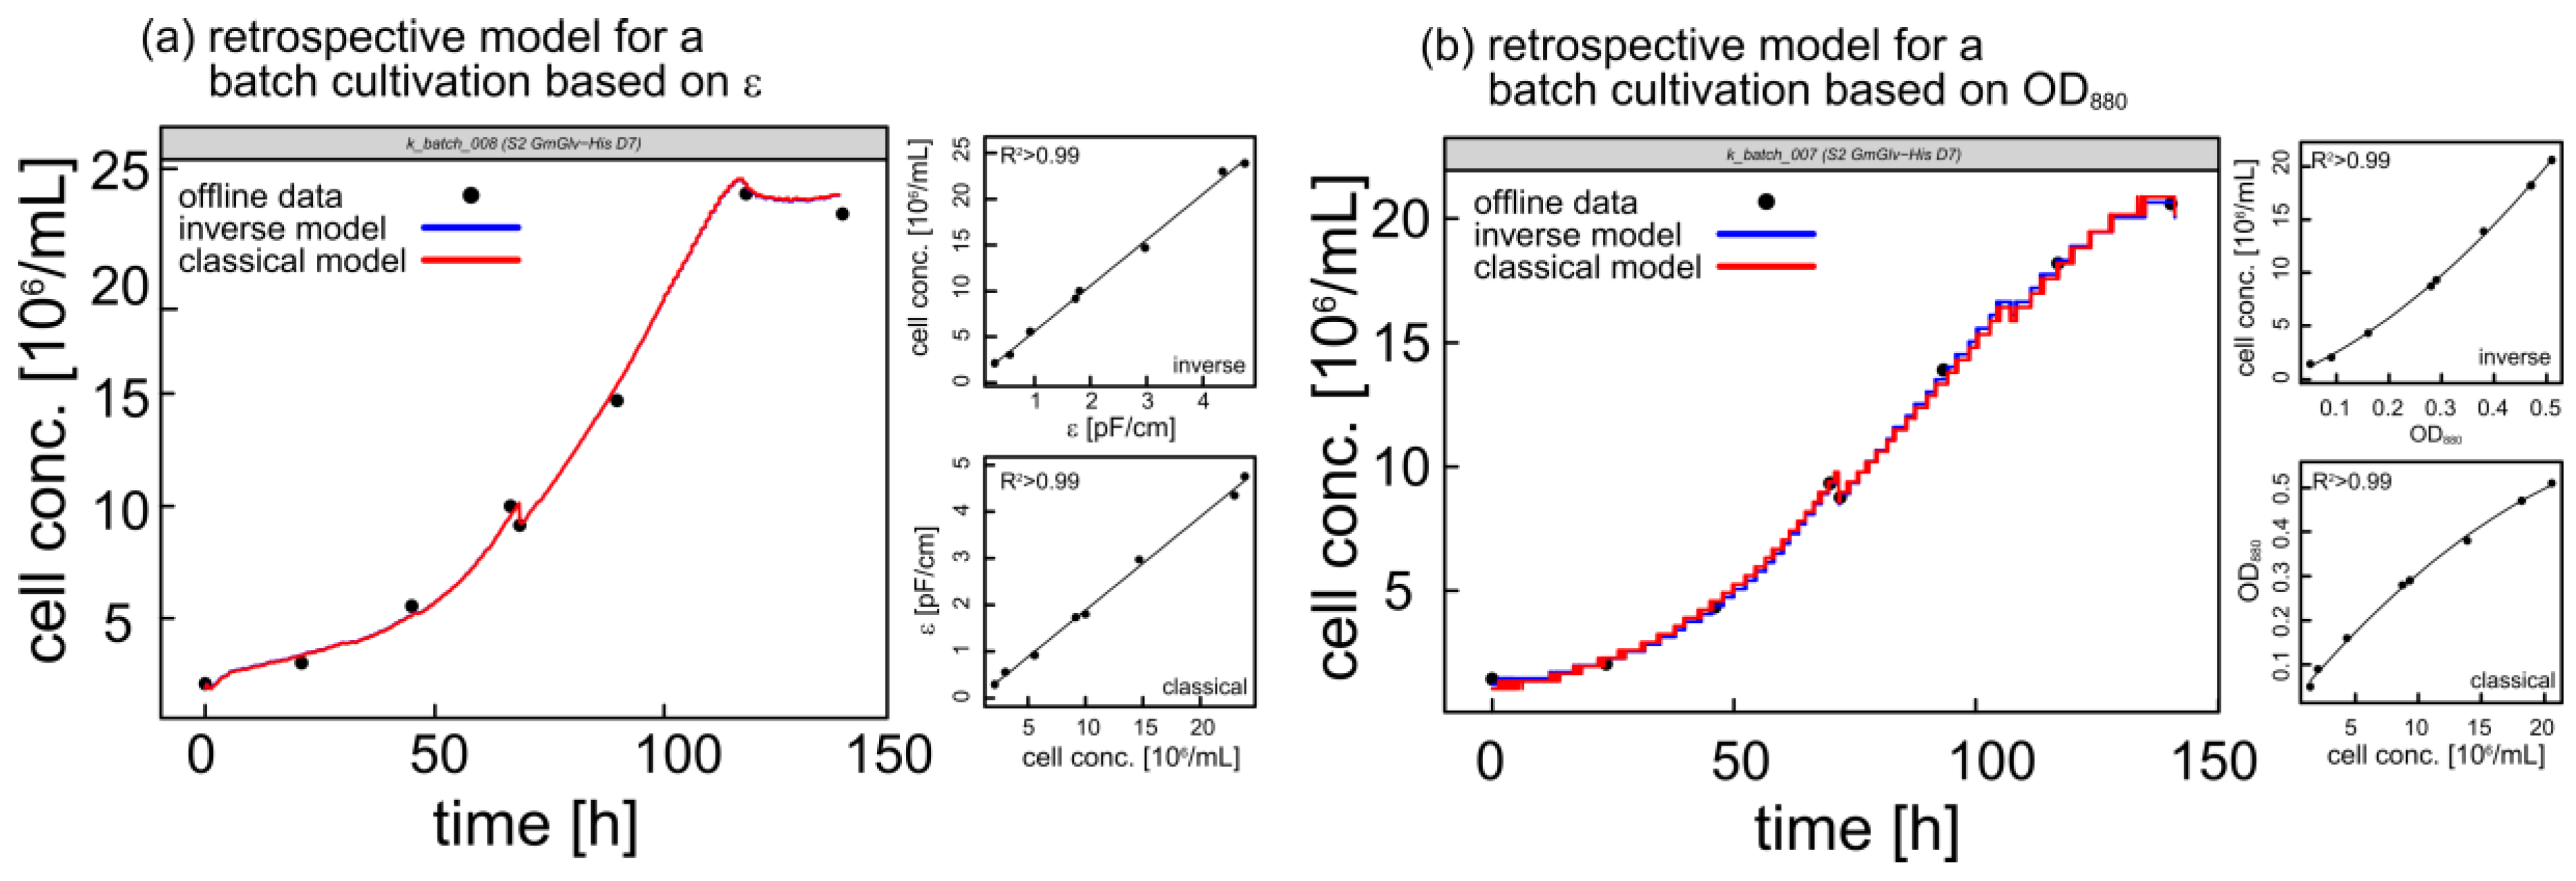
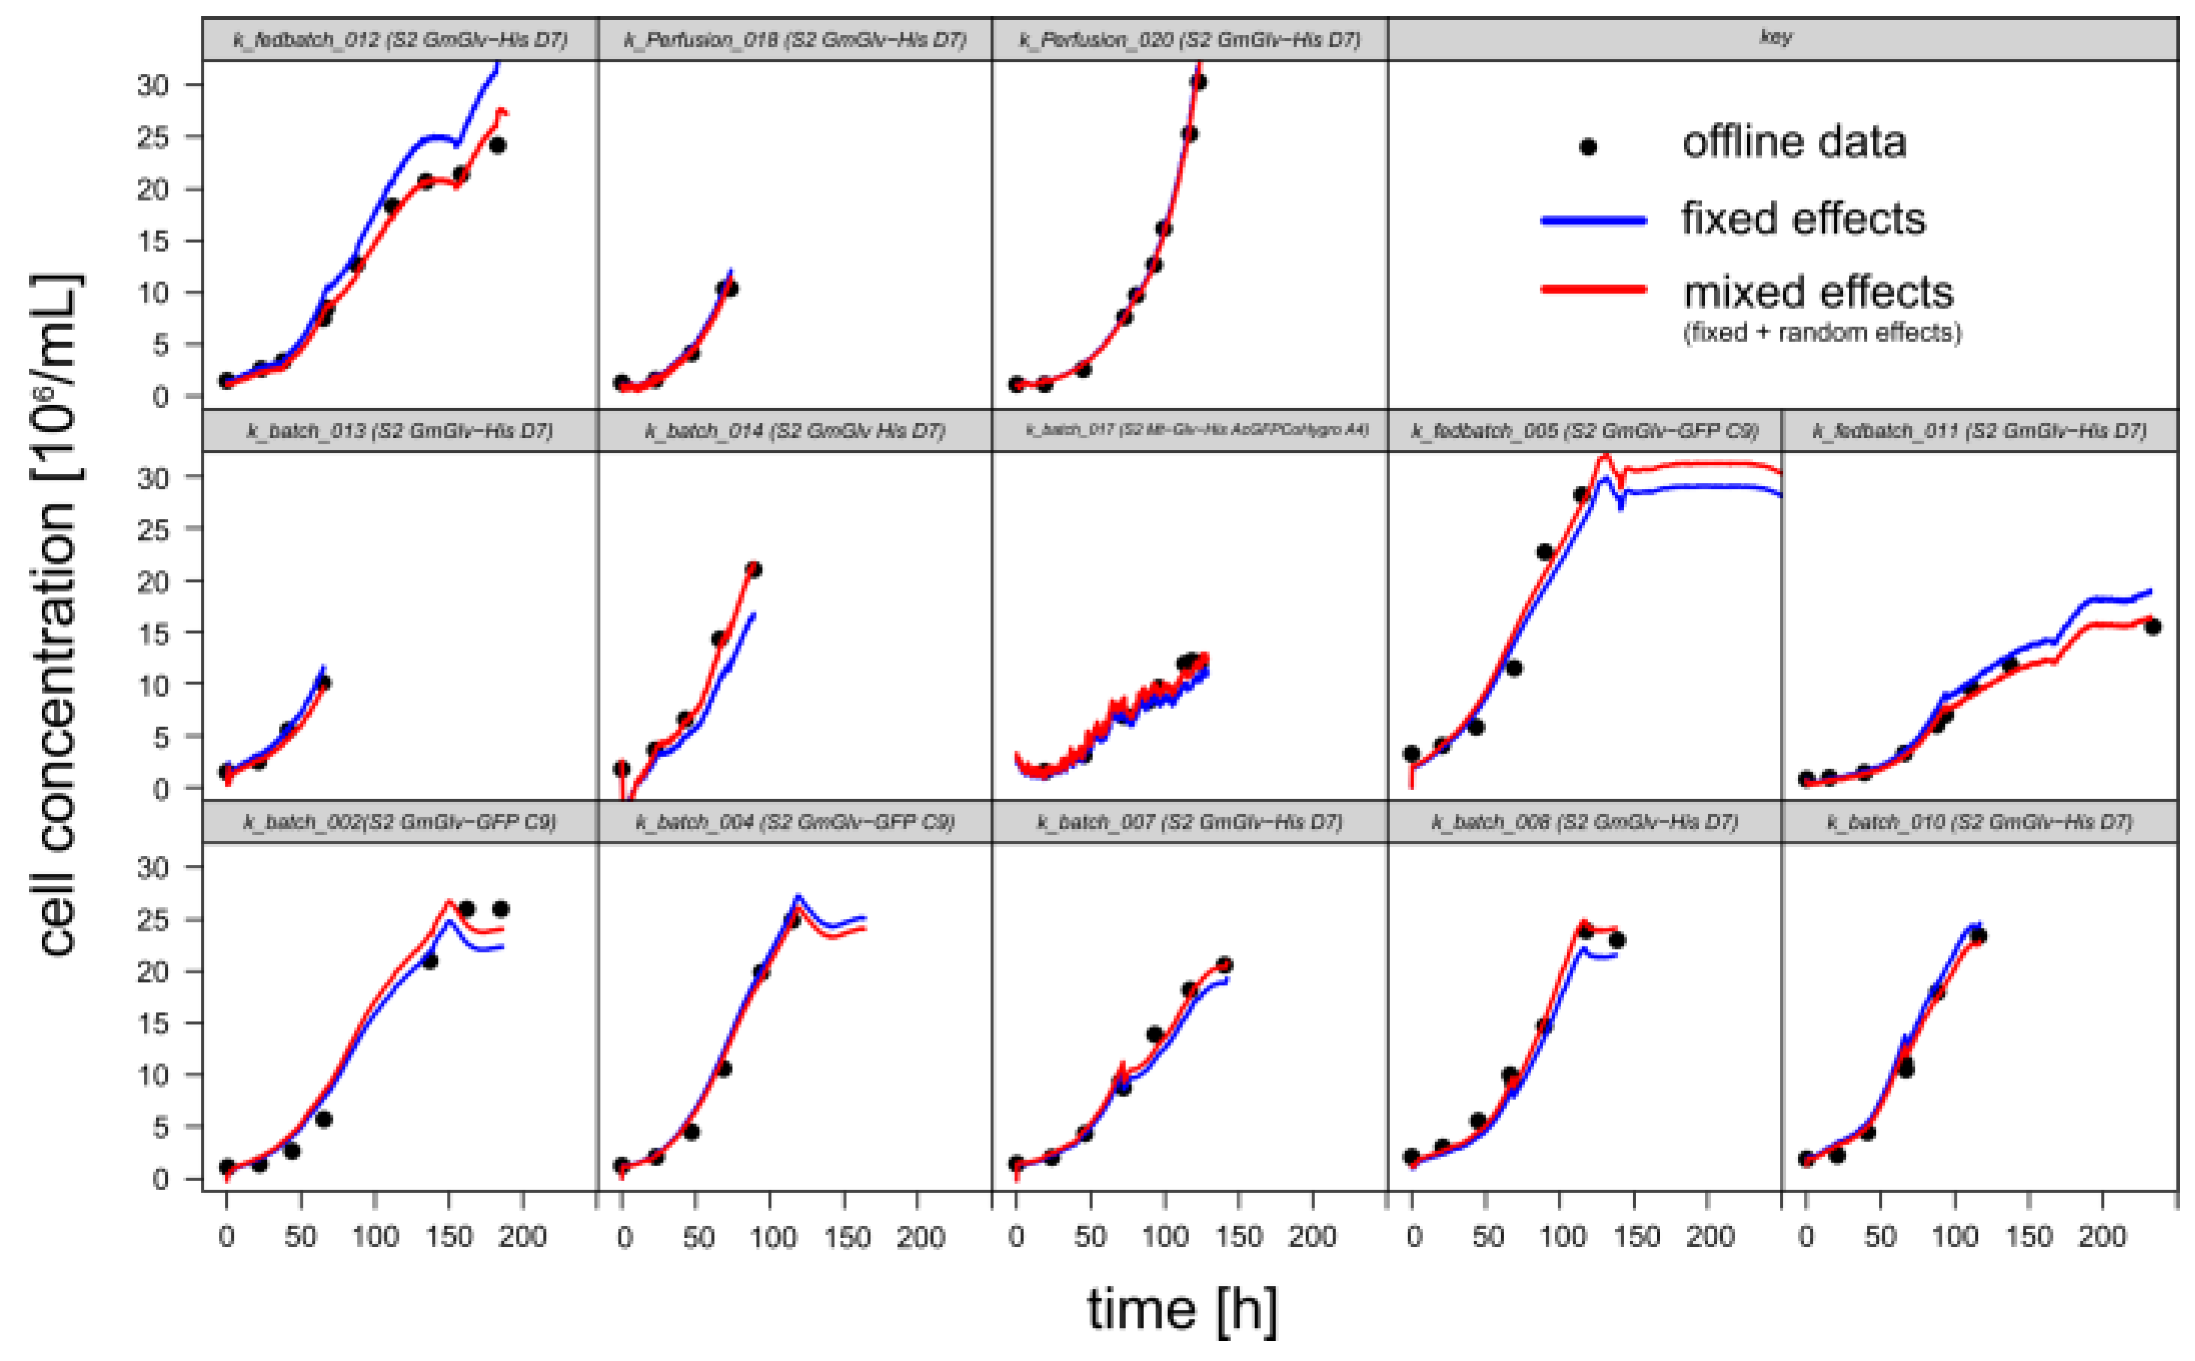
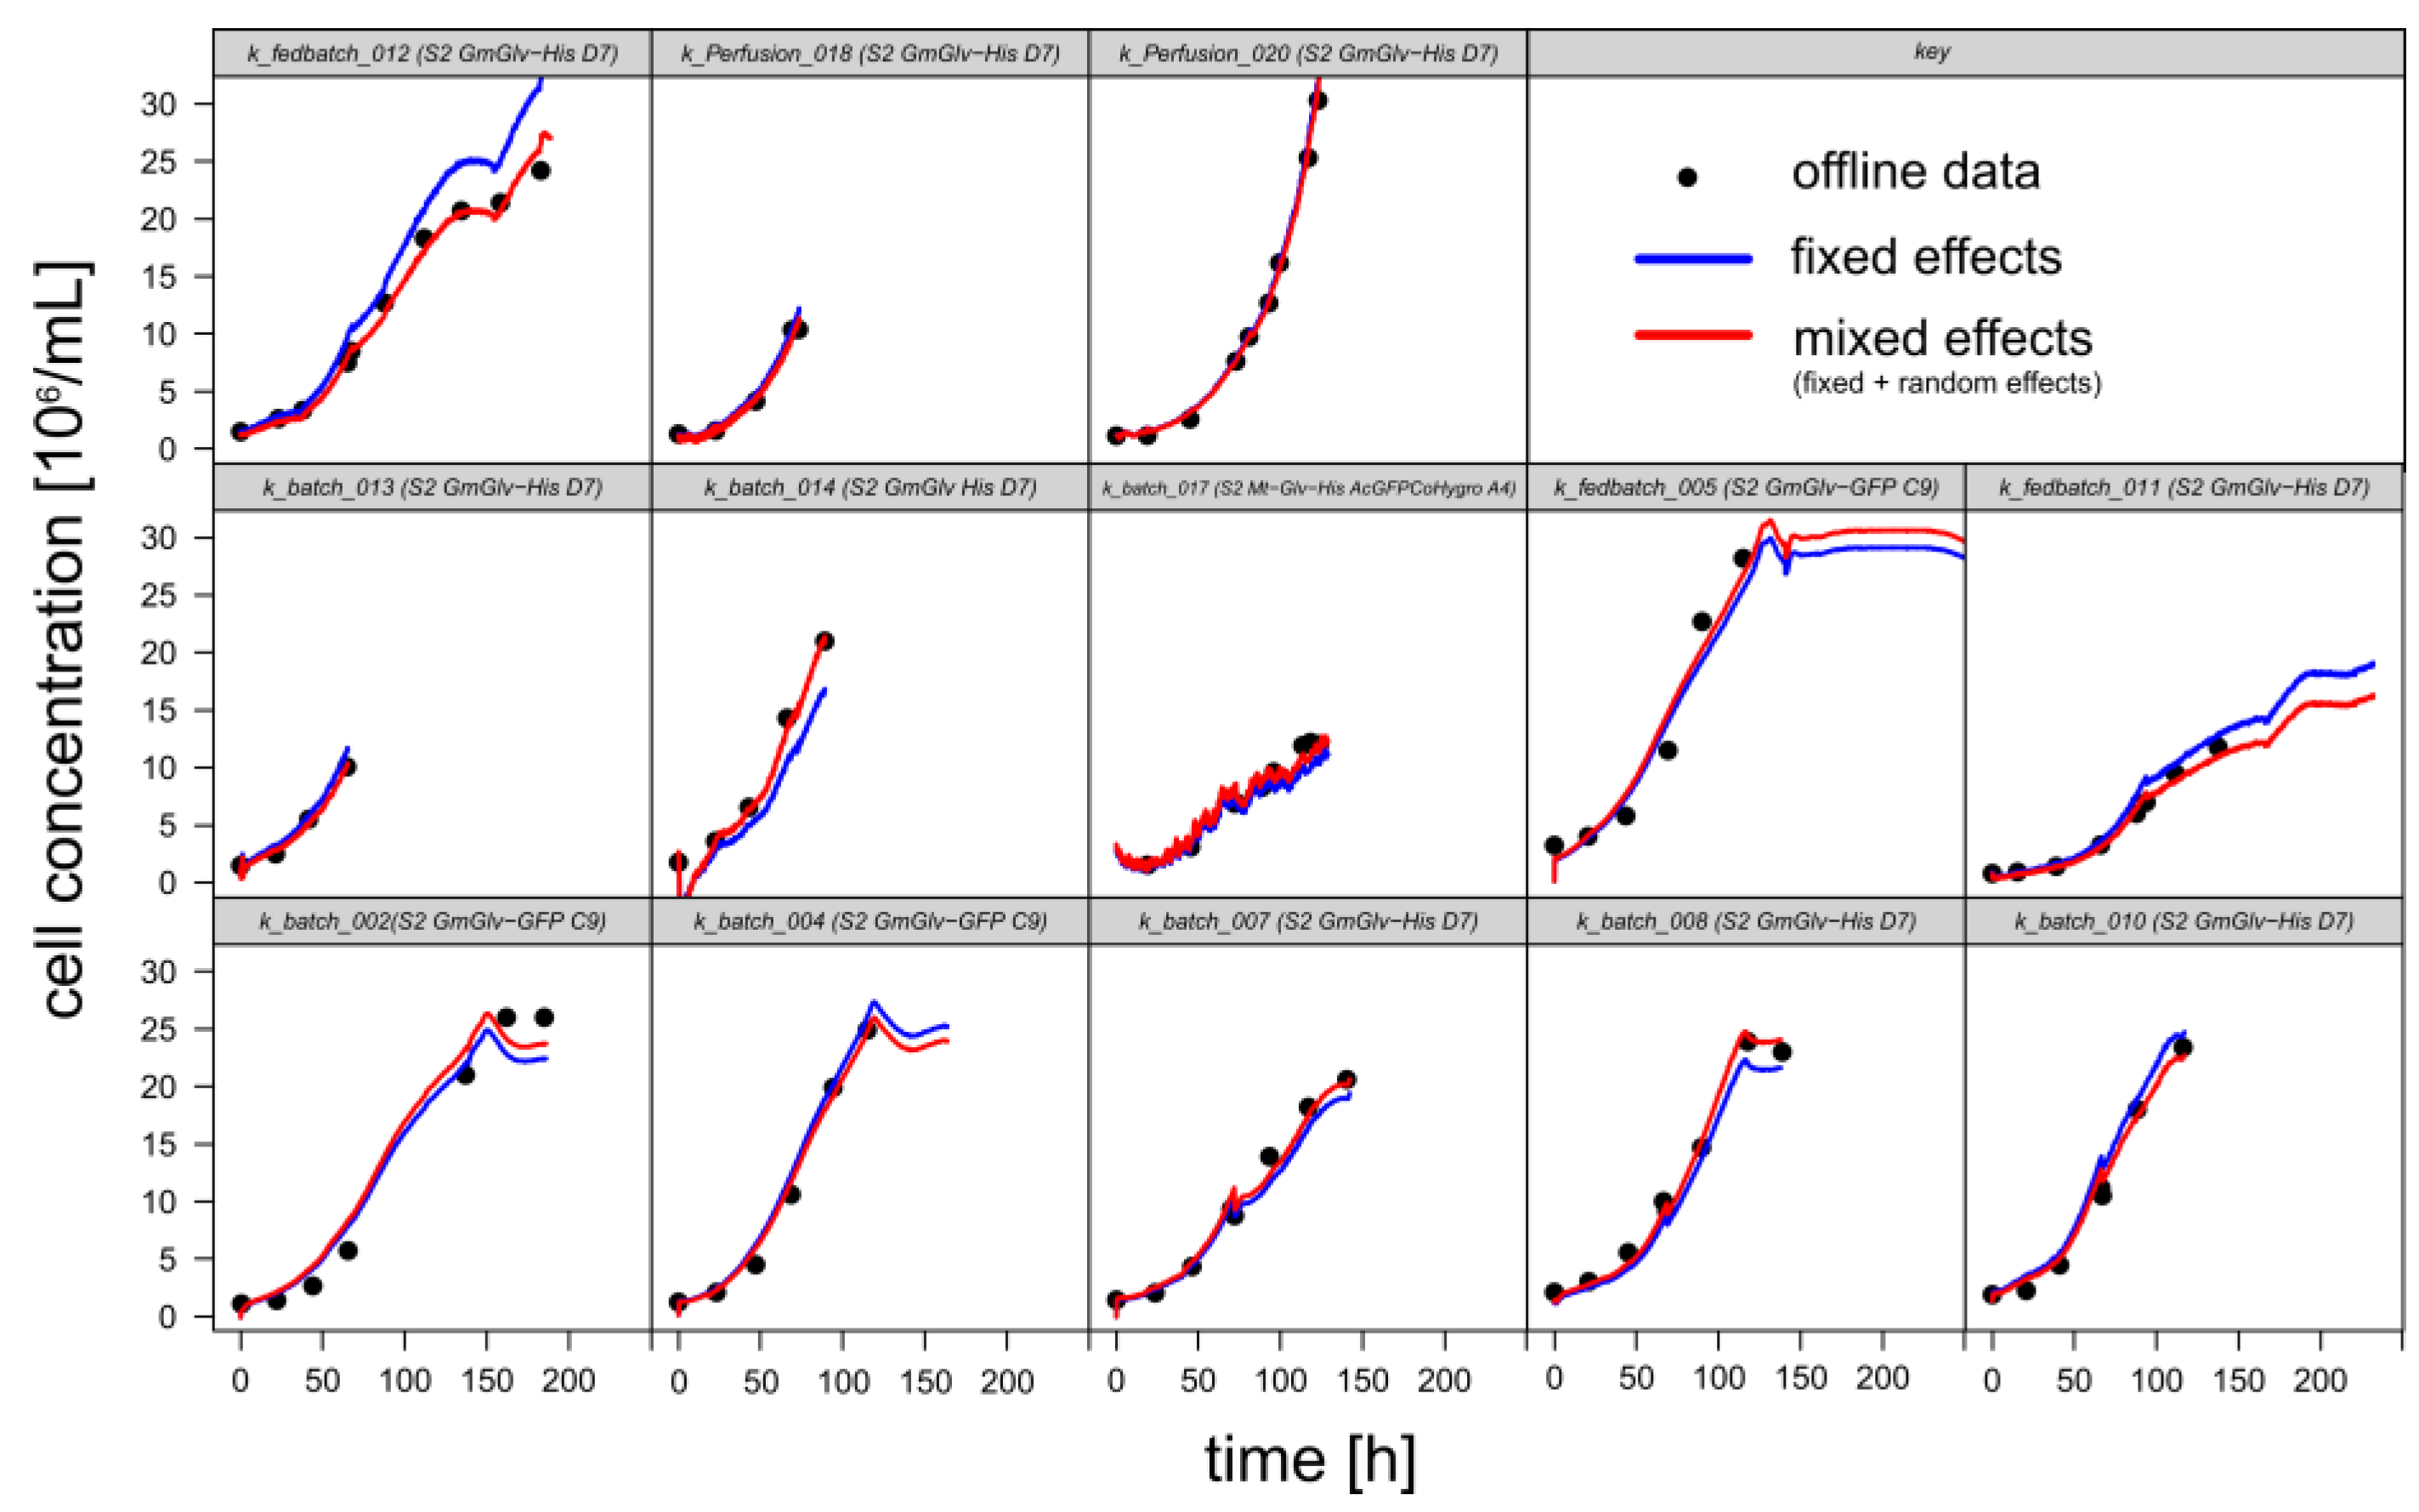
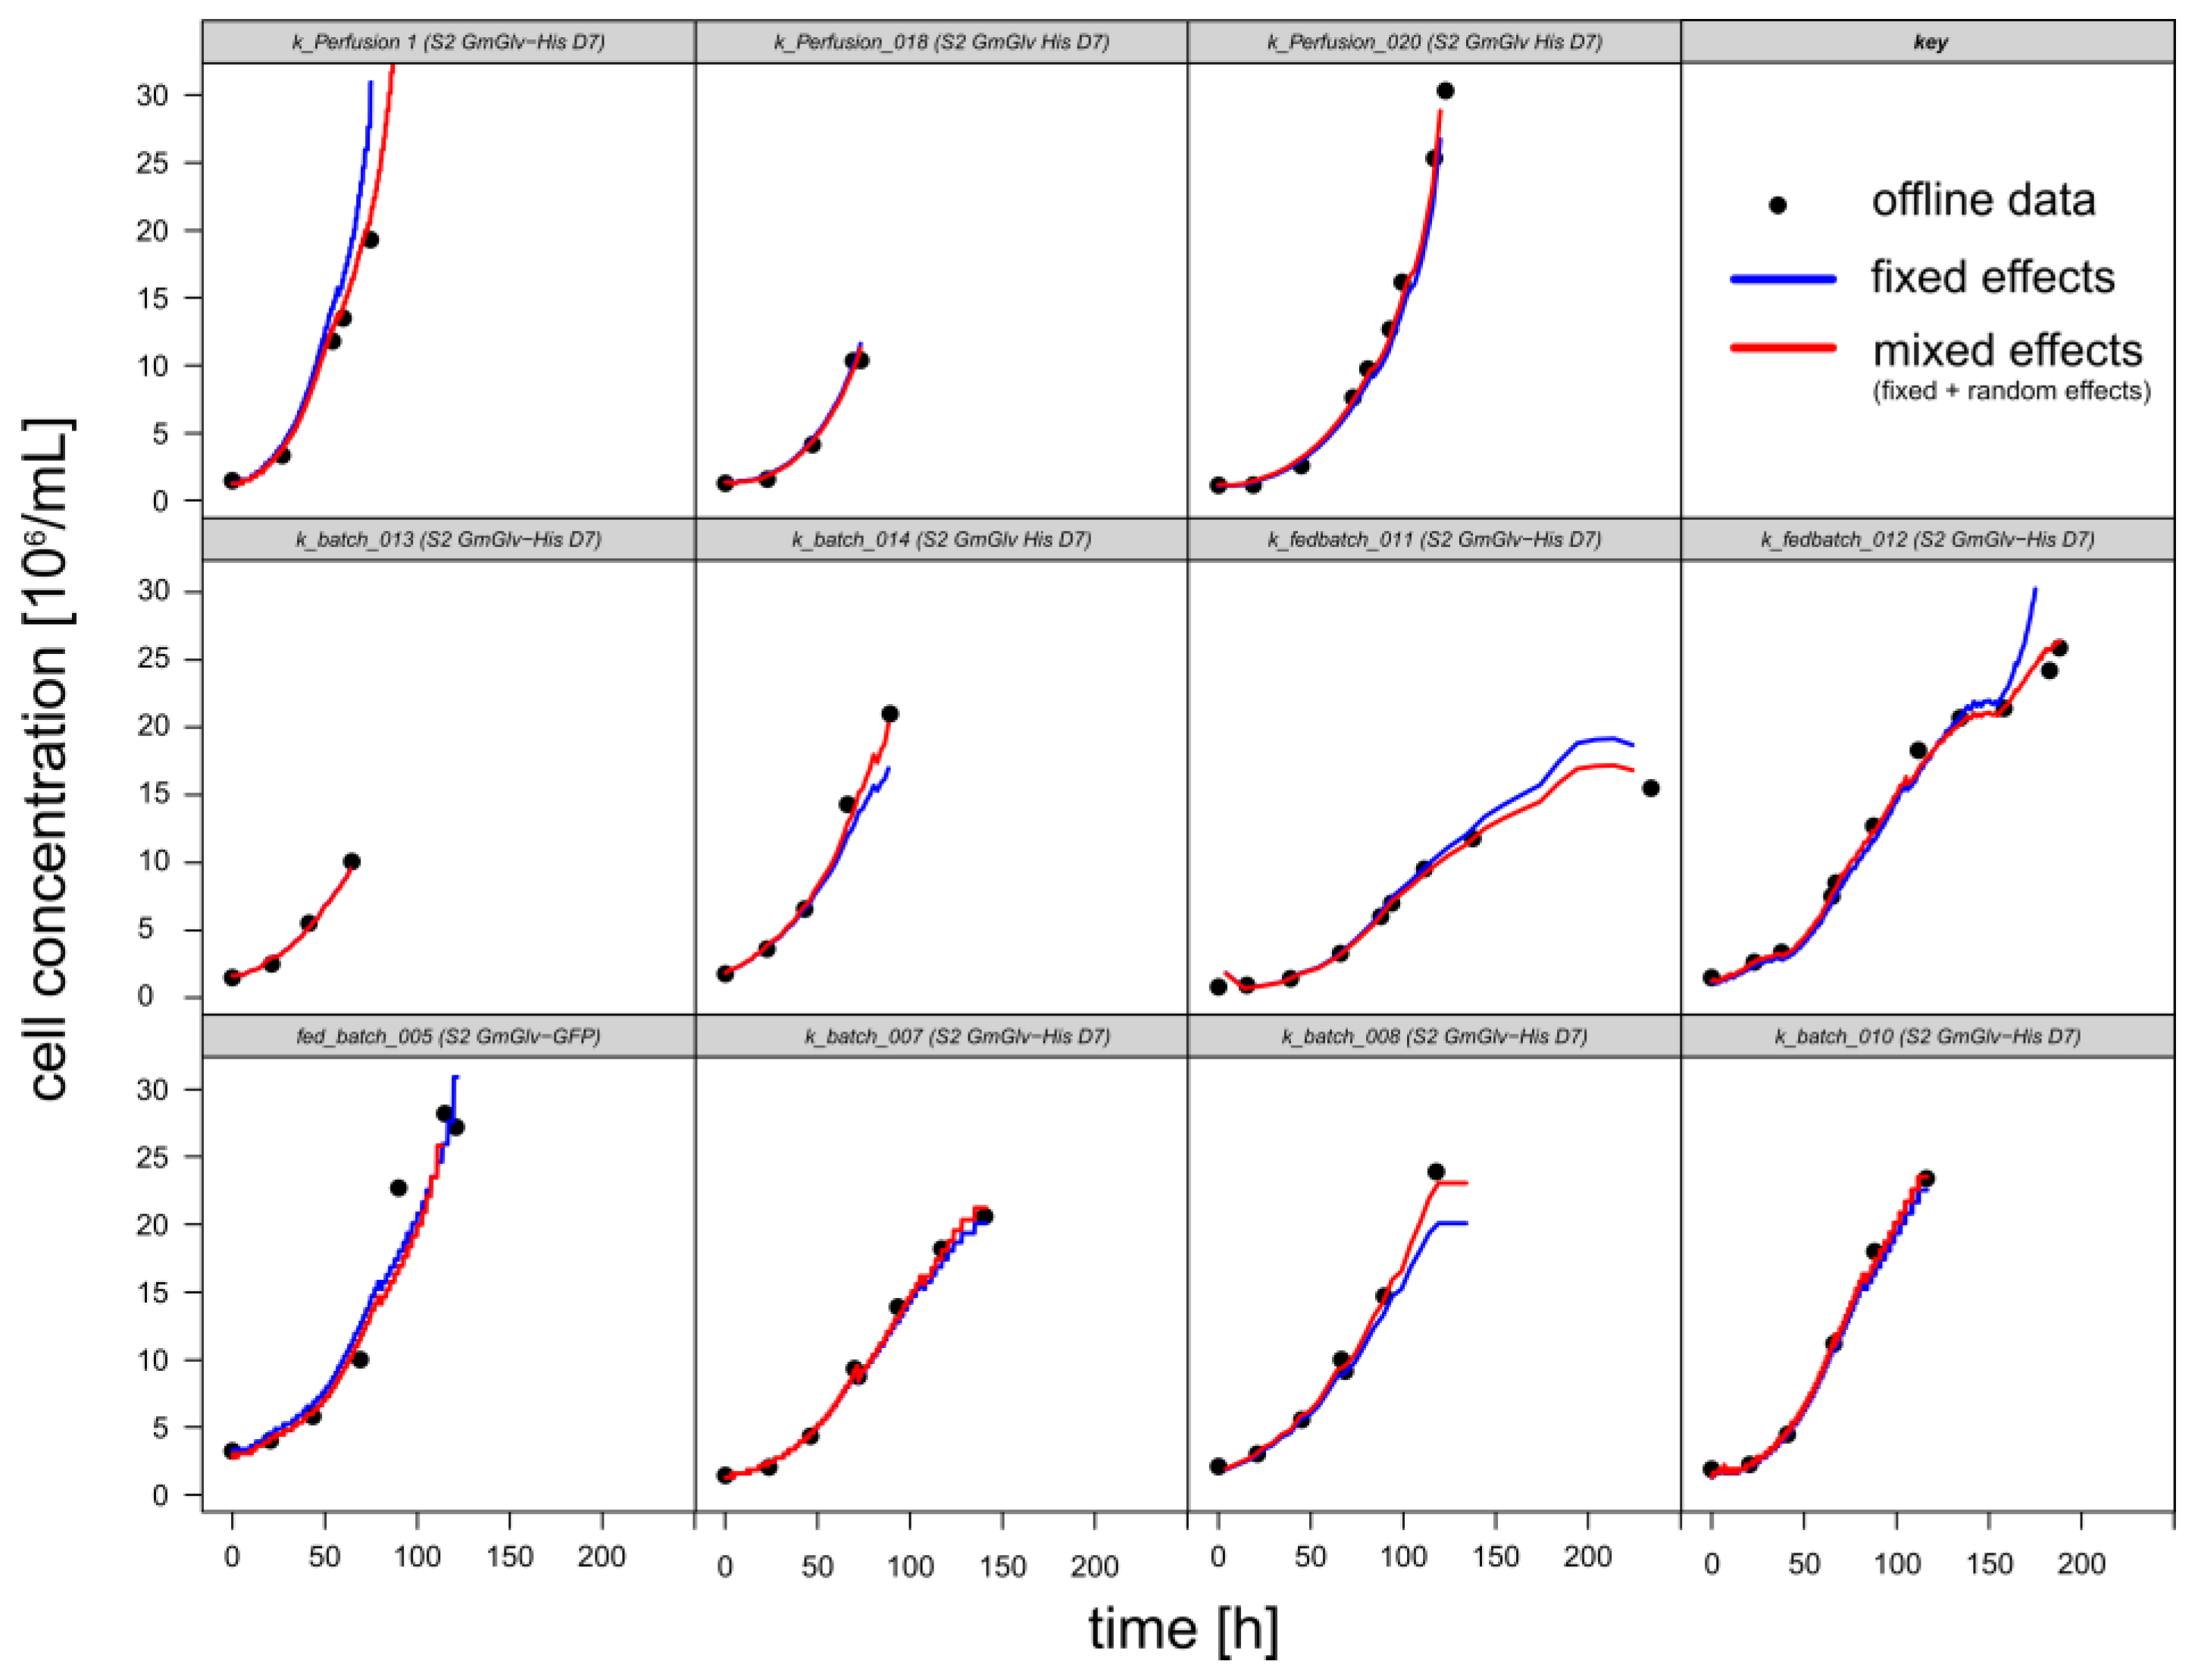
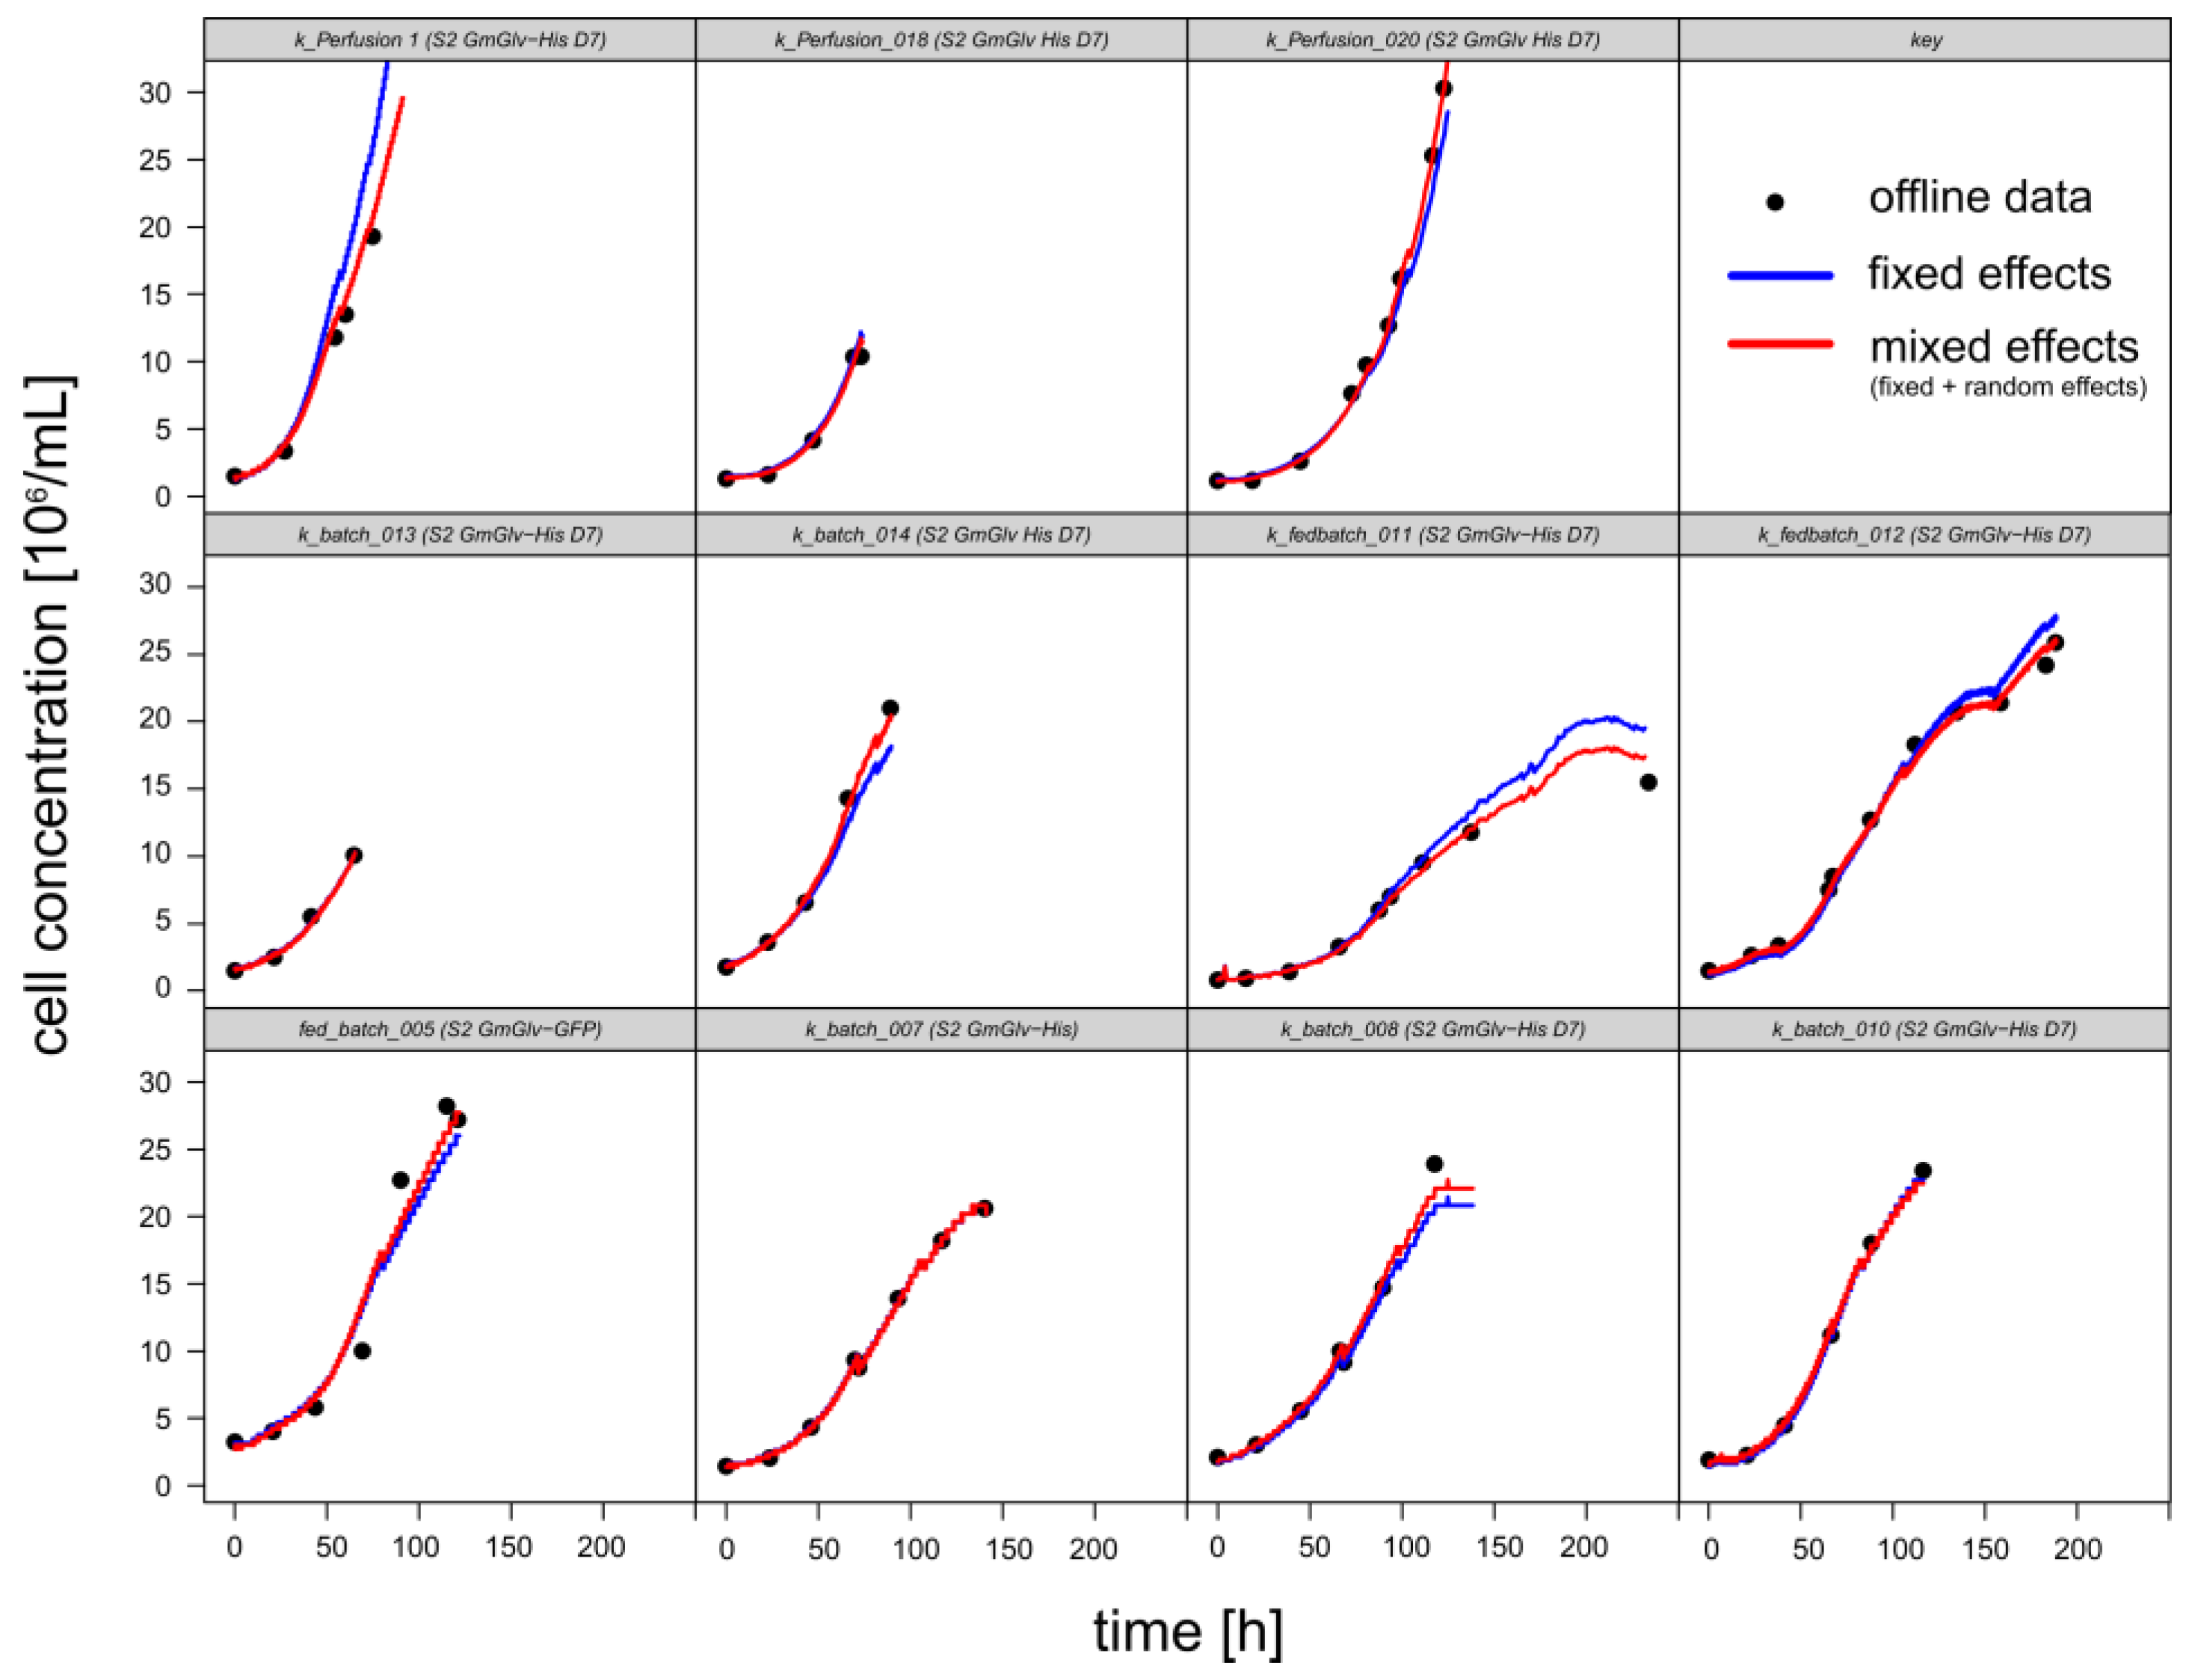
3.1.1. Retrospective Modeling and Predictive Capabilities
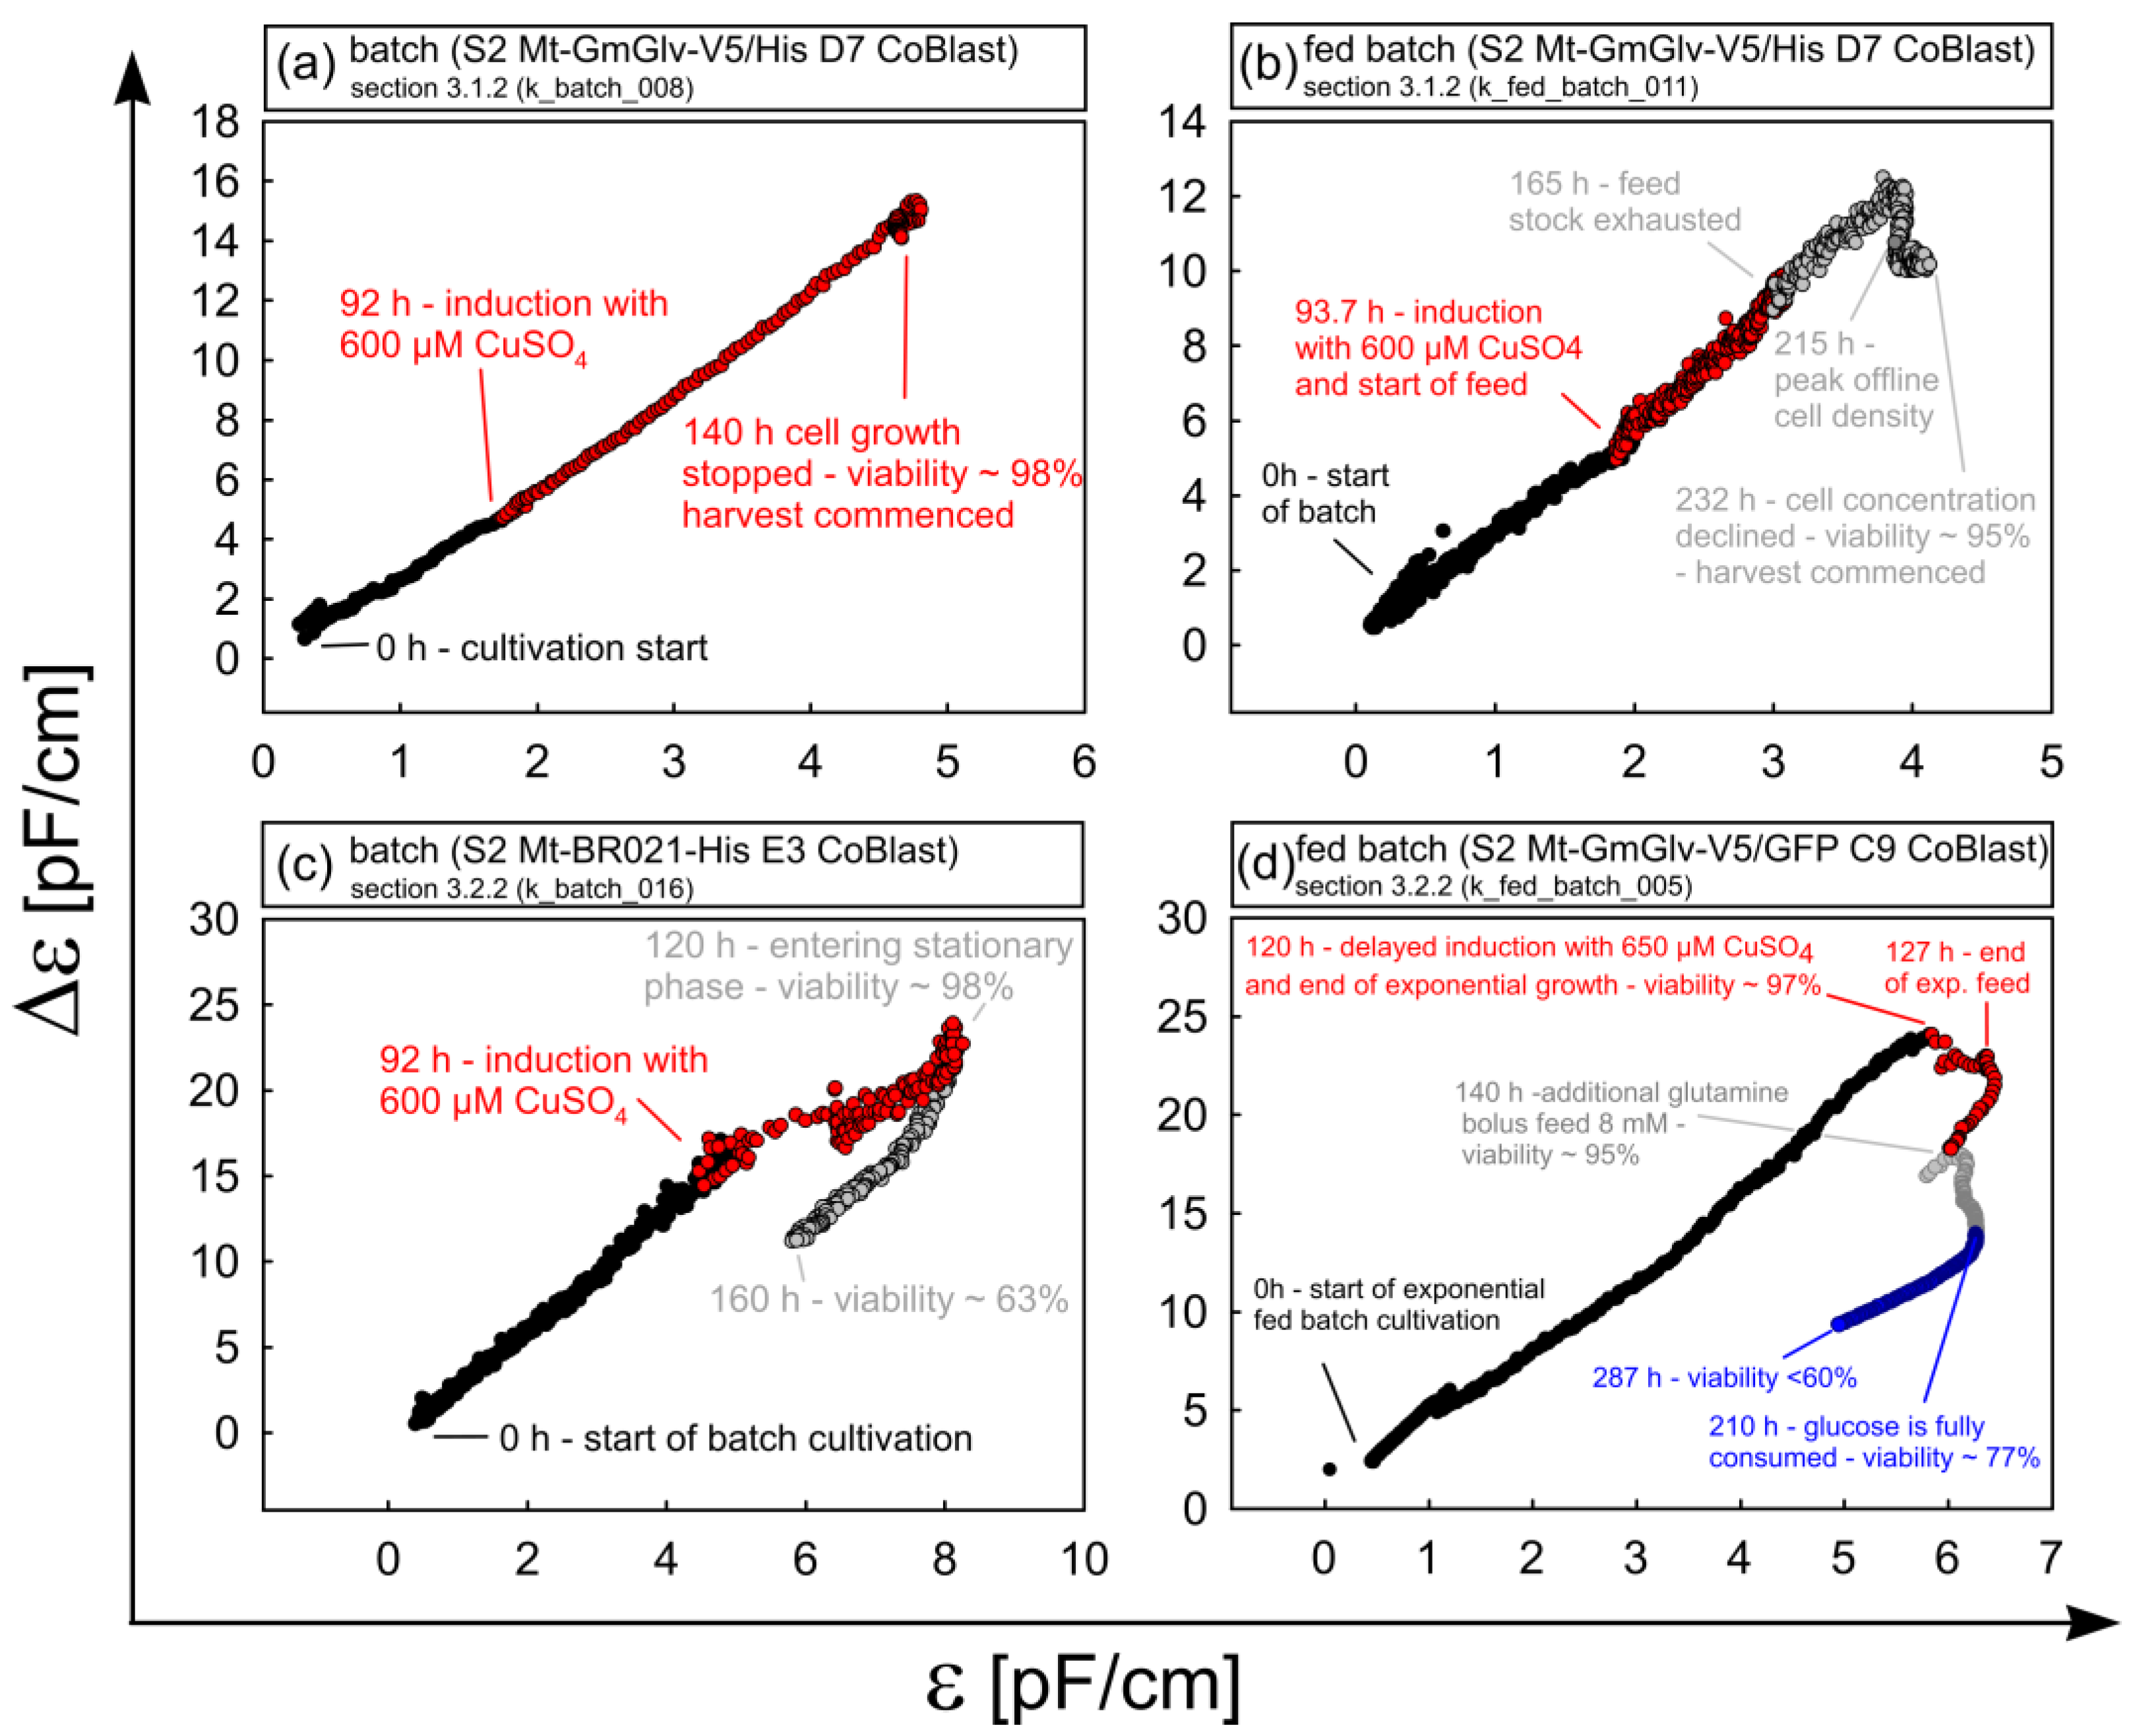
3.1.2. Timing of Induction and Harvest for Batch and Fed-Batch Cultures with High Viability
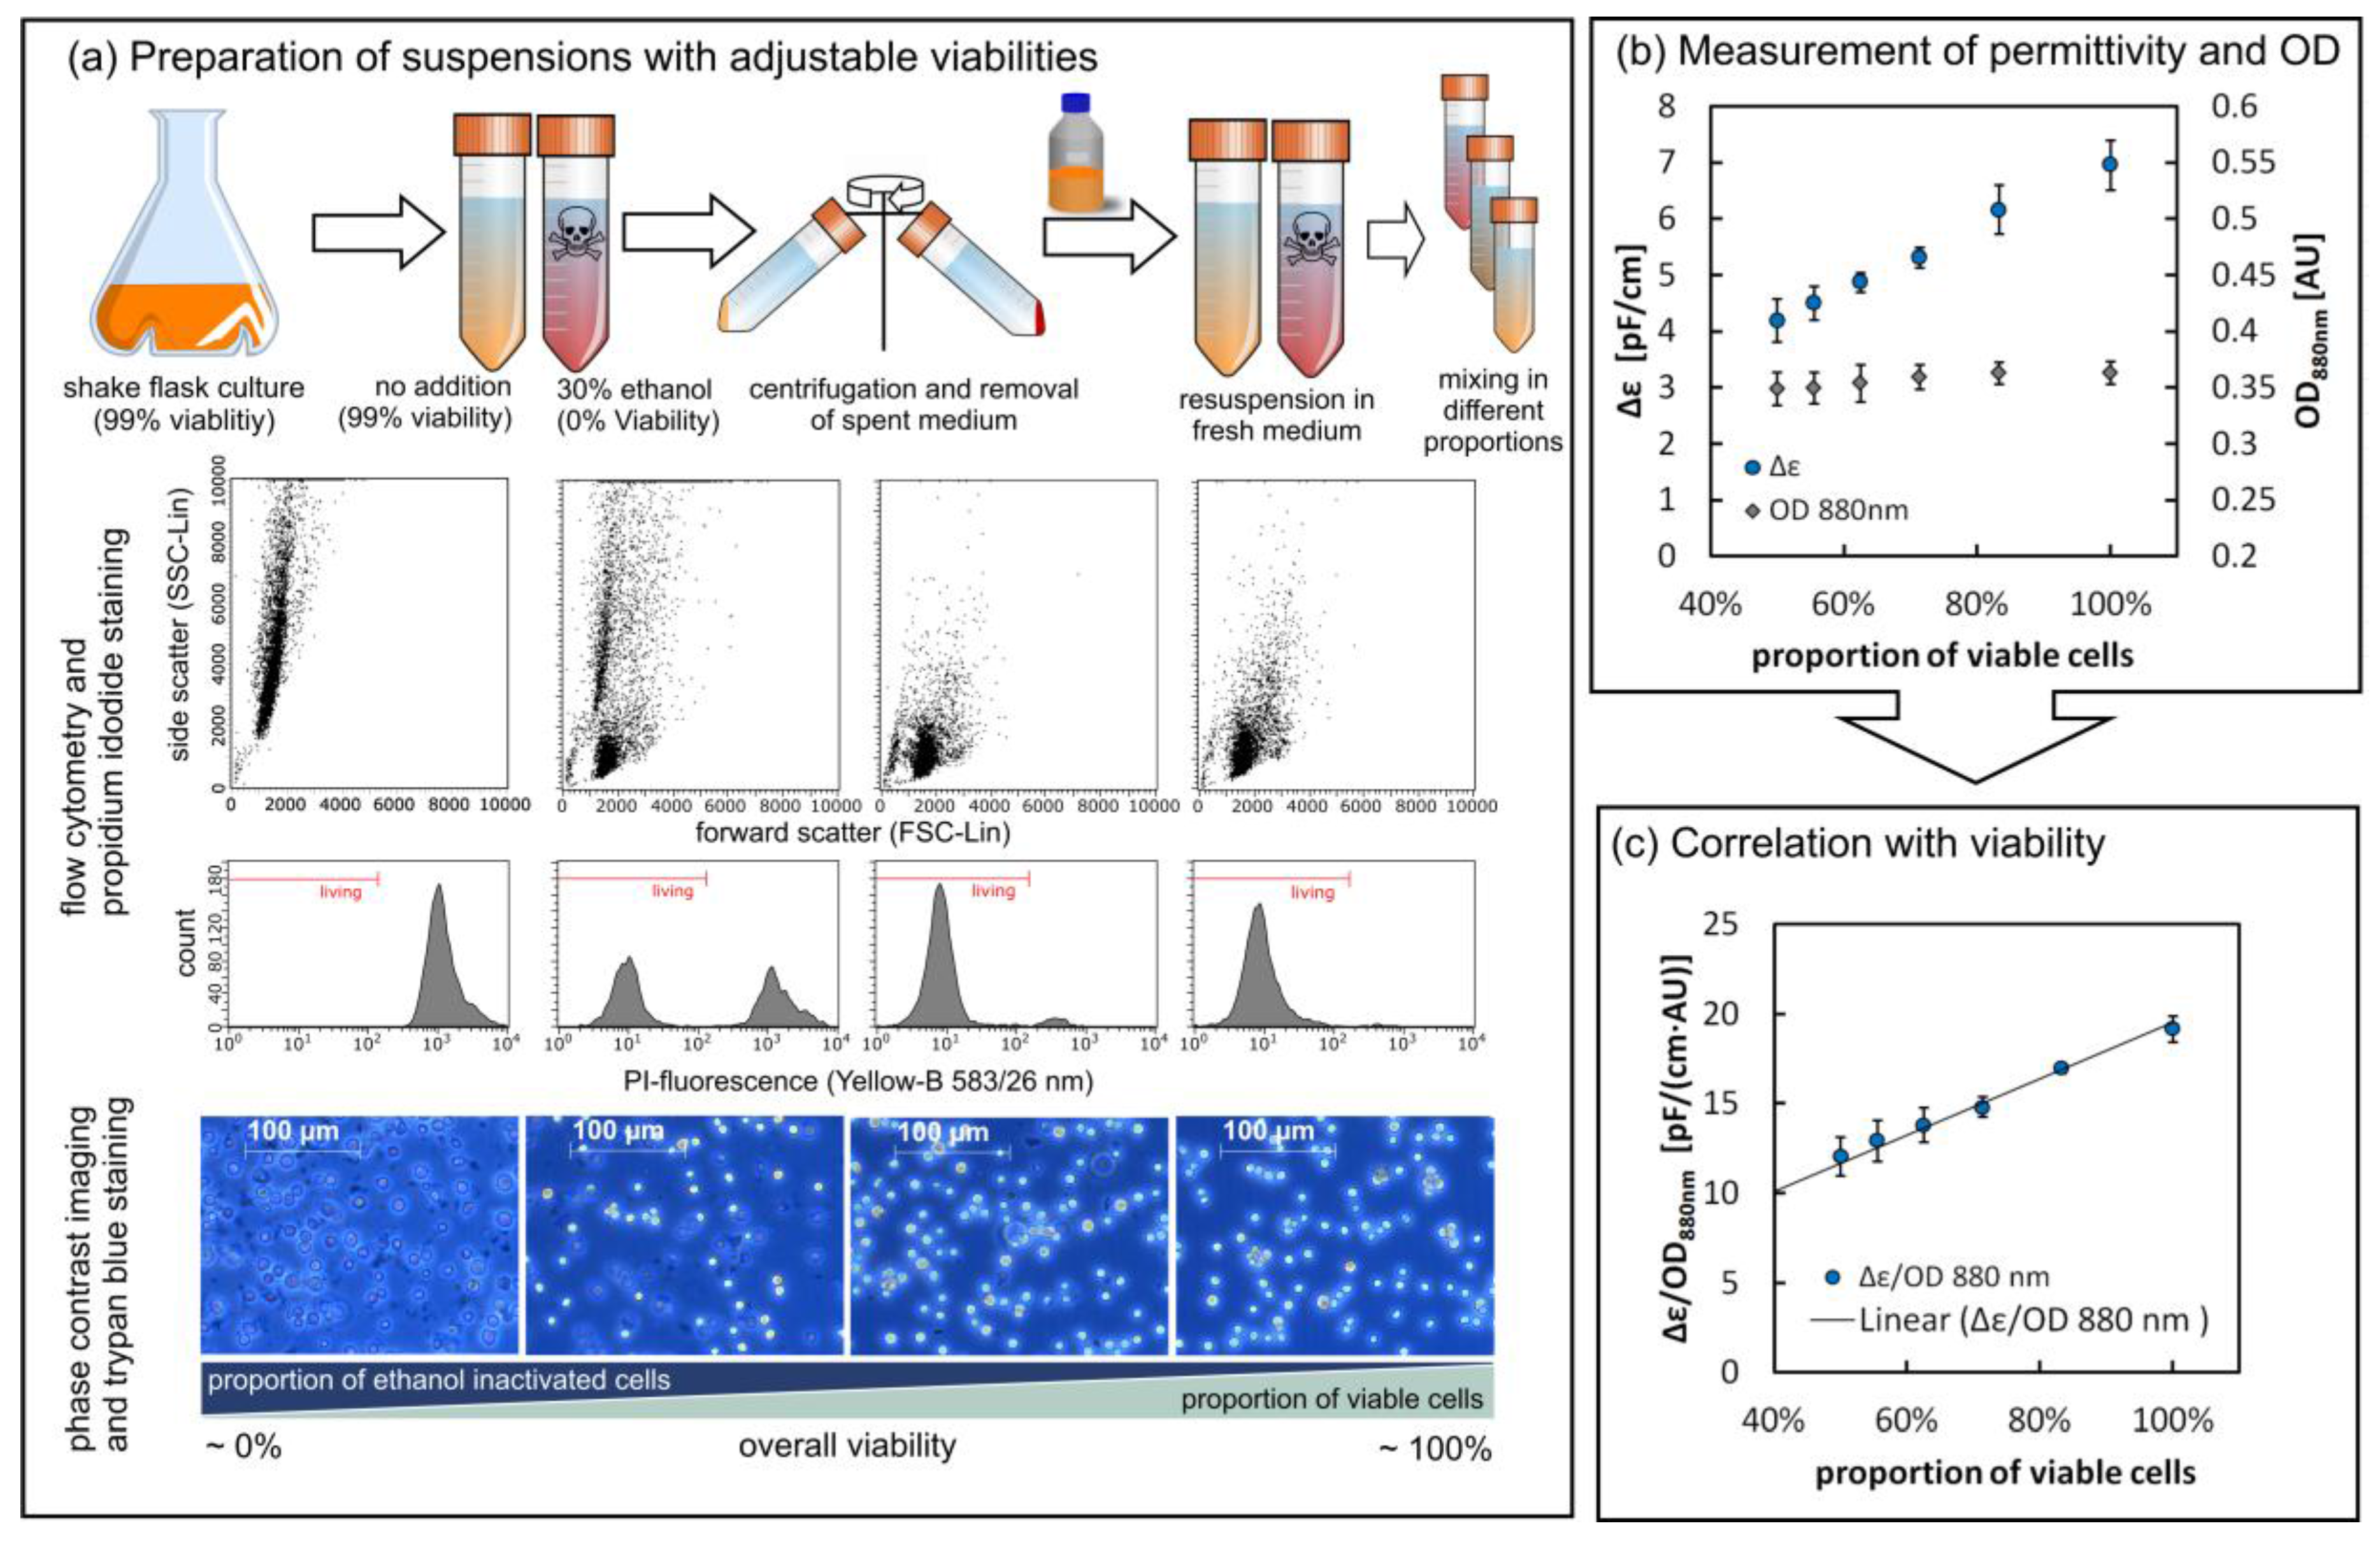
3.2. Viability Assessment via the Parallel Measurement of Turbidity and Permittivity
3.2.1. Determining Cell Viability in a Controlled Environment
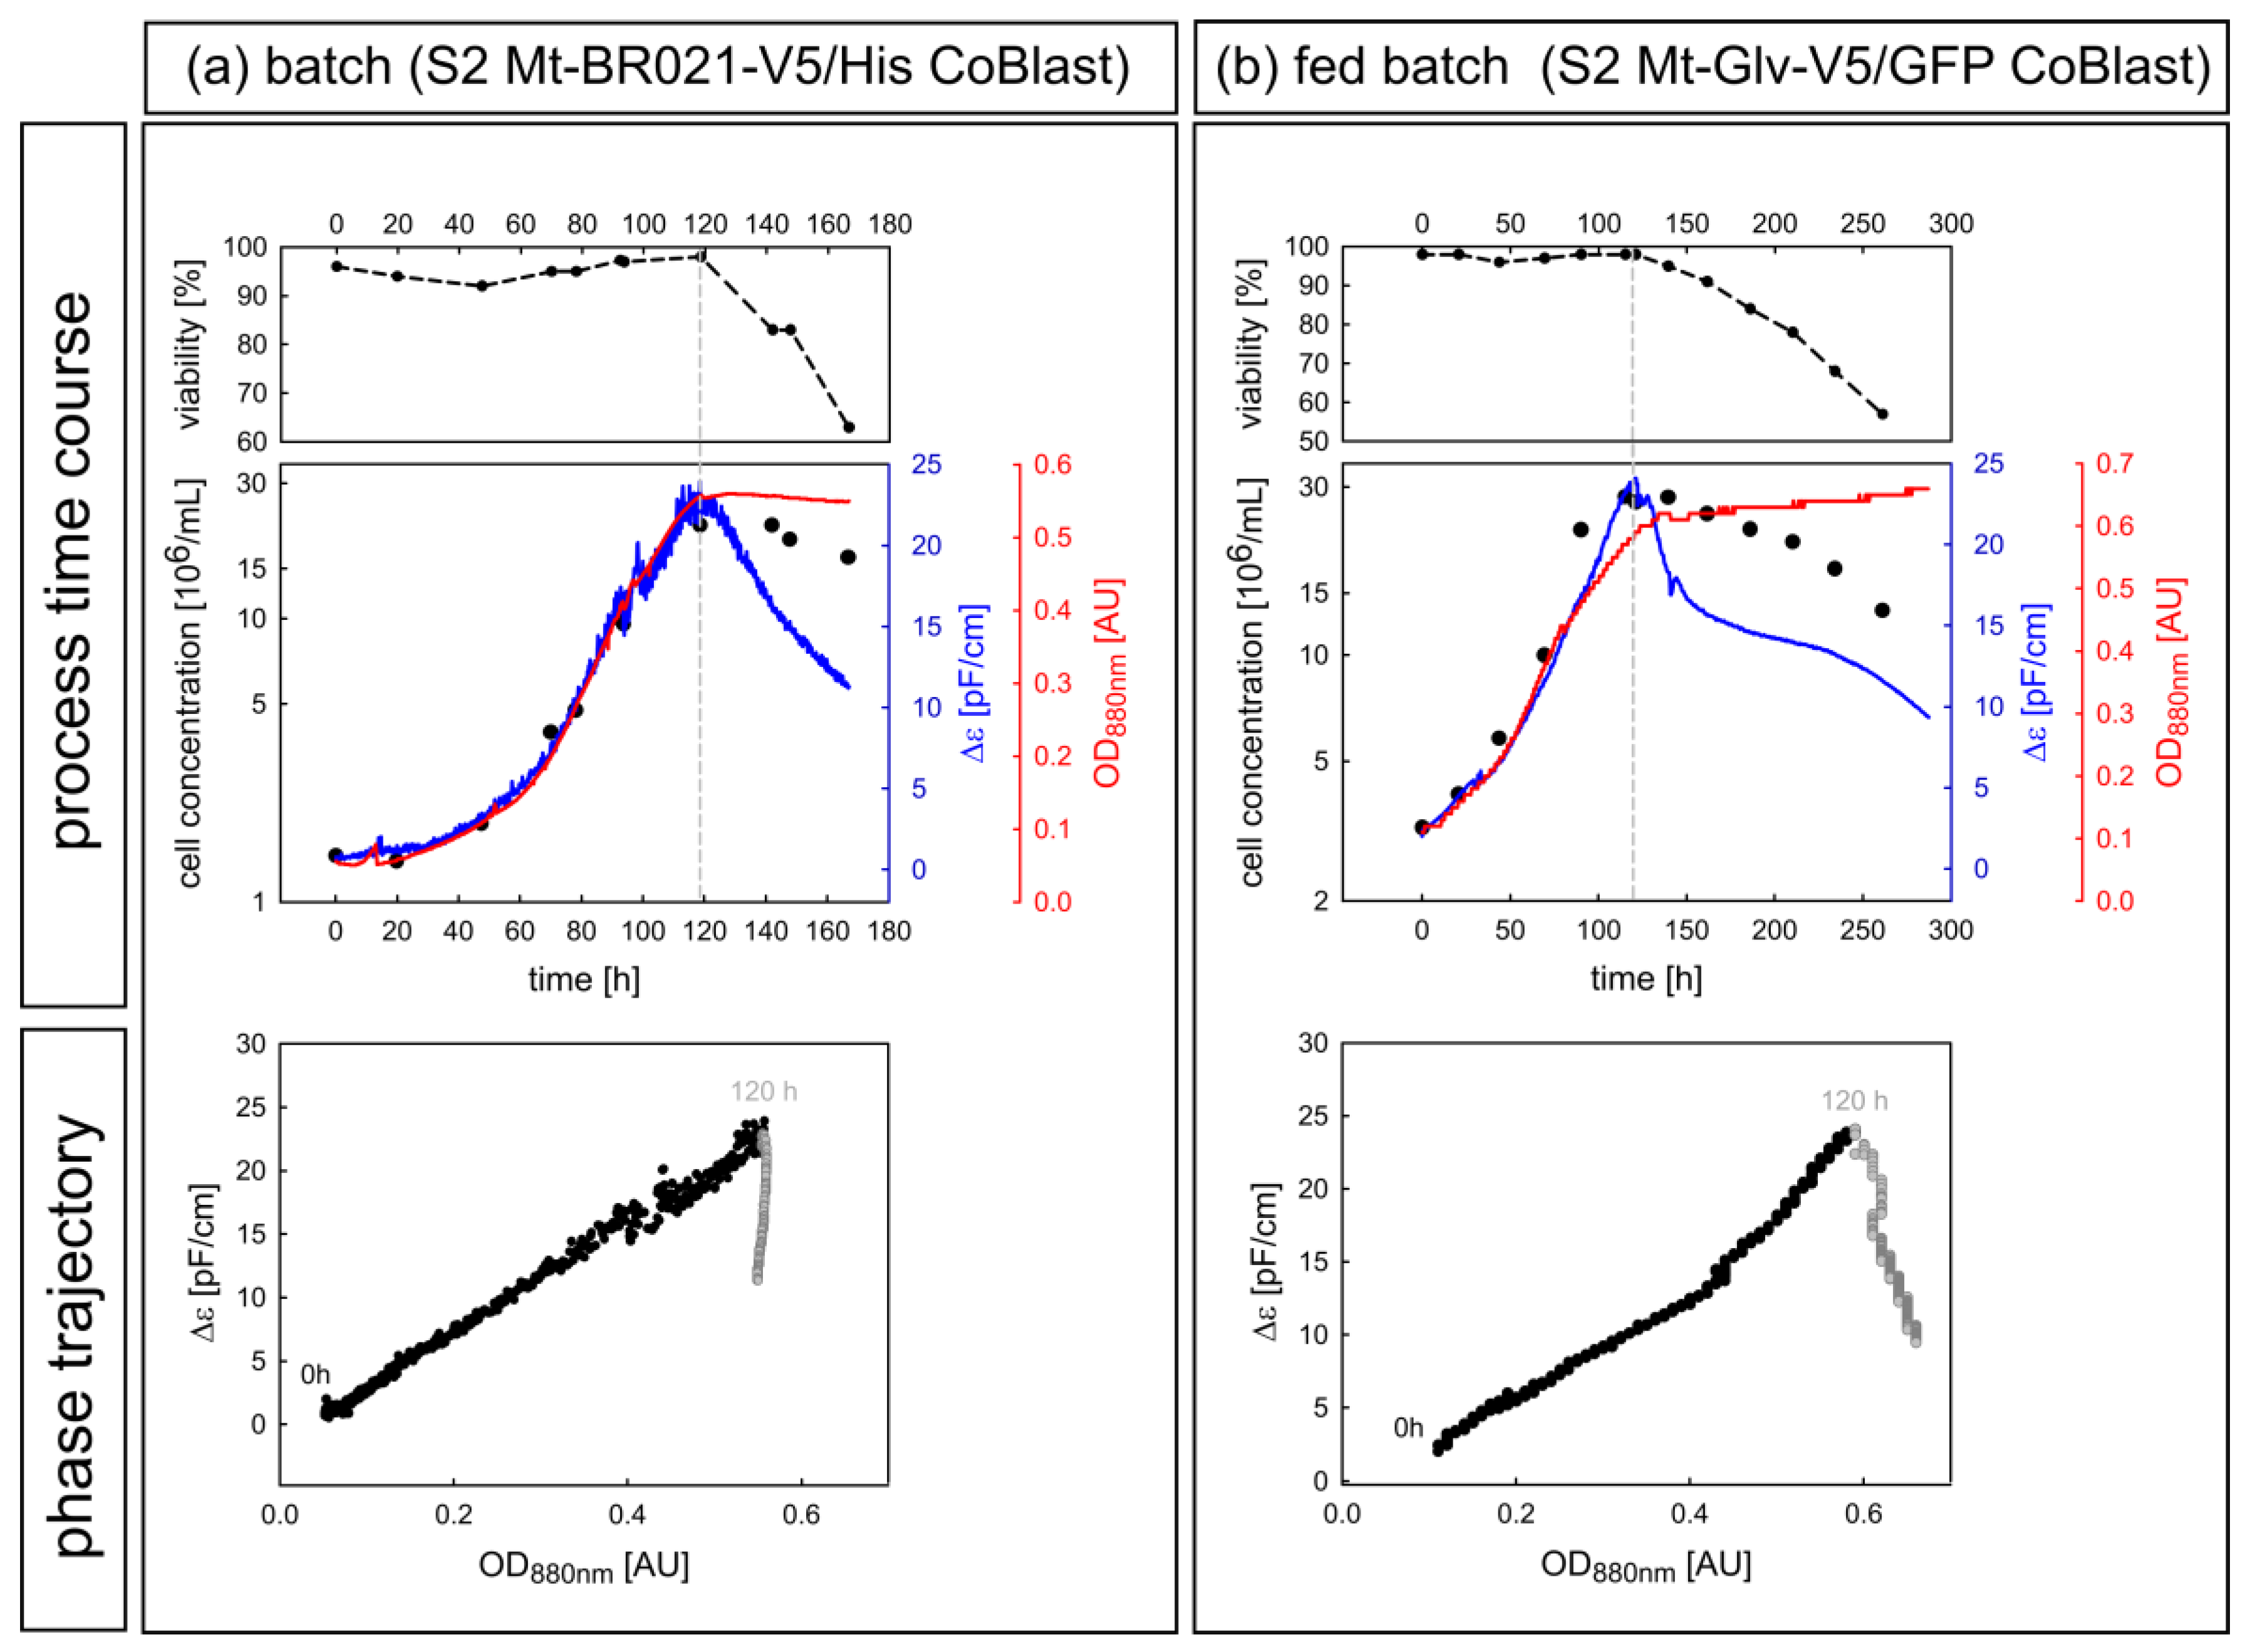
3.2.2. Case Study of Viability Assessment during Batch and Fed Batch Cultivation
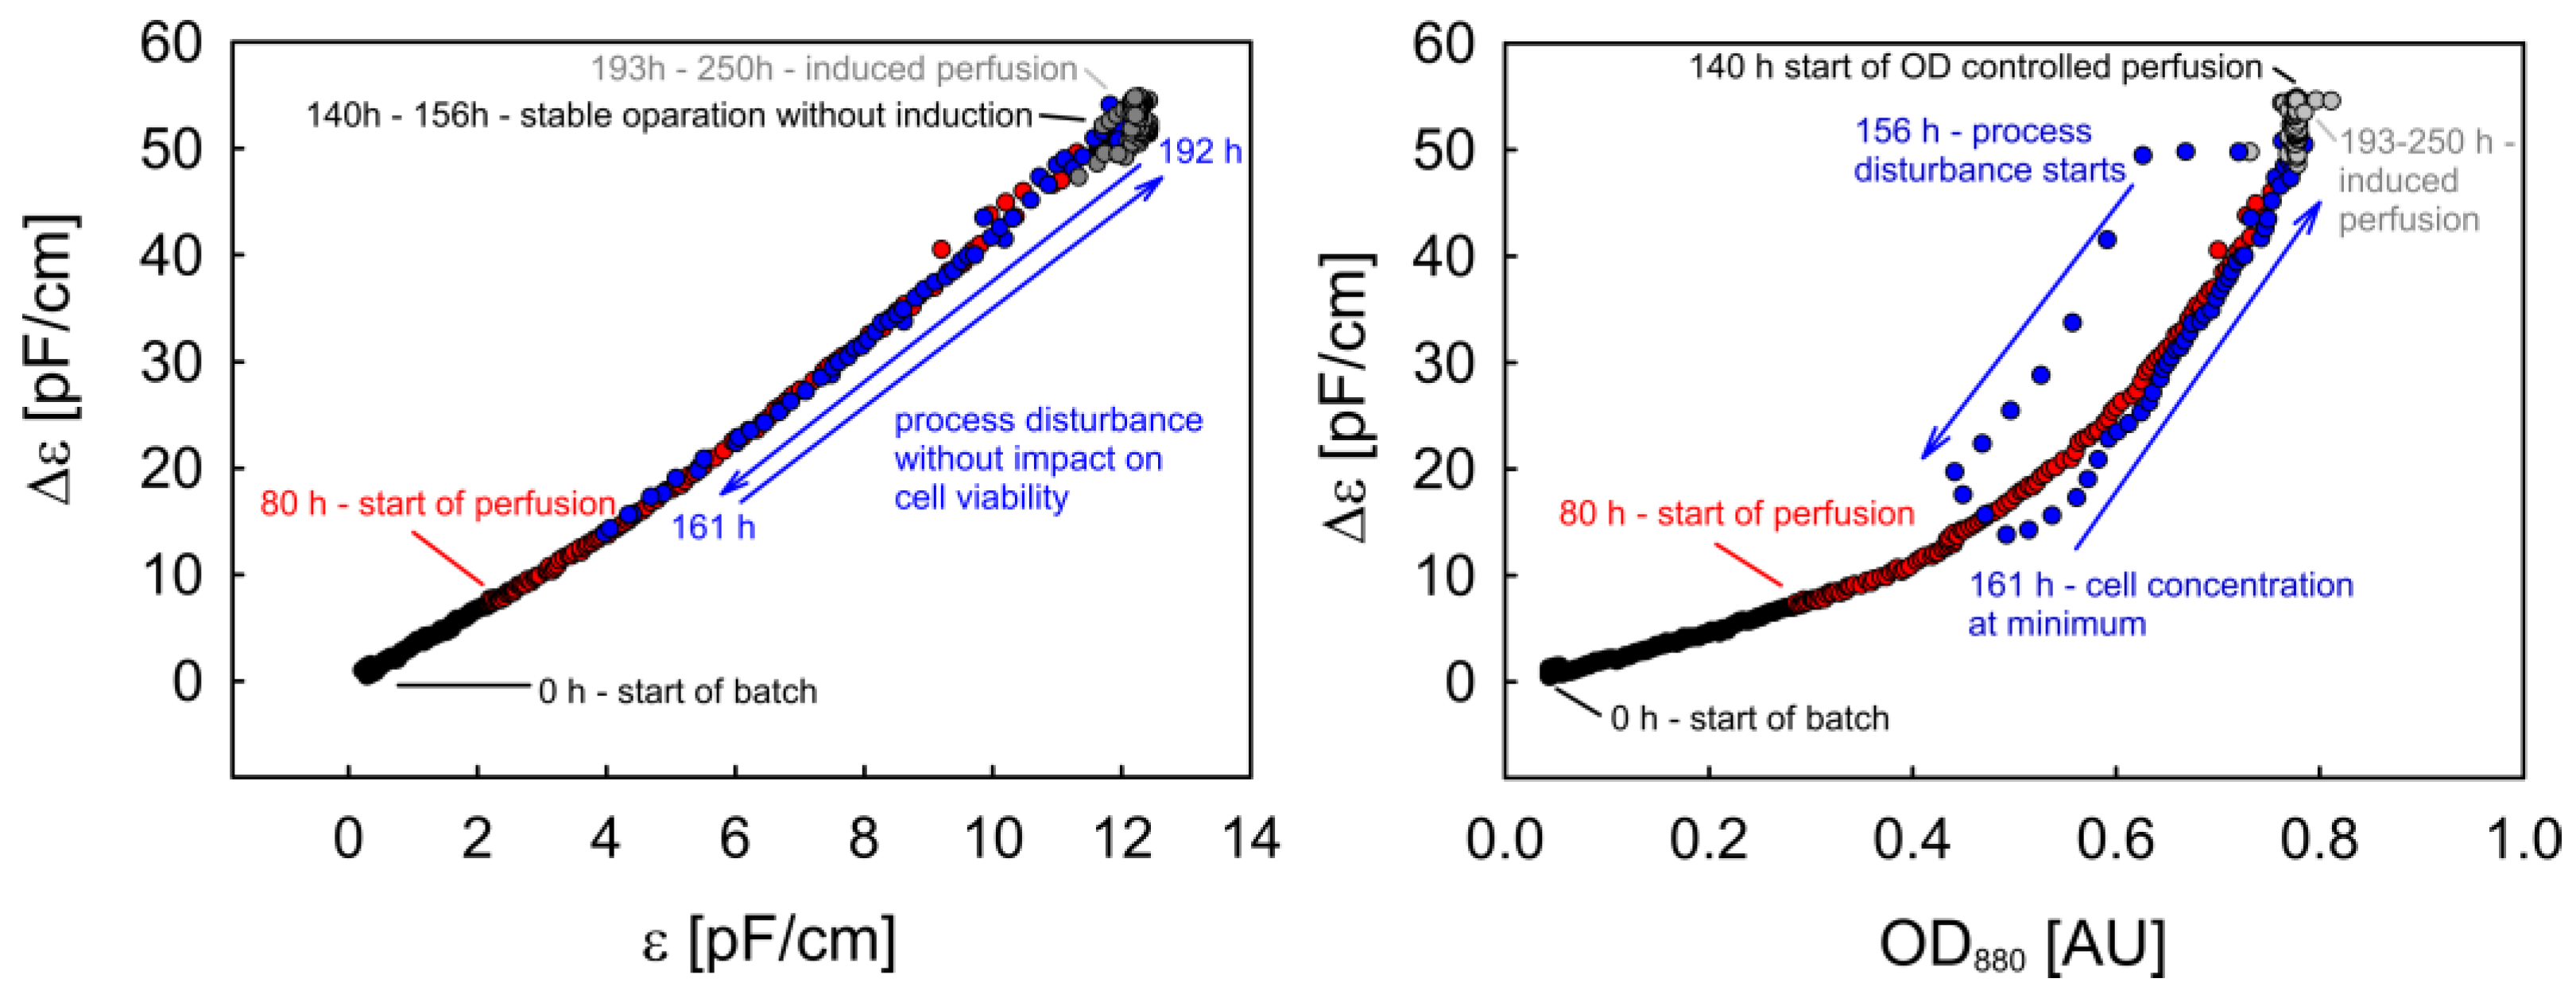
3.2.3. Phase Trajectories of ε and Δε as Alternative Sources of Process Information
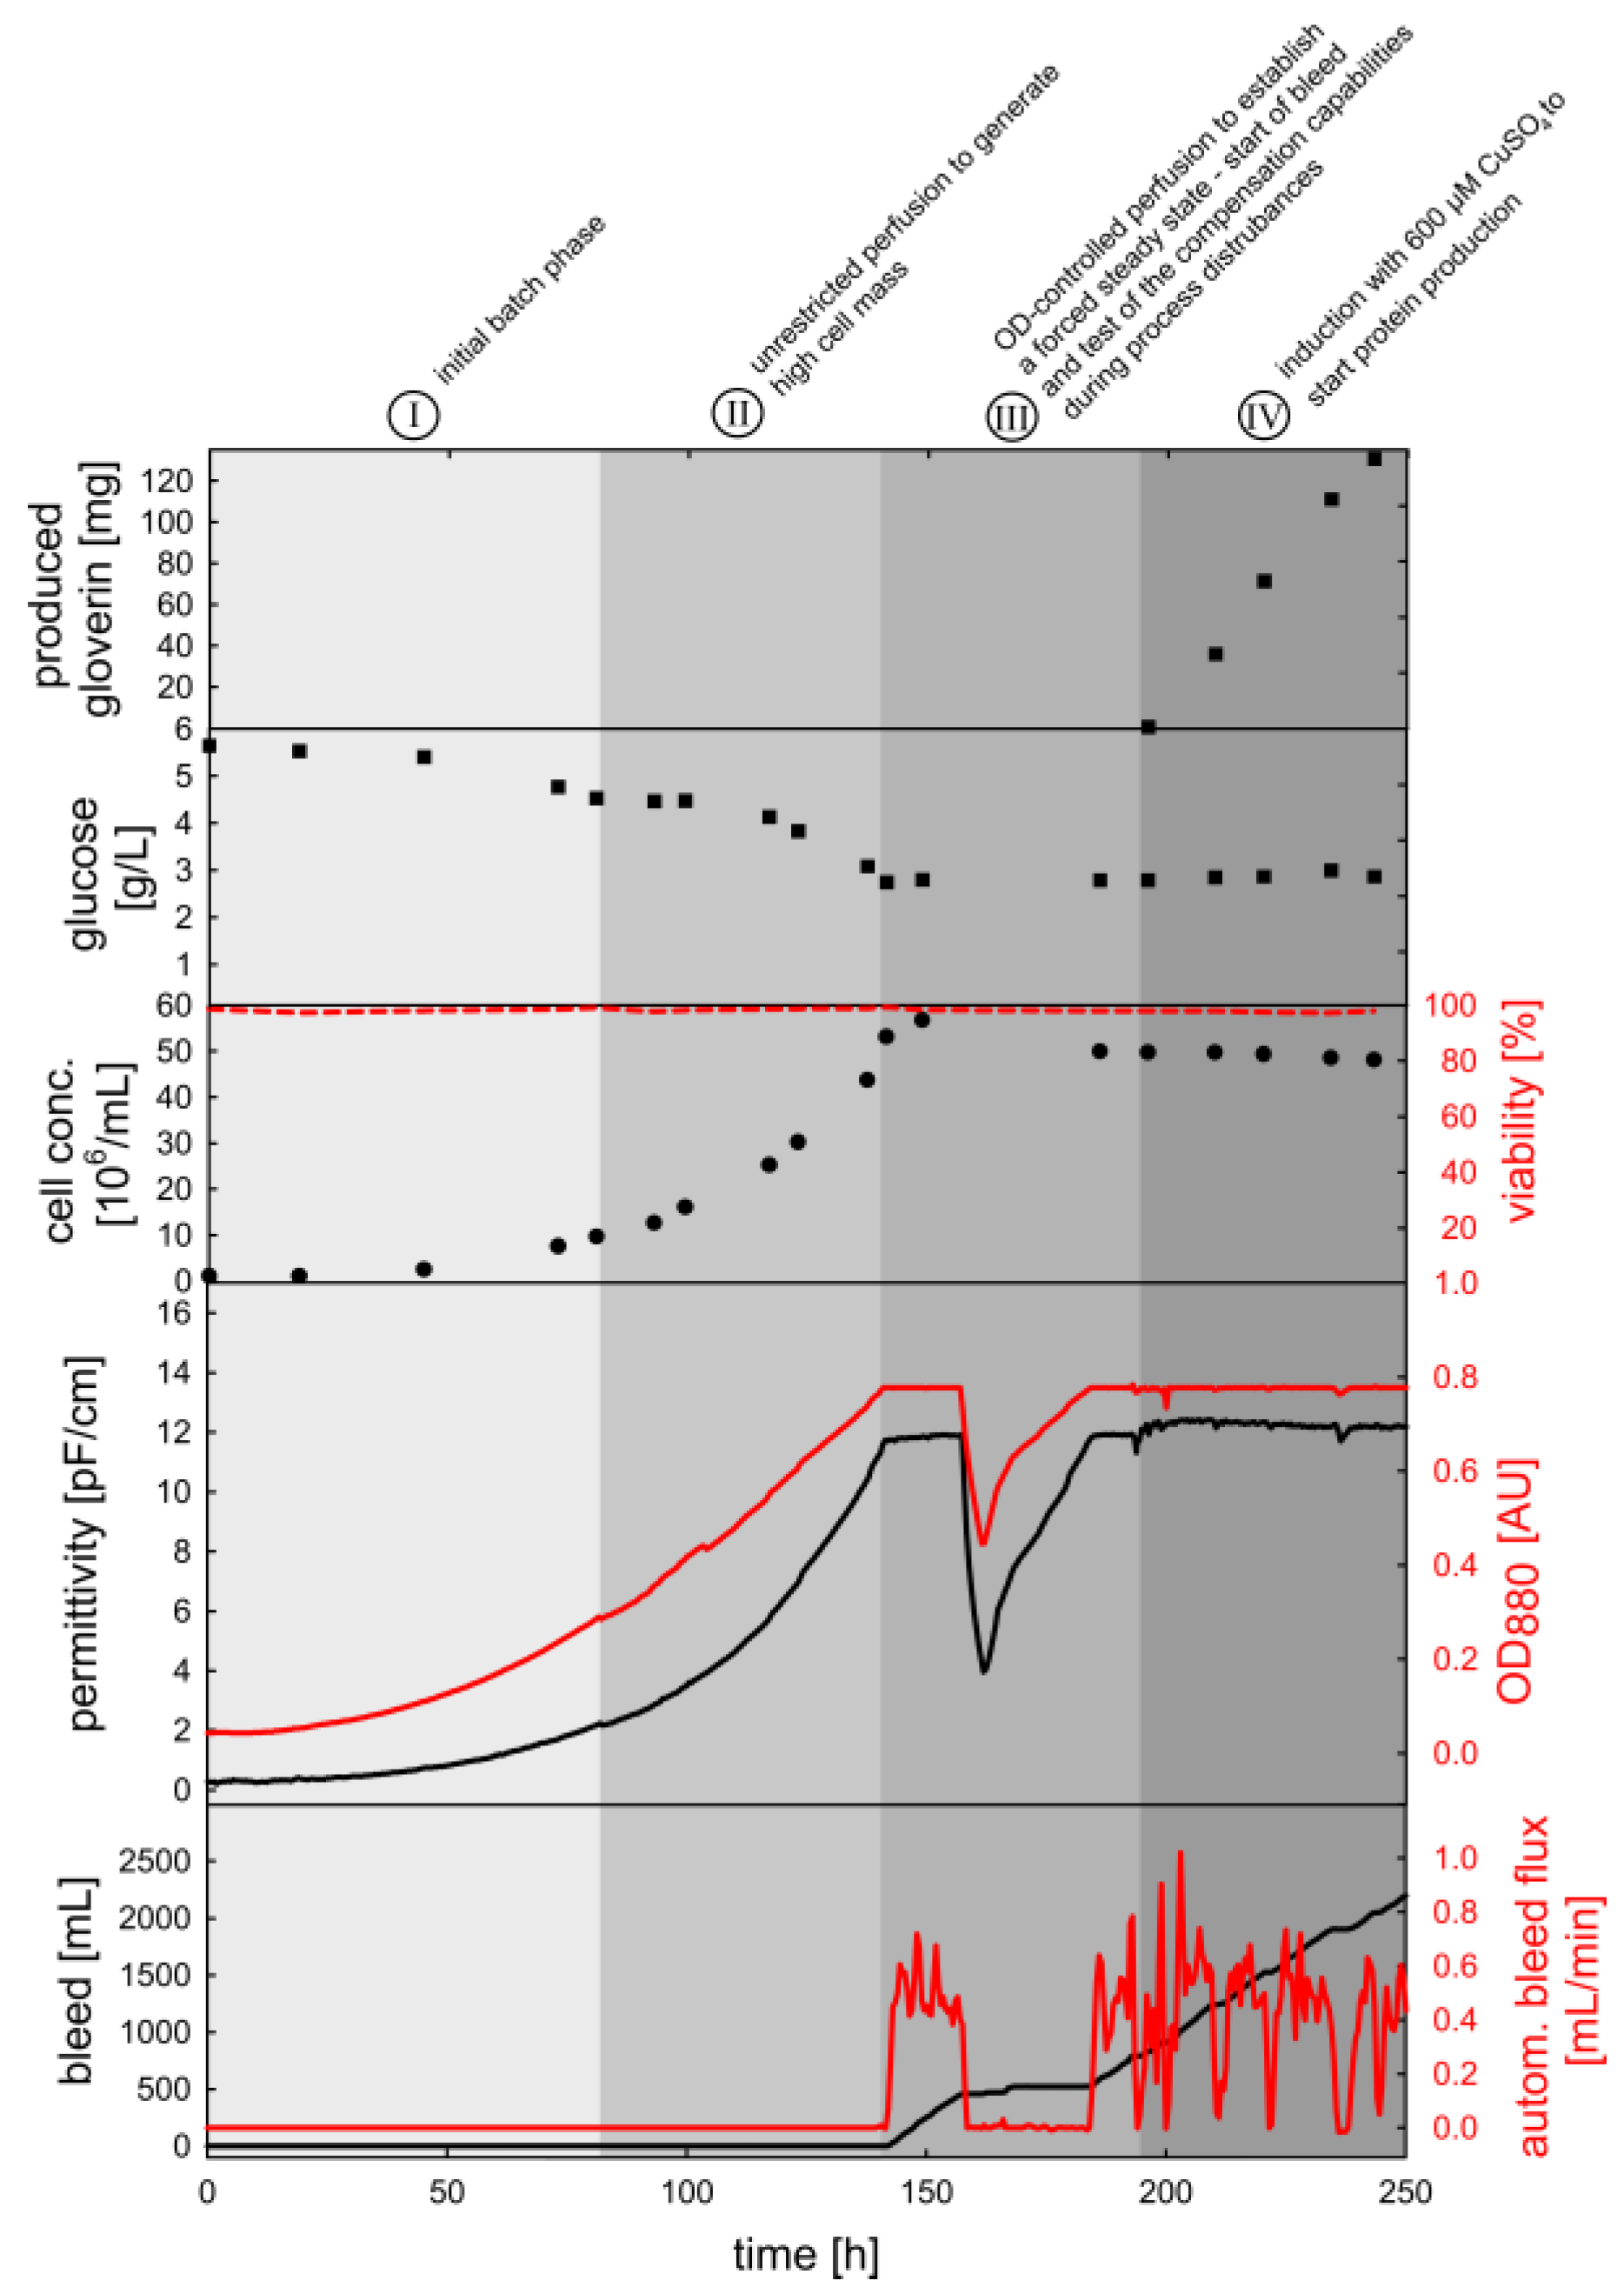
3.3. OD880-Controlled Perfusion to Achieve a Turbidostat/Permittistat Culture with Enhanced Productivity
4. Discussion and Conclusions
4.1. Characterization of the ExCell 230 and the InCyte Sensors
4.2. Gaining Process Understanding by Online Monitoring of Cell Density, Specific Growth Rate and Viability
4.3. Process Intensification Using an OD880-Controlled Perfusion Process
Supplementary Materials
Acknowledgments
Author Contributions
Conflicts of Interest
Abbreviations
| Symbol | Name | Unit |
| a | Regression coefficients for the approximation of N(t) | |
| b | Random effects coefficients | |
| β | Fixed effects coefficients | |
| BEVS | Baculovirus expression vector system | |
| BR021 | Harmonia axyridis antimicrobial peptide BR021 | |
| BSA | Bovine serum albumin | |
| CHO | Chinese hamster ovary cells | |
| e | error | |
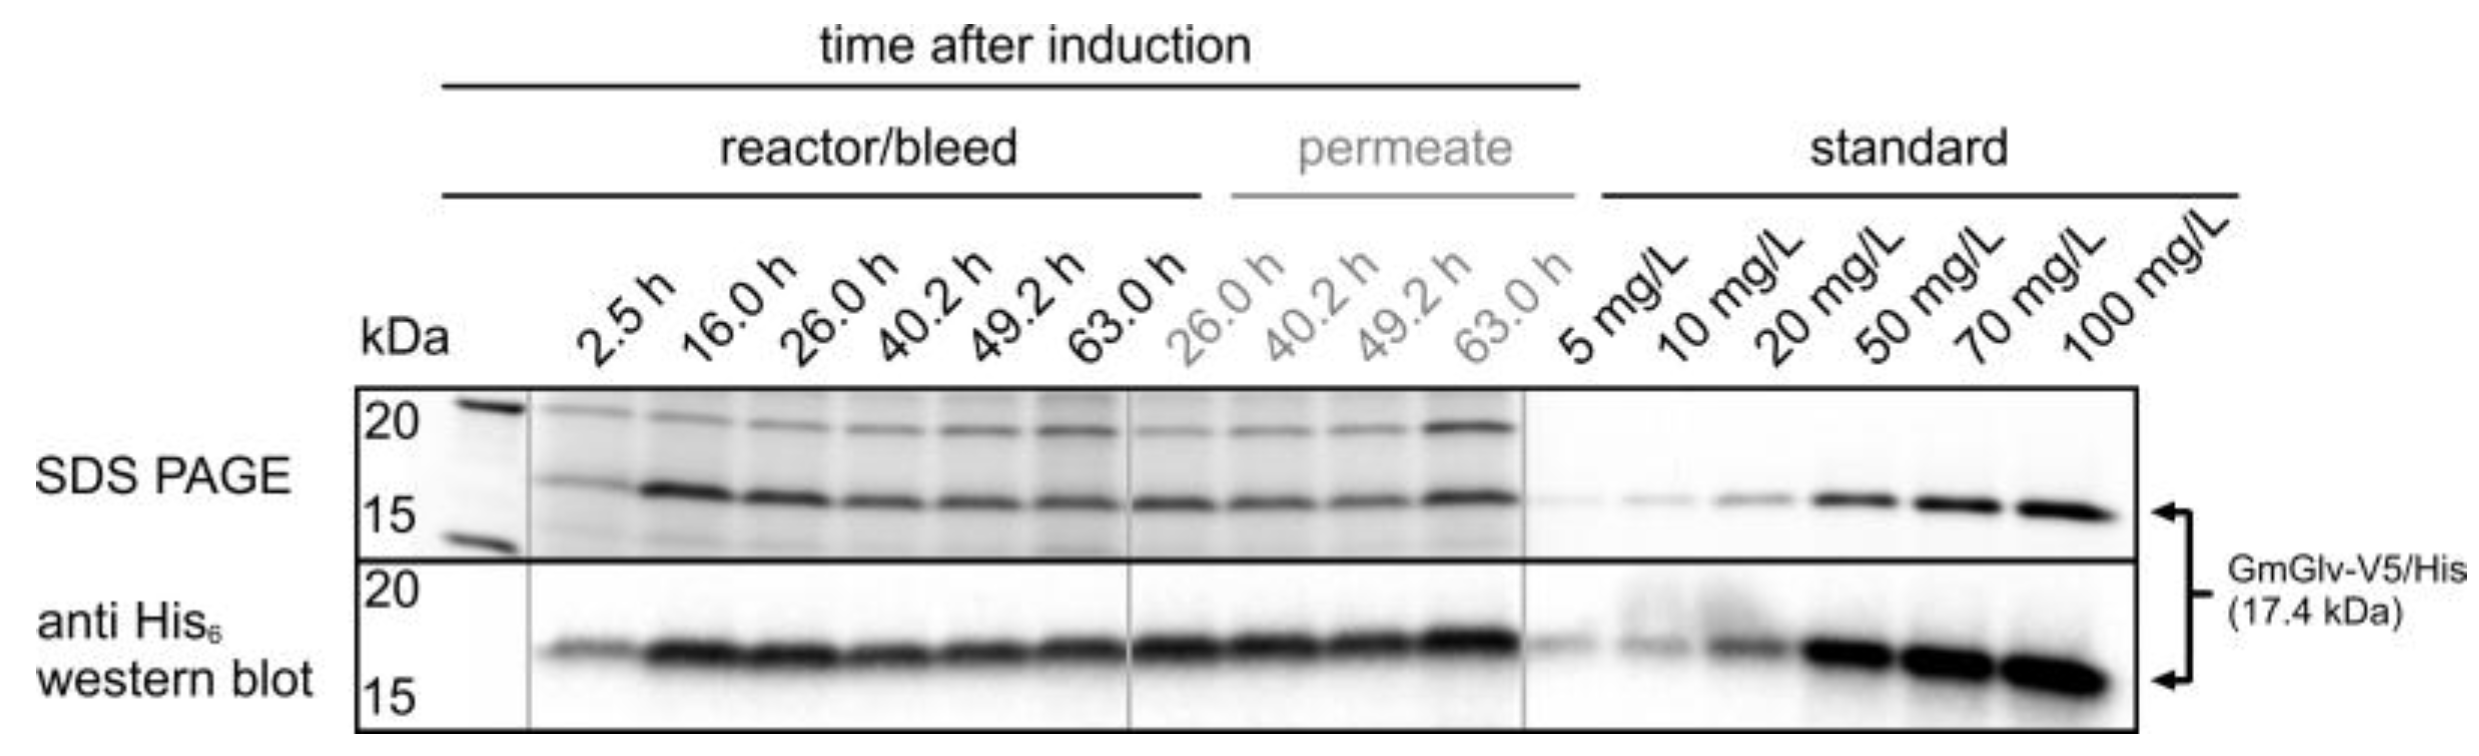
| GmGlv | Galleria mellonella antimicrobial peptide gloverin | |
| HeLa | Henrietta Lacks cell line | |
| High Five | Ovarian cell line from the cabbage looper Trichoplusia ni | |
| MTT | 3-(4,5-dimethylthiazol-2-yl)-2,5-diphenyltetrazolium bromide | |
| NIR | Near infrared | |
| OD880 | Optical density at 880 nm | |
| PBS | Phosphate-buffered saline | |
| PVDF | Polyvinylidene difluoride | |
| rS2 | Recombinant Drosophila melanogaster Schneider 2 cells | |
| SD | Standard deviation | |
| SDS PAGE | Sodium dodecylsulfate polyacrylamide gel electrophoresis | |
| Sf9 | Clonal isolate of Spodoptera frugiperda Sf21 cells | |
| TFF | Tangential flow filtration | |
| Vero | African green monkey kidney epithelial cells (from verda reno = green kidney) | |
| fc | Characteristic frequency | [kHz] |
| N | Absolute cell number | [-] |
| t | Time | [h] |
| X | Cell concentration | [106/mL] |
| κ | Conductivity | [mS/cm] |
| µ | Specific growth rate | [h-1] |
| Δε | Maximal permittivity difference | [pF/cm] |
| ε | Permittivity | [pF/cm] |
Appendix A


Appendix B

References
- Junker, B.H.; Wang, H.Y. Bioprocess monitoring and computer control: Key roots of the current PAT initiative. Biotechnol. Bioeng. 2006, 95, 226–261. [Google Scholar] [CrossRef] [PubMed]
- Aehle, M.; Kuprijanov, A.; Schaepe, S.; Simutis, R.; Lübbert, A. Simplified off-gas analyses in animal cell cultures for process monitoring and control purposes. Biotechnol. Lett. 2011, 33, 2103–2110. [Google Scholar] [CrossRef] [PubMed]
- Casablancas, A.; Gámez, X.; Lecina, M.; Solà, C.; Cairó, J.J.; Gòdia, F. Comparison of control strategies for fed-batch culture of hybridoma cells based on on-line monitoring of oxygen uptake rate, optical cell density and glucose concentration: Monitoring and control of hybridoma cell fed-batch culture. J. Chem. Technol. Biotechnol. 2013, 88, 1680–1689. [Google Scholar] [CrossRef]
- Marose, S.; Lindemann, C.; Scheper, T. Two-Dimensional Fluorescence Spectroscopy: A New Tool for On-Line Bioprocess Monitoring. Biotechnol. Prog. 1998, 14, 63–74. [Google Scholar] [CrossRef] [PubMed]
- Lindemann, C.; Marose, S.; Nielsen, H.O.; Scheper, T. 2-Dimensional fluorescence spectroscopy for on-line bioprocess monitoring. Sens. Actuators B Chem. 1998, 51, 273–277. [Google Scholar] [CrossRef]
- Cole, H.E.; Demont, A.; Marison, I.W. The Application of Dielectric Spectroscopy and Biocalorimetry for the Monitoring of Biomass in Immobilized Mammalian Cell Cultures. Processes 2015, 3, 384–405. [Google Scholar] [CrossRef]
- Luttmann, R.; Bracewell, D.G.; Cornelissen, G.; Gernaey, K.V.; Glassey, J.; Hass, V.C.; Kaiser, C.; Preusse, C.; Striedner, G.; Mandenius, C.-F. Soft sensors in bioprocessing: A status report and recommendations. Biotechnol. J. 2012, 7, 1040–1048. [Google Scholar] [CrossRef] [PubMed]
- Bluma, A.; Höpfner, T.; Lindner, P.; Rehbock, C.; Beutel, S.; Riechers, D.; Hitzmann, B.; Scheper, T. In-situ imaging sensors for bioprocess monitoring: State of the art. Anal. Bioanal. Chem. 2010, 398, 2429–2438. [Google Scholar] [CrossRef] [PubMed]
- Cervera, A.E.; Petersen, N.; Lantz, A.E.; Larsen, A.; Gernaey, K.V. Application of near-infrared spectroscopy for monitoring and control of cell culture and fermentation. Biotechnol. Prog. 2009, 25, 1561–1581. [Google Scholar] [CrossRef] [PubMed]
- Wu, P.; Ozturk, S.S.; Blackie, J.D.; Thrift, J.C.; Figueroa, C.; Naveh, D. Evaluation and applications of optical cell density probes in mammalian cell bioreactors. Biotechnol. Bioeng. 1995, 45, 495–502. [Google Scholar] [CrossRef] [PubMed]
- Bédard, C.; Jolicoeur, M.; Jardin, B.; Tom, R.; Perret, S.; Kamen, A. Insect cell density in bioreactor cultures can be estimated from on-line measurements of optical density. Biotechnol. Tech. 1994, 8, 605–610. [Google Scholar] [CrossRef]
- Fan, R.; Ebrahimi, M.; Quitmann, H.; Aden, M.; Czermak, P. An Innovative Optical Sensor for the Online Monitoring and Control of Biomass Concentration in a Membrane Bioreactor System for Lactic Acid Production. Sensors 2016, 16, 411. [Google Scholar] [CrossRef] [PubMed] [Green Version]
- Druzinec, D.; Weiss, K.; Elseberg, C.; Salzig, D.; Kraume, M.; Pörtner, R.; Czermak, P. Process analytical technology (PAT) in insect and mammalian cell culture processes: Dielectric spectroscopy and focused beam reflectance measurement (FBRM). In Animal Cell Biotechnology; Pörtner, R., Ed.; Humana Press: Totowa, NJ, USA, 2014; pp. 313–341. ISBN 978-1-62703-732-7. [Google Scholar]
- Druzinec, D.; Salzig, D.; Brix, A.; Kraume, M.; Vilcinskas, A.; Kollewe, C.; Czermak, P. Optimization of insect cell based protein production processes-online monitoring, expression systems, scale up. Adv. Biochem. Eng. Biotechnol. 2013, 136, 65–100. [Google Scholar] [CrossRef] [PubMed]
- Reinecke, T.; Biechele, P.; Sobocinski, M.; Suhr, H.; Bakes, K.; Solle, D.; Jantunen, H.; Scheper, T.; Zimmermann, S. Continuous noninvasive monitoring of cell growth in disposable bioreactors. Sens. Actuator B Chem. 2017, 251, 1009–1017. [Google Scholar] [CrossRef]
- Junker, B.H.; Reddy, J.; Gbewonyo, K.; Greasham, R. On-line and in-situ monitoring technology for cell density measurement in microbial and animal cell cultures. Bioprocess Eng. 1994, 10, 195–207. [Google Scholar] [CrossRef]
- Kiviharju, K.; Salonen, K.; Moilanen, U.; Eerikäinen, T. Biomass measurement online: The performance of in situ measurements and software sensors. J. Ind. Microbiol. Biotechnol. 2008, 35, 657–665. [Google Scholar] [CrossRef] [PubMed]
- Kaiser, C.; Carvell, J.P.; Luttmann, R. A Sensitive, Compact, In Situ Biomass Measurement System. BioProcess Int. 2007, 5, 52–56. [Google Scholar]
- Carvell, J.P.; Dowd, J.E. On-line Measurements and Control of Viable Cell Density in Cell Culture Manufacturing Processes using Radio-Frequency Impedance. Cytotechnology 2006, 50, 35–48. [Google Scholar] [CrossRef] [PubMed]
- Ducommun, P.; Kadouri, A.; von Stockar, U.; Marison, I.W. On-line determination of animal cell concentration in two industrial high-density culture processes by dielectric spectroscopy. Biotechnol. Bioeng. 2002, 77, 316–323. [Google Scholar] [CrossRef] [PubMed]
- Justice, C.; Brix, A.; Friemark, D.; Kraume, M.; Pfromm, P.H.; Eichenmueller, B.; Czermak, P. Process control in cell culture technology using dielectric spectroscopy. Biotechnol. Adv. 2011, 29, 391–401. [Google Scholar] [CrossRef] [PubMed]
- Yardley, J.E.; Kell, D.B.; Barrett, J.; Davey, C.L. On-line, real-time measurements of cellular biomass using dielectric spectroscopy. Biotechnol. Genet. Eng. Rev. 2000, 17, 3–35. [Google Scholar] [CrossRef] [PubMed]
- Markx, G.H.; Davey, C.L. The dielectric properties of biological cells at radiofrequencies: Applications in biotechnology. Enzyme Microb. Technol. 1999, 25, 161–171. [Google Scholar] [CrossRef]
- Davey, C.L.; Davey, H.M.; Kell, D.B.; Todd, R.W. Introduction to the dielectric estimation of cellular biomass in real time, with special emphasis on measurements at high volume fractions. Anal. Chim. Acta 1993, 279, 155–161. [Google Scholar] [CrossRef]
- Schwan, H.P. Electrical Properties of Tissue and Cell Suspensions. In Advances in Biological and Medical Physics; Tobias, J.H.L., Ed.; Elsevier: Amsterdam, The Netherlands, 1957; Volume 5, pp. 147–209. [Google Scholar]
- Akhnoukh, R.; Kretzmer, G.; Schügerl, K. On-line monitoring and control of the cultivation of Spodoptera frugiperda Sf9 insect cells and β-galactosidase production by Autographa californica virus vector. Enzyme Microb. Technol. 1996, 18, 220–228. [Google Scholar] [CrossRef]
- Zeiser, A.; Elias, C.B.; Voyer, R.; Jardin, B.; Kamen, A.A. On-Line Monitoring of Physiological Parameters of Insect Cell Cultures during the Growth and Infection Process. Biotechnol. Prog. 2000, 16, 803–808. [Google Scholar] [CrossRef] [PubMed]
- Elias, C.B.; Zeiser, A.; Bédard, C.; Kamen, A.A. Enhanced growth of Sf-9 cells to a maximum density of 5.2 × 10⁷ cells per mL and production of beta-galactosidase at high cell density by fed batch culture. Biotechnol. Bioeng. 2000, 68, 381–388. [Google Scholar] [CrossRef]
- Zitzmann, J.; Sprick, G.; Weidner, T.; Schreiber, C.; Czermak, P. Process Optimization for Recombinant Protein Expression in Insect Cells. In New Insights into Cell Culture Technology; Gowder, S.J.T., Ed.; InTech Open: Rijeka, Croatia, 2017; pp. 43–98. ISBN 978-953-51-3133-5. [Google Scholar]
- Zitzmann, J.; Weidner, T.; Czermak, P. Optimized expression of the antimicrobial protein Gloverin from Galleria mellonella using stably transformed Drosophila melanogaster S2 cells. Cytotechnology 2017, 69, 371–389. [Google Scholar] [CrossRef] [PubMed]
- Moraes, Â.M.; Jorge, S.A.C.; Astray, R.M.; Suazo, C.A.T.; Calderón Riquelme, C.E.; Augusto, E.F.P.; Tonso, A.; Pamboukian, M.M.; Piccoli, R.A.M.; Barral, M.F.; et al. Drosophila melanogaster S2 cells for expression of heterologous genes: From gene cloning to bioprocess development. Biotechnol. Adv. 2012, 30, 613–628. [Google Scholar] [CrossRef] [PubMed]
- Kollewe, C. Production of recombinant proteins in insect cells. Am. J. Biochem. Biotechnol. 2013, 9, 255–271. [Google Scholar] [CrossRef]
- Vilcinskas, A.; Mukherjee, K.; Vogel, H. Expansion of the antimicrobial peptide repertoire in the invasive ladybird Harmonia axyridis. Proc. R. Soc. B Biol. Sci. 2013, 280. [Google Scholar] [CrossRef] [PubMed]
- Aehle, M.; Kuprijanov, A.; Schaepe, S.; Simutis, R.; Lubbert, A. Increasing batch-to-batch reproducibility of CHO cultures by robust open-loop control. Cytotechnology 2011, 63, 41–47. [Google Scholar] [CrossRef] [PubMed]
- Blaschczok, K.; Kaiser, S.C.; Löffelholz, C.; Imseng, N.; Burkart, J.; Bösch, P.; Dornfeld, W.; Eibl, R.; Eibl, D. Investigations on Mechanical Stress Caused to CHO Suspension Cells by Standard and Single-Use Pumps. Chem. Ing. Tech. 2013, 85, 144–152. [Google Scholar] [CrossRef]
- Team, R.C. R: A Language and Environment for Statistical Computing; R Foundation for Statistical Computing: Vienna, Austria, 2014; ISBN 3-900051-07-0. [Google Scholar]
- Besalú, E. The connection between inverse and classical calibration. Talanta 2013, 116, 45–49. [Google Scholar] [CrossRef] [PubMed]
- Centner, V.; Massart, D.L.; de Jong, S. Inverse calibration predicts better than classical calibration. Fresenius J. Anal. Chem. 1998, 361, 2–9. [Google Scholar] [CrossRef]
- Pinheiro, J.; Bates, D.M. Mixed-Effects Models in S and S-PLUS, 1st ed.; Springer: New York, NY, USA, 2001. [Google Scholar]
- Zhou, W.; Hu, W.-S. On-line characterization of a hybridoma cell culture process. Biotechnol. Bioeng. 1994, 44, 170–177. [Google Scholar] [CrossRef] [PubMed]
- Konstantinov, K.B.; Pambayun, R.; Matanguihan, R.; Yoshida, T.; Perusicn, C.M.; Hu, W.-S. On-line monitoring of hybridoma cell growth using a laser turbidity sensor. Biotechnol. Bioeng. 1992, 40, 1337–1342. [Google Scholar] [CrossRef] [PubMed]
- Konstantinov, K.; Chuppa, S.; Sajan, E.; Tsai, Y.; Yoon, S.; Golini, F. Real-time biomass-concentration monitoring in animal-cell cultures. Trends Biotechnol. 1994, 12, 324–333. [Google Scholar] [CrossRef]
- Cho, Y.N.; Chang, Y.K. On-line measurement and control of cell concentration of Saccharomyces cerevisiae using a laser turbidimeter. Biotechnol. Tech. 1995, 9, 557–562. [Google Scholar] [CrossRef]
- Kiviharju, K.; Salonen, K.; Moilanen, U.; Meskanen, E.; Leisola, M.; Eerikäinen, T. On-line biomass measurements in bioreactor cultivations: Comparison study of two on-line probes. J. Ind. Microbiol. Biotechnol. 2007, 34, 561–566. [Google Scholar] [CrossRef] [PubMed]
- Kroll, P.; Stelzer, I.V.; Herwig, C. Soft sensor for monitoring biomass subpopulations in mammalian cell culture processes. Biotechnol. Lett. 2017, 39, 1667–1673. [Google Scholar] [CrossRef] [PubMed]
- Ansorge, S.; Esteban, G.; Schmid, G. On-line monitoring of infected Sf-9 insect cell cultures by scanning permittivity measurements and comparison with off-line biovolume measurements. Cytotechnology 2007, 55, 115–124. [Google Scholar] [CrossRef] [PubMed]
- Opel, C.F.; Li, J.; Amanullah, A. Quantitative modeling of viable cell density, cell size, intracellular conductivity, and membrane capacitance in batch and fed-batch CHO processes using dielectric spectroscopy. Biotechnol. Prog. 2010, 26, 1187–1199. [Google Scholar] [CrossRef] [PubMed]
- Cannizzaro, C.; Gügerli, R.; Marison, I.; von Stockar, U. On-line biomass monitoring of CHO perfusion culture with scanning dielectric spectroscopy. Biotechnol. Bioeng. 2003, 84, 597–610. [Google Scholar] [CrossRef] [PubMed]
- Párta, L.; Zalai, D.; Borbély, S.; Putics, Á. Application of dielectric spectroscopy for monitoring high cell density in monoclonal antibody producing CHO cell cultivations. Bioprocess Biosyst. Eng. 2013, 37, 311–323. [Google Scholar] [CrossRef] [PubMed]
- Aehle, M.; Simutis, R.; Lubbert, A. Comparison of viable cell concentration estimation methods for a mammalian cell cultivation process. Cytotechnology 2010, 62, 413–422. [Google Scholar] [CrossRef] [PubMed]
- Zeiser, A.; Bédard, C.; Voyer, R.; Jardin, B.; Tom, R.; Kamen, A.A. On-line monitoring of the progress of infection in Sf-9 insect cell cultures using relative permittivity measurements. Biotechnol. Bioeng. 1999, 63, 122–126. [Google Scholar] [CrossRef]
- Negrete, A.; Esteban, G.; Kotin, R.M. Process optimization of large-scale production of recombinant adeno-associated vectors using dielectric spectroscopy. Appl. Microbiol. Biotechnol. 2007, 76, 761–772. [Google Scholar] [CrossRef] [PubMed]
- Chang, K.H.; Park, J.-H.; Hwang-Bo, J.; Chung, D.K.; Kim, W.; Chung, I.S. Drosophila melanogaster S2 cells are more suitable for the production of recombinant COX-1 than Trichoplusia ni BTI TN-5B1-4 cells. Biotechnol. Bioprocess Eng. 2014, 19, 803–810. [Google Scholar] [CrossRef]
- Park, J.-H.; Hwang, I.-S.; Kim, K.-I.; Lee, J.-M.; Park, Y.-M.; Park, C.-H.; Chung, I.S. Functional expression of recombinant human ribonuclease/angiogenin inhibitor in stably transformed Drosophila melanogaster S2 cells. Cytotechnology 2008, 57, 93–99. [Google Scholar] [CrossRef] [PubMed]
- Lee, J.M.; Jeon, H.-B.; Sohn, B.H.; Chung, I.S. Functional expression of recombinant canstatin in stably transformed Drosophila melanogaster S2 cells. Protein Exp. Purif. 2007, 52, 258–264. [Google Scholar] [CrossRef] [PubMed]
- Bunch, T.A.; Grinblat, Y.; Goldstein, L.S. Characterization and use of the Drosophila metallothionein promoter in cultured Drosophila melanogaster cells. Nucleic Acids Res. 1988, 16, 1043–1061. [Google Scholar] [CrossRef] [PubMed]
- Lim, H.J.; Cha, H.J. Observation and modeling of induction effect on human transferrin production from stably transfected Drosophila S2 cell culture. Enzyme Microb. Technol. 2006, 39, 208–214. [Google Scholar] [CrossRef]
- Patel, P.; Markx, G.H. Dielectric measurement of cell death. Enzyme Microb. Technol. 2008, 43, 463–470. [Google Scholar] [CrossRef]
- Ansorge, S.; Esteban, G.; Schmid, G. Multifrequency permittivity measurements enable on-line monitoring of changes in intracellular conductivity due to nutrient limitations during batch cultivations of CHO cells. Biotechnol. Prog. 2010, 26, 272–283. [Google Scholar] [CrossRef] [PubMed]
- Tibayrenc, P.; Preziosi-Belloy, L.; Ghommidh, C. On-line monitoring of dielectrical properties of yeast cells during a stress-model alcoholic fermentation. Process Biochem. 2011, 46, 193–201. [Google Scholar] [CrossRef]
- Noll, T.; Biselli, M. Dielectric spectroscopy in the cultivation of suspended and immobilized hybridoma cells. J. Biotechnol. 1998, 63, 187–198. [Google Scholar] [CrossRef]
- Kretzmer, G. Industrial processes with animal cells. Appl. Microbiol. Biotechnol. 2002, 59, 135–142. [Google Scholar] [CrossRef] [PubMed]
- Ceaglio, N.; Bollati-Fogolín, M.; Oggero, M.; Etcheverrigaray, M.; Kratje, R. High Cell Density Cultivation Process. In Animal Cell Biotechnology In Biologics Production; De Gruyter: Berlin/Heidelberg, Germany; Boston, MA, USA, 2014; ISBN 978-3-11-027896-5. [Google Scholar]
- Rose, S.; Black, T.; Ramakrishnan, D. Mammalian Cell Culture. In Handbook of Industrial Cell Culture; Humana Press: Totowa, NJ, USA, 2003; pp. 69–103. ISBN 978-1-61737-315-2. [Google Scholar]
- Vits, H.; Hu, W.-S. Fluctuations in Continuous Mammalian Cell Bioreactors with Retention. Biotechnol. Prog. 1992, 8, 397–403. [Google Scholar] [CrossRef] [PubMed]
- Dowd, J.E.; Jubb, A.; Kwok, K.E.; Piret, J.M. Optimization and control of perfusion cultures using a viable cell probe and cell specific perfusion rates. Cytotechnology 2003, 42, 35–45. [Google Scholar] [CrossRef] [PubMed]
- Ducommun, P.; Ruffieux, P.-A.; Kadouri, A.; von Stockar, U.; Marison, I.W. Monitoring of temperature effects on animal cell metabolism in a packed bed process. Biotechnol. Bioeng. 2002, 77, 838–842. [Google Scholar] [CrossRef] [PubMed]
- Merten, O.W.; Palfi, G.E.; Stäheli, J.; Steiner, J. Invasive infrared sensor for the determination of the cell number in a continuous fermentation of hybridomas. Dev. Biol. Stand. 1987, 66, 357–360. [Google Scholar] [PubMed]


| Prediction Based on Optical Density OD880 | |
| Inverse calibration | |
| Classical calibration | |
| Prediction Based on Permittivity ε | |
| Inverse calibration | |
| Classical calibration | |
© 2018 by the authors. Licensee MDPI, Basel, Switzerland. This article is an open access article distributed under the terms and conditions of the Creative Commons Attribution (CC BY) license (http://creativecommons.org/licenses/by/4.0/).
Share and Cite
Zitzmann, J.; Weidner, T.; Eichner, G.; Salzig, D.; Czermak, P. Dielectric Spectroscopy and Optical Density Measurement for the Online Monitoring and Control of Recombinant Protein Production in Stably Transformed Drosophila melanogaster S2 Cells. Sensors 2018, 18, 900. https://doi.org/10.3390/s18030900
Zitzmann J, Weidner T, Eichner G, Salzig D, Czermak P. Dielectric Spectroscopy and Optical Density Measurement for the Online Monitoring and Control of Recombinant Protein Production in Stably Transformed Drosophila melanogaster S2 Cells. Sensors. 2018; 18(3):900. https://doi.org/10.3390/s18030900
Chicago/Turabian StyleZitzmann, Jan, Tobias Weidner, Gerrit Eichner, Denise Salzig, and Peter Czermak. 2018. "Dielectric Spectroscopy and Optical Density Measurement for the Online Monitoring and Control of Recombinant Protein Production in Stably Transformed Drosophila melanogaster S2 Cells" Sensors 18, no. 3: 900. https://doi.org/10.3390/s18030900