Article

The Role of Habitat Heterogeneity in Structuring Mangrove Bird Assemblages

by
Jayasilan Mohd-Azlan
1,2,
Richard A. Noske
1,† and
Michael J. Lawes
1,*,†
1
Research Institute for the Environment and Livelihoods, Charles Darwin University, Darwin 0909, Australia
2
Department of Zoology, Faculty of Resource Science and Technology, Universiti Malaysia Sarawak, 94300 Kota Samarahan, Sarawak, Malaysia
*
Author to whom correspondence should be addressed.
These authors contributed equally to this work.
Diversity 2015, 7(2), 118-136; https://doi.org/10.3390/d7020118
Submission received: 2 March 2015 / Revised: 13 April 2015 / Accepted: 14 April 2015 / Published: 20 April 2015
(This article belongs to the Special Issue Mangrove Conservation)

Abstract

:
Mangrove habitats are under severe land use pressure throughout the world and Australia is no exception. Here we describe the heterogeneity of mangrove habitat and its relationship with mangrove bird diversity. We examined the role of mangrove habitat complexity in determining the richness of avian mangrove dependent species (MDS) and interior species, overall bird species richness and density. High species richness (overall and MDS) and density in the mangroves was associated with plant species richness, the density of the understory and food resource distribution. Furthermore, habitat heterogeneity rather than patch area per se was a more important predictor of species richness in the mangroves. These findings stress the importance of habitat diversity and quality to the diversity and density of birds in mangroves. Thus, habitat heterogeneity within mangroves is a crucial patch characteristic, independent of mangrove patch size, for maintaining diverse avian species assemblages.

1. Introduction

The effect of habitat heterogeneity on species diversity is a fundamental concept in community ecology often invoked to account for the absence of a species-area effect [1]. The relationship between habitat heterogeneity and bird species diversity is a well-documented pattern in community ecology [2]. Studies comparing disparate ecosystem groups have revealed that structurally complex ecosystems are more diverse with strong species richness-habitat heterogeneity relationships [3,4,5,6,7,8]. Several studies have compared bird species richness in mangroves to other forest types in relation to habitat complexity [3,7], based on the premise that as mangroves are structurally simple over large areas and have low plant species richness, with the prediction that bird species diversity is driven less by area effects than habitat heterogeneity effects. To date no attempt has been made to examine the effect of intrinsic habitat factors within mangrove forest on bird species composition. In Australia, only one study has documented the effects of various types of habitat disturbance on mangrove bird assemblages [9] but did not explicitly examine the influence of habitat heterogeneity per se.
Bird species richness and diversity in terrestrial landscapes is closely related to habitat structure and floristic characteristics, where larger areas tend to have more diverse habitats, both structurally and floristically, that bird species can occupy, resulting in greater bird diversity [1,10]. In most habitats, habitat heterogeneity is expected to increase with patch size as larger patches will contain a greater diversity of microhabitats [11,12]. In structurally simple habitats like mangroves, habitat heterogeneity is less pronounced and may limit the number of coexisting species in mangroves [13]. Many studies have shown that habitats with greater structural complexity support greater bird diversity [14,15,16]. This pattern is not only limited to bird communities but has also been observed in non-volant small mammals [17], ungulates [18], reef fish [19], arthropods [20] and bats [21,22]. However, statistical support for the species-habitat heterogeneity relationship is biased towards vertebrates and habitats under anthropogenic influence [2] and varies among taxonomic groups. The exact mechanism that drives the relationship between bird species richness and habitat heterogeneity is still debated [15]. For example, an increase in foliage structural diversity has been reported to increase the number of habitat niches and in turn faunal species richness [5,23,24]. Recently, some authors have suggested that the latter trends arise due to an increase in productivity in complex habitats, which in turn increases the resources available to a larger number of species [16,25,26]. In contrast to these general trends, Cousin and Phillips [15] found no significant correlation between habitat complexity and bird species richness in woodlands of south-western Australia, suggesting that such relationships may be weak in resource poor environments. Similarly, Wethered and Lawes [27] found no effect of microhabitat diversity on bird species richness in Afromontane forest patches in South Africa. Thus, structurally simple habitat such as mangrove forest may offer fewer microhabitats and specialized niches for species to occupy, resulting in relatively low bird species richness and simple assemblage structure.
Consistent with MacArthur and MacArthur’s [24] model, vegetation structure is a primary determinant of the composition of many bird species assemblages. In arid Australian landscapes comprising simple habitats, bird community composition is determined by breeding requirements and vegetation structure rather than resource availability and disturbance regimes [28]. Structurally simple mangrove forests may affect the bird community in a similarly deterministic way. Besides being an important factor in contributing to the increase in species richness and diversity, habitat structure is also an important determinant influencing habitat selection and distribution of species, especially in complex habitats such as tropical forest [29]. For example, in the Northern Territory, Woinarski et al. [30] reported that species richness and abundance of birds was significantly greater in forested riparian zones compared to non-riparian habitats, and that species composition also varied within habitats depending on their relative complexity.
Mangrove vegetation zonation, the occurrence of mangrove species in discrete bands parallel to the tidal gradient, is known to influence the distribution of certain mangrove birds (e.g. waders, rails) [9,31,32,33]. Zonal species associations in mangroves may be important to understanding the habitat requirements of mangrove birds for conservation and management. In this paper we examine variation in bird assemblage composition and diversity among mangrove sites of varying structural and floristic complexity to determine: (1) whether bird species richness is affected by mangrove habitat heterogeneity; and (2) the most important habitat correlates of bird species richness and density in mangroves.

2. Methods

2.1. Study Sites, Vegetation and Bird Sampling Methods

The study sites were thirteen mangrove patches in the Darwin Region [34]. The area of mangrove at each site was estimated from satellite photographs (1994 QuickBird satellite image–pan-sharpened 60 cm resolution) using ArcGIS 9.3. Birds were censused using the variable width line transect method [35]. Transects were walked twice a month at all sites from February 2008 to May 2009. Birds passing overhead (commuter species) and all seabirds and migratory waders were excluded from the analysis. Species were assigned to six different functional groups defined by Sekercioglu [36]. Seventy species were classified in this way with some species assigned to more than one functional group. Many bird species found in mangroves are also temporary residents of adjacent habitats and similar habitats further inland [7,37]. Mangrove dependent species (MDS) were defined in this study as those species that were relatively restricted to mangroves and that spent most of their foraging time in mangroves (or were uncommon or absent from other habitats) and that usually nested in mangroves; on this basis MDS were identified from Noske [32]. Species that were observed only well within mangrove patches were classified as “interior” species; this excluded species at mangrove edges and those that also used the matrices. Bird diversity, abundance and density estimation have been described in Mohd-Azlan et al. [33].
Vegetation plots were laid out in a stratified random sampling design. At each site two 5 m × 5 m plots (25 m2) were randomly positioned in each mangrove zone (see below for description of zones) and three plots in the monsoon rainforest if present. Several smaller plots were nested within each plot; one 2.5 m × 2.5 m (6.25 m2) and two 1.25 m × 1.25 m (1.56 m2) plots. The number of mangrove zones varied among sites and thus the total number of plots sampled varied among sites. Data for 24 environmental, geomorphological and vegetation variables were recorded from each zone at each site. Data for some variables, such as size of the saltpans, were derived from satellite imagery (QuickBird satellite image–pan-sharpened 60 cm resolution, 1994). The vegetation variables were assigned to three categories: diameter at breast height (DBH) classes (3 levels), height classes (8 levels) and a vegetation profile was constructed by estimating the projected density of foliage in seven height classes (0–2, 2–4, 4–6, 6–8, 8–10, 10–12, and 12–14) [38]. Physical disturbances affected by tidal regimes, such as the distribution of garbage (domestic waste, i.e., plastics, metal scrap, wood debris), tracks (terrestrial large animal and human tracks), and bare ground, were excluded from analyses as they are transitory in nature and have no clear ecological correlation to bird ecology. Diversity indices are sensitive to sample size [39,40,41], thus plant species richness was used a measure of plant species diversity.

2.2. Habitat Heterogeneity Measurements

Hutchings and Saenger [42] describe zonation as the spatial expression of plant succession. Mangrove forests are structurally simple and zonal, with zones comprising monospecific forest stands with little difference in structure and complexity among sites. For the purpose of this study, mangrove zones are defined as monospecific stands of mangrove species arranged in bands parallel to shorelines or creeks. This excludes individual Avicennia marina trees occurring in otherwise monospecific stands of other zones. The number of mangrove zones (A. marina, Bruguiera exaristata, Ceriops australis, Rhizophora stylosa, Lumnitzera racemosa and Sonneratia alba) along transect lines was counted at each site. The area of saltpans, calculated from satellite images, were measured in each patch using ArcGIS. Saltpans are barren areas normally located near the upper intertidal areas of the mangroves.
Habitat heterogeneity measures vary depending on the taxonomic group studied and their spatial resolution [2]. The term heterogeneity and complexity have been used interchangeably to describe various aspects of habitat form [43]. In this study habitat heterogeneity is defined as the diversity of vertical and horizontal vegetation structural properties, other physical correlates within a site, and geomorphological features. Mangrove zones are not equally distributed at each site. Thus a weighted mean of each heterogeneity variable for each zone was used. An estimate of the proportional area covered by a zone was scored out of 10. For example, if the A. marina zone covered 50% of the site then a score of 5 was assigned. For site means of a variable, the mean value for each zone was corrected by the given score. All percentage values were arcsine transformed for analyses.
Canopy cover is defined as the proportion of a plot that is covered by the tree canopy stratum and is normally expressed as a percentage where the maximum cover of any one species is 100 percent [44]. The percent of canopy and salt tolerant grass/shrub cover (e.g. Sporobolus virginicus, Tecticornia sp., Sueda sp.) were scored in each 25 m2 plot, while pencil (pneumatophores of A. marina) and knee roots (Bruguiera sp.) were counted within two 1.56 m2 plots. Vertical foliage structure is the vertical arrangement of vegetation including foliage and branches within each mangrove zone and was measured as a percentage within each of seven height classes (0–2, 2–4, 4–6, 6–8, 8–10, 10–12, and 12–14 m). Mean tree height for a zone was estimated. Mean stem densities at each site were estimated for each DBH (diameter at breast height) or height class, corrected for quadrat area and for the contribution of each zone to the numbers of stems in the habitat. The density of stems within the seven height classes was calculated. Tree diameter was measured using a digital calliper for smaller trees and a DBH tape for large trees. For R. stylosa, DBH was measured above the highest prop-root when this arose from the stem at a height above 1.3 m [45]. For smaller trees (<1 cm DBH) diameters were measured at the stem base. Tree density was estimated for three diameter classes (<2 cm, 2–10 cm, >10 cm), and averaged for each zone and sub-plot size. To ensure density estimates were comparable, all estimates were scaled to 5 m × 5 m. For example, estimates from 2.5 m × 2.5 m plots were multiplied by 4, and from 1.25 m × 1.25 m plots by 16, so that mean density of stems in a zone was reported per 25 m2. Fisher’s α was used to describe the plant and bird diversity in mangrove zones as it has a number of advantages over other commonly used indices of biodiversity. It is not overly influenced by the sample size and is less affected by the abundance of the commonest species than either Shannon’s or Simpson’s index [40,46].

2.3. Data Analysis

2.3.1. Principle Component Analysis

A data matrix of habitat heterogeneity variables and species abundances by site was subjected to Principal Component Analysis (PCA) using PC-ORD (Ver. 4.34) [47], to examine the collinearity of the habitat heterogeneity variables and reduce the numbers of variables to a meaningful and orthogonal set [48]. Bird species richness and density, in the categories—overall species richness, interior species richness, mangrove dependent species richness, and species density—and environmental variables were overlaid on a joint plot. Analyses were performed on the correlation matrix, which standardizes variables measured on different scales [47]. Eigenvalues for each principal component were compared to a broken-stick eigenvalue to determine if the captured variance summarized more information than expected by chance [49] and only habitat heterogeneity variables that accounted for the highest percentage of variance on the first two component axes were chosen for each analysis. The PCA scores for the subset of heterogeneity variables identified by PCA were used as a composite explanatory variable of MDS richness, interior species richness, overall species richness, and bird density in separate generalised linear models (GLM).

2.3.2. Generalised Linear Models

GLM were used to examine the effect of habitat heterogeneity on bird species richness using the statistical software GenStat 12.1 [50]. GLM assumes independent or at least uncorrelated observations which were identified using PCA in this study [51]. Because the numbers of bird species observed are counts, GLM were based on a Poisson distribution with a log (ln) link function.
To select among the competing models, an information theoretic approach was adopted based on Akaike’s Information Criterion (AIC) [52]. The AIC provides the evidence for the most parsimonious model in a set of a priori models that fit the data [52]. The AIC was corrected for small sample size AICc [53]. The smaller the AICc value for a particular model the better the model describes the relationship. Variables that increased the AICc value were removed during model refinement. The model where AICc is minimized represents the set of habitat variable(s) that best account for the variation among bird species assemblages. The models were weighted for comparison using Akaike weights, wi, which are the approximate probabilities that an a priori model is the best model in a candidate set and provides an estimate of model selection uncertainty [53]. Next, we calculated the weight of evidence (w+) for each explanatory variable as the sum of the Akaike weights for all of the models in which the effect was present [53]. The weight of evidence (w+) represents the probability that a given variable would be included in the best model. These estimates are reported with unconditional standard errors, which incorporate a variance component due to model selection uncertainty and thus better reflect the accuracy of a given model coefficient [53]. Multi-model inference based on model averaging for the best models was conducted [54]. This method is superior to making inferences concerning the relative importance of variables based on the best model [52]. From this analysis the probability of species occupancy as a function of habitat heterogeneity was derived and displayed graphically for selected species.

3. Results

3.1. Habitat Heterogeneity

Plant structure and physiognomy differed between sites. Charles Darwin National Park (CDNP) had the highest stem densities in the <2 cm DBH class, which mainly derived from the dominance of the Ceriops zone (Table 1). Ludmilla (LLA) had the tallest mangrove stand comprising A. marina along the creeks. Leanyer (LNY) and LLA had the highest percentage of grass cover (38.5% and 21.7%, respectively), which was distributed within the stunted A. marina zone. In addition, patches of monsoon rainforest also had relatively more grass cover than most mangrove zones. Canopy cover in the mangroves was relatively high, ranging from 40% to 50%. The area of saltpans increased significantly with the area of the mangrove (F1, 12 = 6.6, p = 0.03, R2 = 0.38). Mean tree species richness for mangroves in the Darwin region was 11.7 species (SE = 2.37). The most diverse patch was Buffalo Creek (BC) (Fisher’s α = 6.19) with 25 species while LNR (Fisher’s α = 0.65) had the lowest plant richness patch with only three species. The presence of monsoon rainforest species greatly increased plant richness (and bird species richness) in a mangrove complex [34].
The average number of creeks increased with the size of the mangrove stand (F1,12 = 4.57, p = 0.06, R2 = 0.294), while the modal number of mangrove zones at a site was 4 (SE = 0.41). Bird species richness was greater near tidal creeks (Figure 1). Most predator species (e.g. kingfishers, Striated Heron, Butorides striatus) were common near the creeks. Species in the mangrove bird assemblage were not evenly distributed among functional groups and species richness was mainly concentrated in the insectivore and pollinator guilds, with only a few species comprising the scavenger or seed disperser functions (Figure 2).
Figure 1. Overall bird species richness declined significantly with increasing distance from tidal creeks in the mangroves (F1, 52 = 366.31, p < 0.001, R2 = 0.88).
Diversity 07 00118 g001
Figure 2. Pie chart showing the percent proportion of bird species in mangroves by functional groups (N = 70 species; 14 species fell into two functional groups). Raptors, water birds, migratory waders, and commuter species are excluded.
Diversity 07 00118 g002
Table 1. Comparison of habitat variables measured from each dominant mangrove zone, weighted and averaged for 13 sites around Darwin. DBH = diameter at breast height; HC = height class and VP = vertical profile. Sites abbreviations are given below.
Habitat VariableBCBVCCRCDNPEABEAHEATEPLLALNRMDLNGLFRCRange
Transect length (m)82041044021104207508305605608006026080060–2110
Density by DBH class (stems/0.025 ha)
DBH > 103.81.73.31.651.22.31.02.02.52.83.12.22.11.2–3.6
DBH > 249.573.133.045.345.018.051.516.818.540.08.020.019.08–73.1
DBH < 2848.6626.0379.8944.4823.8264.8822.283.161.789.6072.0669.70–944.4
Density by height class (stems/0.025 ha)
HC1 (0–2)775.1540.6309.7968.2934.265.0806.7106.074.294.4072.2370.60–968.2
HC2 (2–4)29.857.914.517.226.511.148.66.61.027.200.87.024.50.8–58.0
HC3 (4–6)3.92.05.01.83.92.37.73.05.02.802.41.41.51.4–7.7
HC4 (6–8)1.50.12.00.70.20.71.40.82.102.11.00.30–2.02
HC5 (8–10)1.600.40.2000.60.70.600.50.20.40–1.6
HC6 (10–12)1.600.1000000.11.501.10.30.20–1.6
HC7 (12–14)000000000.500000–0.5
Vertical profile (%)
VP (0–2 m)45.04.0037.050.536.642.041.145.620.240.121.129.245.620.2–50.5
VP (2–4 m)40.344.939.833.245.151.140.331.430.338.828.724.437.924.4–51.0
VP (4–6 m)32.626.532.620.728.336.625.329.136.416.445.030.724.716.4–45.0
VP (6–8 m)25.55.019.811.510.010.812.927.129.7045.928.518.210.0–45.7
VP (8–10 m)12.9010.05.7009.114.835.8042.118.01.0.0–42.1
VP (10–12 m)6.406.60000023.908.17.05.00–23.9
VP (12–14 m)003.300000000000–3.3
Grass cover (%)16.1018.99.813.50021.121.738.50000–38.5
Canopy cover (%)49.343.344.243.546.146.941.143.739.640.844.339.846.439.6–49.3
Plant species richness25.07.027.09.011.09.08.027.07.03.05.077.03.0–27.0
Saltpan size (ha)9.200.517.40.73.13.60.82.28.0001.80–17.4
No. of pencil roots (Avicennia sp.)620.0216.0385.6522.6112.01212.2435.62637.02308.64227.21166.41762.41699.6112–2637
No. of knee roots (Bruguiera sp.)123.4159.413.679.8609.60214.838.127.20150.40108.00–609.6
No. of zones5454455541235.01–5
*No of garbage items0.24.41.40.100.90.21.53.45.53.00.39.80–5.5
*No of tracks0.100.300.34.503.50.41.00.500.030–4.5
*Bare ground (%)43.138.636.941.240.639.443.945.840.345.548.938.644.737.0–48.9
*Vegetation diversity (Fisher’s α)6.21.46.21.41.91.71.47.81.80.72.11.81.20.65–6.19
* Variables that were not considered for Principal Component Analysis (PCA). BC, Buffalo creek; BV, Bay view; CCR, Casuarina Coastal Reserve: CDNP, Charles Darwin National Park; EAB, East Arm Barrage; EAH, East Arm Hamaura; EAT, East Arm Train; EP, East Point; LLA, Ludmilla; LNR, Leanyer; MDL, Mindil; NGLF, Nightcliff; RC, Rapid Creek.

3.2. Habitat Heterogeneity and Bird Species Composition

Broken stick eigenvalues indicate that the first principal component (PC1) captured more variance than expected by chance and selection of the 25 habitat heterogeneity variables was based on the variable weightings for the first two component axes.
For MDS the habitat variables selected from the PCA accounted for 65.5% of variance in the data as compared to 38.7% when all the species were examined. This suggests that MDS are more influenced by habitat heterogeneity than other categories of bird species (Table 2). The number of mangroves zones at a site was an important habitat heterogeneity variable and was included among the most influential variables for all categories of bird species, except MDS (the latter are widely distributed in the mangroves) (Table 3). The number of mangrove zones was correlated with mangrove plant species richness (excluding the rainforest species) (F1, 12 = 8.8, p = 0.01, R2 = 0.45).
The best fit models of habitat heterogeneity included only plant species richness, grass cover and the density of stems DBH < 2 cm for overall, interior and mangrove dependent species richness, respectively (Table 4). The deviance accounted for by the best fit models ranged from 19.7%–45.0%. Accordingly, the weight of evidence (w+) for each explanatory variable, reflecting the relative importance of habitat heterogeneity variables, was generally low for all categories of species richness (Table 5). Plant species richness was influential only in the case of total bird species richness (w+ = 0.49). Habitat heterogeneity variables had little influence on interior species (Table 4).
From model averaging, plant species richness had the highest relative importance (w+) of 0.49 compared to the next most influential variable, grass cover, which had a w+ of 0.29 (Table 5). For the other bird species richness categories the best fit models based on AICc included only percent grass cover where interior species were concerned and only stem density in the <2cm DBH class for MDS richness (Table 4). The latter suggests that dense undergrowth is an important criterion for mangrove dependent species. Bird density was related to the plant species richness and the density of pencil roots (Table 4 and Table 5), which in turn was determined by the presence of A. marina. This relationship suggests that birds are attracted to A. marina.

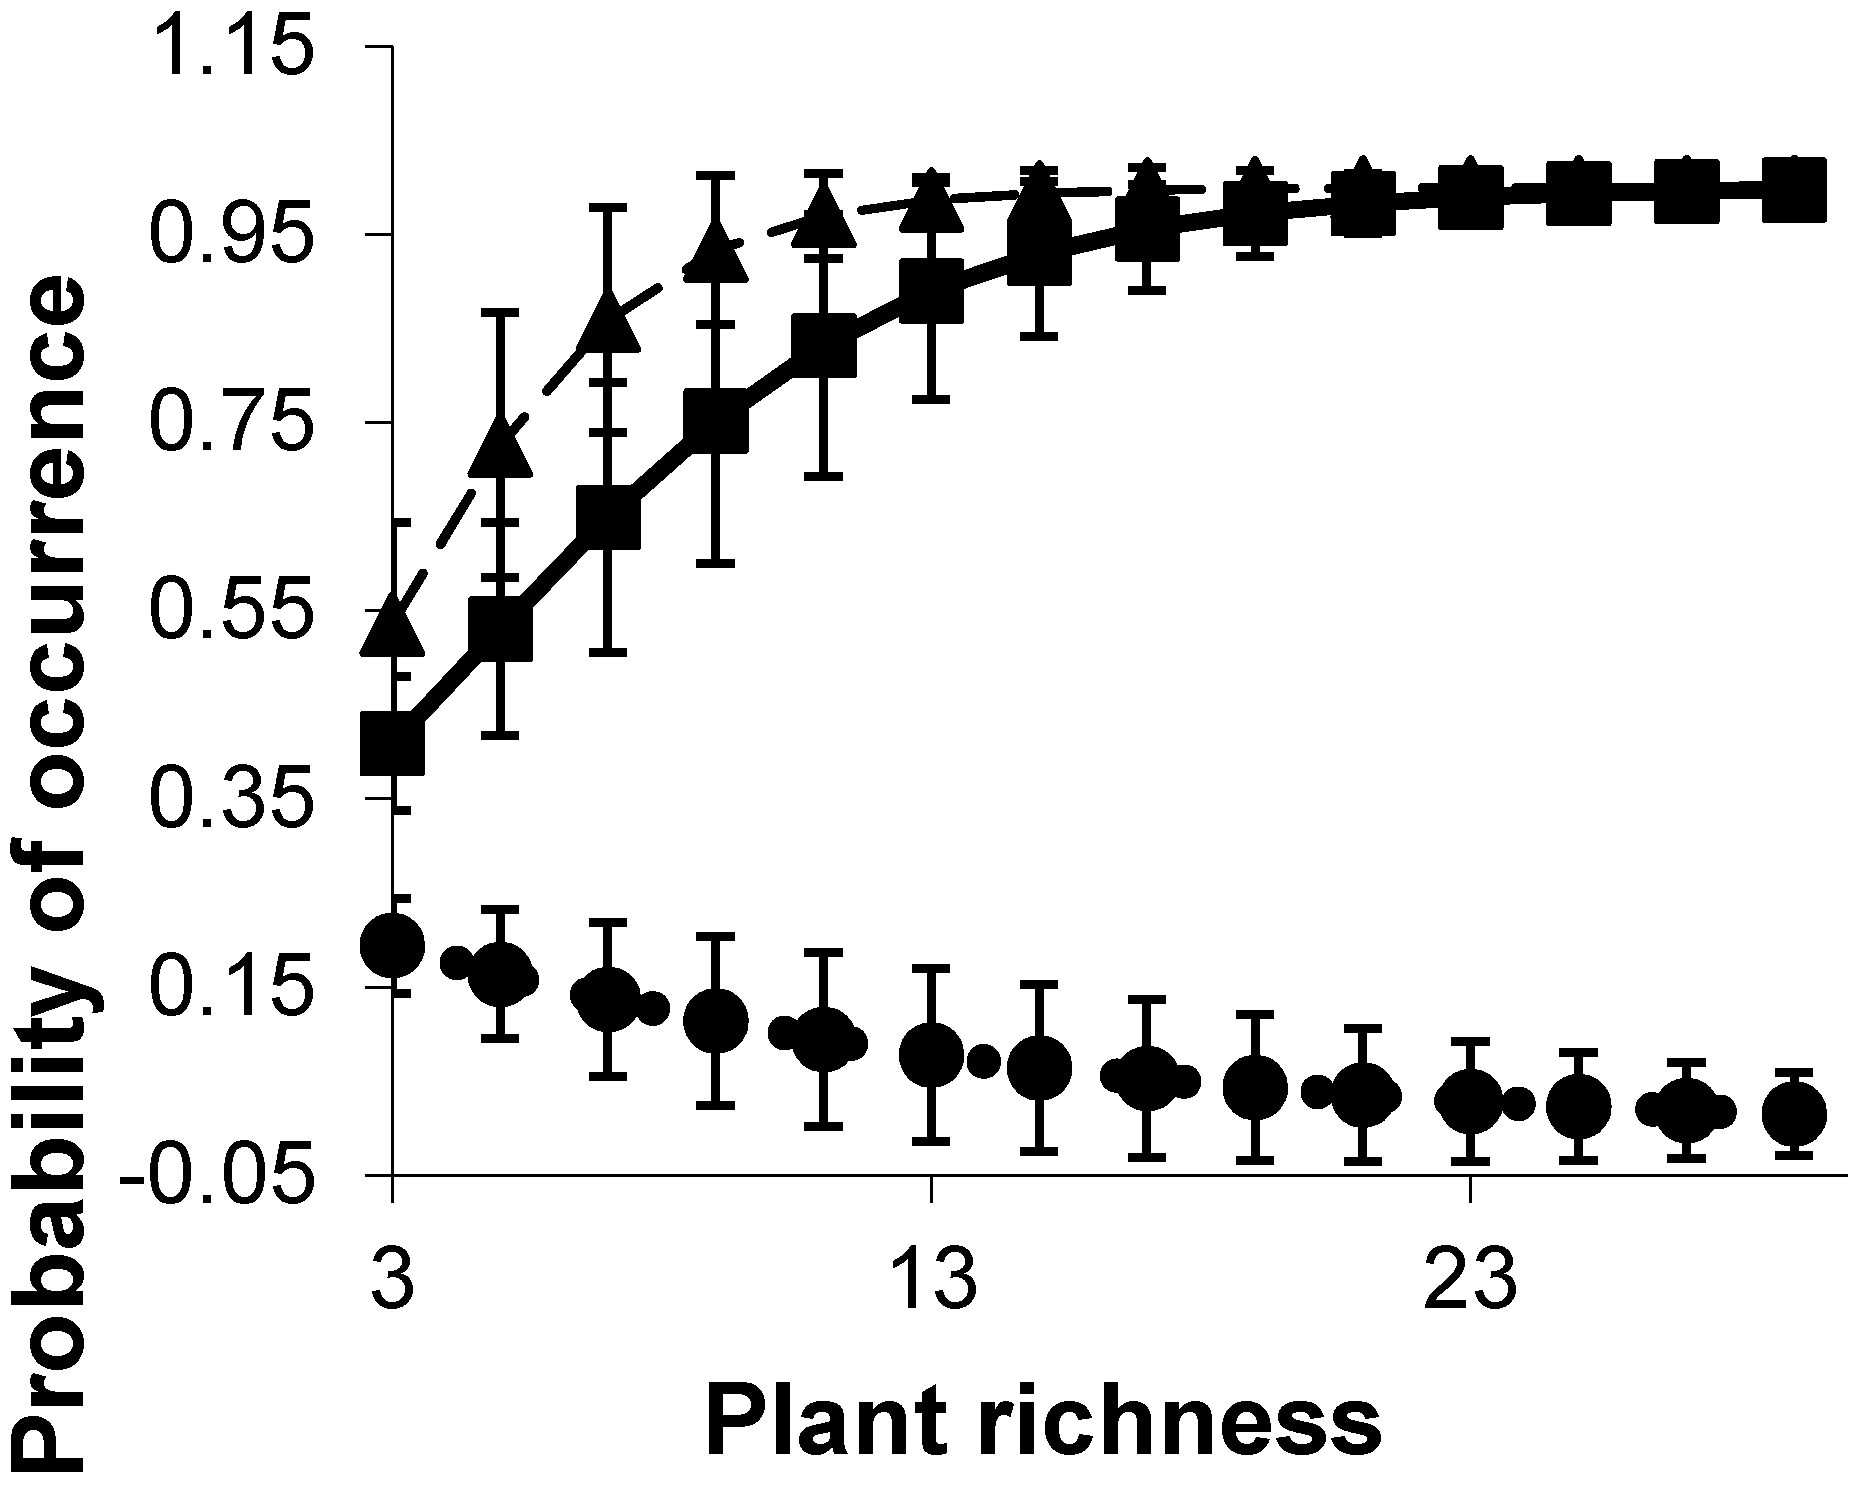
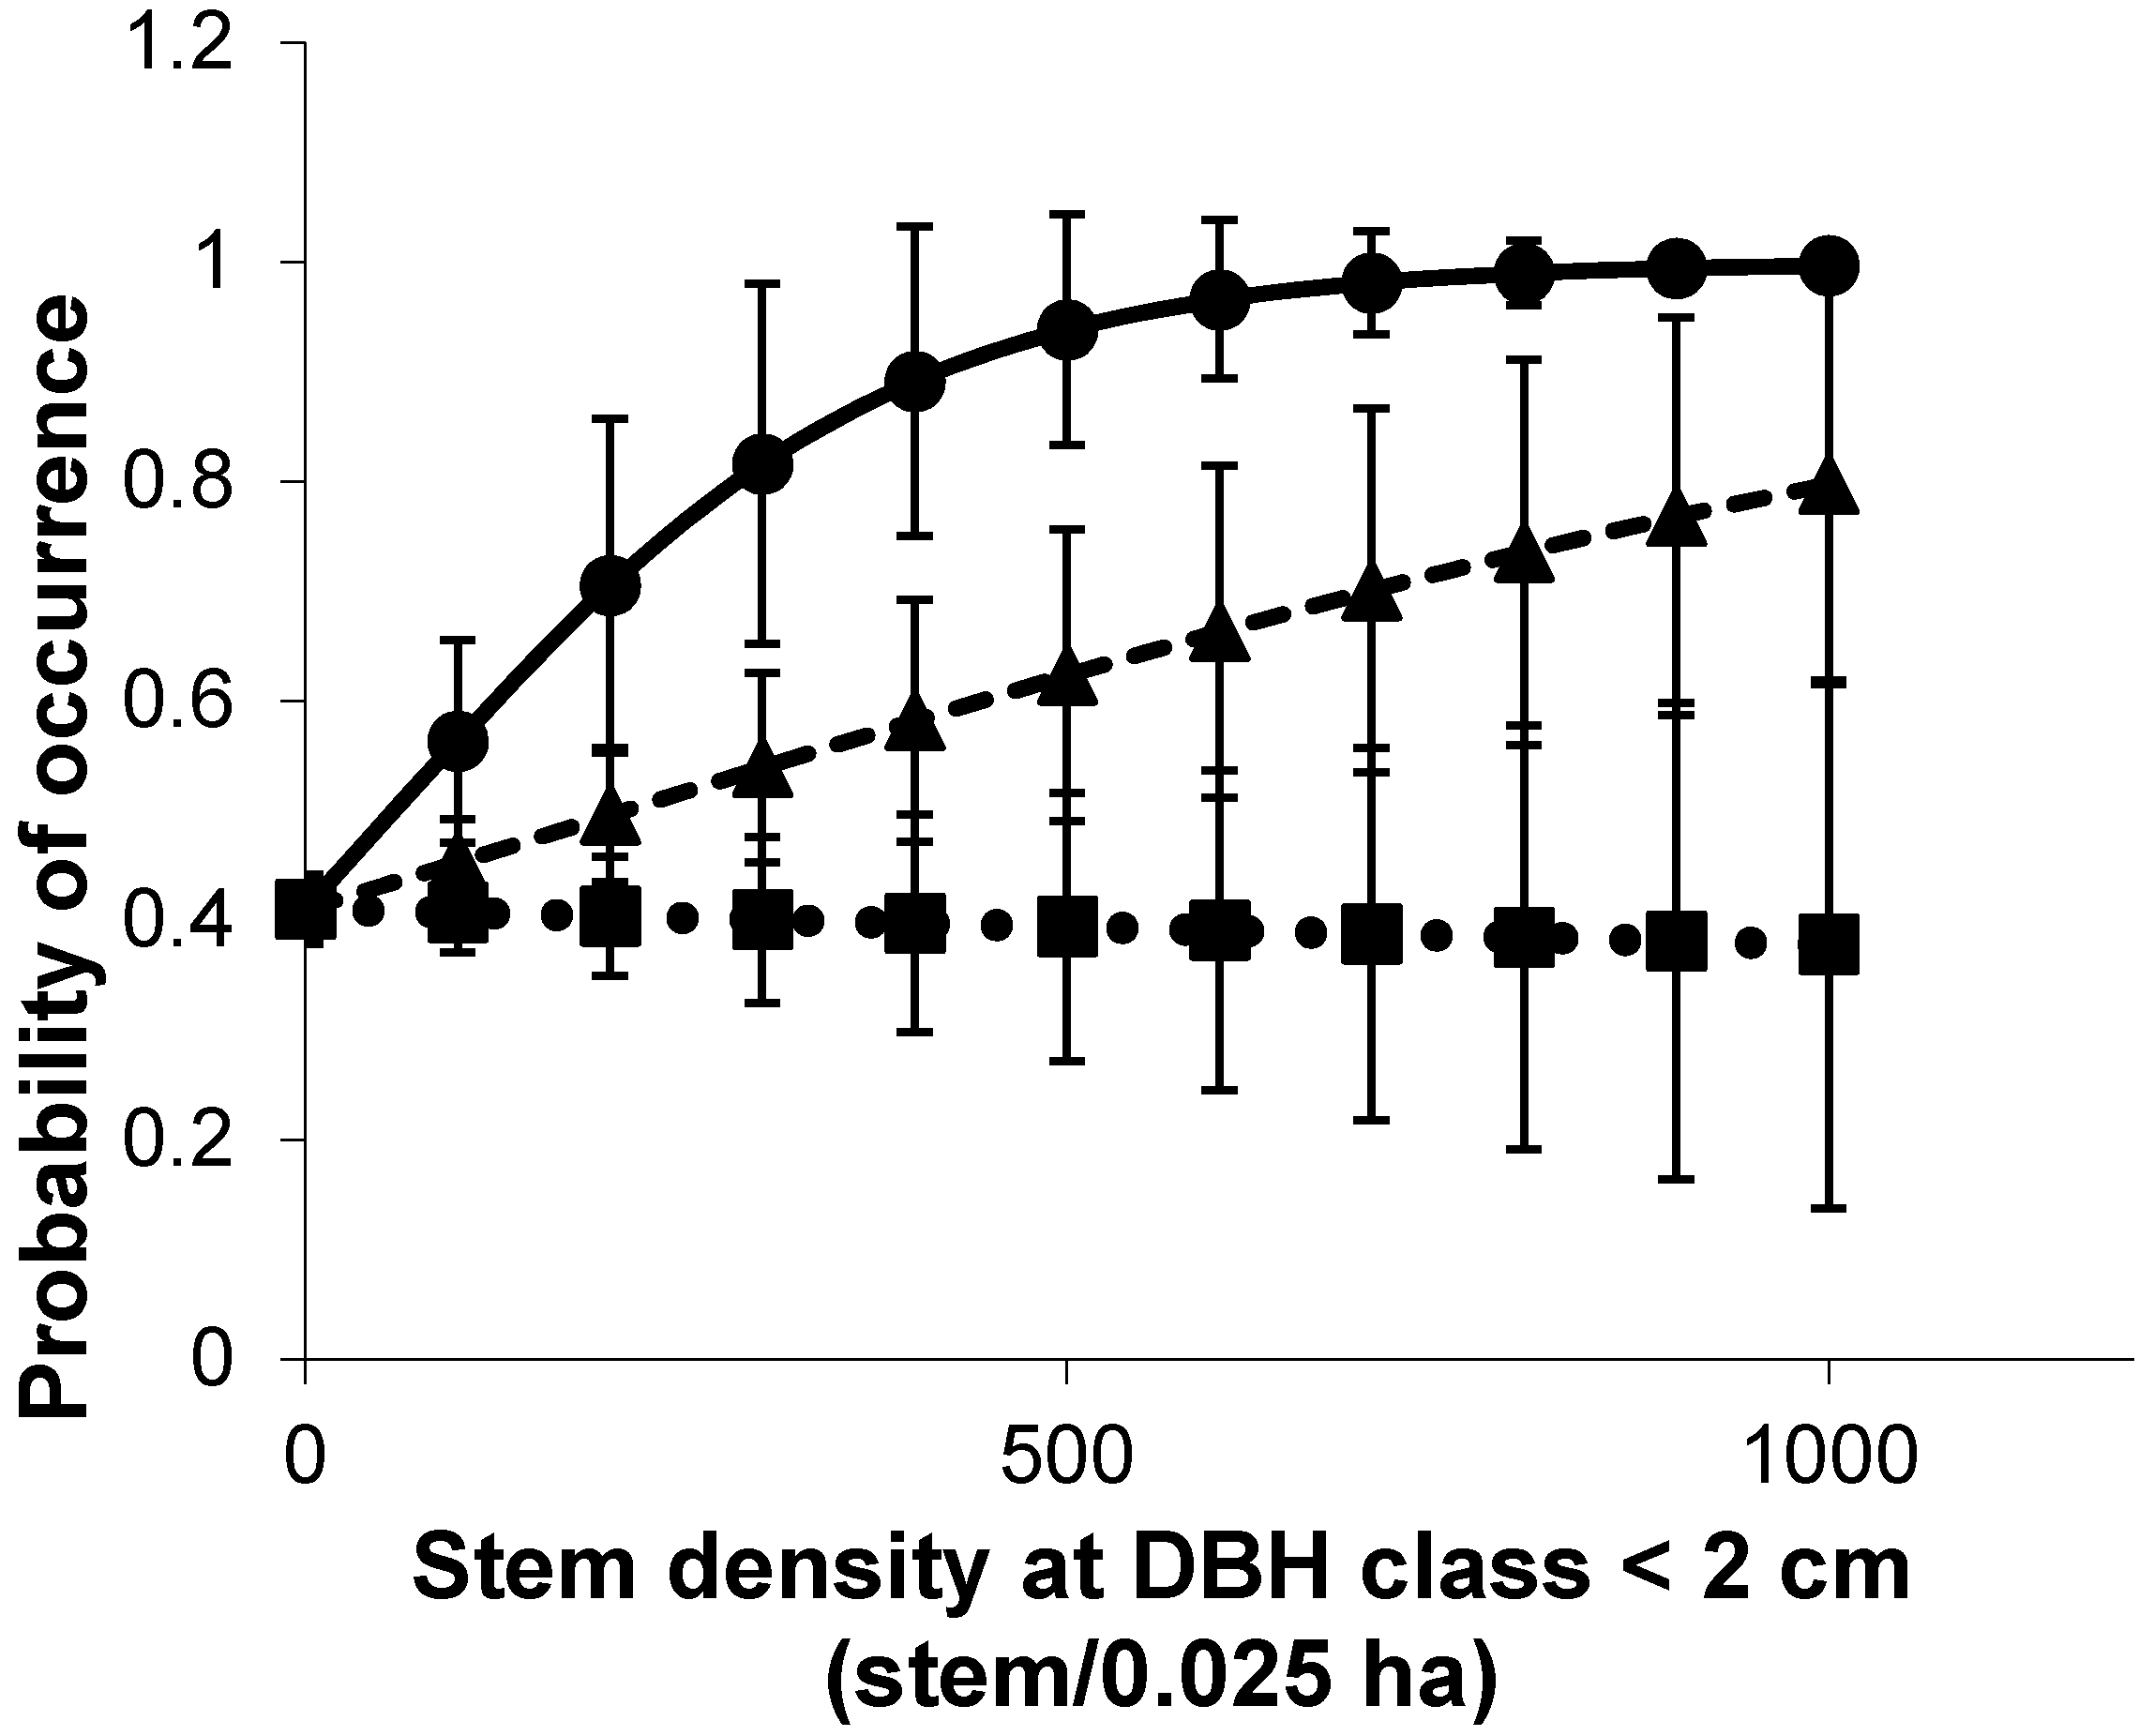
3.3. Habitat Heterogeneity Predictors of Bird Species Richness and Density

There was a trend of increasing insectivore species richness (including insectivorous honeyeaters) with mangrove plant species richness (F1, 12 = 4.03, p = 0.07, R2 = 0.27). A significant relationship was detected between the species richness of seed disperser bird species and plant species richness in the mangrove complex (mangel), which includes patches of monsoon rainforest on raised cheniers protected from tides (F1, 12 = 4.77, p = 0.05, R2 = 0.3), highlighting the role of seed dispersers in establishing monsoon rainforest on suitable substrates within mangrove stands.
The probability of occurrence of relatively common generalist bird species increased monotonically with plant species richness (Figure 3), while species that only sheltered in the mangroves occurred irrespective of the mangrove plant species richness. Dense understorey was preferred by ground foragers such as the Mangrove Robin (Peneoenanthe pulverulenta) and Chestnut Rail (Eulabeornis castaneoventris) (Figure 4).
Table 2. Eigenvalues and broken-stick eigenvalues for the first axis of the Principle Components Analysis of the correlation matrix between avian richness measures and 25 habitat heterogeneity variables.
CategoryEigenvalue% of VarianceBroken-Stick Eigenvalue% of Variables SelectedNo. of Species
Overall Species15.438.74.82970
Interior species13.241.04.73861
Mangrove dependent species (MDS)4.765.53.02112
Species density13.334.34.83870
Table 3. Pearson and Kendall correlations between habitat heterogeneity variables and four measures of avian species richness and density (a–d), from a Principle Components Analysis.
(a) Interior Species(b) Species Density(c) Overall Species Richness(d) MDS Richness
VariablesAxisR2VariablesAxisR2VariablesAxisR2VariablesAxis R2
DBH < 210.38VP 4–610.37HC510.48DBH < 210.28
HC110.38VP 12–1410.32Zones10.38HC110.27
Zones10.28Zones10.43Plant richness10.60VP 0–210.36
Saltpan10.36Plant richness10.49Canopy cover10.34Saltpan10.68
VP 4–620.48Canopy cover10.32DBH > 1010.28DBH > 220.25
VP 6–820.31Pencil root10.31Grass (%)20.35
Saltpan20.51DBH > 220.27Pencil root20.48
Grass (%)20.41Grass (%)20.64
Pencil root20.27Pencil root20.31
Table 4. Results of the model selection procedure for (a) overall species, (b) interior species (c) MDS, and (e) species density. For each model: ΔAICc is the difference between the model’s AICc value and the minimum AICc of all models in the a priori set of models; wi is the Akaike weight for a model, representing the probability of a model being the best in the a priori set; explained deviance is the proportional reduction in residual deviance, relative to the null model; (K) is the number of estimable parameters. Models are ranked in ascending order of ΔAICc and only the models with ΔAICc < 4 are shown.
ModelΔAICc−2ln(L(θ))AICcKwiExplained Deviance
(a) Overall species richness
Plant richness 07.612.820.2138.5
Canopy cover1.69.314.520.0925.3
Zones1.89.514.720.0823.9
HC52.510.115.320.0618.7
Zones + grass2.56.715.330.0646.5
Plant richness + canopy cover2.66.815.530.0645.4
Plant richness + grass3.07.215.830.0542.5
Grass3.110.816.020.0413.5
Plant richness + pencil root3.47.616.230.0439.2
(b) Interior species richness
Grass03.08.220.1119.7
Zones0.033.18.320.1119.0
VP 4–60.13.28.420.1016.4
DBH < 20.43.48.620.0910.0
VP 6–80.43.48.620.099.3
HC10.53.58.720.097.3
Saltpan0.63.78.920.083.1
Zones + grass2.41.910.630.0348.8
(c) MDS richness
DBH < 202.57.720.1645.0
HC10.12.57.720.1543.1
VP 0–20.12.57.720.1542.9
DBH > 20.73.18.320.1230.3
DBH < 2 + VP 0–23.12.010.730.0454.3
DBH < 2 + saltpan3.52.411.130.0345.3
DBH < 2 + HC13.52.411.130.0345.2
(d) Species density
Pencil root014.620.020.2138.9
Pencil root + plant richness1.212.121.130.1249.4
Grass1.616.221.520.1032.3
Pencil root + zones2.113.122.130.0745.4
Pencil root + grass2.913.822.830.0542.3
Pencil root + VP 12–143.014.023.030.0541.5
Pencil root + canopy cover3.014.023.030.0541.5
Table 5. Relative influence of habitat heterogeneity variables and their unconditional standard errors (SE). The weight of evidence (w+) represents the probability that a given variable would be included in the best model.
w+Unconditional SE
Overall richness
Plant richness 0.490.0048
%Grass0.290.0023
%Canopy cover0.280.0026
Zones (n)0.220.0023
HC50.110.0015
DBH >10 cm0.090.0010
Pencil root0.080.0009
Interior species
%Grass0.250.0019
Zones (n)0.250.0019
VP 4–6 m0.170.0017
DBH < 2 cm0.150.0015
VP 6–8 m0.120.0014
HC10.120.0014
Saltpan (ha)0.090.0012
Pencil root0.050.0005
MDS richness
DBH < 2 cm0.330.0046
VP 0–2 m0.290.0043
HC10.260.0043
DBH > 2 cm0.220.0034
Saltpan (ha)0.110.0020
Species density
Pencil root0.790.0047
%Grass0.280.0024
Plant richness0.200.0021
DBH > 2 cm0.160.0018
VP 4–6 m0.120.0015
Zones (n)0.100.0013
%Canopy cover0.060.0008
VP 12–14 m0.060.0008
Figure 3. The probability of occurrence of a typical insectivore species (■, —) (Pachycephalidae: Grey Whistler, Pachycephala simplex), a common and generalist honeyeater species (▲, ---) (Meliphagidae: White-gaped Honeyeater, Lichenostomus unicolor) and a transient granivore species (●, ···) (Estrildidae: Chestnut-breasted Mannikin, Lonchura castaneothorax) with increasing plant richness in the mangroves. Standard errors (SE) of the estimates are denoted by vertical bars.
Diversity 07 00118 g003
Figure 4. Probability of occurrence of three MDS; Rallidae: Chestnut Rail (●, ─), Petroicidae: Mangrove Robin (▲, ---) and Dicruridae: Mangrove Fantail, Rhipidura phasiana (■, ···) with increasing plant stem density. This suggests that bird species that frequently forage on the ground or understorey prefer dense undergrowth. Standard errors (SE) of the estimates are denoted by vertical bars.
Diversity 07 00118 g004

4. Conclusion and Discussion

This study demonstrates that habitat heterogeneity influences species composition in mangroves. In general, increasing habitat heterogeneity accommodates more niches in a given space [55] and is associated with an increase in bird species richness and diversity; these niches are often distributed vertically in forests [43]. Although mangroves are structurally homogeneous compared to other forest habitats, there is nevertheless structural complexity in mangroves derived from mangrove species zonation, saltpan abundance and size, stem densities, the number and size of creeks and other factors. Some of this complexity increases with the area of the mangrove stand. Larger stands often have more creeks and larger saltpans. Indicator species analysis demonstrates that some species are strongly associated with particular zones, and as larger mangrove stands typically support more mangrove zones, they may also harbour more zone specialist bird species [33]. Thus, habitat heterogeneity has a demonstrable role in influencing mangrove bird community composition.
Bird species composition in mangroves was closely associated with both plant species composition and configuration of the vegetation structure. The latter is consistent with a large body of literature that demonstrates that increasing structural complexity of habitat is correlated with increasing bird species richness [3,5,24,56,57]. Tews et al. [2] introduced the concept of keystone features that are distinct spatial structures providing resources and shelter to animal species within habitat mosaics. In this study pockets of monsoon rainforest within the mangrove forest were a keystone habitat feature that influenced bird species richness. Monsoon rainforest patches provide a more heterogeneous vegetation structure to relatively homogeneous mangrove stands, which in turn provide additional foraging niches that potentially enable birds from within the mangroves and the adjacent matrix to coexist [5,34]. Consistent with the latter proposition, insectivorous bird species were more diverse in mangroves with greater plant species richness.
On islands off Arnhem Land in the Northern Territory of Australia, Woinarksi et al. [10] found that bird species richness was high in habitats with dense tree cover, especially in monsoon rainforest and mangrove forest. Avicedo and Aide [3] showed that high plant diversity and density of woody species in a complex understorey were the most important determinants of bird species richness in karst forests of Puerto Rico. Similarly, Berg [14] found that bird species richness was positively correlated with mean tree species richness, diversity, and DBH in low diversity and structurally simple deciduous temperate forest in central Sweden. In this study, canopy cover was the next most important variable (after plant species richness) associated with overall bird species richness. The importance of canopy cover has also been observed in savanna ironbark woodlands and tropical rainforest where canopy cover is a sensitive indicator of habitat alteration [5,58]. The absence of a relationship between avian species richness and the vertical profile structure of mangroves is most likely due to low vertical foliage complexity within monospecific stands of mangroves. Habitat stratification and diversity in mangroves appears to be captured in the horizontal dimension, represented by species zones and microhabitats, and is more important than vertical stratification in determining the structure of mangrove bird assemblages.
Specialist forest bird species increase in response to patch quality and plant species richness [5,59]. In this study, most MDS species preferred a dense understory and their diversity was strongly influenced by understorey vegetation density, probably due to the availability of arthropods and crustaceans there. In tropical savanna woodlands, changes to vegetation structure cause a reduction in bird species associated with dense vegetation [58]. Thus retaining dense understorey vegetation and the diversity of mangrove zones at a site is critical for maximising MDS richness.
The presence of grass (e.g. Sporobolus virginicus) at mangrove sites and the greater insect abundance associated with grasses may provide a plausible explanation for the increase in mangrove interior species (two-thirds of which are insectivores) at some sites. Saltpans in a salt tolerant grass matrix are also focal habitats for interior species, further emphasizing the importance of intrinsic mangrove patch quality for providing a diversity of resources.
Tidal creeks could potentially provide more food resources, both on the ground and on plant foliage [9,60]. For example, Mulyani [61] found that insect abundance increased near tidal creeks. The relative abundance of food resources near tidal creeks may be one reason for high bird species richness in the mangroves (Figure 1). An increase in bird species richness in riparian zones compared to non-riparian zones was also observed in Australian savanna, due to the greater plant species richness and structural complexity of riparian zones [30].
Understanding the ecological importance of habitat hetereogeneity is necessary to conserve mangrove bird species. Our analyses suggest that high species richness (overall and MDS) and density in the mangroves is determined by plant species richness, the presence of a dense understory and food resource distribution in relation to creeks. These findings stress the importance of habitat quality to the abundance of birds in mangroves. Plant species richness is the most important determinant for many insectivores and nectarivores, and maintaining associations between monsoon rainforest patches and mangroves in the Darwin region has had positive effects on many birds and plant species (seed dispersion, insect regulation) [34]. Mangrove patches that have high habitat heterogeneity and numbers of zones, particularly if they are closely associated with monsoon rainforest, clearly have high conservation significance for birds. Thus, mangrove patches with intact canopy cover and dense undergrowth, and five to six mangrove zones, should be given top priority for conservation to maintain the maximum diversity and density of mangrove birds.

Acknowledgments

Mohd-Azlan Jayasilan was supported by Universiti Malaysia Sarawak (UNIMAS), Ministry of Higher Education (MOHE) and an ARC research grant LP0667619. We are grateful to Stephen Garnett and Don Franklin for advice. We thank Andrew Campbell and the Research Institute for the Environment and Livelihoods for support. Darwin City Council, the Northern Territory Department of Planning and Infrastructure, the Royal Australian Air Force, the Parks and Wildlife Commission of the Northern Territory and Northern Territory Power and Water permitted access to mangrove sites. We are also grateful to Northern Territory Herbarium for identifying some of the herbarium specimens.

Author Contributions

Mohd-Azlan Jayasilan conceived the study, helped to design the survey, and collaborated on data analysis, and preparation of the manuscript. Richard A. Noske supervised the field work activities. Michael J. Lawes devised and designed the study, helped conduct data analyses, interpret results and prepare the manuscript. All authors read and approved the final manuscript.

Conflicts of Interest

The authors declare no conflict of interest.

References

  1. MacArthur, R.H.; Wilson, E.O. The Theory of Island Biogeography; Princeton University Press: Princeton, NJ, USA, 1967; p. 203. [Google Scholar]
  2. Tews, K.; Brose, U.; Grimm, V.; Tielbörger, K.; Wichmann, M.C.; Schwager, M.; Jeltsch, F. Animal species diversity driven by habitat heterogeneity/diversity: The important of keystone structures. J. Biogeogr. 2004, 31, 79–92. [Google Scholar] [CrossRef]
  3. Acevedo, M.A.; Aide, T.M. Bird community dynamics and habitat associations in karsts, mangrove and Pterocarpous forest fragments in an urban zone in Puerto Rico. Caribb. J. Sci. 2008, 44, 402–416. [Google Scholar]
  4. Lindenmayer, D.B.; Wood, J.T.; McBurney, L.; Michael, D.; Crane, M.; MacGregor, C.; Montague-Drake, R. Comparing bird species richness and assemblage composition between montane ash eucalypt forest and cool temperate rainforest—An empirical study from Victoria, south-eastern Australia. Emu 2010, 110, 109–117. [Google Scholar] [CrossRef]
  5. Raman, T.R.S. Effects of habitat structure and adjacent habitats on birds in tropical rainforest fragments and shaded plantations in the Western Ghats, India. Biodivers. Conserv. 2006, 15, 1577–1607. [Google Scholar] [CrossRef]
  6. Trainor, C.R. Species richness, habitat use and conservation of birds of Alor Islands, Lesser Sundas, Indonesia. Emu 2005, 105, 127–135. [Google Scholar] [CrossRef]
  7. Woinarski, J.C.Z.; Tidemann, S.C.; Kerin, S. Birds in a tropical mosaic: The distribution of bird species in relation to vegetation patterns. Wildl. Res. 1988, 15, 171–196. [Google Scholar] [CrossRef]
  8. Woinarski, J.C.Z.; Fisher, A. Wildlife of Lancewood (Acacia shirlyi) thickets and woodlands in northern Australia. 2. Comparisons with other environments of the region (Acacia woodlands, Eucalyptus savanna woodlands and monsoon rainforest. Wildl. Res. 1995, 22, 413–443. [Google Scholar] [CrossRef]
  9. Metcalfe, K. The Biological Diversity, Recovery from Disturbance and Rehabilitation of Mangroves in Darwin Harbour, Northern Territory. Ph.D. Thesis, Charles Darwin University, Darwin, Australia, 2007. [Google Scholar]
  10. Woinarski, J.C.Z.; Fisher, A.; Brennan, K.; Morris, I.; Chatta, R. Patterns of bird species richness and composition on islands off Arnhem Land, Northern Territory, Australia. Austral Ecol. 2001, 26, 1–13. [Google Scholar]
  11. Connor, E.F.; McCoy, E.D. The statistics and biology of the species-area relationship. Am. Nat. 1979, 113, 791–833. [Google Scholar] [CrossRef]
  12. MacArthur, R.H.; Pianka, E.R. On the optimal use of a patchy environment. Am. Nat. 1966, 100, 603–609. [Google Scholar] [CrossRef]
  13. Ford, J. Origin, evolution and speciation of birds specialized to mangroves in Australia. Emu 1982, 82, 12–23. [Google Scholar] [CrossRef]
  14. Berg, Å. Diversity and abundance of birds in relation to forest fragmentation, habitat quality and heterogeneity. Bird Stud. 1997, 44, 355–366. [Google Scholar]
  15. Cousin, J.A.; Phillips, R.D. Habitat complexity explains species-specific occupancy but not species richness in a Western Australian woodland. Aust. J. Zool. 2008, 56, 95–102. [Google Scholar] [CrossRef]
  16. Honkanen, M.; Roberge, J.-M.; Rajaärkkä, A.; Mönkkönen, M. Distangling the effects of area, energy and habitat heterogeneity on boreal forest bird species richness in protected areas. Glob. Ecol. Biogeogr. 2009, 18, 61–71. [Google Scholar]
  17. Bateman, B.L.; Kutt, A.S.; Vanderduys, E.P.; Kemp, J.E. Small-mammal species richness and abundance along a tropical altitudinal gradient: An Australian example. J. Trop. Ecol. 2010, 26, 139–149. [Google Scholar] [CrossRef]
  18. Cromsigt, J.P.G.M.; Prins, H.H.T.; Olff, H. Habitat heterogeneity as a driver of ungulate diversity and distribution patterns: Interaction of body mass and digestive strategy. Divers. Distrib. 2009, 15, 513–522. [Google Scholar] [CrossRef]
  19. Hunter, W.R.; Sayer, M.D.J. The comparative effects of habitat complexity on faunal assemblages of northern temperate artificial and natural reefs. ICES J. Mar. Sci. Adv. Access 2009, 66, 691–698. [Google Scholar] [CrossRef]
  20. Haddad, N.M.; Crutsinger, G.M.; Gross, K.; Haarstad, J.; Knops, J.M.H.; Tilman, D. Plant species loss decreases arthropod diversity and shift tropic structure. Ecol. Lett. 2009, 12, 1029–1039. [Google Scholar] [CrossRef] [PubMed]
  21. Hodgkison, R.; Balding, S.T.; Zubaid, A.; Kunz, T.H. Habitat structure, wing morphology, and the vertical stratification of Malaysian fruit bats (Megachiroptera: Pteropodidae). J. Trop. Ecol. 2004, 20, 667–673. [Google Scholar] [CrossRef]
  22. Rebelo, H.; Brito, J.C. Bat guild structure and habitat use in the Sahara desert. Afr. J. Ecol. 2006, 45, 228–230. [Google Scholar] [CrossRef]
  23. MacArthur, R.H. Population ecology of some warblers of north eastern coniferous forest. Ecology 1958, 39, 599–619. [Google Scholar] [CrossRef]
  24. MacArthur, R.H.; MacArthur, J.W. On bird species diversity. Ecology 1961, 42, 594–598. [Google Scholar] [CrossRef]
  25. Hulbert, A.H. Species-energy relationships and habitat complexity in bird communities. Ecol. Lett. 2004, 7, 714–720. [Google Scholar] [CrossRef]
  26. Hulbert, A.H. Linking species-area and species-energy relationships in Drosophila microcosms. Ecol. Lett. 2006, 9, 287–294. [Google Scholar] [CrossRef] [PubMed]
  27. Wethered, R.; Lawes, M.J. Matrix effects on bird assemblages in fragmented Afromontane forest in South Africa. Biol. Conserv. 2003, 114, 327–340. [Google Scholar] [CrossRef]
  28. Pavey, C.R.; Nano, C.E.M. Bird assemblages of arid Australia: Vegetation patterns have greater effect than disturbance and resource pulses. J. Arid Environ. 2009, 73, 634–342. [Google Scholar] [CrossRef]
  29. Watson, J.E.M.; Whittaker, R.J.; Dawson, T.P. Avifaunal response to habitat fragmentation in the threatened littoral forest of south-eastern Madagascar. J. Biogeogr. 2004, 31, 1791–1807. [Google Scholar] [CrossRef]
  30. Woinarski, J.C.Z.; Brock, C.; Amstrong, M.; Hempel, C.; Cheal, D.; Brennan, K. Bird distribution in riparian vegetation in the extensive natural landscape of Australia’s tropical savanna: A broad-scale survey and analysis of a distributional data base. J. Biogeogr. 2000, 27, 843–868. [Google Scholar] [CrossRef]
  31. Johnstone, R.E. Mangroves and Mangrove Birds of Western Australia; Western Australian Museum: Perth, Australia, 1990. [Google Scholar]
  32. Noske, R.A. Abundance, zonation and foraging ecology of birds in mangroves of Darwin Harbour, Northern Territory. Wildl. Res. 1996, 23, 443–474. [Google Scholar] [CrossRef]
  33. Mohd-Azlan, J.; Noske, R.A.; Lawes, M.J. Avian species-assemblage structure and indicator bird species of mangroves in the Australian monsoon tropics. Emu 2012, 112, 287–297. [Google Scholar] [CrossRef]
  34. Mohd-Azlan, J.; Lawes, M.J. The effect of the surrounding landscape matrix on mangrove bird community assembly in north Australia. Biol. Conserv. 2011, 144, 2134–2141. [Google Scholar] [CrossRef]
  35. Buckland, S.T.; Anderson, D.R.; Burnham, K.P.; Laake, J.L.; Borchers, D.L.; Thomas, L. Introduction to Distance Sampling; Oxford University Press: Oxford, UK, 2001; p. 432. [Google Scholar]
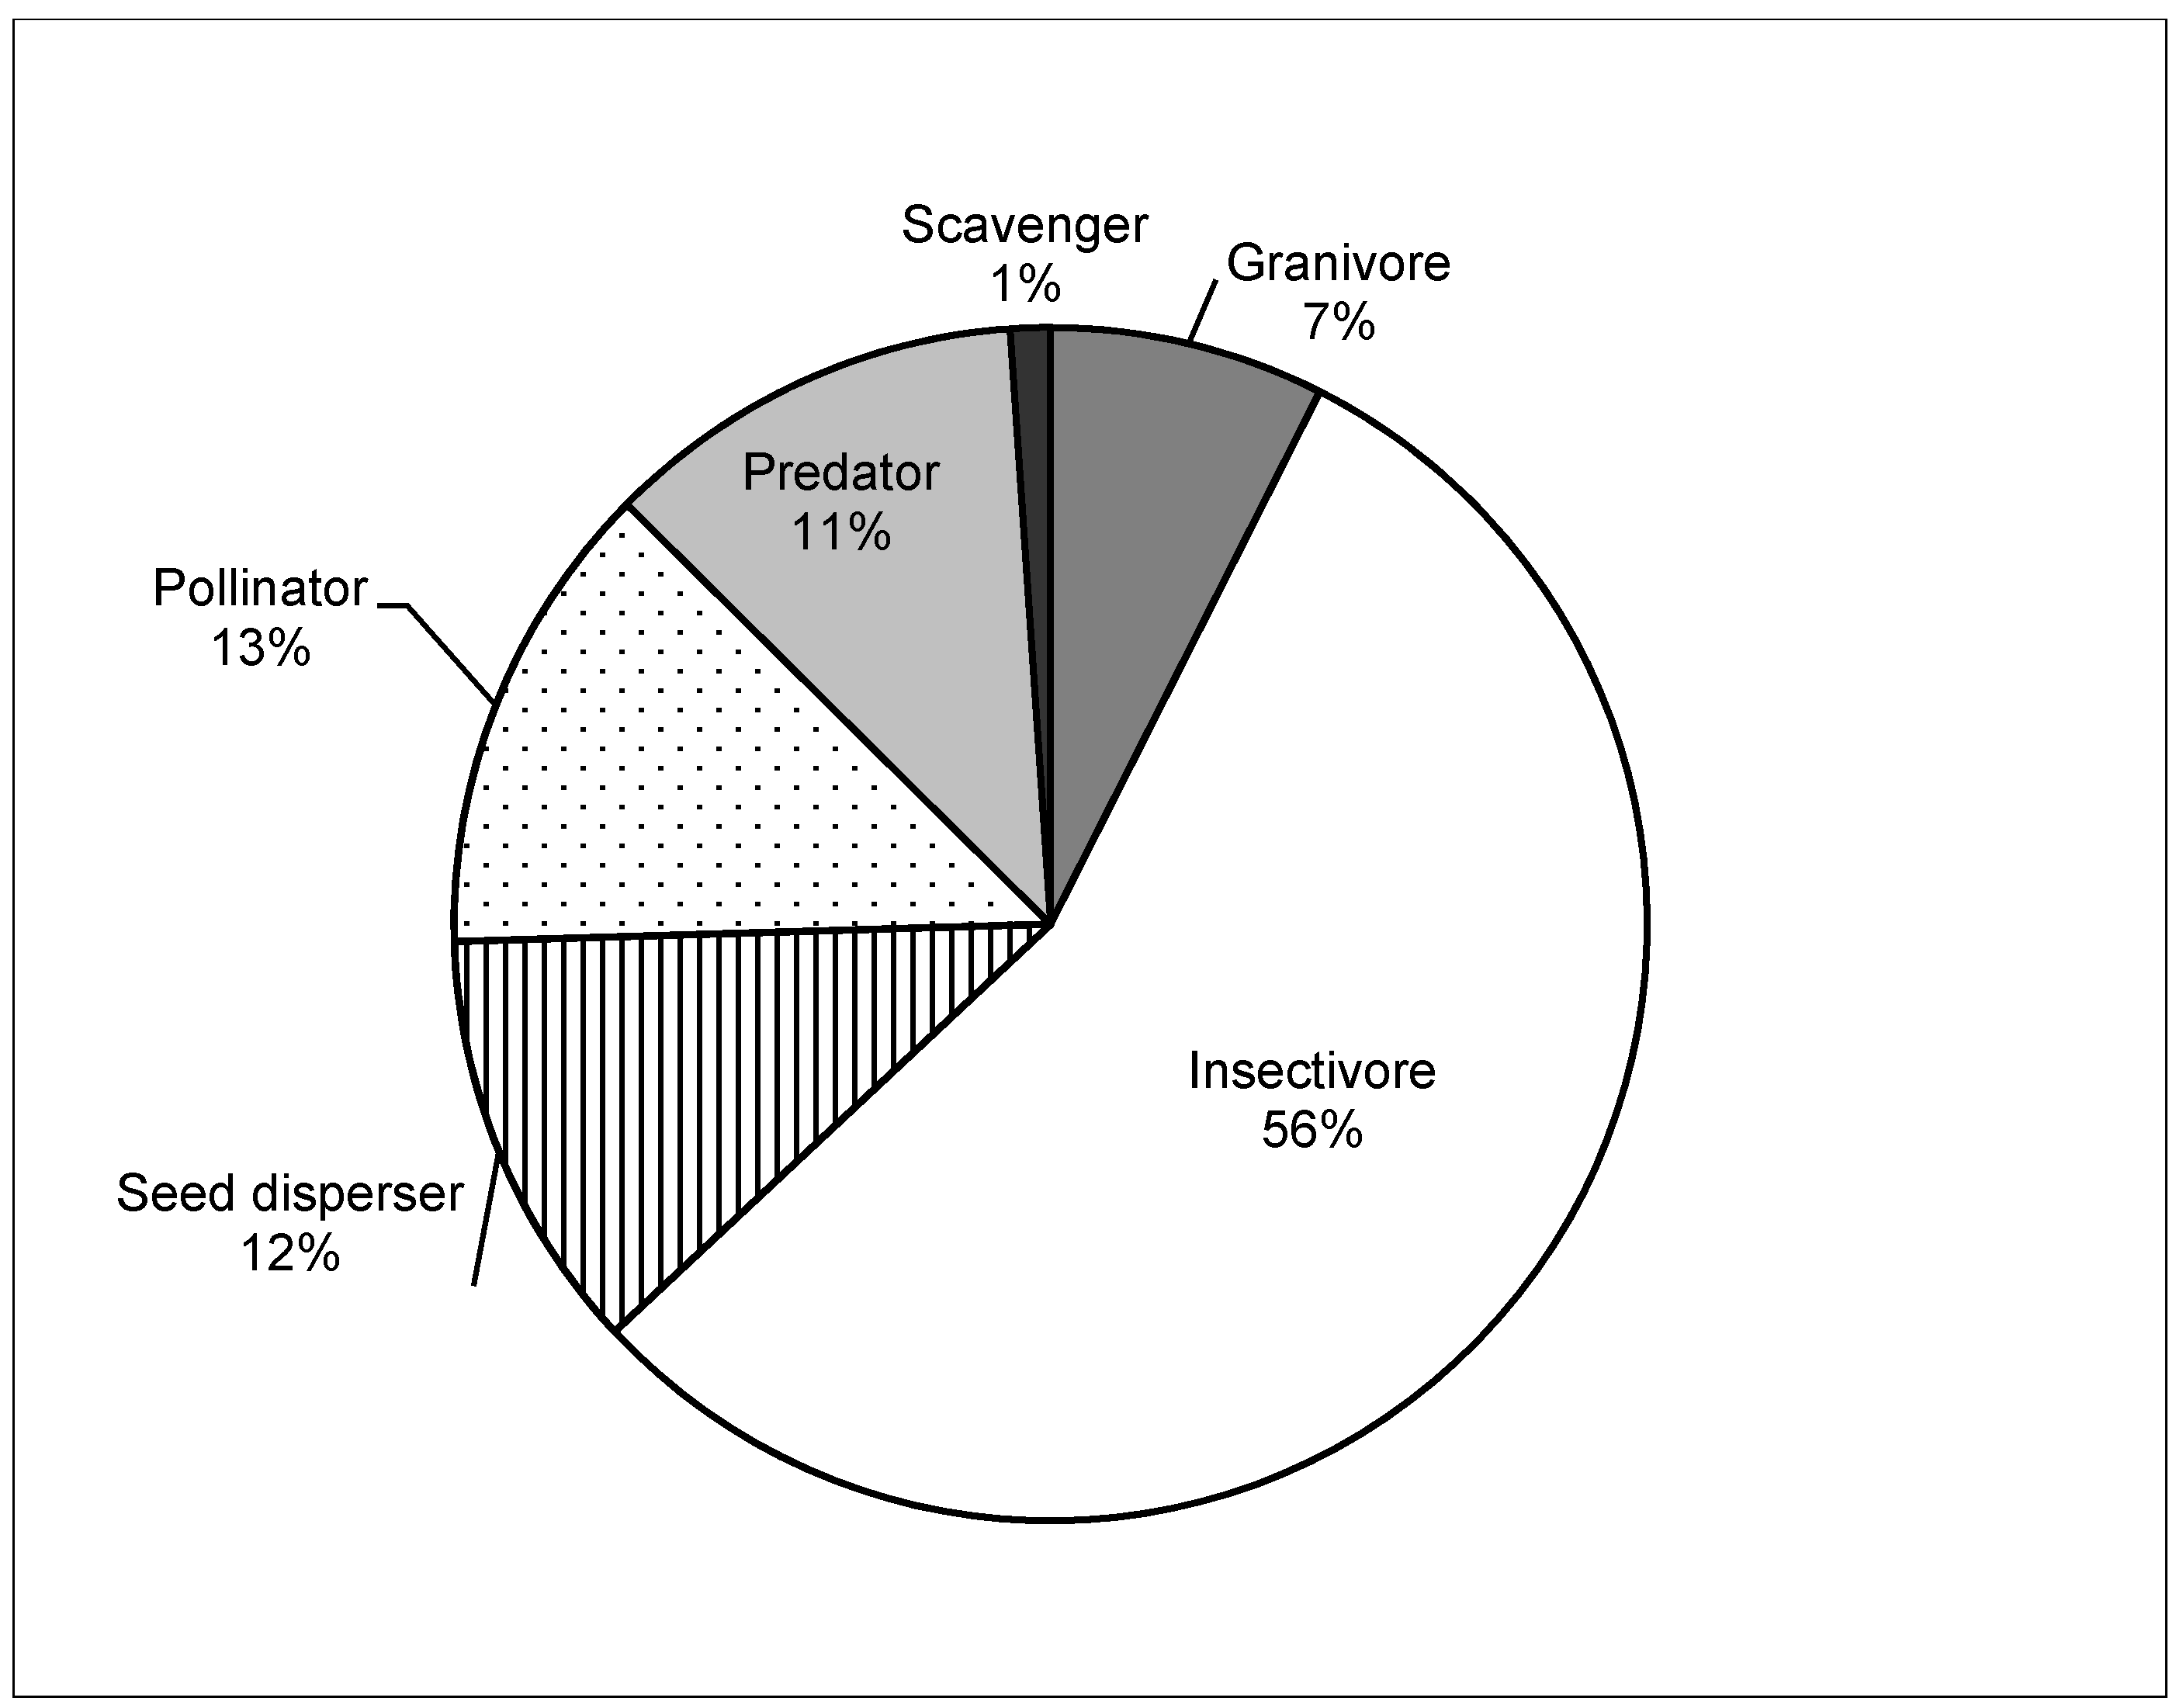
  36. Sekercioglu, C.H. Increasing awareness of avian ecology function. Trends Ecol. Evol. 2006, 21, 455–471. [Google Scholar] [CrossRef]
  37. Kutt, A.S. Bird assemblage in a dune-mangrove mosaic, Cairns, Queensland. Aust. Zool. 2007, 34, 158–164. [Google Scholar] [CrossRef]
  38. Krüger, S.C.; Lawes, M.J. Edge effects at an induced forest-grassland boundary: Forest birds in the Ongoye Forest Reserve, KwaZulu-Natal. S. Afr. J. Zool. 1997, 32, 82–91. [Google Scholar]
  39. Kempton, R.A.; Wedderburn, R.W.M. A comparison of three measures of species diversity. Biometrics 1978, 34, 25–37. [Google Scholar] [CrossRef]
  40. Magurran, A.E. Measuring Biological Diversity, 2nd ed.; Blackwell: Oxford, UK, 2004. [Google Scholar]
  41. Soetaert, K.; Heip, C. Sample-size dependence of diversity indices and the determination of sufficient sample size in a high-diversity deep-sea environment. Mar. Ecol. Press Ser. 1990, 59, 305–307. [Google Scholar] [CrossRef]
  42. Hutchings, P.; Saenger, P. Ecology of Mangroves; University of Queensland Press: Brisbane, Australia, 1987; p. 388. [Google Scholar]
  43. August, P.V. The role of habitat complexity and heterogeneity in structuring tropical mammal communities. Ecology 1983, 64, 1495–1507. [Google Scholar] [CrossRef]
  44. Brocklehurst, P.; Lewis, D.; Napier, D.; Lynch, D. Northern Territory Guidelines and Field Methodology for Vegetation Survey and Mapping; Northern Territory; Department of Natural Resources Environment and Arts: Darwin, Australia, 2007. [Google Scholar]
  45. Comley, B.W.T.; McGuinness, K.A. Above and below ground biomass, of four common northern Australian mangroves. Aust. J. Bot. 2005, 53, 431–436. [Google Scholar] [CrossRef]
  46. Schulte, R.P.O.; Lantinga, E.A.; Hawkins, M.J. A new family of Fisher-curves estimates Fisher’s alpha more accurately. J. Theor. Biol. 2005, 232, 305–313. [Google Scholar] [CrossRef] [PubMed]
  47. McCune, B.; Mefford, M.J. PC-ORD. Multivariate Analysis of Ecological Data; 4.34; MjM Software: Gleneden Beach, OR, USA, 1999. [Google Scholar]
  48. McCune, B.; Grace., J.B. Analysis of Ecological Communities; MjM Software: Gleneden Beach, OR, USA, 2002; p. 304. [Google Scholar]
  49. Jafari, M.; Chahouki, M.A.Z.; Tavili, A.; Azarnivand, H.; Amiri, G.Z. Effective environmental factors in the distribution of vegetation types in Poshtkouh rangelands of Yazd Province (Iran). J. Arid Environ. 2004, 56, 627–641. [Google Scholar] [CrossRef]
  50. VSN International GenStat for Windows, 13th ed; VSN International: Hemel Hempstead, UK, 2010.
  51. McCullagh, P.; Nelder, J.A. Generalized Linear Models; Chapman and Hall: London, UK, 1989. [Google Scholar]
  52. Burnham, K.P.; Anderson, D.R. Kullback-Leiber information as a basis for strong inference in ecological studies. Wildl. Res. 2001, 28, 111–119. [Google Scholar] [CrossRef]
  53. Burnham, K.P.; Anderson, D.R. Model Selection and inference: A Practical Information—Theoretic Approach, 2nd ed.; Springer: New York, NY, USA, 2002. [Google Scholar]
  54. Anderson, D.R. Model Based Inference in the Life Sciences: A Primer on Evidence; Springer Verlag: New York, NY, USA, 2008; p. 184. [Google Scholar]
  55. MacArthur, R.H.; MacArthur, J.W.; Preer, J. On bird species diversity II prediction of bird cencus from habitat measurements. Am. Nat. 1962, 96, 167–774. [Google Scholar] [CrossRef]
  56. Rotenberry, J.T. The role of habitat in avian community composition: Physiognomy or floristics? Oecologia 1985, 67, 213–217. [Google Scholar] [CrossRef]
  57. Seymour, C.L.; Dean, W.R.J. The influence of changes in habitat structure on the species composition of bird assemblages in the southern Kalahari. Austral Ecol. 2010, 35, 581–592. [Google Scholar] [CrossRef]
  58. Tassicker, A.L.; Kutt, A.S.; Vanderduys, E.; Mangru, S. The effects of vegetation structure on the birds in a tropical savanna woodland in north-eastern Australia. Rangel. J. 2006, 28, 139–152. [Google Scholar] [CrossRef]
  59. Lees, A.C.; Peres, C.A. Rapid avifaunal collapse along the Amazonian deforestation frontier. Biol. Conserv. 2006, 133, 198–211. [Google Scholar] [CrossRef]
  60. Coupland, G.T. The Ecological Interaction between Insects and Mangroves in Darwin Harbor, Australia. Ph.D. Thesis, Northern Territory University, Darwin, Australia, 2002. [Google Scholar]
  61. Mulyani, Y.A. Reproductive Ecology of Tropical Mangrove-Dwelling Warblers: The Role of Nest Predation, Brood Parasitism, and Food Limitation. Ph.D. Thesis, Charles Darwin University, Darwin, Australia, 2004. [Google Scholar]

