1. Introduction
The Tricladida belong to the phylum Platyhelminthes, a phylum characterised by a general morphological simplicity. This simplicity has, from the very beginning, made the flatworm taxonomist’s work difficult and tedious. Firstly, it is necessary to do histological sections of individuals, which is time consuming, and then added difficulties exist, such as the lack of taxonomic keys to identify species or the fact that most descriptions are very old and based only on characters of external morphology. In addition, the type material of many species has been lost, a fact that renders the work more complex [
1]. With the use of internal anatomical features, classifications have changed over the years but the difficulty in finding synapomorphies has hindered systematic understanding of the group. In most cases, the absence of synapomorphies defining species or higher level taxonomical groups prevents the use of morphological features to infer phylogenetic relationships. As a consequence, their classification was not based on their natural groupings as deduced from a phylogeny. The use of molecular data to infer phylogenies has been crucial for understanding the origin and evolution of many platyhelminth features, and molecular markers have become a key tool to unveil a wealth of diversity in many cases not, or only partially, predicted by morphological appearance.
Currently, triclads include three suborders [
2], Maricola, Cavernicola and Continenticola, whose present classification has for the most part been facilitated by the use of molecular data. In fact, the first application of molecular markers to study planarians resulted in changing the relationships between its main clades Maricola, Terricola, Paludicola Hallez (1894) and Cavernicola Sluys (1990), and, as a consequence, led to a major taxonomic rearrangement. Sluys [
3] suggested a closer relationship between the Terricola and the Paludicola clades, changing the evolutionary scheme proposed previously by Ball [
4] in which terrestrial planarians were the sister group to marine and freshwater ones. A radically different view of the internal relationships of the Tricladida emerged from phylogenetic studies based on sequences of 18S ribosomal genes, showing the Terricola to be a sister group to the freshwater family Dugesiidae (within the Paludicola); this scenario was confirmed by the finding of a molecular synapomorphy, the presence of a shared 18S gene duplication [
5]. This was probably one of the first cases in which a molecular synapomorphy was used to demonstrate the monophyly of a group and to define it taxonomically, the Continenticola, including terrestrial planarians and Dugesiidae (
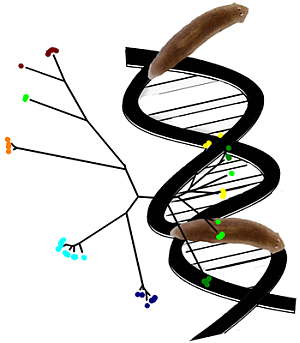
Figure 1).
These were the first applications of molecular data to study the diversity of Tricladida. Subsequently, the use of more genes, especially cytochrome oxidase I (Cox1) and the internal transcribed spacer 1 of the ribosomal cluster (ITS-1), and more recently some other mitochondrial genes and nuclear introns, has allowed a deeper understanding of the group and its diversity.
The availability of molecular data and of up-to-date methodologies to analyse them, has transformed planarians from being mostly of interest to a few taxonomists and researchers investigating their regenerative capacity to a cutting-edge model on phylogeographic and demographic studies. This is so also because their features, such as their low dispersal ability, make them ideal for providing insight into past events and for inferring how biodiversity is generated, the influence of geological, climatic events, and the history of populations found in forests and rivers. In this review, we will discuss diverse examples of how molecular data have changed our view of these animals and, at the same time, allowed using them in new research areas.
Figure 1.
Maximum likelihood phylogenetic tree obtained from a concatenated dataset (18S rRNA type II, 28S rRNA and Elongation Factor 1α genes) for the Continenticola (see text). Terrestrial planarians: subfamilies Bipaliinae, Microplaninae, Geoplaninae and Rhynchodeminae; the freshwater Family Dugesiidae is polyphyletic; outgroup: Superfamily Planarioidea.
2. Assignment of Individuals to their Species: DNA Barcoding in Planarians
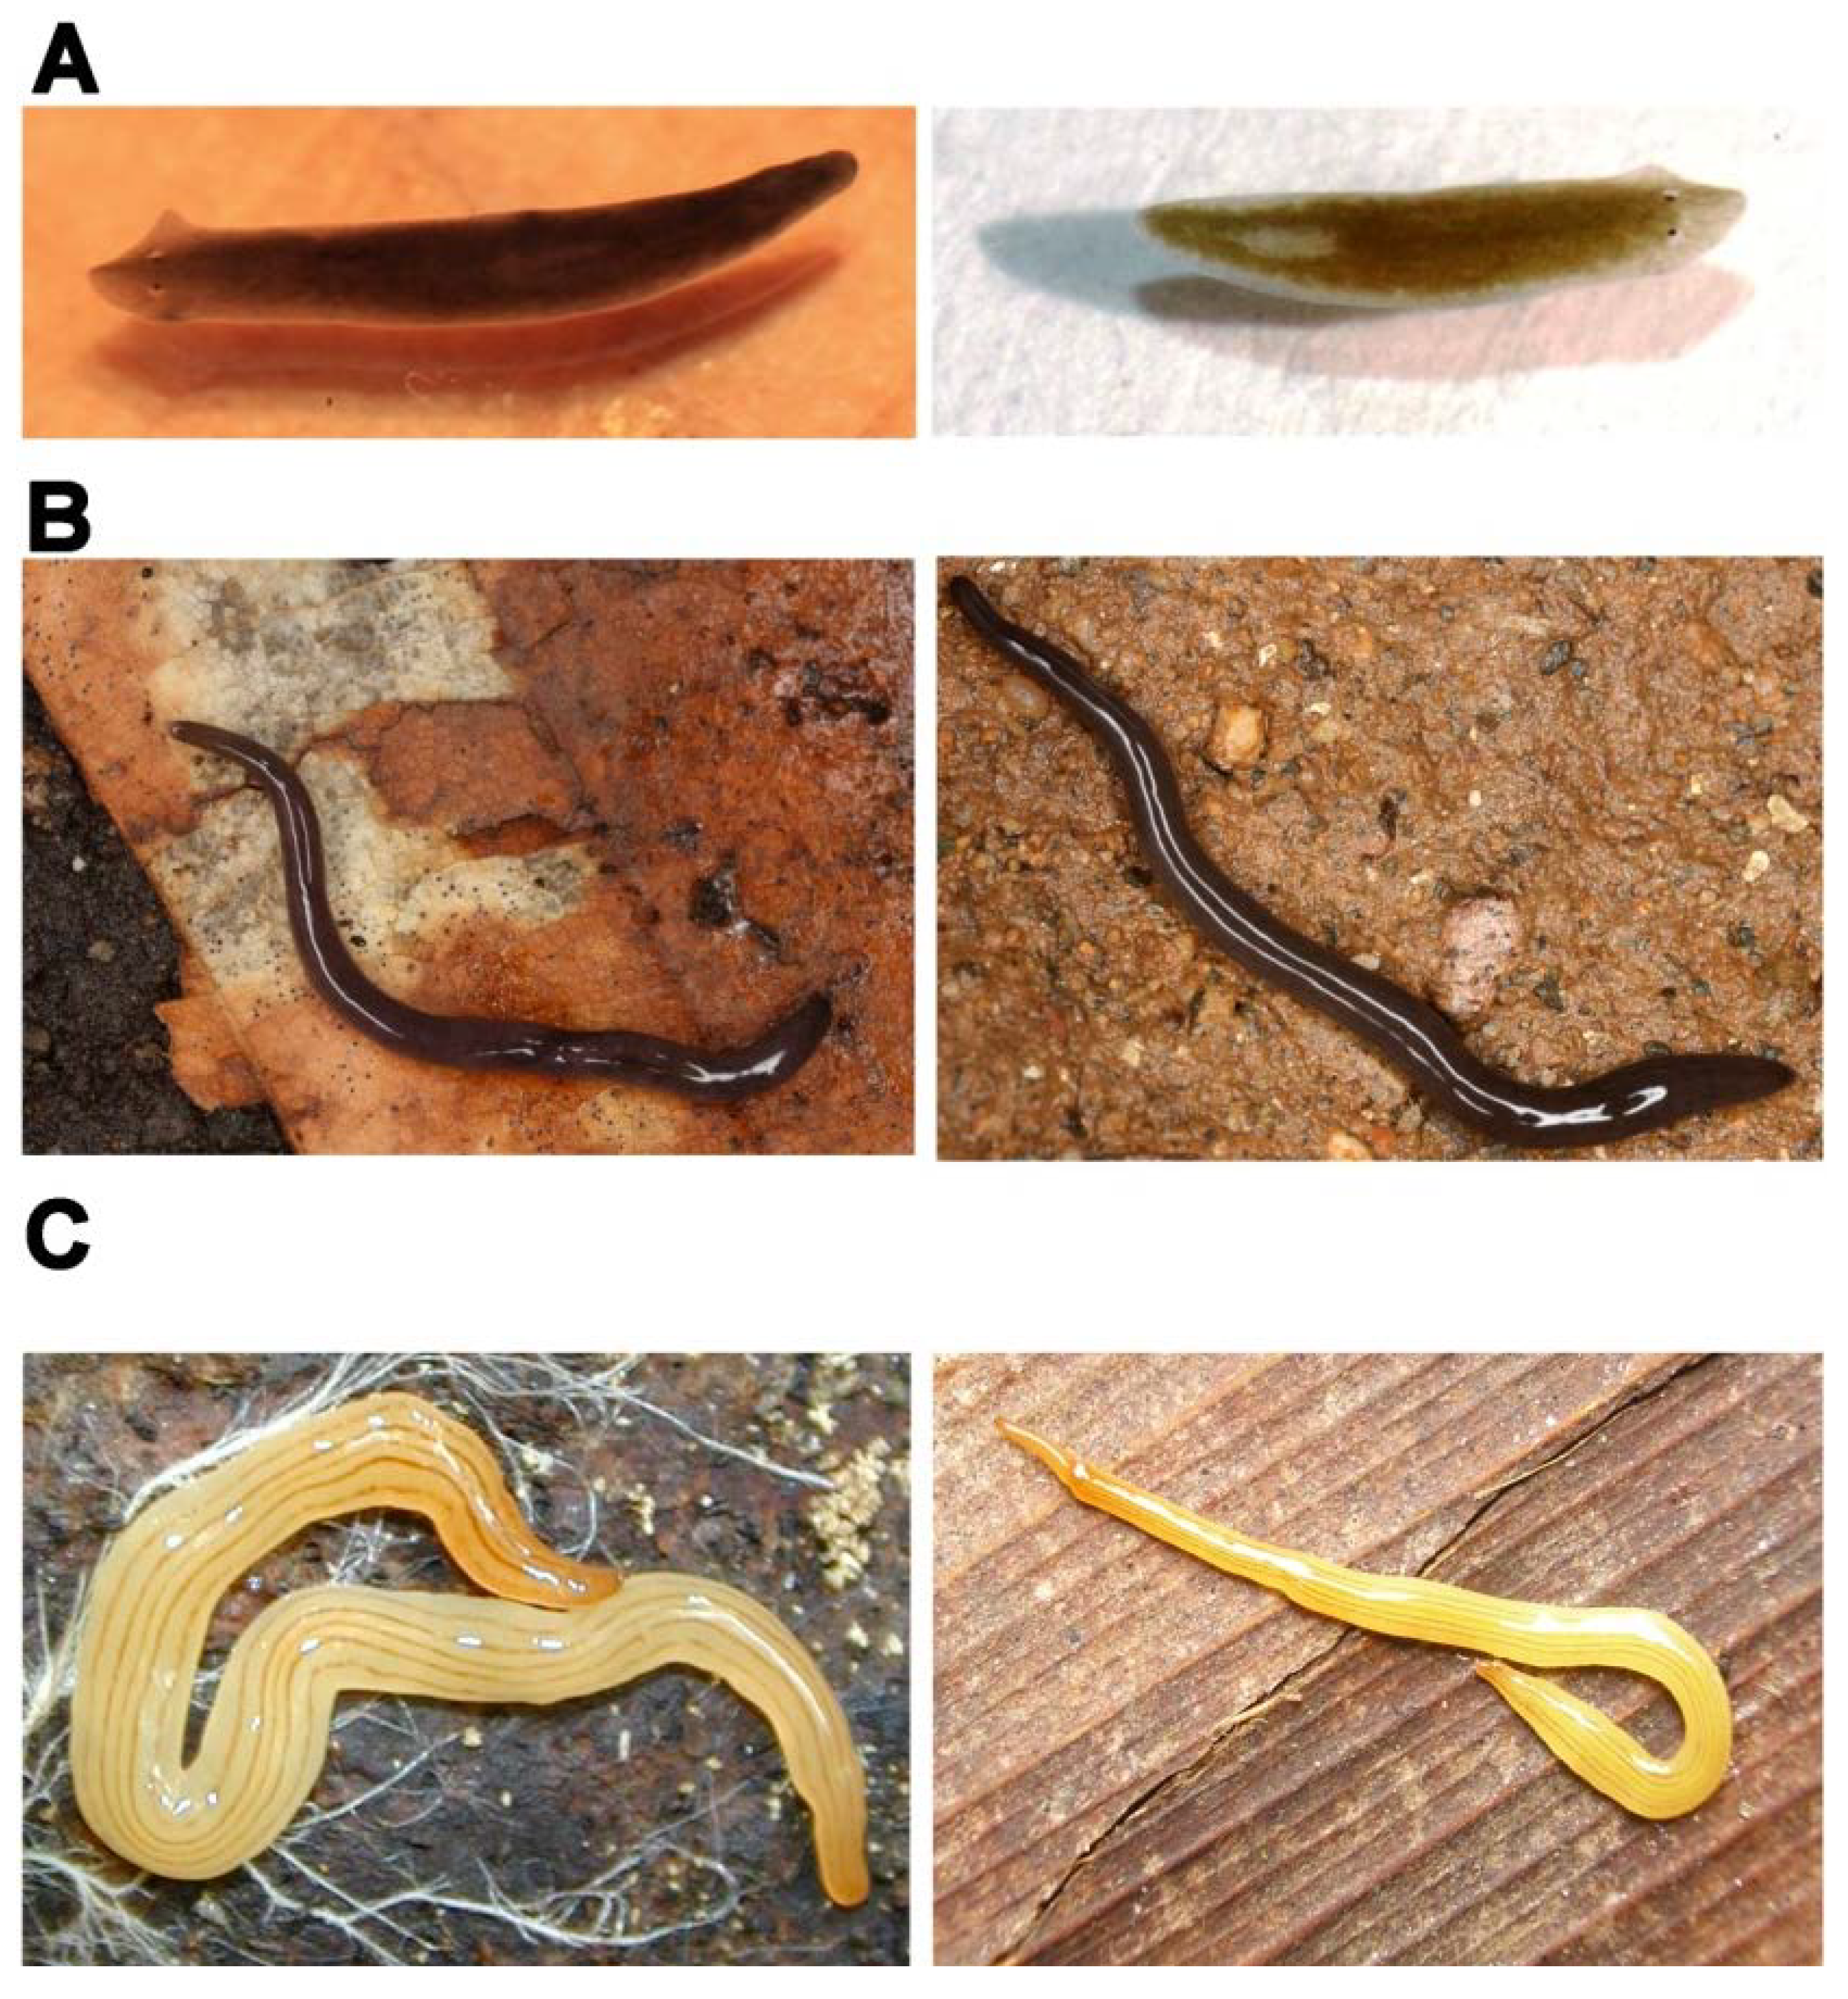
Dugesia Girard, 1850 is a longstanding genus, belonging to the family Dugesiidae, which includes animals with a very typical external appearance practically identical for all species (
Figure 2A). Consequently, the main characters used to identify species within this genus include the few internal anatomical organs they possess, the copulatory apparatus and gonads. This situation hampers easy identification of individuals not possessing these organs, including juveniles or populations composed exclusively of asexual fissiparous reproducing individuals. This latter type of population is very common in the Mediterranean area compared to northern Europe. For some time, this situation precluded precise estimates of the number of species in the area, resulting in use of imprecise terms such as
D. gonocephala s.l., or
D. gonocephala species complex to taxonomically cover many of the populations found. The application of genetic tools changed this scenario. The use of ITS-1 in the 1990s demonstrated that this sequence could help identify asexual populations [
6,
7] in a DNA barcoding style shortly before this methodology was formally proposed [
8], and began to unveil surprises in their actual distribution. In the study by Baguñà
et al. [
7], all asexual populations clearly clustered with a diploid sexual identified species, which allowed assigning them to a known species (however see below). This study also reported a new molecular feature (a duplicated 29-bp fragment) that could be used as a synapomorphy to identify
Dugesia sicula Lepori, 1948. Nonetheless, one must be very careful with this type of data, since without having representatives of all the species within a genus, it is not possible to ensure that the feature is particular for a species and hence unambiguously allows its identification. In the case of
Dugesia, further analyses showed that the ITS-1 29bp duplication was not characteristic of a single species, but of a group of very closely related ones, including
D. sicula and
D. aethiopica Stocchino, Corso, Manconi and Pala, 2002 [
9,
10].
Figure 2.
(A) Left D. sicula, right D. subtentaculata; (B) Two different morphotypes of Microplana; (C) Left Luteostriata ernesti; right L. caissara.
Figure 2.
(A) Left D. sicula, right D. subtentaculata; (B) Two different morphotypes of Microplana; (C) Left Luteostriata ernesti; right L. caissara.
The other interesting result from that study was that a population of
Dugesia coming from the northern Iberian Peninsula did not belong to the
D. subtentaculata Draparnaud, 1801 species; instead it grouped with a species from northern Italy,
D. etrusca Benazzi, 1946. The Spanish population had been attributed to
D. subtentaculata based on its karyotype (3n = 24) and the fact that previous studies had always assumed that only two species of
Dugesia,
D. subtentaculata (n = 8) and
D. sicula (n = 9)
, were present in the Iberian Peninsula. A cautionary tale again presented by the molecular data is that diversity can be higher than expected, and that identical (or nearly identical) external appearance or even chromosomal data does not ensure certain identity. Moreover, one must be very careful in assigning populations to species if a broad sampling of the group is not performed, because here again, a later study including more species of the genus showed that the Spanish population did not belong to
D. etrusca as proposed, but to
D. liguriensis De Vries 1988 [
9] not represented in the previous study. Consequently, it would be essential to do a wide sampling in the southern region of France and use an objective molecular based delimitation method to be more certain as to what species are present in the Iberian Peninsula.
Assigning individuals to land planarian species has similar limitations. Their morphological simplicity results in many morphologically cryptic species (
Figure 2), or in species showing few morphological defining traits. In other cases, the problem may come from the fact that these organisms are more difficult to find, due to their life habitus, including being nocturnal and part of the soil fauna (and for the European species moreover being quite small), and relatively rare. So, their description may rely on a few individuals which, in many cases, may be immature (lacking a copulatory apparatus), or presenting misleading features. In the Iberian Peninsula, a fragment of Cox1 gene and of 18S rRNA were used to identify the diversity of land planarian species from the genus
Microplana Vejdovsky, 1889 [
11]. The animals were assigned to nine morphotypes, which later became molecular clades since the groupings shown by both types of data were congruent in most cases. The few exceptions to this rule were cases in which either the individual was wrongly assigned to a morphotype because it was a juvenile, or it presented a differentiating feature such as an unpigmented head that resulted from regenerating. There was also a pair of cryptic species; the individuals were identical for the morphological characters used but they were included in two clearly differentiated genetic clades. Although both molecules showed similar results, 18S had a lower resolution among clades, pointing to the mitochondrial gene as the best means to do this type of analysis. The presence in the trees of sequences from some already identified specimens also allowed the assignment of some clades to a species. This information then served for a later study [
12] in which the DNA barcoding was used to identify individuals belonging to the species
Microplana terrestris Müller, 1774, to perform a phylogeographic study in the Iberian Peninsula. This methodology is a breakthrough that could greatly accelerate species description, allowing to quickly identify individuals not corresponding with
a priori known species, thus facilitating the work of taxonomy, which can focus on the morphological traits in the most problematic or unusual cases. Moreover, as in the case presented [
12], it allowed identifying individuals without the need for a morphological study for each one, and overall, the two studies indicate a high number of species still unreported in the literature.
The take-home message: Molecular data, especially mitochondrial genes, are highly effective as DNA barcoding tools to identify species, even from small fragments, eggs or immature individuals. However, the certainty of the assignment depends on whether organisms of the same species, or closely related, are present in the database, or the study itself examines all the diversity of the group in question. Assigning should always be done based on obtaining a phylogeny in which the location of the sequence provides the identity of the specimen, which is better than relying on genetic distances that can differ from one group to another. The use of a molecular delimitation procedure, together with other types of data, may prevent erroneous assignations.
3. Integrative Taxonomy, Species Delimitation: The Case of the Dugesia Genus
Over time, objective methodologies to identify species using molecular data have been developed, providing support for morphological descriptions and allowing the identification of new individuals (in a DNA barcode fashion). The Yule-Coalescent transition analysis as implemented in GMYC [
13,
14] is one of these methodologies. This coalescent-based method allows species delimitation by distinguishing branching patterns between interspecific (Yule model; speciation and extinction) and intraspecific (coalescence of alleles) processes on a phylogenetic tree. It draws a threshold between these two processes, thus delimiting clades of individuals representing putative species.
The existence of these methodologies provides the taxonomist with more extensive data to rely on at the moment of delimiting species, which is a substantial advance. However, when simultaneously using different types of data, on some occasions not all data coincide because speciation is not always accompanied by simultaneous character changes at all levels [
15,
16], or only one kind of data is available. Vieites
et al. [
17] proposed using three different categories to describe the taxonomic status of the biological units under study: (1) Unconfirmed Candidate Species (UCS), including those genealogical lineages that can be delineated by a molecular method but for which other data is not available; (2) Confirmed Candidate Species (CCS), comprising those units that can be delimited by molecular data and are supported also by other data, such as morphology, but have not yet been formally described and named; (3) Deep Conspecific Lineages (DCL), referring to lineages that have reached a certain molecular threshold but present the same or a very similar morphology.
The application of these methodologies to the genus
Dugesia in a study focusing on the Aegean region has shown its high utility [
18]. Although the molecular and morphological analyses coincided in the delimitation of most species, in a few conflicting cases both methodologies identified species reciprocally and allowed more accurate results. The final outcome has increased the world total of
Dugesia species with four newly described species, two CCS, 14 UCS from Greece and Slovakia, and at the same time increased the number of dugesiid genera with one new genus. An example of the importance of using molecular and morphological information simultaneously can be illustrated by the case of
D. sagitta (Schmidt, 1861)
. Molecular data suggested a separate identity for three
D. sagitta populations on the island of Corfu, while morphology seemed to be uniform for the three. As a consequence, more detailed morphological investigations were initiated, which uncovered in one population some divergent morphological characters with
D. sagitta. The two data sets thus reinforced each other to show the need to describe a new species. However, again, the problem of what to do when morphology and molecules do not coincide arises: the other two Corfu populations presented the morphological diagnostic characters of
D. sagitta and no evident morphological difference among them, pointing perhaps to the existence of morphologically cryptic species.
The take-home message: Two important conclusions can be drawn from these studies. First, GMYC analysis with Cox1 seems to be a robust strategy for detecting potentially new species and testing the taxonomic status of known species. The use of molecular data moreover speeds up the description of new species by delimiting the clades and hence allowing focused morphological studies on those specimens belonging to different genetic clades, avoiding the need to blindly analyse hundreds of individuals. Nonetheless, it is a good practice that the morphologist also analyses certain individuals without knowing what the molecular outcome is, so that he/she is not biased in the analyses.
4. Species Genetic Structure: Schmidtea mediterranea and Dugesia sicula
Molecular markers have also opened the possibility of studying the diversity within the species and whether they are structured or not. This type of studies has resulted in finding two quite contrasting histories within the Mediterranean basin.
Schmidtea mediterranea Benazzi, Baguñà, Ballester, and Del Papa, 1975 is restricted to the western Mediterranean in several scattered populations along the Catalan coast, Menorca, Mallorca, Corsica, Sardinia, Sicily and Tunisia [
19,
20,
21]. There is an asexual strain that occurs only in a few locations, in Catalonia and the Balearic Islands, where sexual populations have not been found. In the remaining distribution area, only sexual diploids are found. The molecular study of these populations, based on three markers (Cox1 and
cytochrome b (cob) and the 13th nuclear intron of the
netrin receptor-like protein gene (N13)), showed that the species is extremely structured [
22]. It is divided into three clades that do not share haplotypes, suggesting that the distribution of the species is a consequence of the geological history of the region and it inhabits; its ancestor may have been present in the microplaque that gave rise to the Balearic Islands, Corsica and Sardinia, which implies a quite old age for the species. This situation raises the question as to whether it is really a single species or three cryptic species. A GMYC analysis [
23] based on a very short fragment of Cox1 (248 bp) and 309 sequences (including also representatives from
Schmidtea polychroa Schmidt, 1861) showed
S. mediterranea to be divided into three entities, which could represent three species. However, GMYC has been reported to overestimate the number of species [
24,
25], which together with the lack of morphological differences among the clades, raised doubts about such a division.
On the other hand,
Dugesia sicula shows a broad distribution in the Mediterranean area, from Greece to the Canary Islands, being the only species of its genus not presenting an endemic or very restricted distribution in this area. A second unique feature of this species is that most of its populations are exclusively fissiparous. This feature gives rise to a peculiar way of accumulating genetic variability, as new mutations may arise in neoblasts and can expand when they are divided, so it is expected that individuals become genetic mosaics through time. A recent study using Cox1 [
26] has shown that in some localities many specimens bear multiple haplotypes differing in only one site from the most frequent haplotype present in the population, indicating a relatively old age for the asexual lineage. The same study has shown that the species presents only three most common haplotypes differing by a maximum of 11 substitutions, and these three haplotypes are distributed throughout the species range. This lack of genetic structure could be explained by the clonal nature of the individuals (consequence of their fissiparous type of reproduction) but would also require a relatively recent expansion, which at least in part, may have been promoted by human activity. On the other hand,
S. mediterranea and
D. sicula share a similar heritage: in both cases the passage to asexual reproduction by fission has lead to these lineages to overrun their sexual counterparts.
The take-home message: The application of molecular markers has shown a very different outcome for the two species inhabiting the same region (the Mediterranean basin). One is extremely differentiated and genetically structured as a consequence of ancient geological events. The other is extremely conserved genetically and probably its present distribution is the consequence of a relatively recent expansion facilitated by its fissiparous type of reproduction. The major differences in history between these two groups may have never been distinguished without the contribution of molecular markers.
5. Application to Phylogeographic Studies: The Case of the Brazilian Land Planarians
Phylogeographic methods have progressed profoundly in recent years. Currently, not only are phylogenies, genealogies and the distribution of haplotypes used to infer the evolutionary history of populations and species, but also innovative and more powerful statistical methods, such as Approximate Bayesian Computation (ABC), can be applied [
27]. The integration of several fields such as ecology, geology, paleoclimatology and paleobotany together with genetics has been highly effective in interpreting phylogeographic data [
28]. This information can be used to formulate accurate hypotheses, and also help interpret results; for instance, data on tectonic plate movement can explain vicariance events; likewise, fossil records provide information of the distribution of taxa in the past [
29]. These ideas were applied in a study of the Brazilian Atlantic Forest (BAF, one of the richest biodiversity areas in the world and also one of the most endangered. Using two species of terrestrial planarians as model organisms, and two molecular markers (the mitochondrial Cox1 and the nuclear ITS-1) to analyse the patterns and levels of nucleotide diversity in an area of the South American Atlantic Forest (SAF; Serra da Bocaina (SP)), it was found that both species have high levels of genetic variation, without showing the molecular fingerprint of a recent colonization and population expansion [
30]. These data suggest a scenario of long-term stability, and therefore, contradict studies based on paleoclimatic models suggesting that the southern parts of the BAF had lost all forest cover during the Pleistocene glaciation period. Organisms with low dispersal ability and a high specialization, like terrestrial planarians, can therefore improve the resolution of these predictions. In a subsequent work [
31], the patterns and levels of nucleotide diversity of the land planarian species
Cephaloflexa bergi Riester, 1938 were analysed in 11 SAF conservation units (inside and outside the Serra do Mar corridor, a connection between preserved areas to facilitate gene flow). The results show a high level of nucleotide diversity, genetically structured populations and the molecular mark of an isolation-by-distance process. Datation results indicate that most diversity within the area originated before the Pleistocene era. Using ABC analyses based on coalescence demographic models, different scenarios were evaluated to determine the evolutionary processes involved in the formation of these levels and patterns of genetic variability. The analyses show that the diversity of the SAF region was shaped by complex interactions between Pliocene geological events and demographic processes. Pleistocene climate changes have a minor influence in generating present day diversity but play a major role in shaping its distribution. In all, the results highlight the need to extend biological corridors further south of the current range.
The take-home message: The analyses of molecular markers have revealed unexpected levels of variability within species in the Brazilian Atlantic Forest. These levels of diversity allow the use of these organisms as a model to understand how Atlantic Forest diversity was generated and shaped, and to inform and assist the future management of this endangered area. However, Cox1 and ITS-1 were not very effective in testing the evolutionary scenarios modelled, especially in the case of ITS-1. This leads to the conclusion that new markers are needed to achieve greater statistical power in the validation of hypotheses tested.
6. Classification and Taxonomy: The Case of the Subfamily Geoplaninae
The use of molecular markers to resolve phylogenies has also been key to the taxonomy and classification of planarians. A good example is the phylogeny of the Neotropical terrestrial planarians, the subfamily Geoplaninae [
31] (
Figure 1). This group is of particular interest, as they have been proposed as biological indicators of the conservation status of habitats [
32,
33], and some tropical species have been found to be invasive in Europe and the USA ([
34,
35,
36], and references therein) Despite being an important group, inference of their phylogeny has never been undertaken from a morphological point of view, with a few exceptions aiming to find the most ancestral group. This is probably due to the problems presented by the morphological study of these organisms (see introduction). Even its taxonomy is in a state of flux; the successive morphological studies have continued to add to the number of genera of the subfamily through splittings and redefinitions, from the original six proposed by Von Graff (1912–1917) [
37] to 23 at present, since better methodologies, more detailed analyses and new samplings have been performed. The first molecular phylogenetic study in which Geoplaninae was represented [
38], included only three species of
Geoplana Schultze and Müller, 1857 and one species of
Notogynaphallia Ogren and Kawakatsu, 1990, a very scarce representation for a group that currently comprises 260 species within the 23 recognized genera [
2,
39,
40]. In order to obtain a robust phylogeny of the Geoplaninae subfamily, and confirm whether the molecular clades correspond with morphologically homogeneous groups, Carbayo
et al. [
31] studied representatives of 13 genera belonging to the subfamily using three nuclear markers (18S type II and 28S ribosomal genes and the
Elongation Factor 1α (EF) gene) and a mitochondrial one (Cox1).
As described previously, the use of molecular markers from different origins (nuclear and mitochondrial) can help achieve better-resolved phylogenies, since they provide different information that may be manifesting at different levels of the tree (either basal branches or more terminal clades). In this study none of the genes alone were able to resolve the phylogenetic position of the Geoplaninae genera. However, when genes are concatenated, with or without partitions, the tree is better-resolved with support values much higher than those obtained with the genes separately. The results are quite satisfactory in terms of genera groupings since most genetic clades group species or genera with some morphological identity, which have at the same time helped to identify those morphological features that are more relevant from a phylogenetic point of view. Unfortunately, most basal splittings could not be resolved, leaving the phylogeny of the group still unresolved. From a taxonomic point of view some groups confirm their monophyletic status as described by morphological data, such as the genera Choeradoplana Graff, 1896, Pasipha Ogren and Kawakatsu, 1990 or Cephaloflexa Carbayo and Leal-Zanchet, 2003, but others showed an imminent necessity of taxonomic revision. A particular case deserving attention is that of genus Geoplana, which was reviewed and resulted in six new genera (Barreirana, Cratera, Imbira, Matuxia, Obama and Paraba). Other cases of interest include the species Notogynaphallia guaiana Leal-Zanchet and Carbayo, 2001, whose position was previously discussed considering morphological data, as well as the case of Enterosyringa pseudorhynchodemus (Riester, 1938) both of which were moved to the genera Imbira and Xerapoa, respectively.
Finally, it should be noted that there is still much work to do concerning the phylogeny of Neotropical terrestrial planarians. It is necessary to add to the study representatives of the genera not represented (
Amaga Ogren and Kawakatsu, 1990
, Bogga Grau and Sluys, 2012
, Gigantea Ogren and Kawakatsu, 1990
, and
Liana Froehlich, 1978) and those yet to be described, since many exhaustive samplings undertaken in the area of the Atlantic Forest in recent years predict that new species and genera will appear. The other important factor is the use of new markers that can better resolve most basal nodes of the phylogeny. As reported by [
31], a new gene has been added (EF), which seems to provide information that others do not have, but it is still not sufficiently variable. Molecular markers with intermediate variability between the presently used nuclear and mitochondrial markers (perhaps nuclear introns) are needed. When these tools are available, it will be possible to apply them to the rest of land planarian subfamilies, which so far have received little attention. For instance, there are no molecular phylogenetic studies involving representatives of Asian land planarians (Bipaliinae). Also, it may help in the study of the numerous tropical terrestrial planarians that have been introduced in Europe and the US, for which at present only one study has used molecular data to determine the affiliation of the species introduced [
36].
The take-home message: the use of molecular markers to resolve phylogenies of planarians has uncovered much diversity and has contributed greatly to constructing a better classification and taxonomy for the group.
7. Continenticola Evolution
Molecular data do not only allow better understanding of planarian diversity, they have also disentangled some features in their evolution. As explained in the introduction, molecular data showed that terrestrial planarians evolved once from a freshwater ancestor shared with the Dugesiidae family. More recent analyses suggested that some land planarians might have returned to the freshwater environment [
38]. We present here a new phylogenetic analysis including both more taxa and one more molecular marker. Maximum Likelihood (RaxML 7.0.0.; [
41]) and Bayesian Inference (MrBayes 3.2.; [
42]) trees have been inferred with information of 18S type II and 28S ribosomal genes and the EF nuclear gene. We have added more representatives of all the subfamilies (Table S1) and the new molecular marker (EF) to the analyses in order to obtain a better resolution of the basal nodes and groupings, compared with the results obtained in 2008 [
38].
The results shown in
Figure 1 support the hypothesis of a return to a freshwater habitat. New representatives of Dugesiidae (
Reynodlsonia Ball, 1974,
Spathula Nurse, 1950 and
Romankenkius Ball, 1974 species) continue to appear grouped within the clade of land planarians (Dugesiidae* in
Figure 1). One of the expectations of the 2008 study was that using more terminals and new genes to reconstruct the trees, this group would form a clade with the rest of dugesiids, but we confirm that this is not so. However, the lack of support for the basal nodes does not allow us to reject a sister group relationship of the Dugesiidae* to the terrestrial planarians. Despite the low Bootstrap and Posterior Probability values, we obtained here the monophyly of both terrestrial planarians and the dugesiids, excluding the Dugesiidae*, which were not achieved in the 2008 study. Although, after adding the EF, results are slightly better than those obtained in the previous work, there is still need for data that support the intermediate nodes of the phylogenies. Thus, the search for new markers with adequate variability to resolve these nodes (assuming those markers exist) must continue.
8. Weaknesses of Molecular Markers and Future Studies
In summary, for Tricladida, molecular data have uncovered an amount of diversity that, in some cases, could not be predicted at the morphological level. It has also helped clarify their evolutionary history and facilitate in many cases their taxonomic assignment and a more natural classification. However, the resolution is still poor at certain levels, requiring further studies.
In a temporal progression, from the early 1990s until presently, new markers have gradually been incorporated to the study of planarians. Beginning with
18S rRNA, for the higher-level taxonomy analysis, and ITS-1, adding later the mitochondrial gene Cox1, which has been extremely useful at the intraspecific level or when comparing closely related species. However, this gene presented high levels of saturation masking the weak signal of other genes in the basal branches when working at the family level, as in the Continenticola phylogeny [
38]. For the Geoplaninae phylogeny [
31], on the other hand, saturation was not a problem and the information added to the other genes was relevant in terms of internal branches, demonstrating that the simultaneous use of nuclear and mitochondrial genes is highly adequate for resolving phylogenies at different levels. Moreover, gene concatenation always presents better resolution than individual analyses, provided that the levels of noise of any of them does not mask the information present in the others (as in the case of Cox1 mentioned above). In general, the ribosomal genes provide information for basal splittings within phylogenies, supplemented by the resolution offered by most other genes at the intermediate and terminal splits (e.g. EF in [
31]). The amplified fragment of the
ATPase α (also tested in [
31]) has a small intron that in the future may be useful for intraspecific analyses, such as the nuclear intron (N13, [
22]), which have already proved to be informative for
S. mediterranea. Also, in a very recent study, a fragment of the
β-actin was used to resolve the phylogeny of a group of planarians from Lake Baikal [
43], and it seems to be a good candidate for further molecular studies.
However, to continue using molecular markers to disentangle the taxonomy of this morphologically simple group, and to use them as models for phylogeographical and population genetic studies, it is necessary to apply up-to-date methodologies. These could be statistical analyses with ABC based tests, or molecular methodologies to delimit species such as BPP [
44]. The use of these methodologies makes it compulsory to work with many more molecular markers (especially nuclear) with different levels of variability.
However, experience with planarians tells us that it is not easy to obtain new molecular markers for these organisms. Sometimes, the markers do not contain information at the level desired, such as
Histone H3 in the Continenticola study or
ATPase α in the Geoplaninae phylogeny. In other cases, they could not be amplified in planarians, due to the low availability of planarian or phylogenetically close group sequences in public databases that allow designing specific primers. This is a general problem for non-model groups. The use of universal primers to amplify mitochondrial genes such as 16S, or cob, has provided negative results for many species and the same has occurred with some nuclear genes. On the other hand, the search for intron regions in the nucleus also has been quite an elusive task, mainly due to the lack of a reference genome. In some cases, based on information of genes found by groups working on regeneration research, it has been possible to analyse some introns (N13 in
S. mediterranea, [
22]), but there was no option to amplify it in related species since the primers did not work. Moreover, most introns tested were extremely short (unpublished results). We should not forget that the age of the group makes its genera and families extremely old compared to other groups of animals, and this results in extremely divergent genomes.
The solution to this riddle may come from next generation sequencing methodologies (NGS). Today, in the era of genomics, an individual search for new genes can be too slow and lose meaning. Using transcriptome [
45,
46] or genomic data obtained through NGS [
47] to search for new markers may be a better strategy. However, adding more genes to the phylogenies does not necessarily imply a better phylogenetic resolution [
48]; it is important to find the balance between the number of taxa and their representation rather than only increasing the number of nucleotide or amino acid positions. The point is to obtain precise information and not much uninformative data.
As it has been extensively reported now, there are numerous strategies to recover information on molecular markers from the nucleus without having previous knowledge of the genome sequences. Anonymous markers [
49] can be developed by obtaining complete genome data, or a reduced fraction, for a series of individuals tagged independently and representing the diversity of the group under study. Individuals from different populations, or even from the same, can be compared to find regions of diversity within their genome that can be used as markers to undertake population genetic, phylogeographic or phylogenetic analyses by designing highly specific primers. An alternative strategy is to use NGS to simultaneously obtain genomic information for all the individuals under study, as in [
50]. In the case of Tricladida, these strategies are in their infancy, some complete mitochondrial genomes have already been published [
51] and others are on the way (non-published data). Availability of these complete genomes would facilitate the task of amplifying new mitochondrial regions. On the other hand, the use of NGS to search for anonymous nuclear markers would require specific experiments for each case, since as stated above; the age of the taxa makes the results in one group of no use for a closely related one.
We expect that NGS will greatly contribute to expanding our knowledge of this group, while also recognizing the need to combine molecular with other types of data to provide a complete understanding of their evolution.
Conclusions
The availability of molecular data and of up-to-date methodologies, has transformed planarians to a cutting-edge model on phylogeographic and demographic studies. Molecularly based methodologies to delimit species have shown to be a robust strategy for detecting potentially new species and testing the taxonomic status of known species. The use of molecular markers to resolve phylogenies of planarians has uncovered much diversity and has contributed greatly to constructing a better classification and increase the taxonomic richness of the group. Moreover, molecular markers allow inferring evolutionary histories that could not be disclosed only on the base of morphology and/or karyology. Nonetheless, the markers at use till now have shown a lack of resolving power in some instances. NGS methodologies are expected to help develop new markers to achieve a greater understanding of the group evolutionary history and to have a more accurate taxonomy.


