Article

Eco-Engineering Mangrove Restoration at Gazi Bay, Kenya

by
Gladys Kinya
1,2,*,
James Gitundu Kairo
2,
Rossa Ngendo Nyoike
1,
Josphat Gachoki Nguu
2,
Brian Kiiru Githinji
2 and
Michael N. Githaiga
1
1
Department of Biological Sciences, University of Embu, Embu P.O. Box 6-60100, Kenya
2
Department of Oceanography and Hydrography, Kenya Marine and Fisheries Research Institute, Mombasa P.O. Box 81651, Kenya
*
Author to whom correspondence should be addressed.
Diversity 2024, 16(3), 135; https://doi.org/10.3390/d16030135
Submission received: 30 November 2023 / Revised: 31 December 2023 / Accepted: 6 January 2024 / Published: 22 February 2024
(This article belongs to the Special Issue Mangrove Regeneration and Restoration)

Abstract

:
Mangroves offer a range of globally acknowledged advantages, yet they continue to be lost and degraded. Efforts to restore lost mangroves using conventional techniques in high-energy areas result in low success rates due to the removal of seedlings via wave action. We assessed the efficacy of using modified Riley Encasement Methods in the restoration of mangroves in high-energy areas in Gazi Bay, Kenya. Vegetation and soil baseline data were collected in 49 square plots of 100 m2, which were established along belt transects perpendicular to the shoreline. The following mangrove vegetation data was collected: species composition, tree height (m), and stem diameter (cm). From these, the importance value index (IV), basal area, and standing density (stems/ha) were derived. Sediment cores were made in the center of each square plot for carbon and grain size analysis. Mangrove (Rhizophora mucronata) planting adopted a randomized complete block design (RCBD) in which the planting area was divided into three blocks (A, B, C). Within each block, treatments (bamboo and different-sized PVC pipes) were randomly assigned locations. The results of the study reveal significant variations in survival and growth rates among treatments. Higher survival rates were recorded for seedlings grown within PVC encasements (43%), surpassing bamboo (1%) and control groups (4%). Our findings suggest that PVC pipes were efficient in supporting and protecting seedlings from external forces. We expound on the implications of the results and highlight potential enhancements for the effectiveness of encasement technique in mangrove restoration.

1. Introduction

Mangroves are recognized as one of the world’s most productive ecosystems, playing crucial roles ecologically, physically, economically, and socially [1,2]. They provide a wide range of valuable goods and services that contribute to poverty reduction, increased food security, and opportunities for tourism and recreation, as well as to the moderation of extreme weather events [3,4]. In Kenya, approximately 80% of the coastal communities derive their livelihood from mangrove ecosystems [5]. Ecologically, mangroves provide a habitat and breeding ground for marine fauna, including fishes [6]. In addition, they sequester about five times more carbon than tropical forests [7,8]. Research shows that mangrove sediments together with the roots are estimated to hold approximately 6.4 billion tons of carbon [6], and capture about 30 million tons every year [9], and therefore are suitable for mitigating climate change [10].
Moreover, mangroves and associated ecosystems play a significant role in shoreline and coastal protection [11,12,13,14]. Mangroves are capable of minimizing wave energy, stabilizing sediment, and facilitating sediment accretion [11,12,15,16,17,18]. For instance, a 100 m width of mangroves has the potential to reduce incoming wave energy by 66% of the wave’s height [19]. Their root system forms a network that stabilizes sediments, preventing erosion [12]. The vegetation cover reduces the speed of the flowing water and wind, promoting sediment accretion, which stimulates the production of the belowground root system [20], further improving soil cohesion. The dense mangrove vegetation together with the reduced wind speed contributes to reduced wave vigor [6,19,21,22], thus protecting the shoreline from wave damage. In the event of sea level rise, mangroves are able to accrete sediments, thereby adapting to the rising sea levels [23,24]. The role of mangroves in coastal protection was well illustrated in the event of the Indian Ocean Tsunami (IOT) of 2004 where areas with degraded mangroves experienced high losses of life and properties compared to areas with intact ecosystems [25,26]. The loss of life was estimated to exceed 200,000 deaths and the cost of property loss was estimated as more than 9.9 billion dollars [27,28,29].
Despite their great values, mangroves throughout the world continue to be lost and degraded as a result of human and natural causes [30,31]. It is estimated that the world is losing 1–3% of mangrove areas per year [32]. In Kenya, at least 40% of the 60,000 ha of mangroves were lost and degraded between 1990 and 2005 [33]. Whereas the rate of loss has declined in some areas, the remaining mangrove forests are still threatened by illegal harvesting, land encroachment, pollution, and climate change effects [34]. Mangrove loss risks the release of huge amounts of the stored carbon back into the atmosphere, further impacting climate [7,35]. In addition, the loss of the outer mangrove fringe has been associated with increased shoreline erosion and decreased elevation [36,37]. This increases the vulnerability to coastal hazards and also alters the optimal conditions for mangrove establishment and growth [36,38]. At Gazi Bay in Kenya, mangroves have been historically exploited for wood and non-wood resources [39,40]. In the 1970s and 1980s, the industrial exploitation of mangrove wood for energy in Gazi left large contiguous blank areas, some of which have failed to regenerate naturally to date [41,42]. As a result, the area experiences coastal erosion due to wave exposure prompting the uprooting of coconut trees adjacent to the community’s agricultural field.
In response, widespread restoration initiatives have been launched to re-establish lost mangrove stands, particularly in recent times when ecosystem restoration has become increasingly popular and essential to address climate change and biodiversity decline [43,44,45]. The commonly used approaches include natural regeneration, which relies on the spontaneous dispersal of propagules [40] and artificial regeneration which entails the direct planting of propagules or nursery-raised saplings [45,46,47]. While these methods are usually fit for mangrove restoration in low-energy areas, they typically underperform in mangrove-lined ecosystems. Success rates of restoration efforts vary from one project to another [47,48,49] depending on site history, the choice of the species to be planted, and approach used. Low success rates are often reported in areas exposed to high energy and where habitats have been destroyed and ecological conditions altered [46,50].
In Gazi Bay, where this study was based, attempts by Kairo [46] to rehabilitate high-energy sites using conventional planting methods failed, recording success rates of less than 10%. This failure is attributed to changes in site conditions and exposure to high wave action [46] that dislodge the newly planted seedlings. Poor mangrove performance has been reported elsewhere, where unshielded coastlines are prone to wave actions [51,52]. This underscores the need for alternative restoration techniques. This study assessed the applicability and efficacy of the modified Riley Encasement Methodology (REM) initially proposed by Riley & Kent [53] to inform on their replicability in re-establishing the lost mangroves in high-energy areas of Gazi Bay. Under REM the planting materials are installed in polyvinyl chloride (PVC) tubing to protect them from being dislodged by waves [53]. In the current study, we varied the diameter of encasements (7 to 10 cm) as well as the material types (bamboo and PVC pipes). The encasements are meant to shield and support seedlings during the early developmental stages. Research questions were as follows: What are the biophysical characteristics of degraded high-energy mangrove site in Gazi? How does the survival and growth of the replanted mangroves compare among different treatments?

2. Materials and Methods

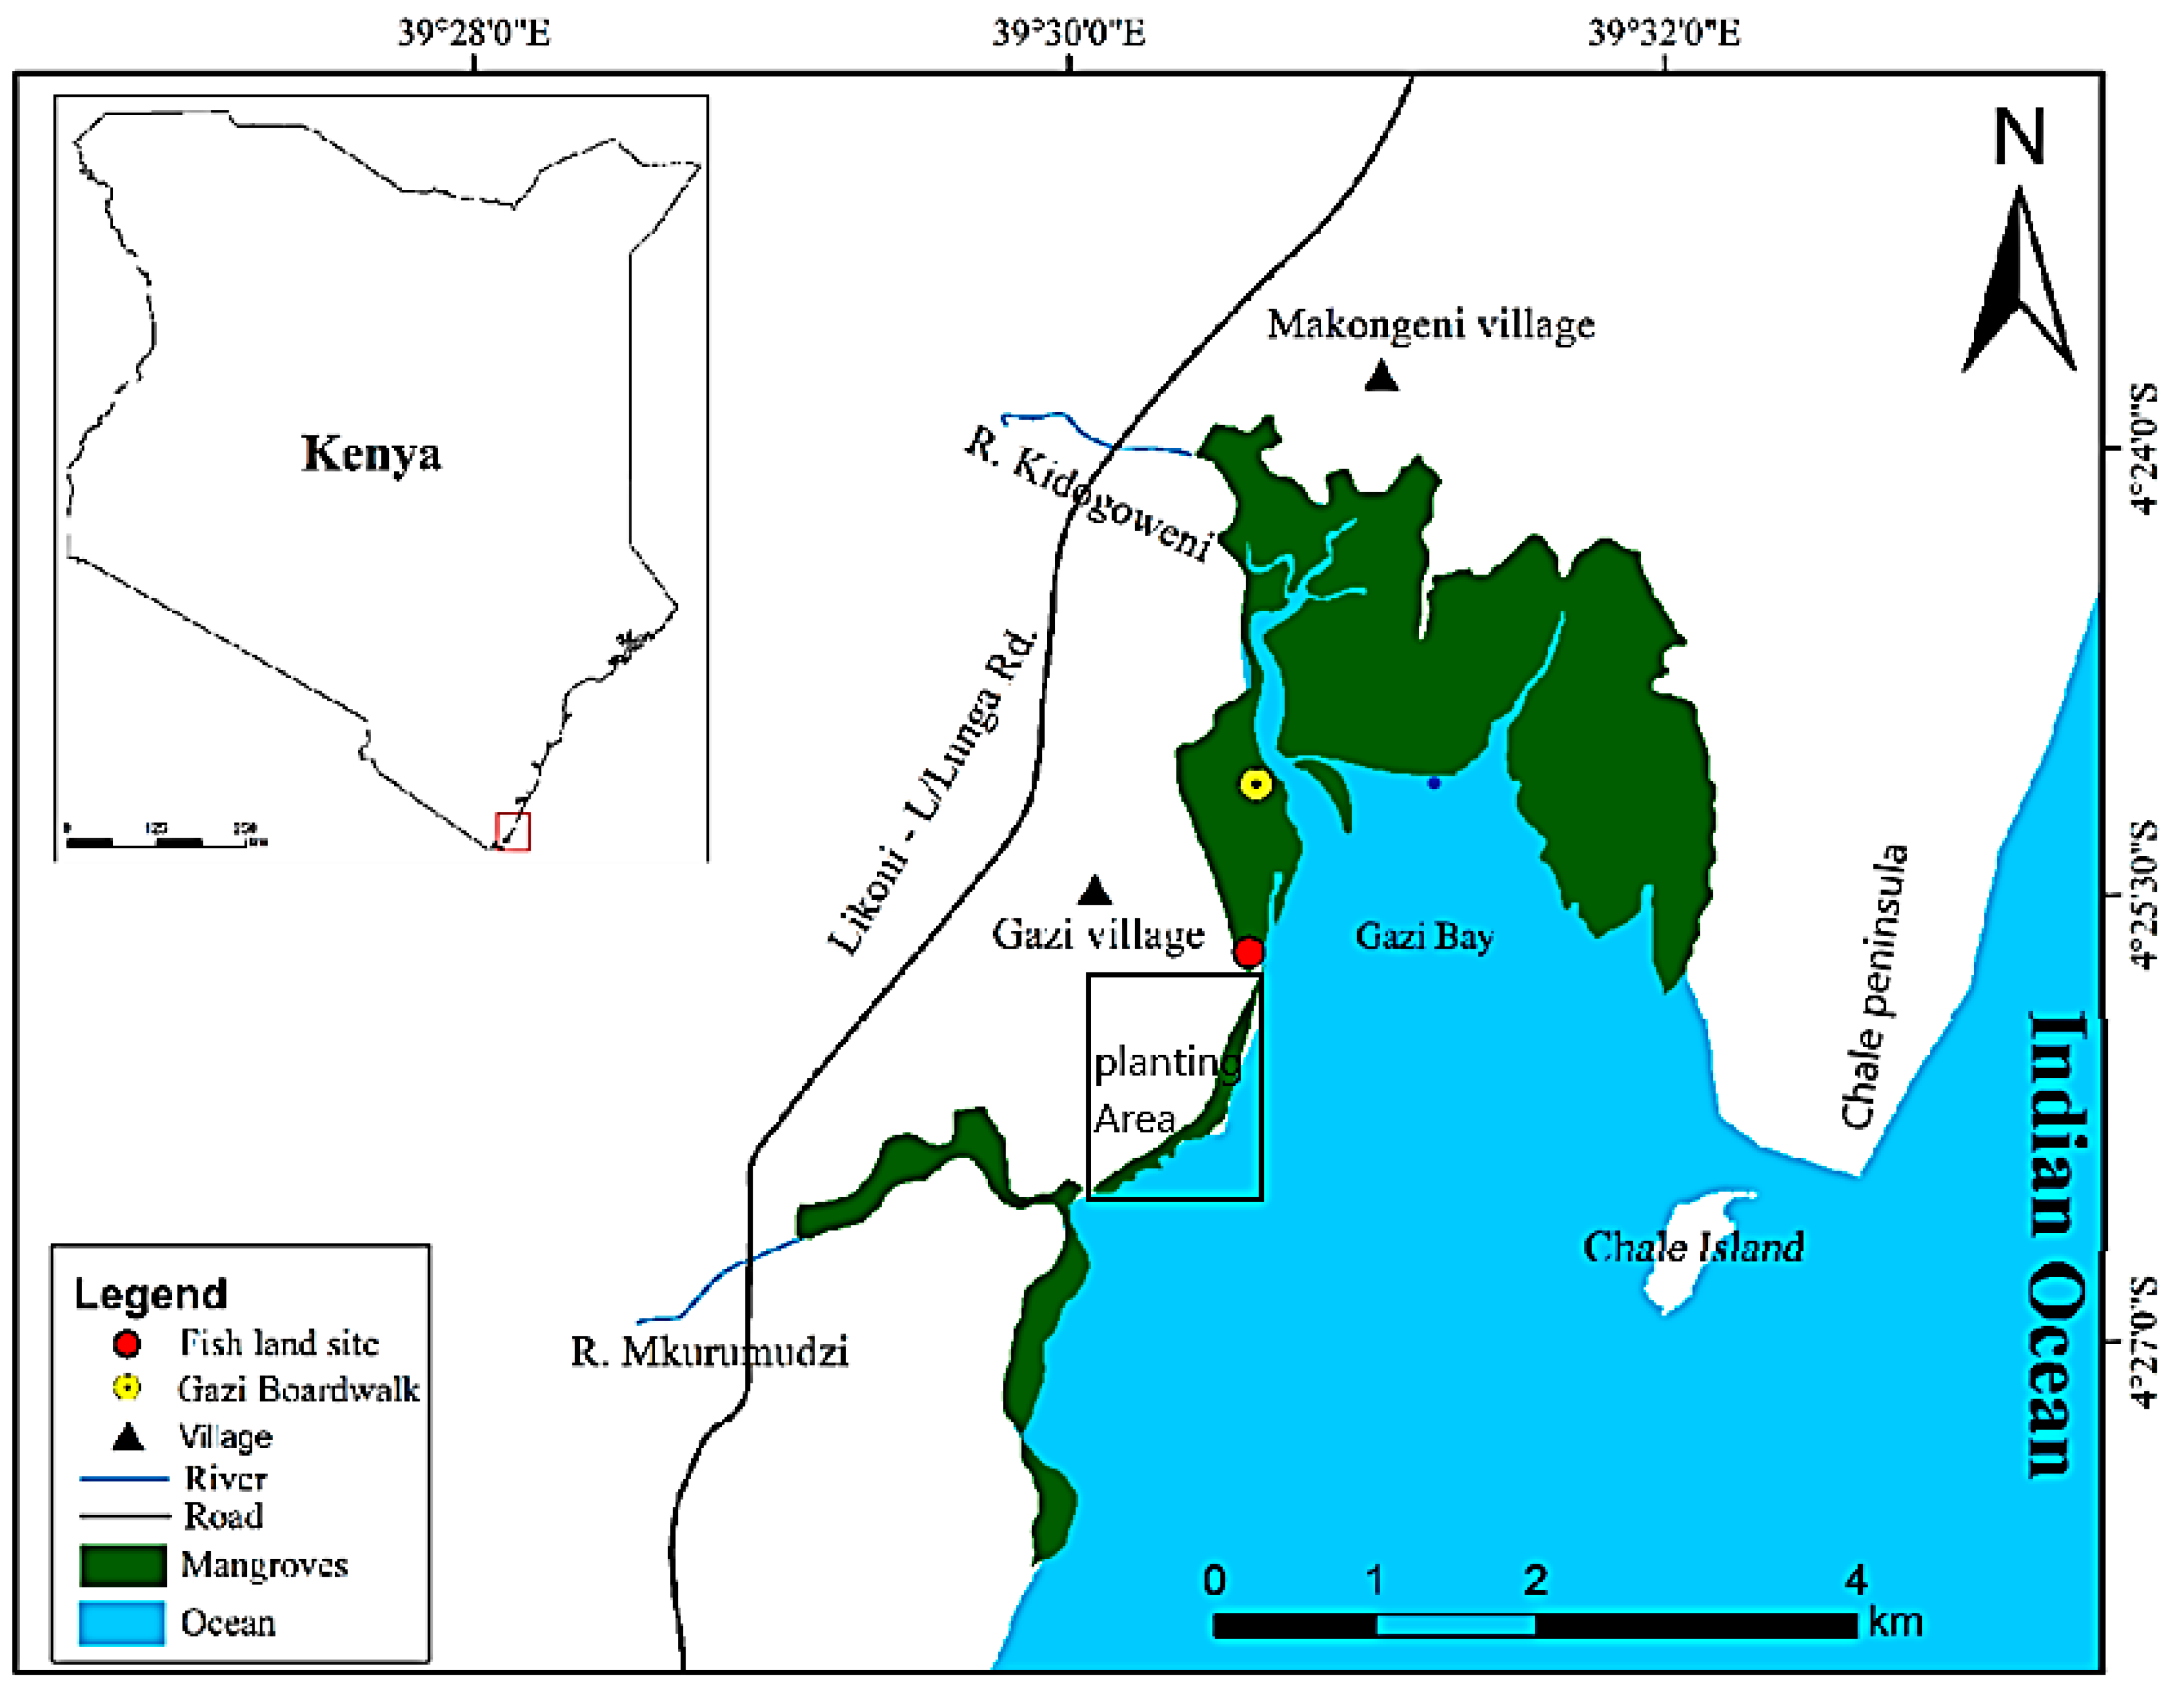
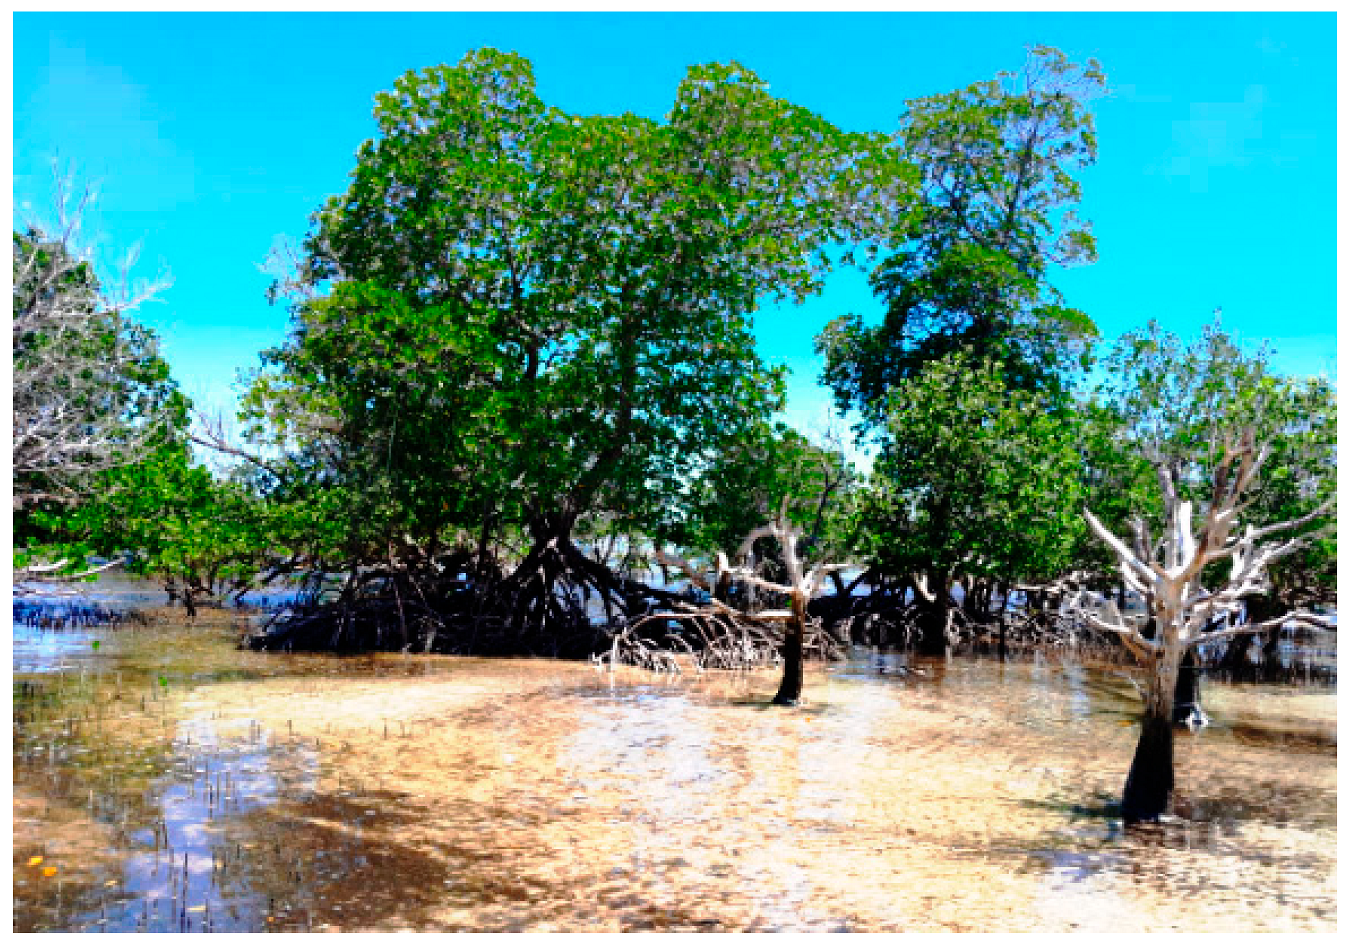
2.1. The Description of the Study Area

The study was carried out in the south coast of Kenya at Gazi Bay (39° 30’ E, 04° 25’ S), located about 55 km from Mombasa (Figure 1). The bay comprises two villages: Gazi and Makongeni. It covers about 18 km2 [54] and is characterized by the eastern and western creeks, fringing mangroves, seagrass beds, and a long intertidal area. Two seasonal rivers, Kidogoweni and Mkurumudzi, drain into the western creek and provide freshwater input into the bay while groundwater seepage happens in a few points [55].
The bay connects to the Indian Ocean through a relatively broad opening (3500 m), and is usually shallow, with an average depth of 5 m at the entrance [56]. It is protected to the east by Chale Peninsula and to the south by a fringing coral reef. Coral reefs, present in dispersed clusters serve as habitats for various marine fauna including mollusks, crustaceans, and fish. As such, they contribute to biodiversity and play an important role in sustaining community livelihoods through tourism and fisheries [57].
The climate of Gazi Bay may be classified as tropical wet/dry as per Koppen classification [58]. The wet season is associated with the southeast monsoons. It is characterized by heavy rains and rough seas, and usually occurs from March to August. Dry season follows from November to March, associated with the northeast monsoon winds. This season features calm seas [59]. Annual total rainfall in Gazi ranges from 1000 mm to 1600 mm, with temperature ranging from 19 to 34 °C throughout the year [60]. Humidity is high, and averages about 80% all year round [56].
There are about 700 ha of mangroves in Gazi Bay, represented by nine species [61,62]. The most important mangrove species in Gazi Bay are Rhizophora mucronata, Ceriops tagal, and Avicennia marina, and these occupy more than 80% of the forest formation [63]. Gazi mangroves exhibit a zonation pattern that is similar to other mangrove forests in Kenya. The seaward side is occupied by Sonneratia alba. This is followed by Rhizophora mucronataBruguiera gymnorrhiza in the mid-zone and Ceriops tagal, Avicennia marina, and Lumnitzera racemosa on the landward side [39]. The community in Gazi village benefits from sale of carbon credits from the mangrove forest, which has positively impacted their livelihoods.

2.2. Vegetation Surveys

Systematic random sampling design was adopted in the study. Square quadrats of 100 m2 were established along 50 m belt transects established perpendicular to the shoreline at an interval of 20 m. In the quadrats, all mangroves with a stem diameter at breast height (dbh) ≥ 2.5 were identified, counted, and recorded. Vegetation attributes including tree height (m) and dbh (cm) were collected. Dbh measurements for all species were taken at 130 cm above the ground [64], except for Rhiziphora mucronata in which they were taken at 30 cm above the highest grounded prop root [65]. From the field data, the following were derived; tree basal area (m2/ha), stand density (stems/ha), and importance value (IV); following procedures discussed in Kauffman and Donato [66] as well as in Kershaw [67].

2.3. Sediment Characteristics

Within the 100 m2 quadrats established for vegetation assessment, two sediment cores were collected using a 7.0 cm diameter half-arc soil corer. The soil corer was vertically inserted into the soil until a maximum depth was reached and pulled out gently. Each core was partitioned, using a ruler, into sections representative of various depths (0–15, 15–30, 30–50, and 50–100). Sub-samples measuring 5 cm were collected from the midpoints of the sections as follows: 5–10, 20–25, 37.5–42.5, and 72.5–77.5 cm [66]. The samples were then placed into labeled containers and transported to the laboratory and stored at 4 °C for a further analysis of particle size, bulk density, and sediment organic matter.

2.3.1. The Determination of Sediment Particle Sizes

Dry sieve method was used to determine the distribution of soil grain sizes. A standard weight of 100 g of the dried sample was measured, homogenized, and then passed through a series of sieves ranging from a 2 mm to 38 µm mesh-size. Subsequent statistical analysis was done following the Folk and Ward [68] method using the GRADISTAT computer program to determine the percentage proportions of silt, clay, and sand [69].

2.3.2. The Determination of Bulk Density and Sediment Organic Matter

To calculate bulk density, samples were placed on pre-weighed aluminum foils and oven dried at 60 °C until a constant dry weight, weighed, and recorded. The bulk density was calculated by dividing the mass of the oven-dried sample by the volume of the sample as illustrated in the equation below [70].
Bulky   Density   ( g / cm 3 ) = Weight   of   oven - dried   sample   ( g ) Volume   of   the   sample   ( cm 3 )
where,
Volume = cross - sectional   area   of   the   corer   π r 2   ×   height   of   the   sub - sample
To determine soil organic matter (SOM), the loss-on-ignition (LOI) method was used. It is a semi-quantitative method in which soil organic matter is lost in the process of combustion in a furnace. To maximize the efficacy of the results, samples used in computing for bulky density were used. The dried samples were homogenized and grinded using an electronic grinder machine for ten (10) min and then sieved to separate the fine sediment from debris. Samples were then combusted at 450 °C in an induction furnace for 8 h in three replicates of 5.0 g each, after which they were cooled in a desiccator and weighed to obtain the weight after combustion. The percentage of SOM was then calculated following the equation below:
SOM   ( % ) = Mass   before   combustion   g   Mass   after   combustion ( g )   Mass   before   combustion   ( g ) × 100
Since LOI expresses not only the loss of organic carbon, but the loss of organic matter, which consists of many nutrients such as hydrogen, carbon, nitrogen, oxygen, and sulfur [70], an equation relating LOI% to SOC% in mangrove ecosystems was used to estimate Soil Organic Carbon (SOC) from SOM [71].
%   SOC = 0.415   ×   %   LOI + 2.89 .

2.4. Experimental Mangrove Planting

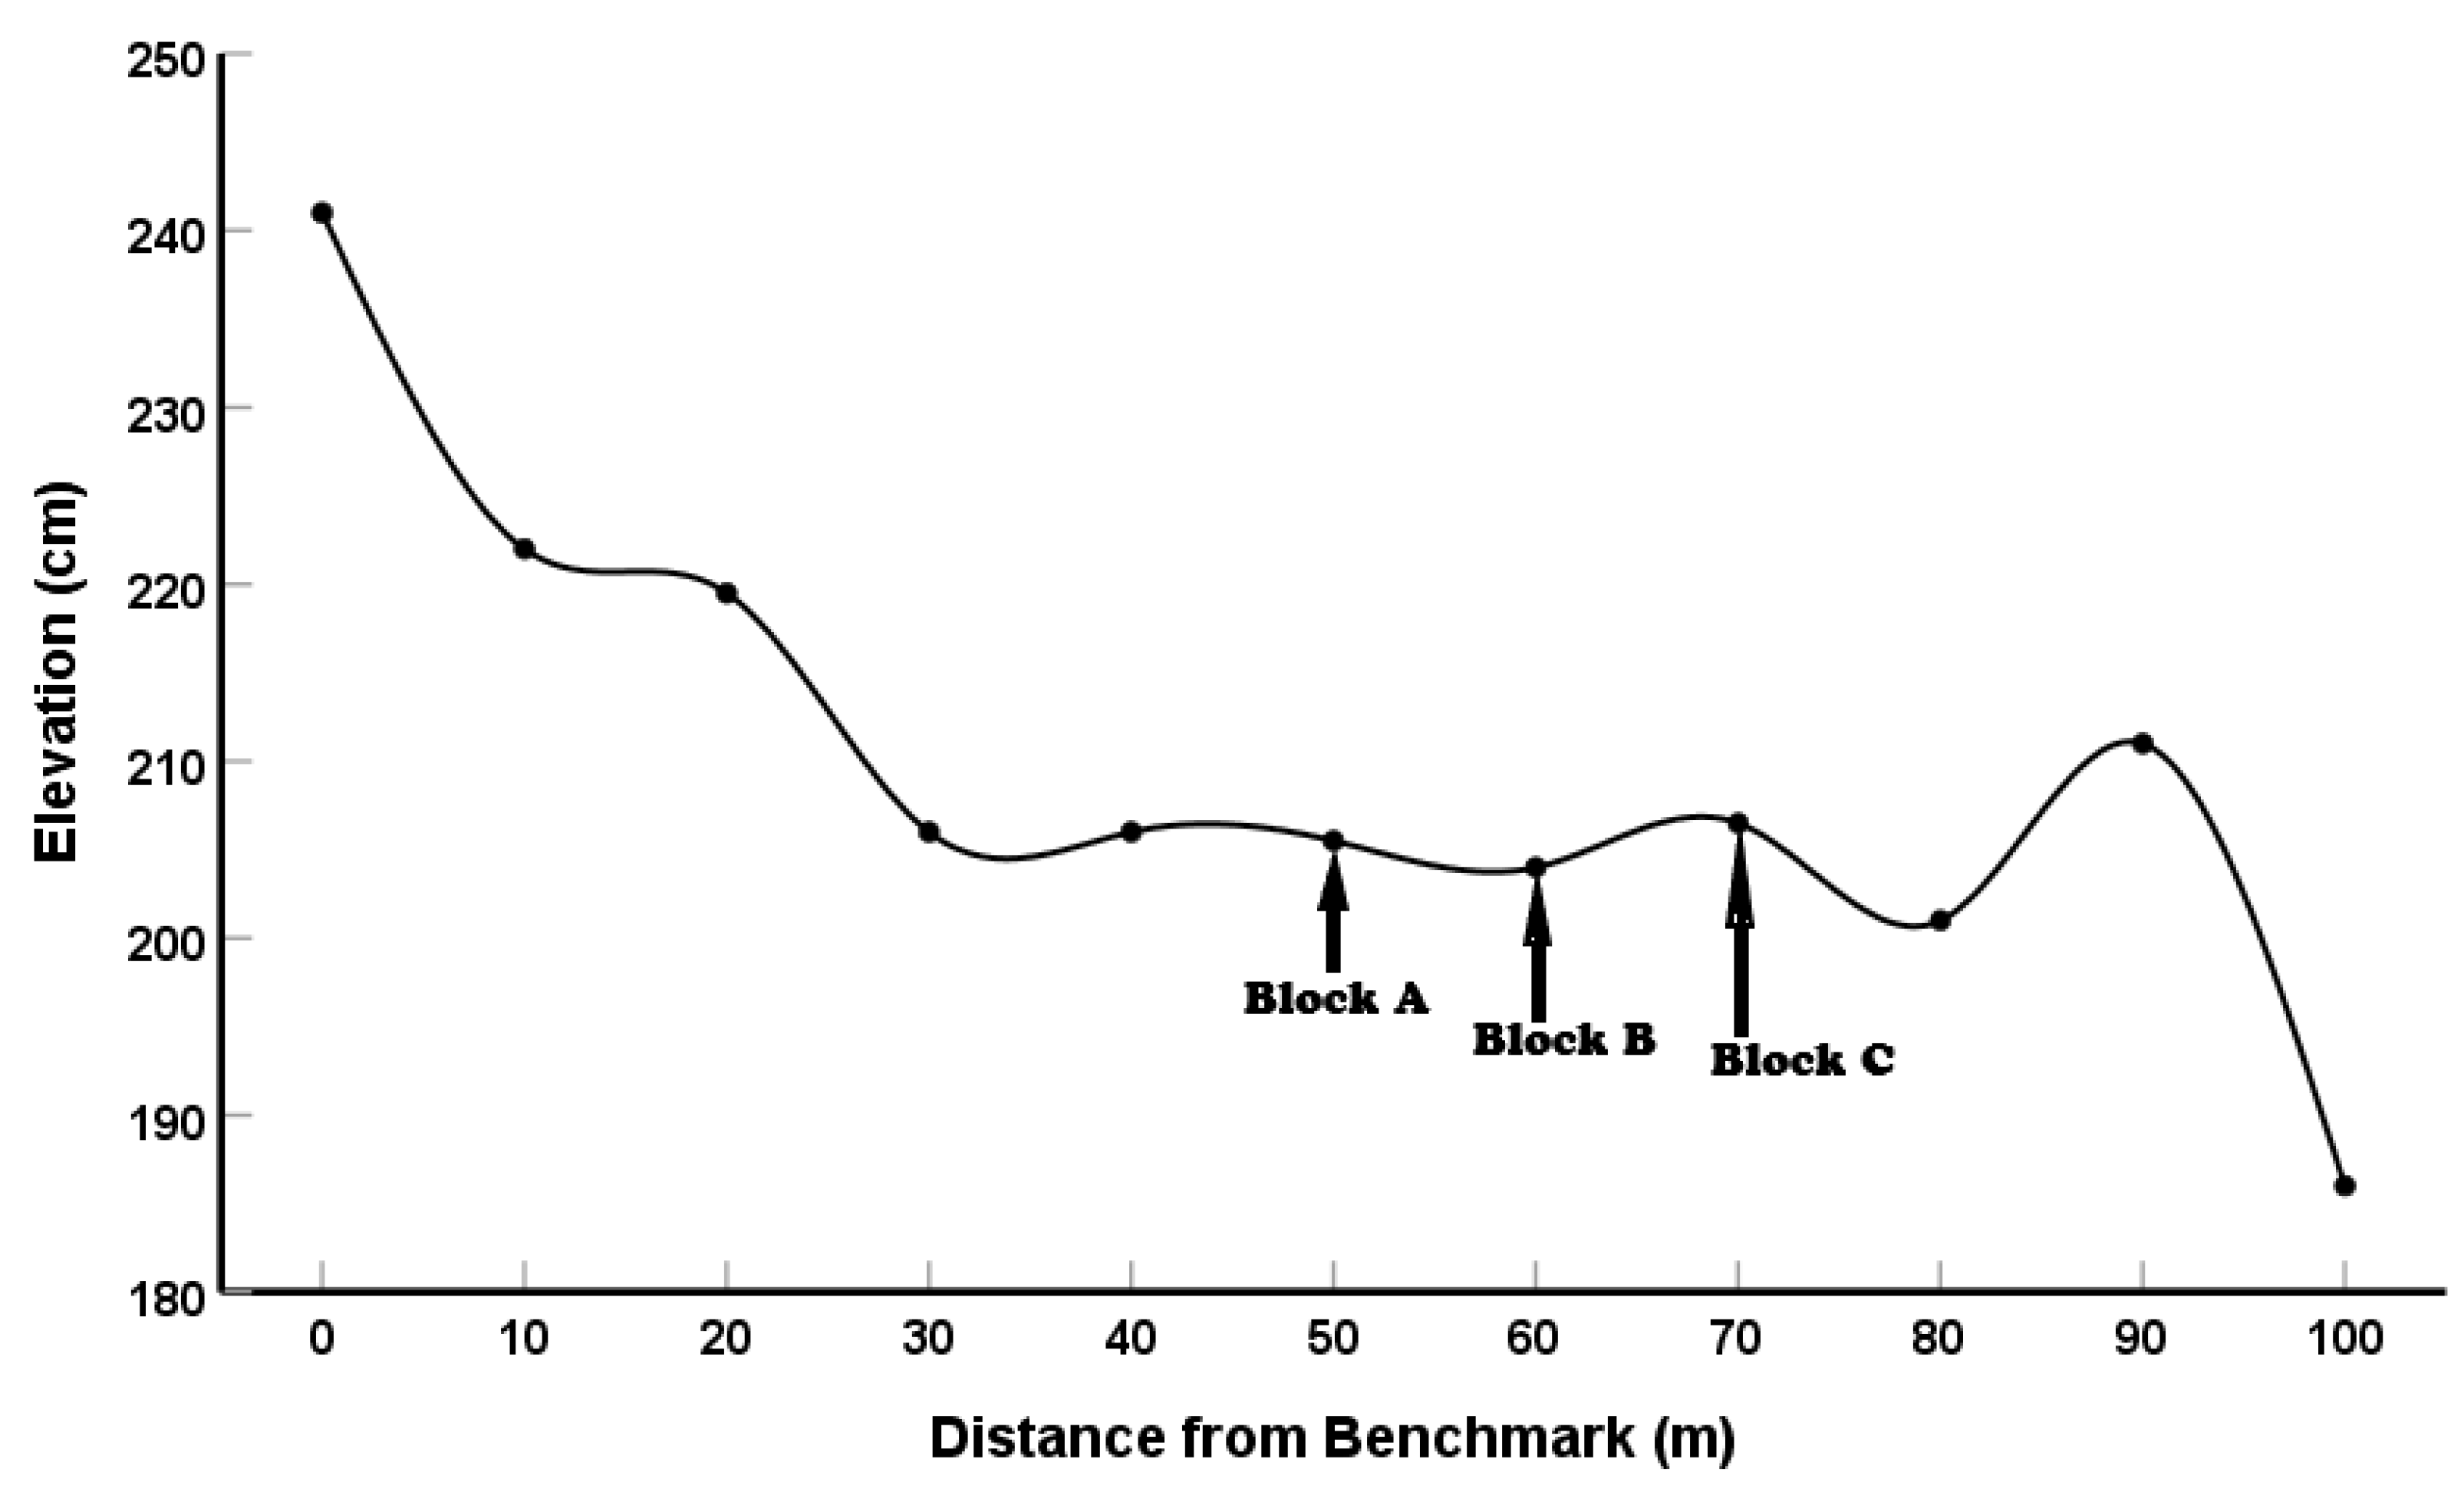
2.4.1. Site Selection

Natural and socio-ecological factors were considered in selecting the planting site. With regards to natural suitability, the site was selected due to the previous presence of mangrove vegetation and exposure to strong waves, currents, and winds. Regarding socio-ecological suitability, we expect improved shoreline protection through the rehabilitation of mangroves. The majority of the community in Gazi supports the idea of replanting mangroves to control shoreline erosion in the designated area. Mangrove rehabilitation efforts are anticipated to align harmoniously with both current and future land use in the area. The site was designated for annual planting by communities involved in the carbon offset scheme, Mikoko Pamoja. Based on the technical specifications, the community is expected to replant 4000 new mangrove seedlings each year in the degraded areas of Gazi Bay. Therefore, the current restoration experiment aligns with the community needs for mangrove rehabilitation, aiming to yield climate-related benefit.

2.4.2. The Use of PVC and Bamboo Pipes

Though traditional methods are generally effective for mangrove restoration in low-energy areas, they may not suffice in areas that face challenges such as wave action and soil erosion/accretion. They often provide minimal protection from waves and other physical forces [72]. In response to such conditions, alternative methods, such as the use of PVC pipes (Riley Encased Method) and bamboo pipes, are incorporated to provide protection during the early developmental stages [53]. This physical protection serves to mitigate the impacts of wave and wind action. Importantly, the PVC pipe is intended to be removed once the saplings have established [73].

2.4.3. Encasements and Propagule Preparation

Using an electric driller, the 3” and 4” PVC piping and bamboo piping were drilled to make holes along the length for allowing water to flush in and out. A vertical slit was then made in the PVC pipes to allow easy removal when mangroves are fully established. The mature propagules of Rhizophora mucronata were collected from the forest floor or by shaking the mother plant and picking the falls. To initiate rooting, the propagules were spread on top of moistened sawdust in a dark room and covered with a wet heavy blanket. Propagules which did not root after 7 days were considered non-viable and discarded. Viable propagules were then assigned to treatments.

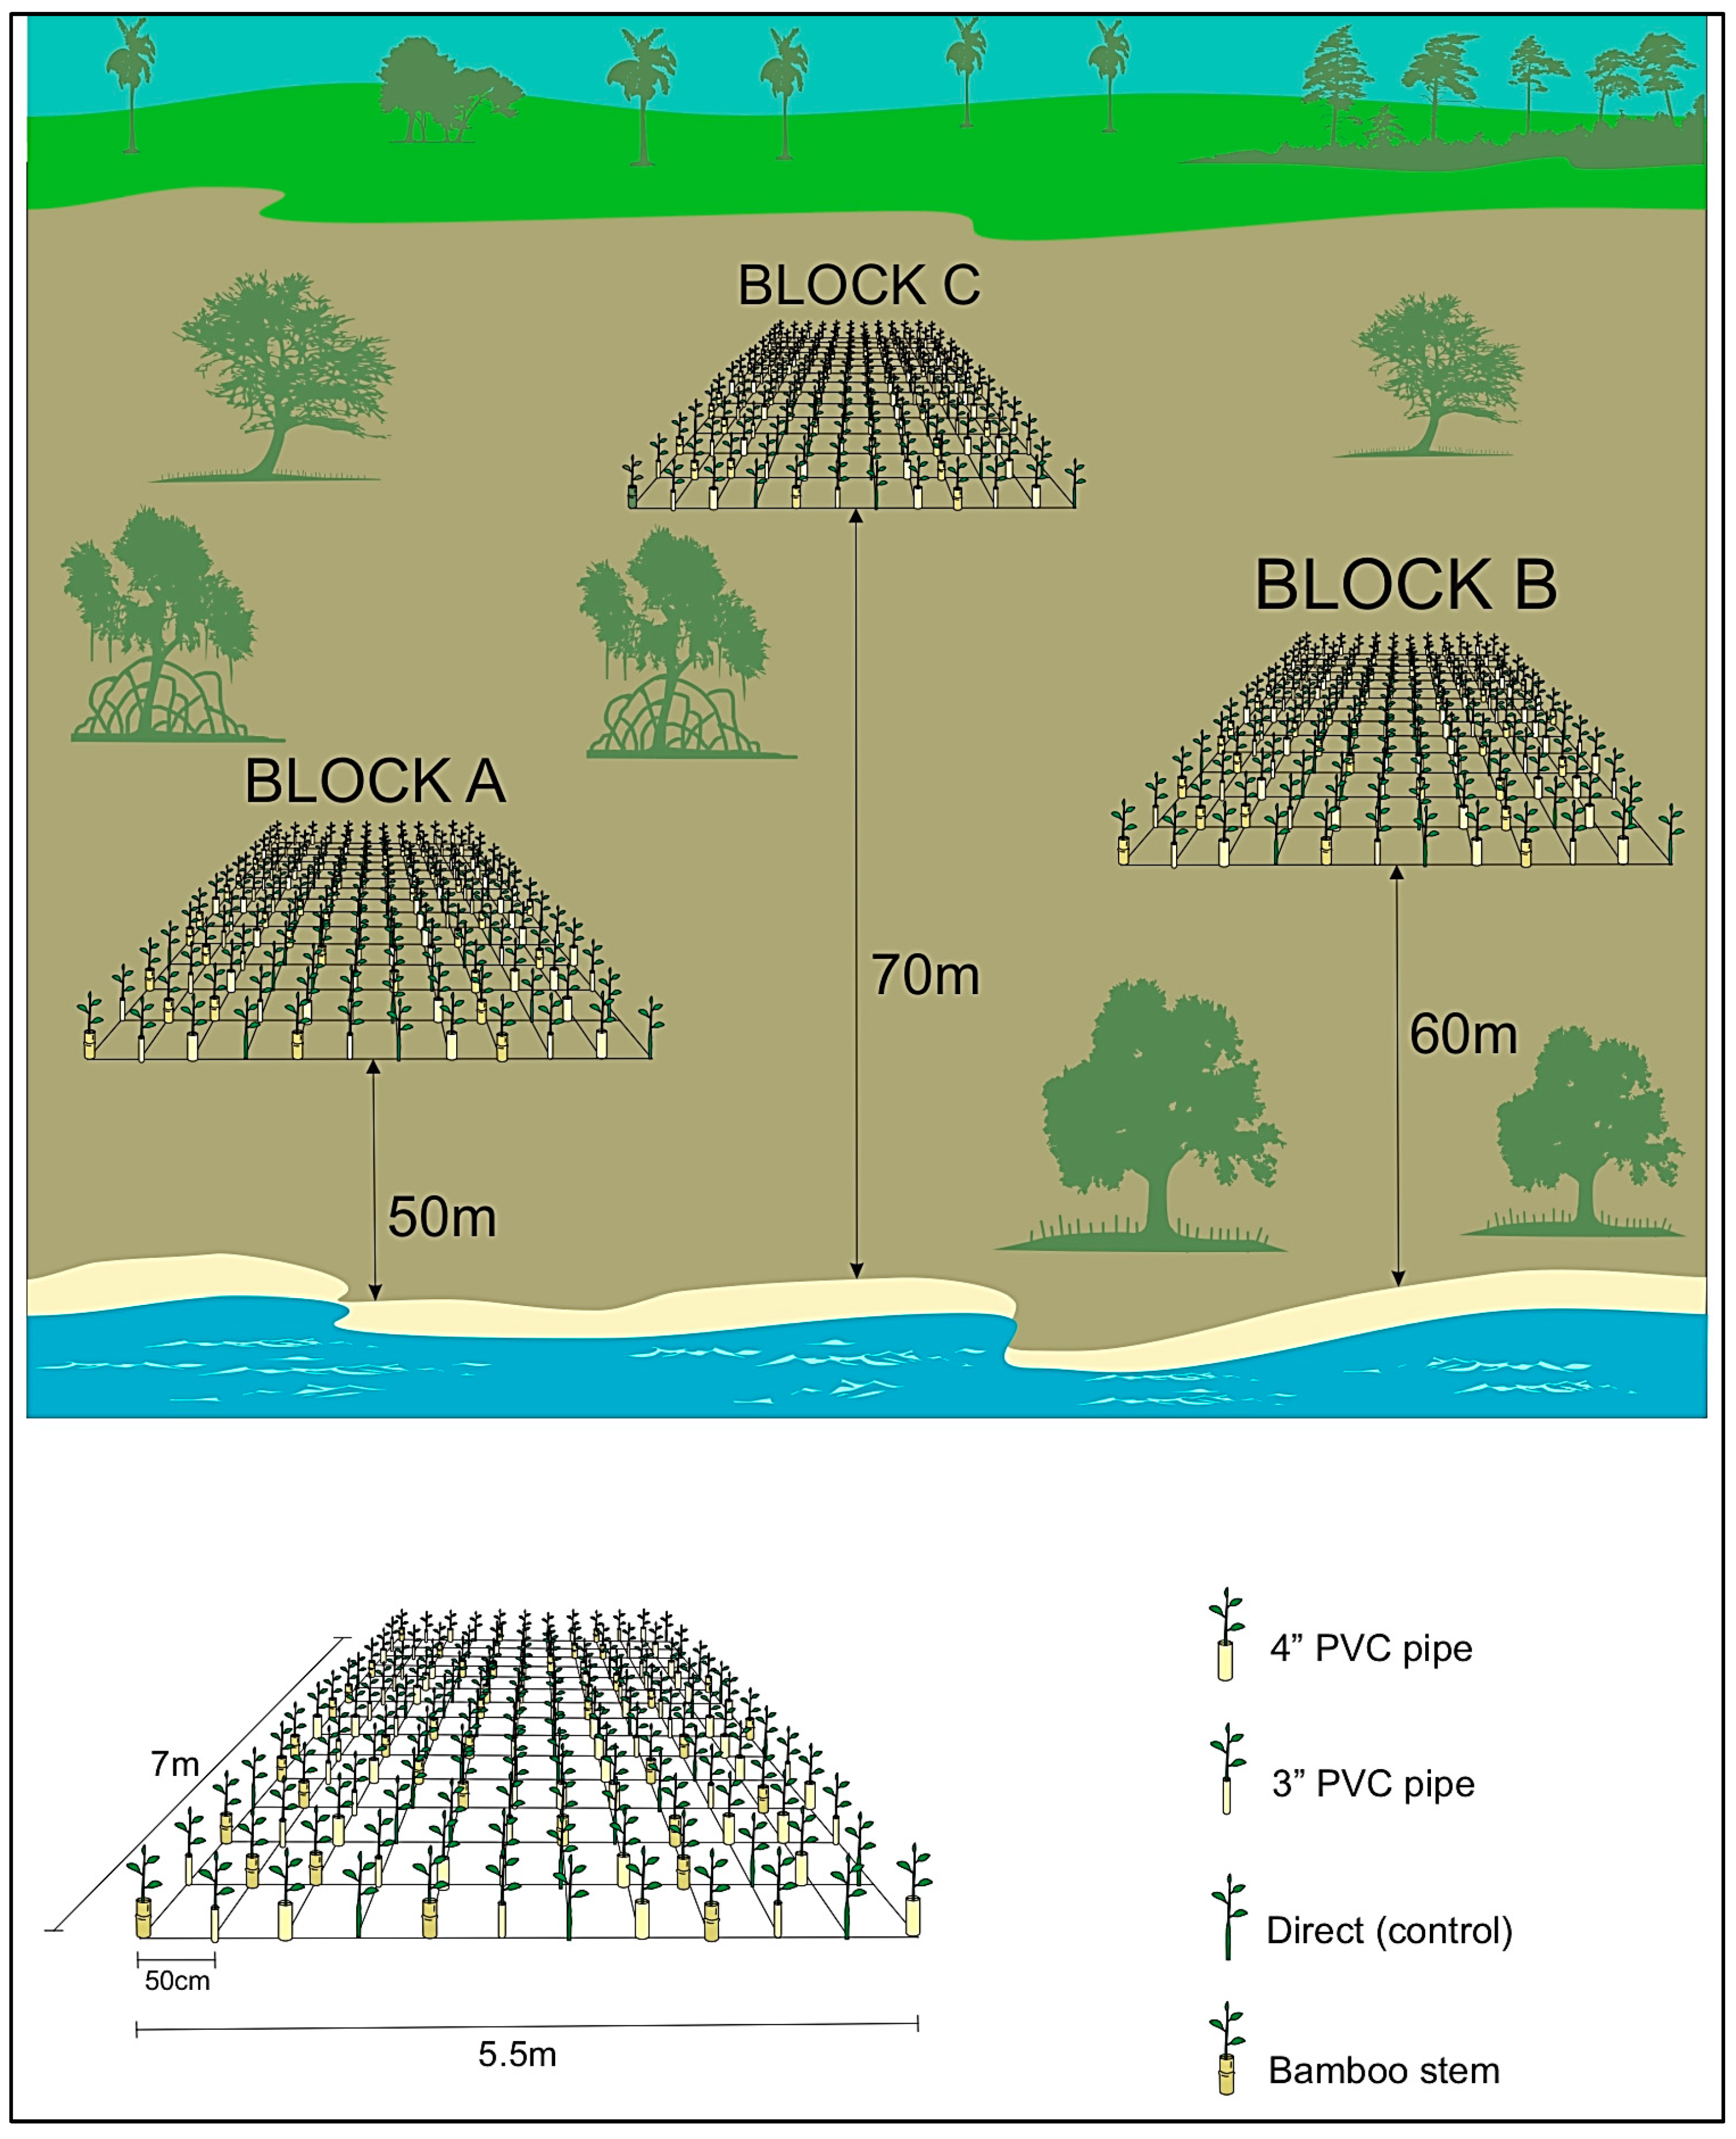
2.4.4. Experimental Design

The randomized complete block design (RCBD) was employed in setting up the experiment. Three rectangular blocks measuring 5.5 m by 7 m were established perpendicular to the shore (Figure 2).
Treatments including 3” PVC (7 cm in diameter), 4” PVC (10 cm in diameter), bamboo tubing, and control were randomized separately for each block using the RAND function in the Excel 2016 package. On every block pits were dug at a spacing of 50 cm for encasement installation as the bedrock was shallow, making it impossible to directly push encasements into the ground as anticipated. The planting spacing was kept at a minimum distance of 50 cm because the site faces strong waves. Closer seedling spacing is recommended for such sites to help withstand the impact of waves [74,75]. After establishment, if all seedlings are growing well, they could be transplanted to other areas with gaps [75]. After digging pits, encasements were tightly fixed in the ground and cut into a height corresponding to the elevation of the existing Rhizophora mucronata mangroves closest to the planting site [39]. The pipes were then filled with sufficient mangrove sediments to set the seedling at an elevation consistent with the mean-high-water mark. In each encasement, one propagule was planted. Every block contained 15 rows at a spacing of 50 cm and every line contained 3 units of each of the treatments, which resulted in 45 units of every treatment in a block. This added up to a total of 180 propagules in every block and a total of 540 propagules in all blocks (Figure 2). Figure 3 shows the planting site ground elevation measurements in relation to the mean sea level (MSL).

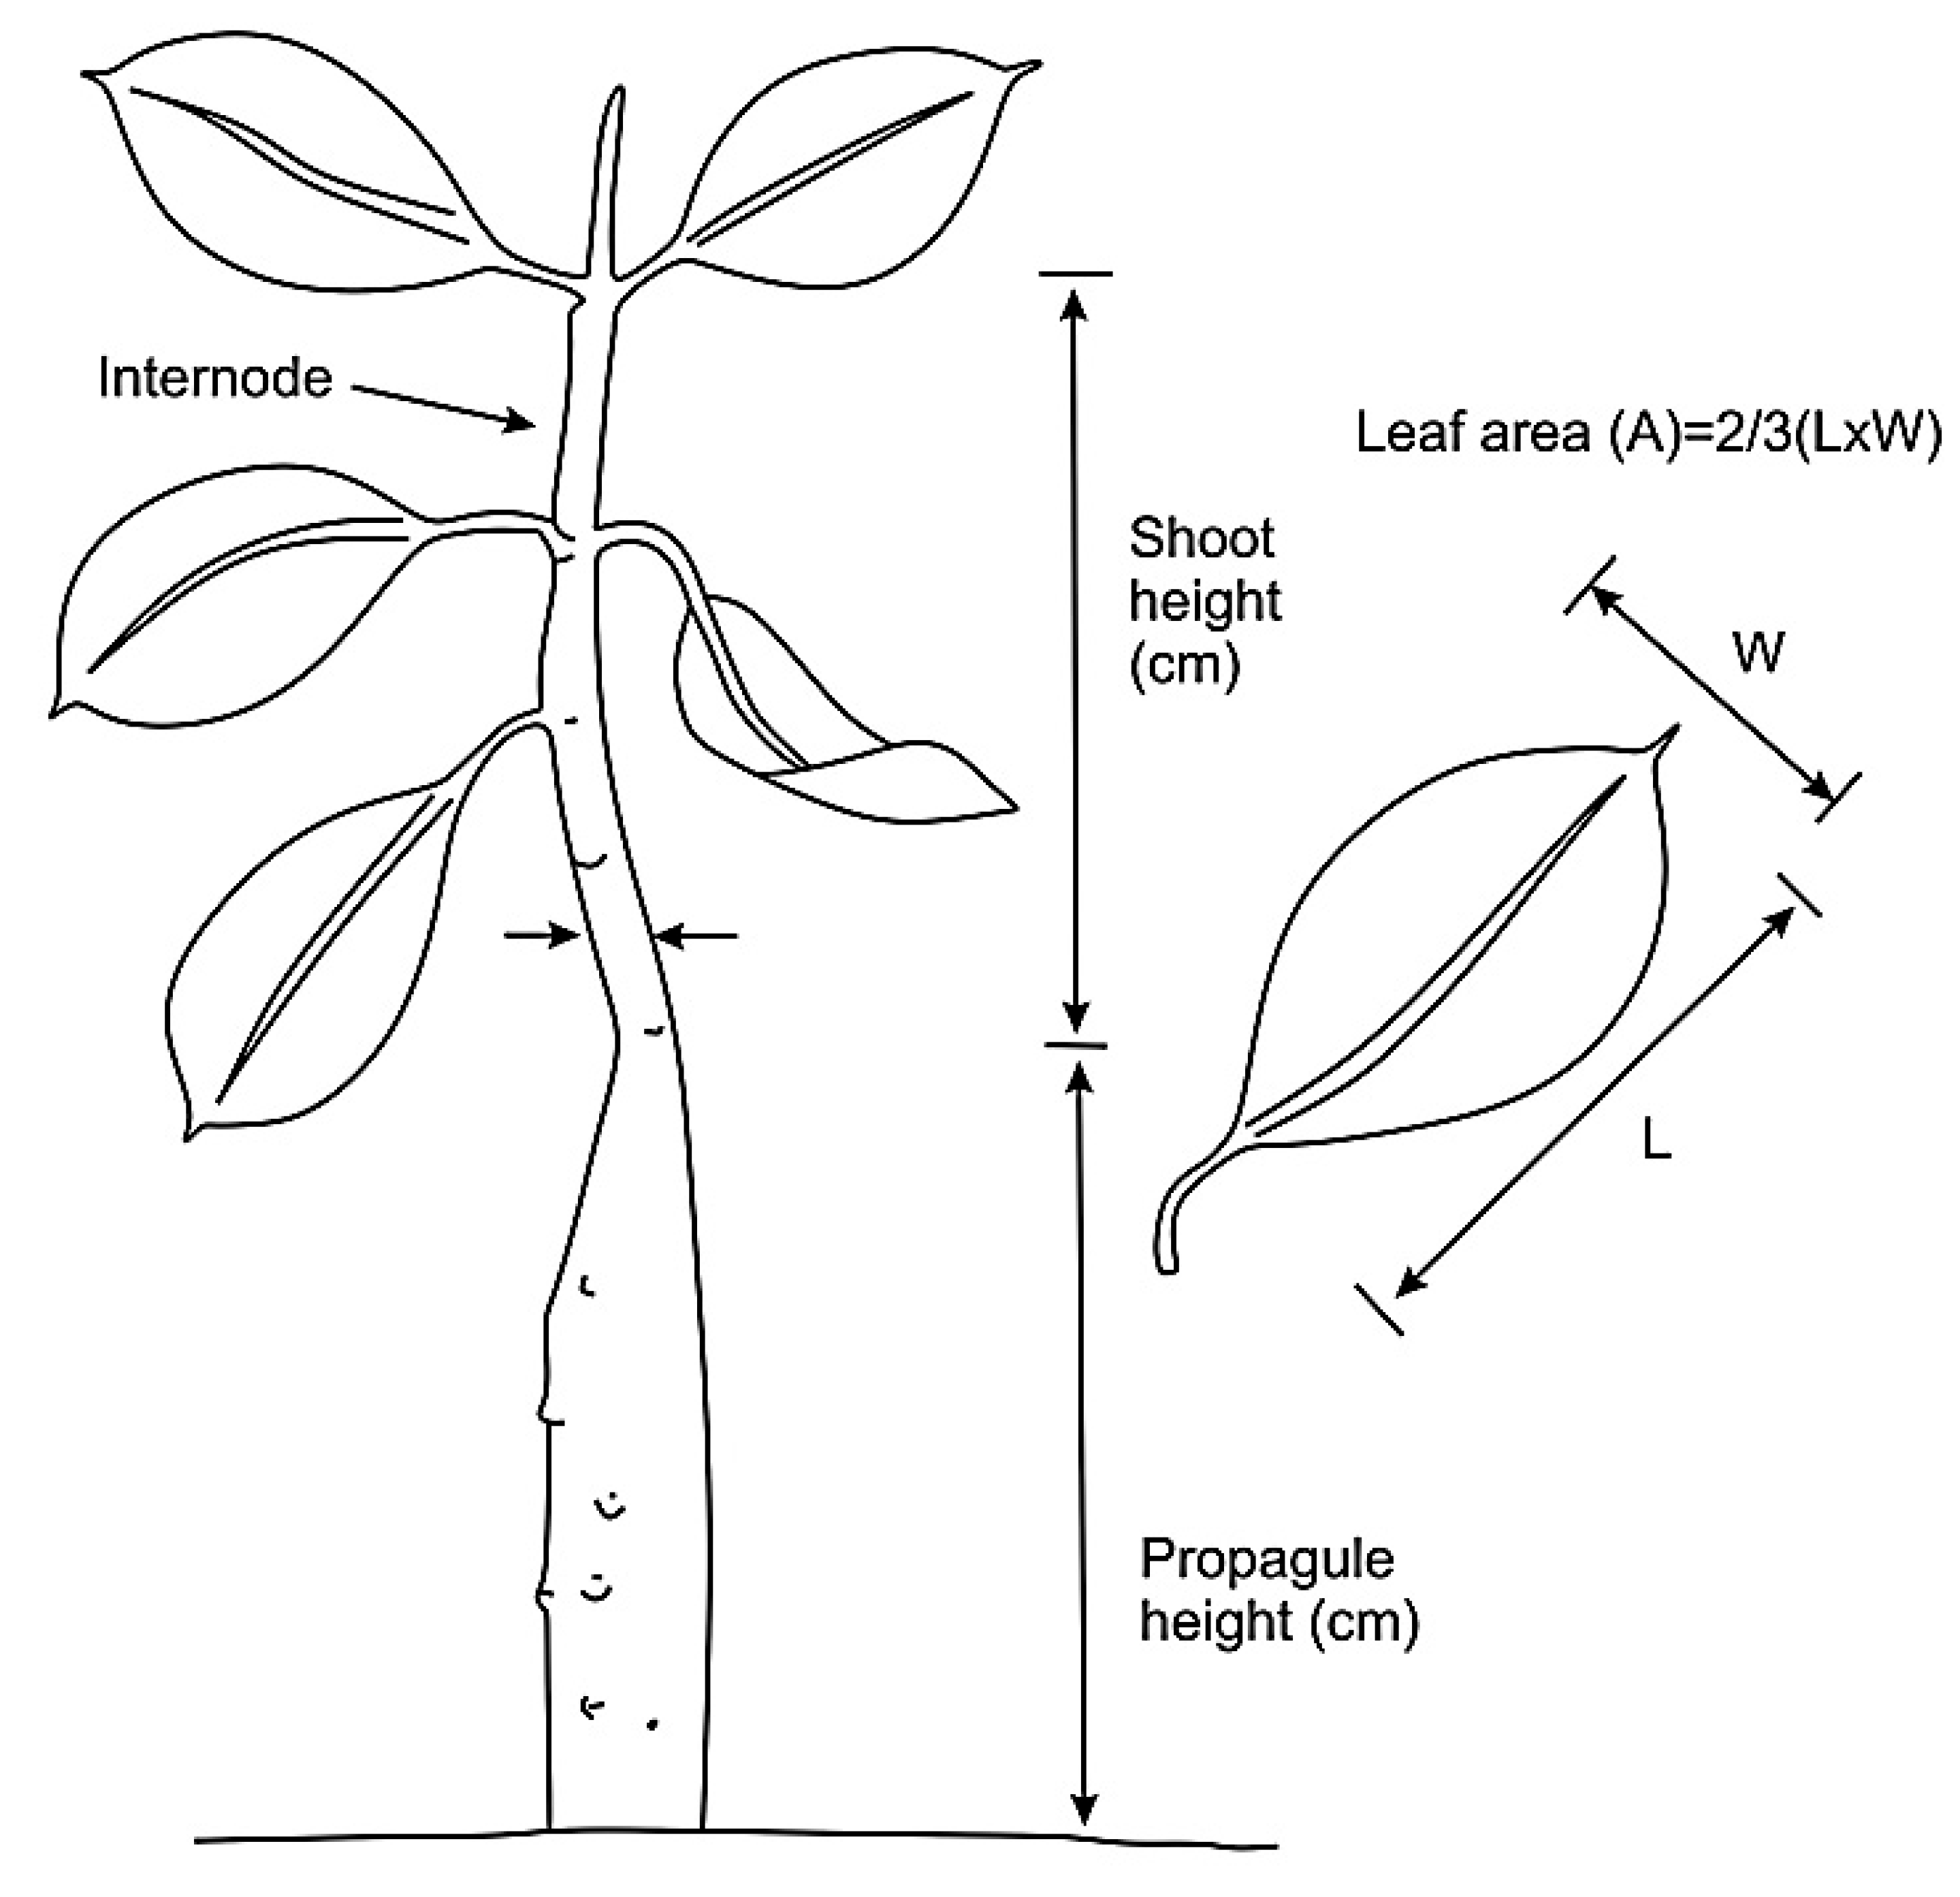
2.4.5. The Monitoring of Growth Performance

The monitoring of planted mangrove propagules was done monthly for eight (8) months by collecting survival and growth data using the protocol in the UNEP’s guidelines on mangrove ecosystem restoration for the Western Indian Ocean Region [47]. The following vegetation data were generated (Table 1): shoot height (cm), number of leaves, number of internodes, number of branches, and leaf area (Figure 4).

2.5. Data Analysis

Statistical analysis was done using the SPSS version 26.0, GRADISTAT computer program, and Microsoft Excel 2016. The tabular and graphic presentations of data allowed ease of visualization. The normality of the data was tested using the Kolmogorov–Smirnov test and Shapiro–Wilk test and data were normalized where necessary to meet parametric assumptions. Data on survival rates were subjected to repeated measures of Analysis of Variance (ANOVA) followed by a Post-hoc Tukey HSD (p < 0.05) to compare means among treatments and blocks. The bamboo and control groups were not included in the growth performance analysis due to the low survival rates (high mortality), as the small sample size would compromise the results of the study. The measures of soil properties were also subjected to ANOVA followed by a Tukey HSD Post-hoc to realize variations in depth.

3. Results

3.1. Biophysical Characteristcs

Soils in the degraded areas of Gazi are characterized by high proportions of sand accounting for 96.97 ± 0.17% with very small proportions of silt and clay (3.03 ± 0.17%). No clear pattern is depicted in percentage sand, as well as clay and silt, with depth (Table 2). However, the differences in the values across the depth intervals are not statistically significant (p > 0.05). The average bulk density across the different depth intervals ranged from 0.065 to 0.335 g/cm3 (mean: 0.255 ± 0.007 g/cm3). Bulk density varied significantly with depth (p < 0.05) as values decreased with increasing depth. The proportions of soil organic matter (SOM) ranged from 5.948 to 7.315% (mean: 6.334 ± 0.24%), while those of soil organic carbon (SOC) ranged from 5.358 to 5.926% (mean: 5.519 ± 0.10) with no significant differences between the depth intervals (p > 0.05).

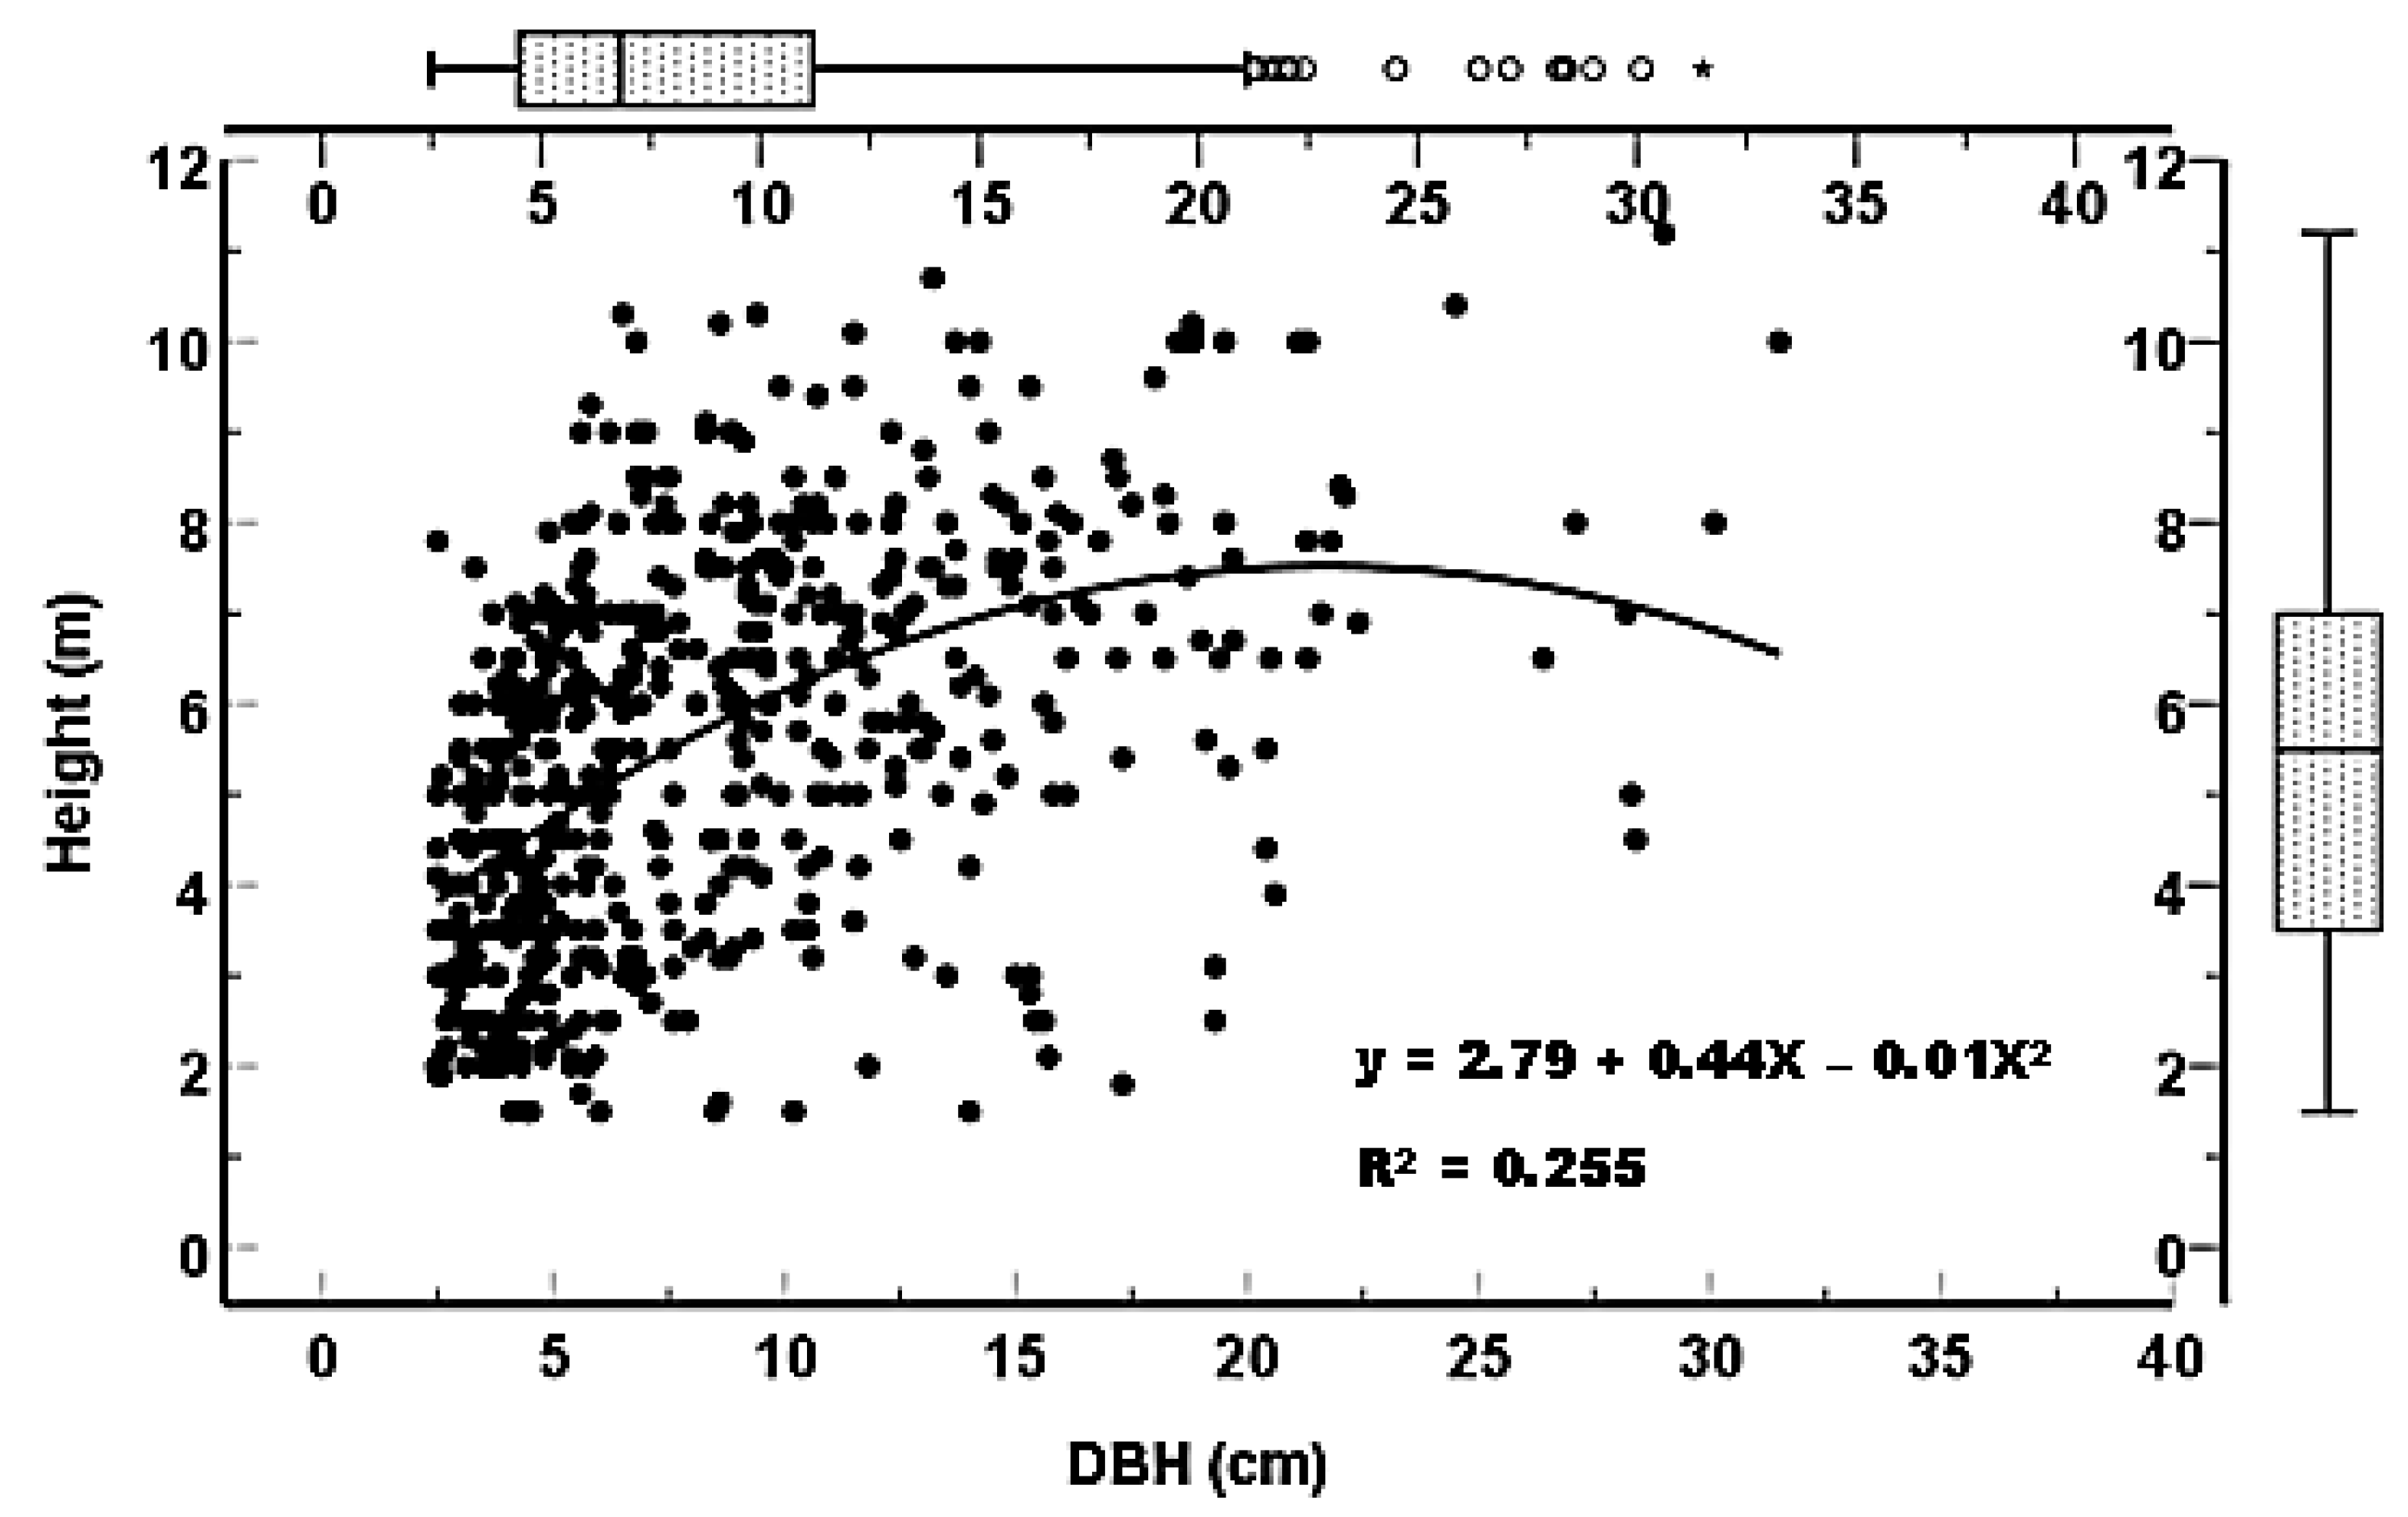
3.2. Mangrove Forest Structure

Three species of mangroves were encountered in the project site. Based on their importance value (IV) index, the most dominant species in the site is Sonneratia alba (IV = 293.23%), followed by Rhizophora mucronata (16.25) and Avicennia marina (13.25) (Table 3).
The overall stand density of the mangroves in the study site at Gazi was estimated at 2659 ± 460.13 stems ha−1 (range: 500–10,000 stems ha−1), with mean basal area, tree height, and DBH of 21.06 ± 2.45 m2 ha−1 (range: 3.28–39.96 m2 ha−1), 5.49 ± 0.09 m (range; 1.5–11.2 m), and 8.52 ± 0.23 cm (range; 2.5–31.5 cm), respectively. Figure 5 shows a scattergram of the heights against stem diameters of mangroves in Gazi. As expected, there is a positive linear correlation between stem diameter and height. However, regression analysis reveals that it is a low positive correlation (R2 = 0.255). Some 50% of trees in the study sites had diameters and height range from 4.5 to 11.5 cm and 3.5 to 7.0 m, respectively (Figure 5).

3.3. Trial Mangrove Growing Experiments in a High-Energy Site of Gazi

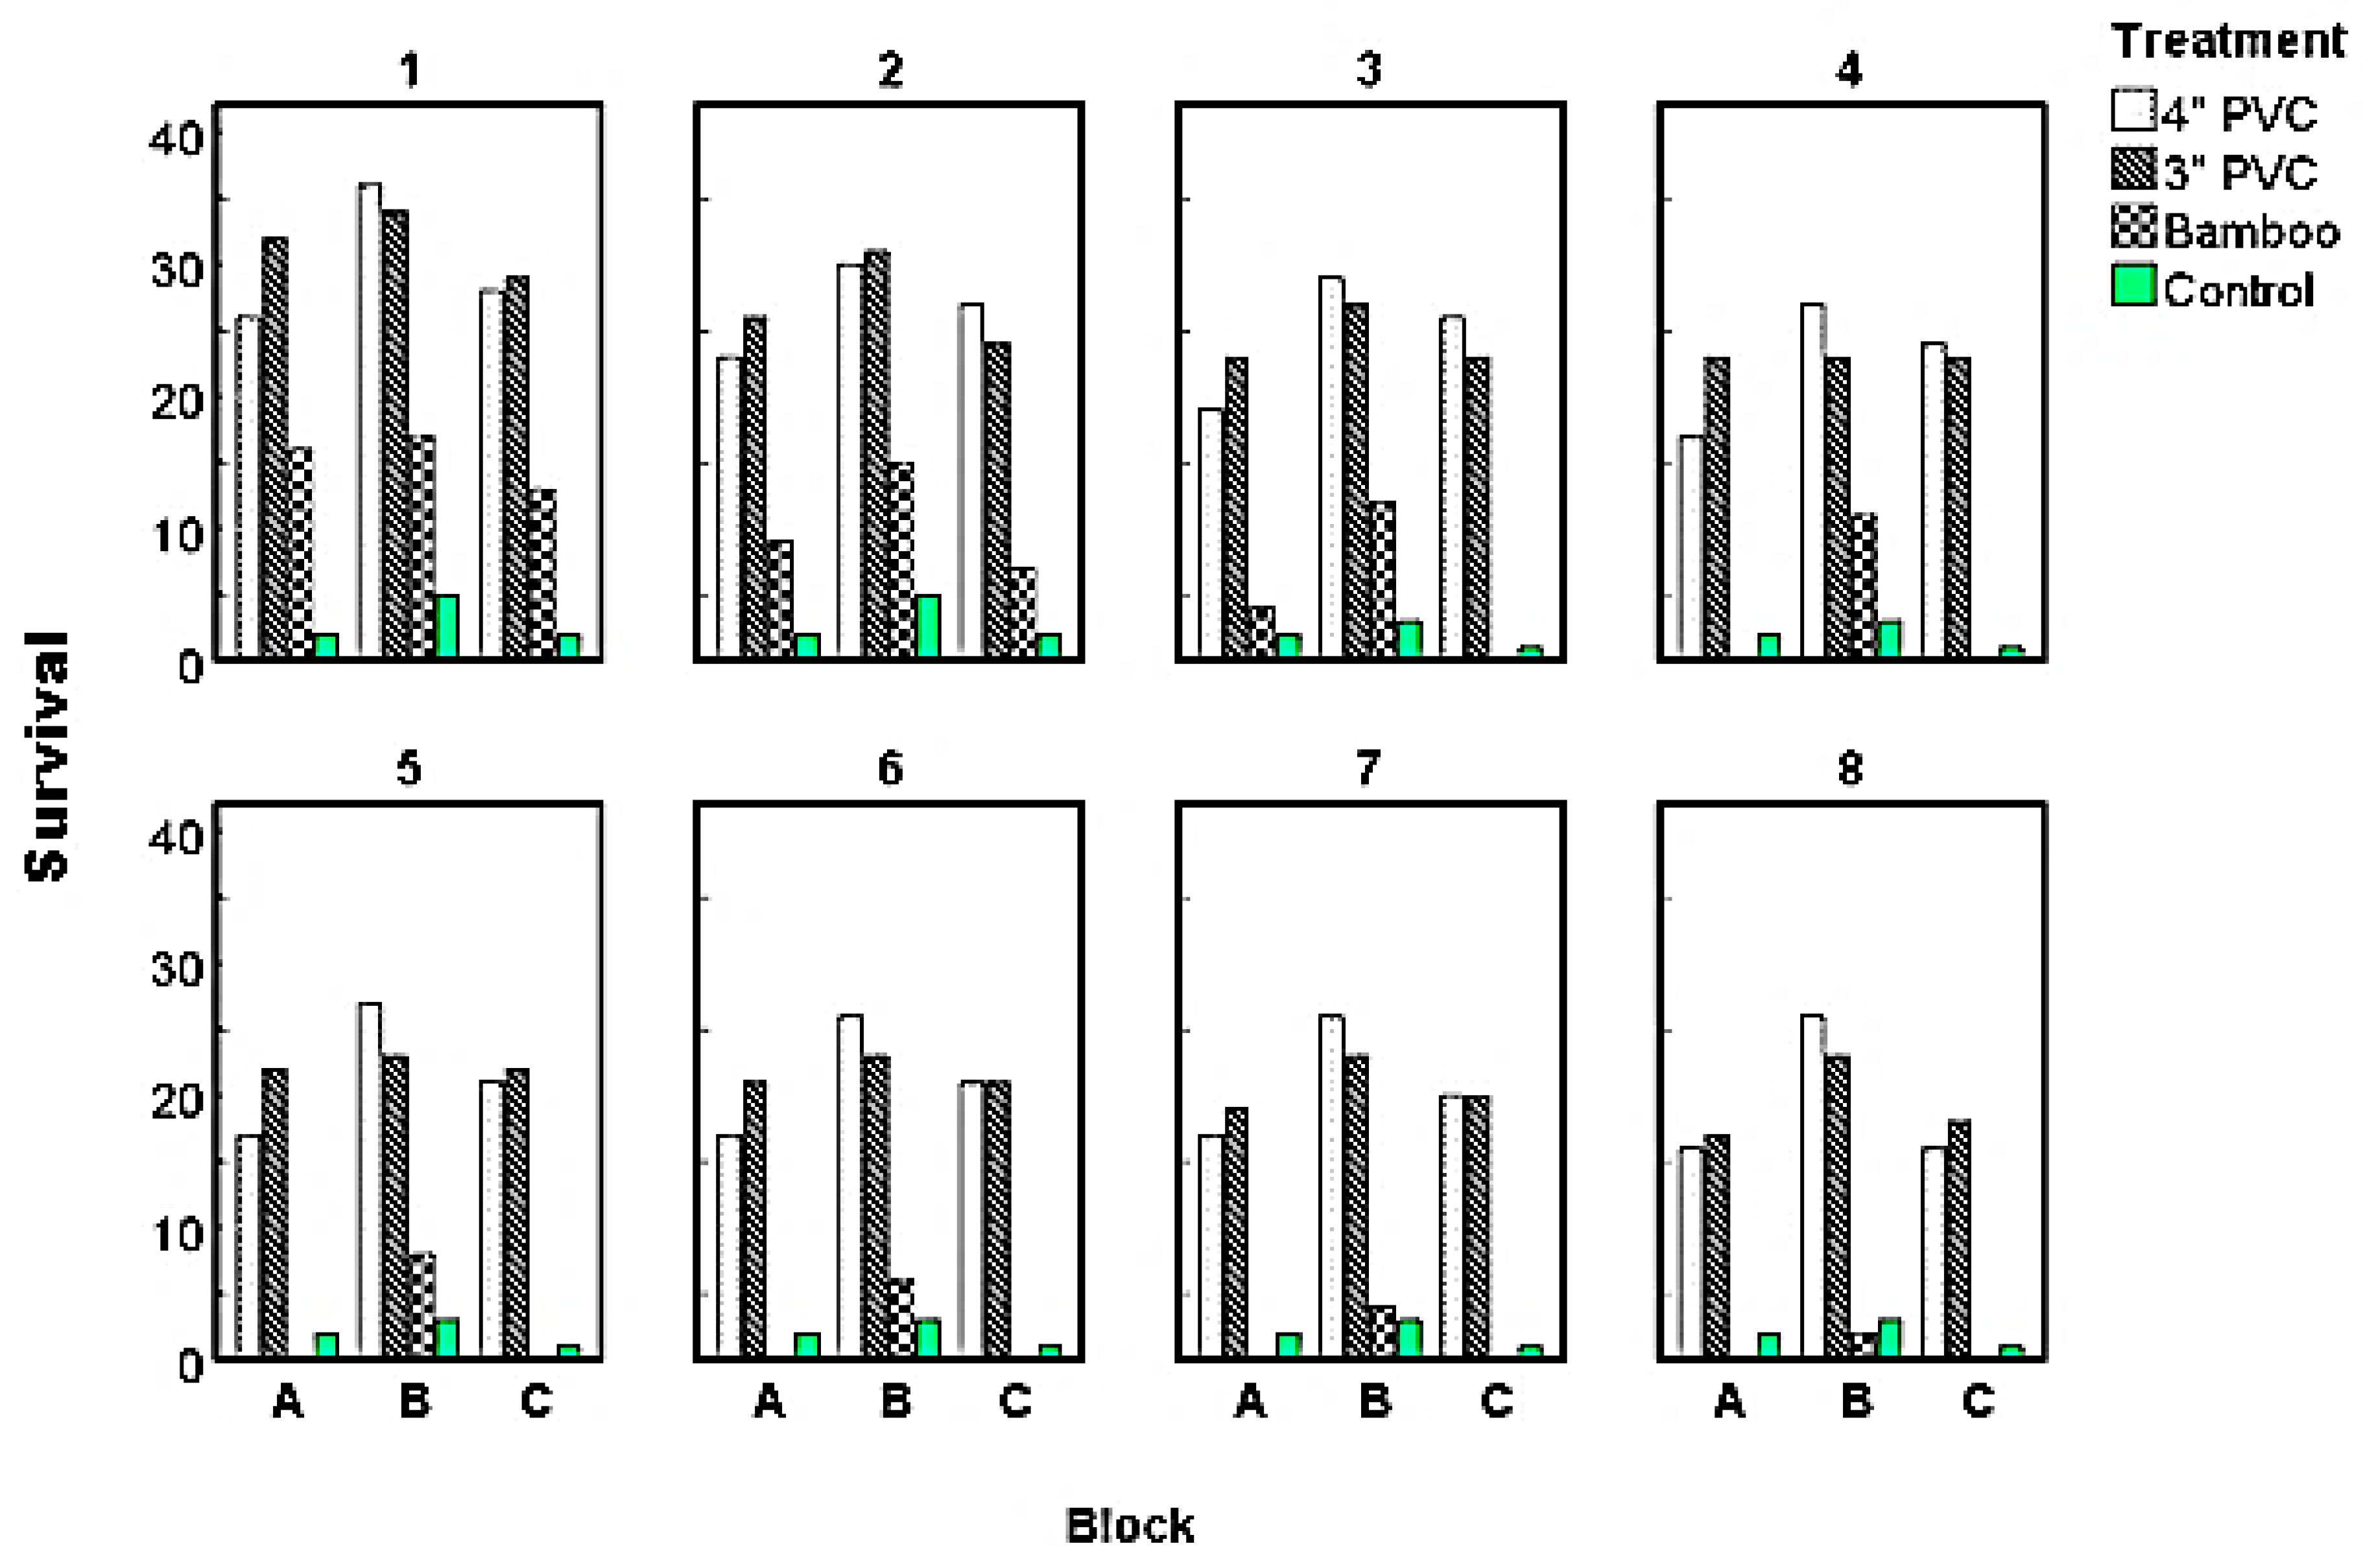
3.3.1. The Survival Rates of the Replanted Mangroves

Three months after planting (the last month at which mangroves encased within bamboo poles were present), Block A exhibited survival rates ranging from two to twenty-three (4–52%). Among these, those encased in 3” PVC pipes displayed the highest survival rate at 52%, followed by those in 4” PVC at 42%, and bamboo pipes at 9%. The control group, consisting of directly planted seedlings, recorded a 4% survival rate during the same period. At the end of the eighth month, survival rates varied from two to seventeen (4–38%). Mangroves in 3” PVC achieved the highest survival rate at 38%, followed by those in 4” PVC at 36%, and the directly planted seedlings at 4% (Figure 6).
Eight months after planting, mangroves grown in Block B recorded survival rates ranging from two to twenty-six (4–58%), with those established in 4” PVC recording the highest survival rate of 58%, followed by those in 3” PVC (51%), and bamboo pipes (4%). Over the same growth period, directly planted propagules had a survival rate of 7% only (Figure 6).
Mangroves sown in Block C had survival rates ranging from two to twenty-seven (4–60%) two months after planting (the last month at which mangroves encased within bamboo poles were present), with seedlings encased in 4” PVC having the highest survival (60%), followed by those encased within 3” PVC (53%), and bamboo pipes (16%). The directly planted propagules had the lowest survival of 4%. At the end of the experiment (8 months after planting), survival rates ranged from 2 to 40% (1–18), with mangroves planted within 3” PVC recording a higher survival rate of 40% followed by those planted in 4” PVC (36%), and the control with a 2% survival (Figure 6).
Overall, survival rates varied significantly between treatments (F = 153.962, p < 0.05) (Table 4). Mangroves encased in 3” and 4” PVC recorded significantly higher survival rates (43%) compared to the bamboo-grown (1%) and control group (4%) (p < 0.05). No significance difference in survival was recorded between 3′’ and 4′’ PVC encasements (p = 0.992). Survival rates for bamboo grown seedlings varied significantly from all other treatments (p < 0.05). Similarly, survival rates for the control group varied significantly from PVC and bamboo encasements (p < 0.05). Post hoc test results showing comparison in survival rates between treatments are shown in Appendix A, Table A1. There were no significant variations in survival rates between blocks (F = 0.5, p = 0.608) (Table 4). Seedlings planted in Block B recorded a mean survival rate of 16.78 ± 2.0%, followed Block C (15.12 ± 2.05%) and then Block A with 14.07 ± 1.8%.

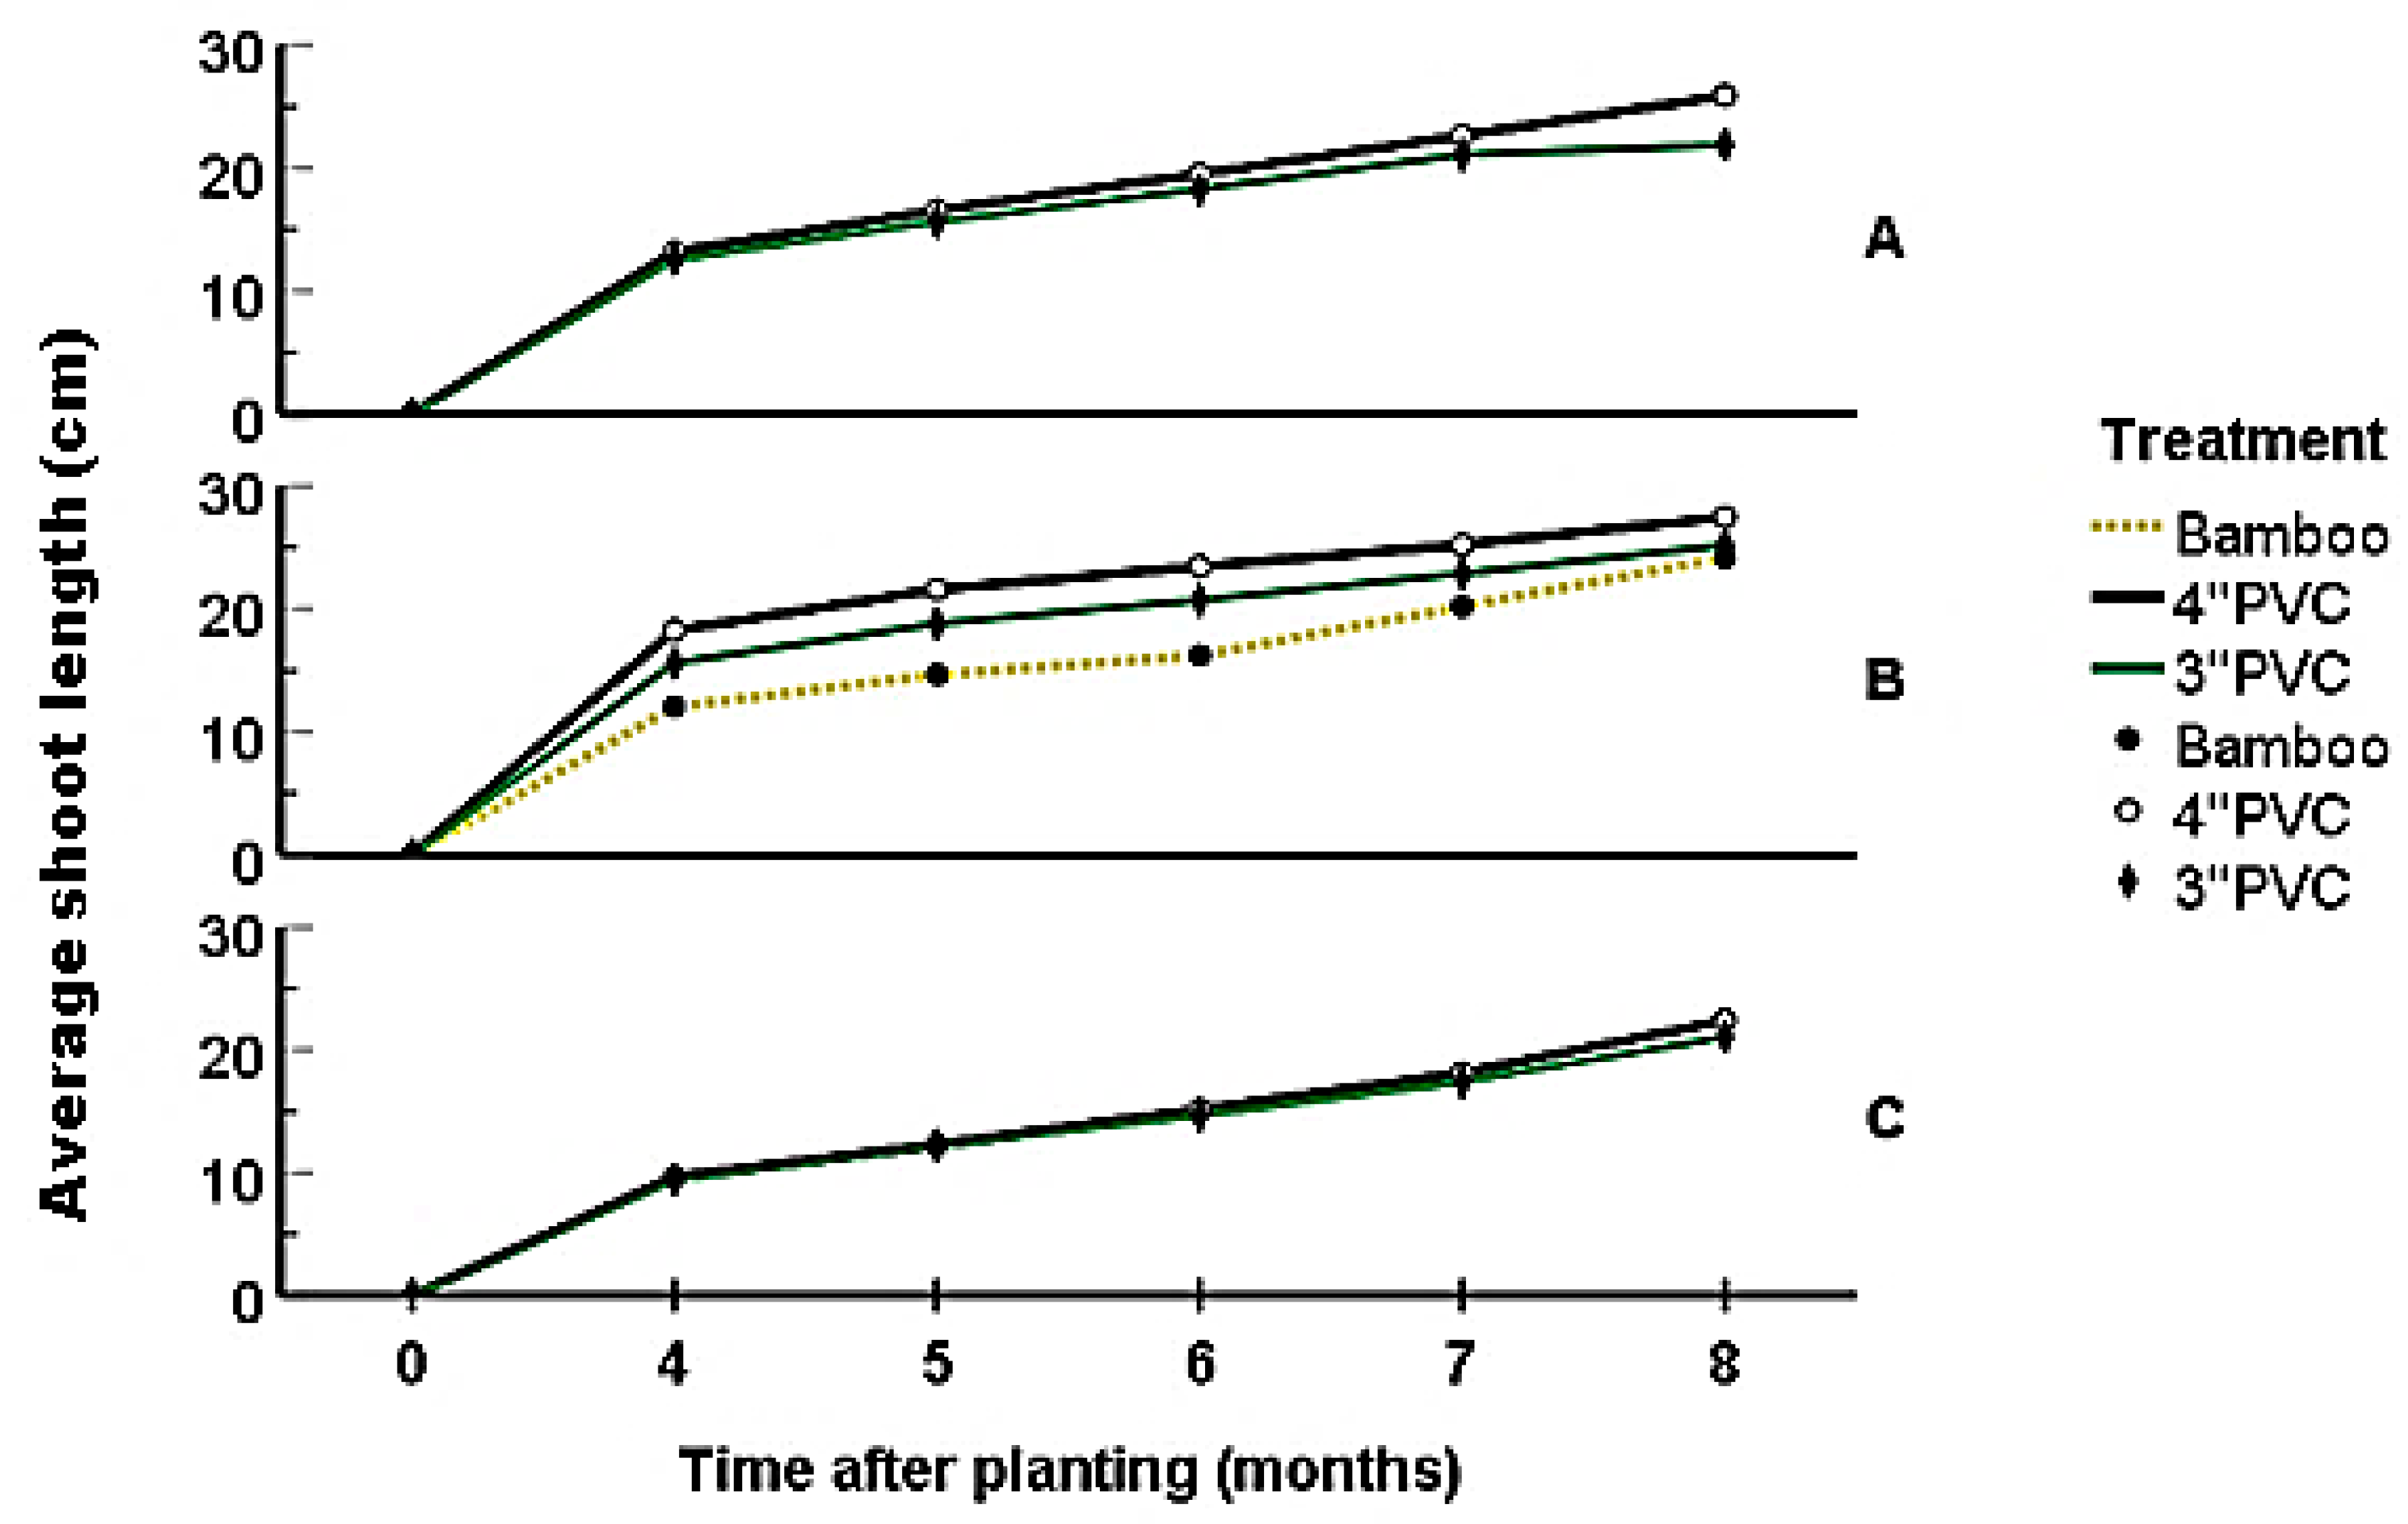
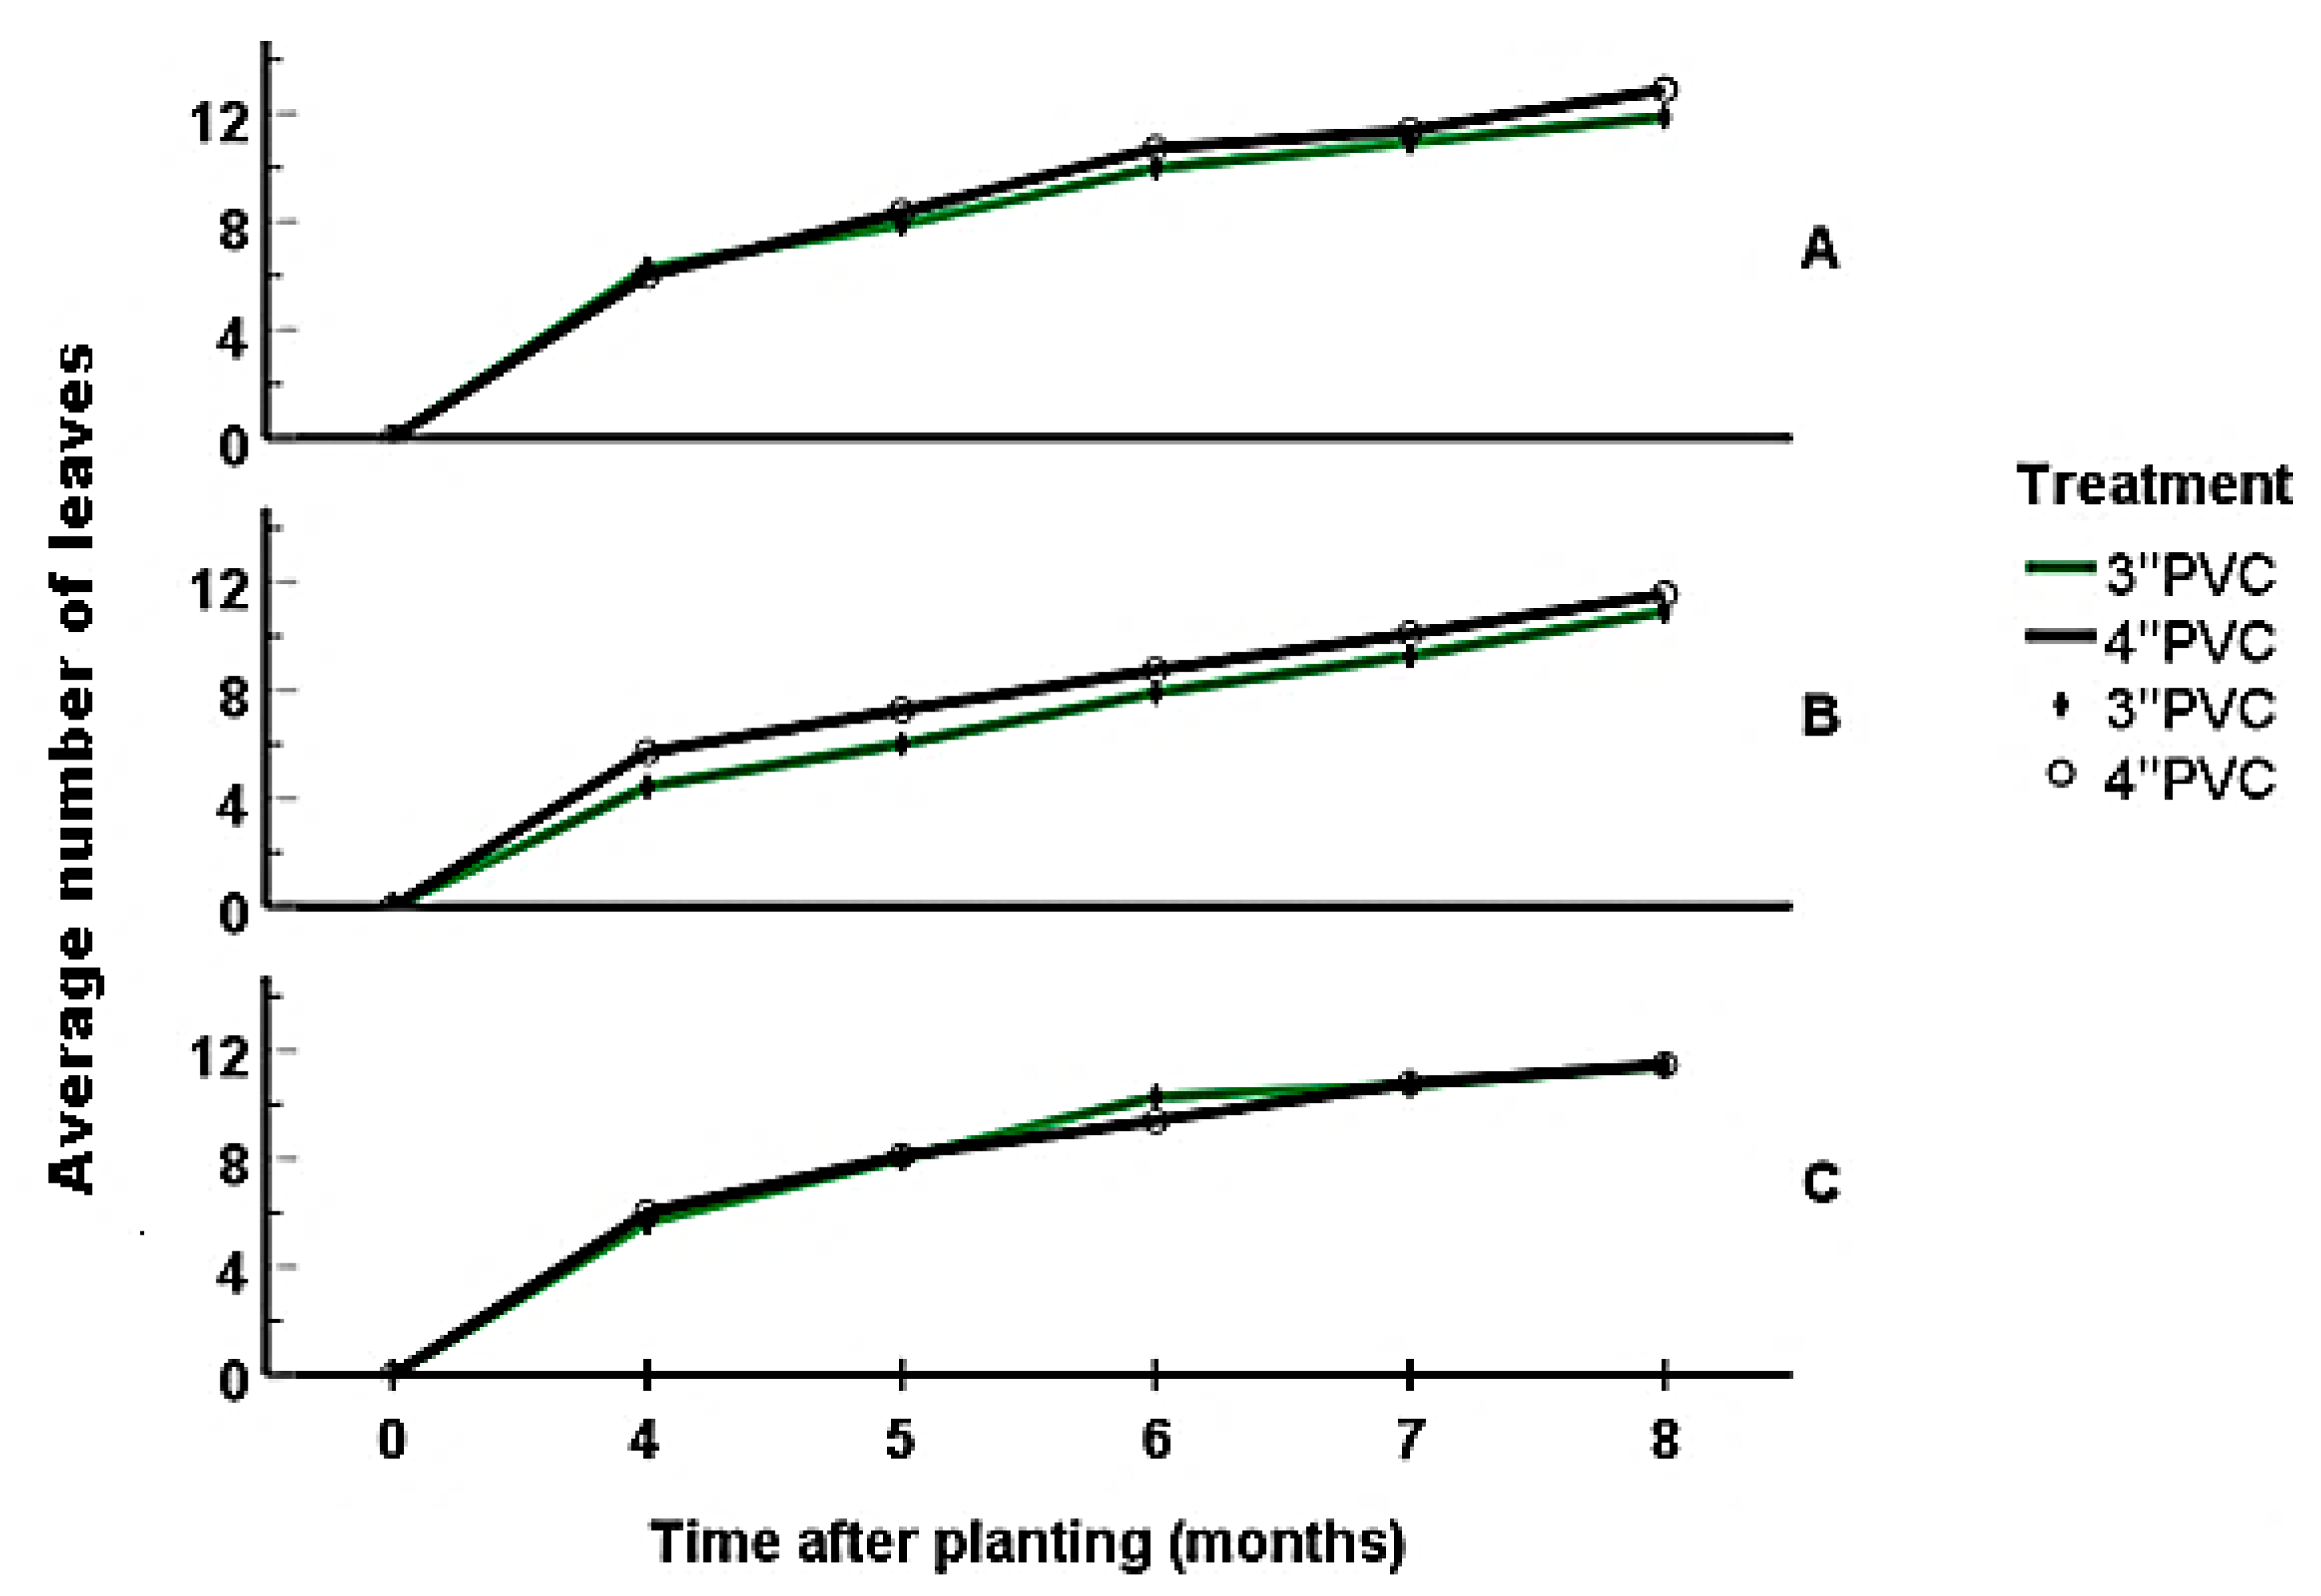
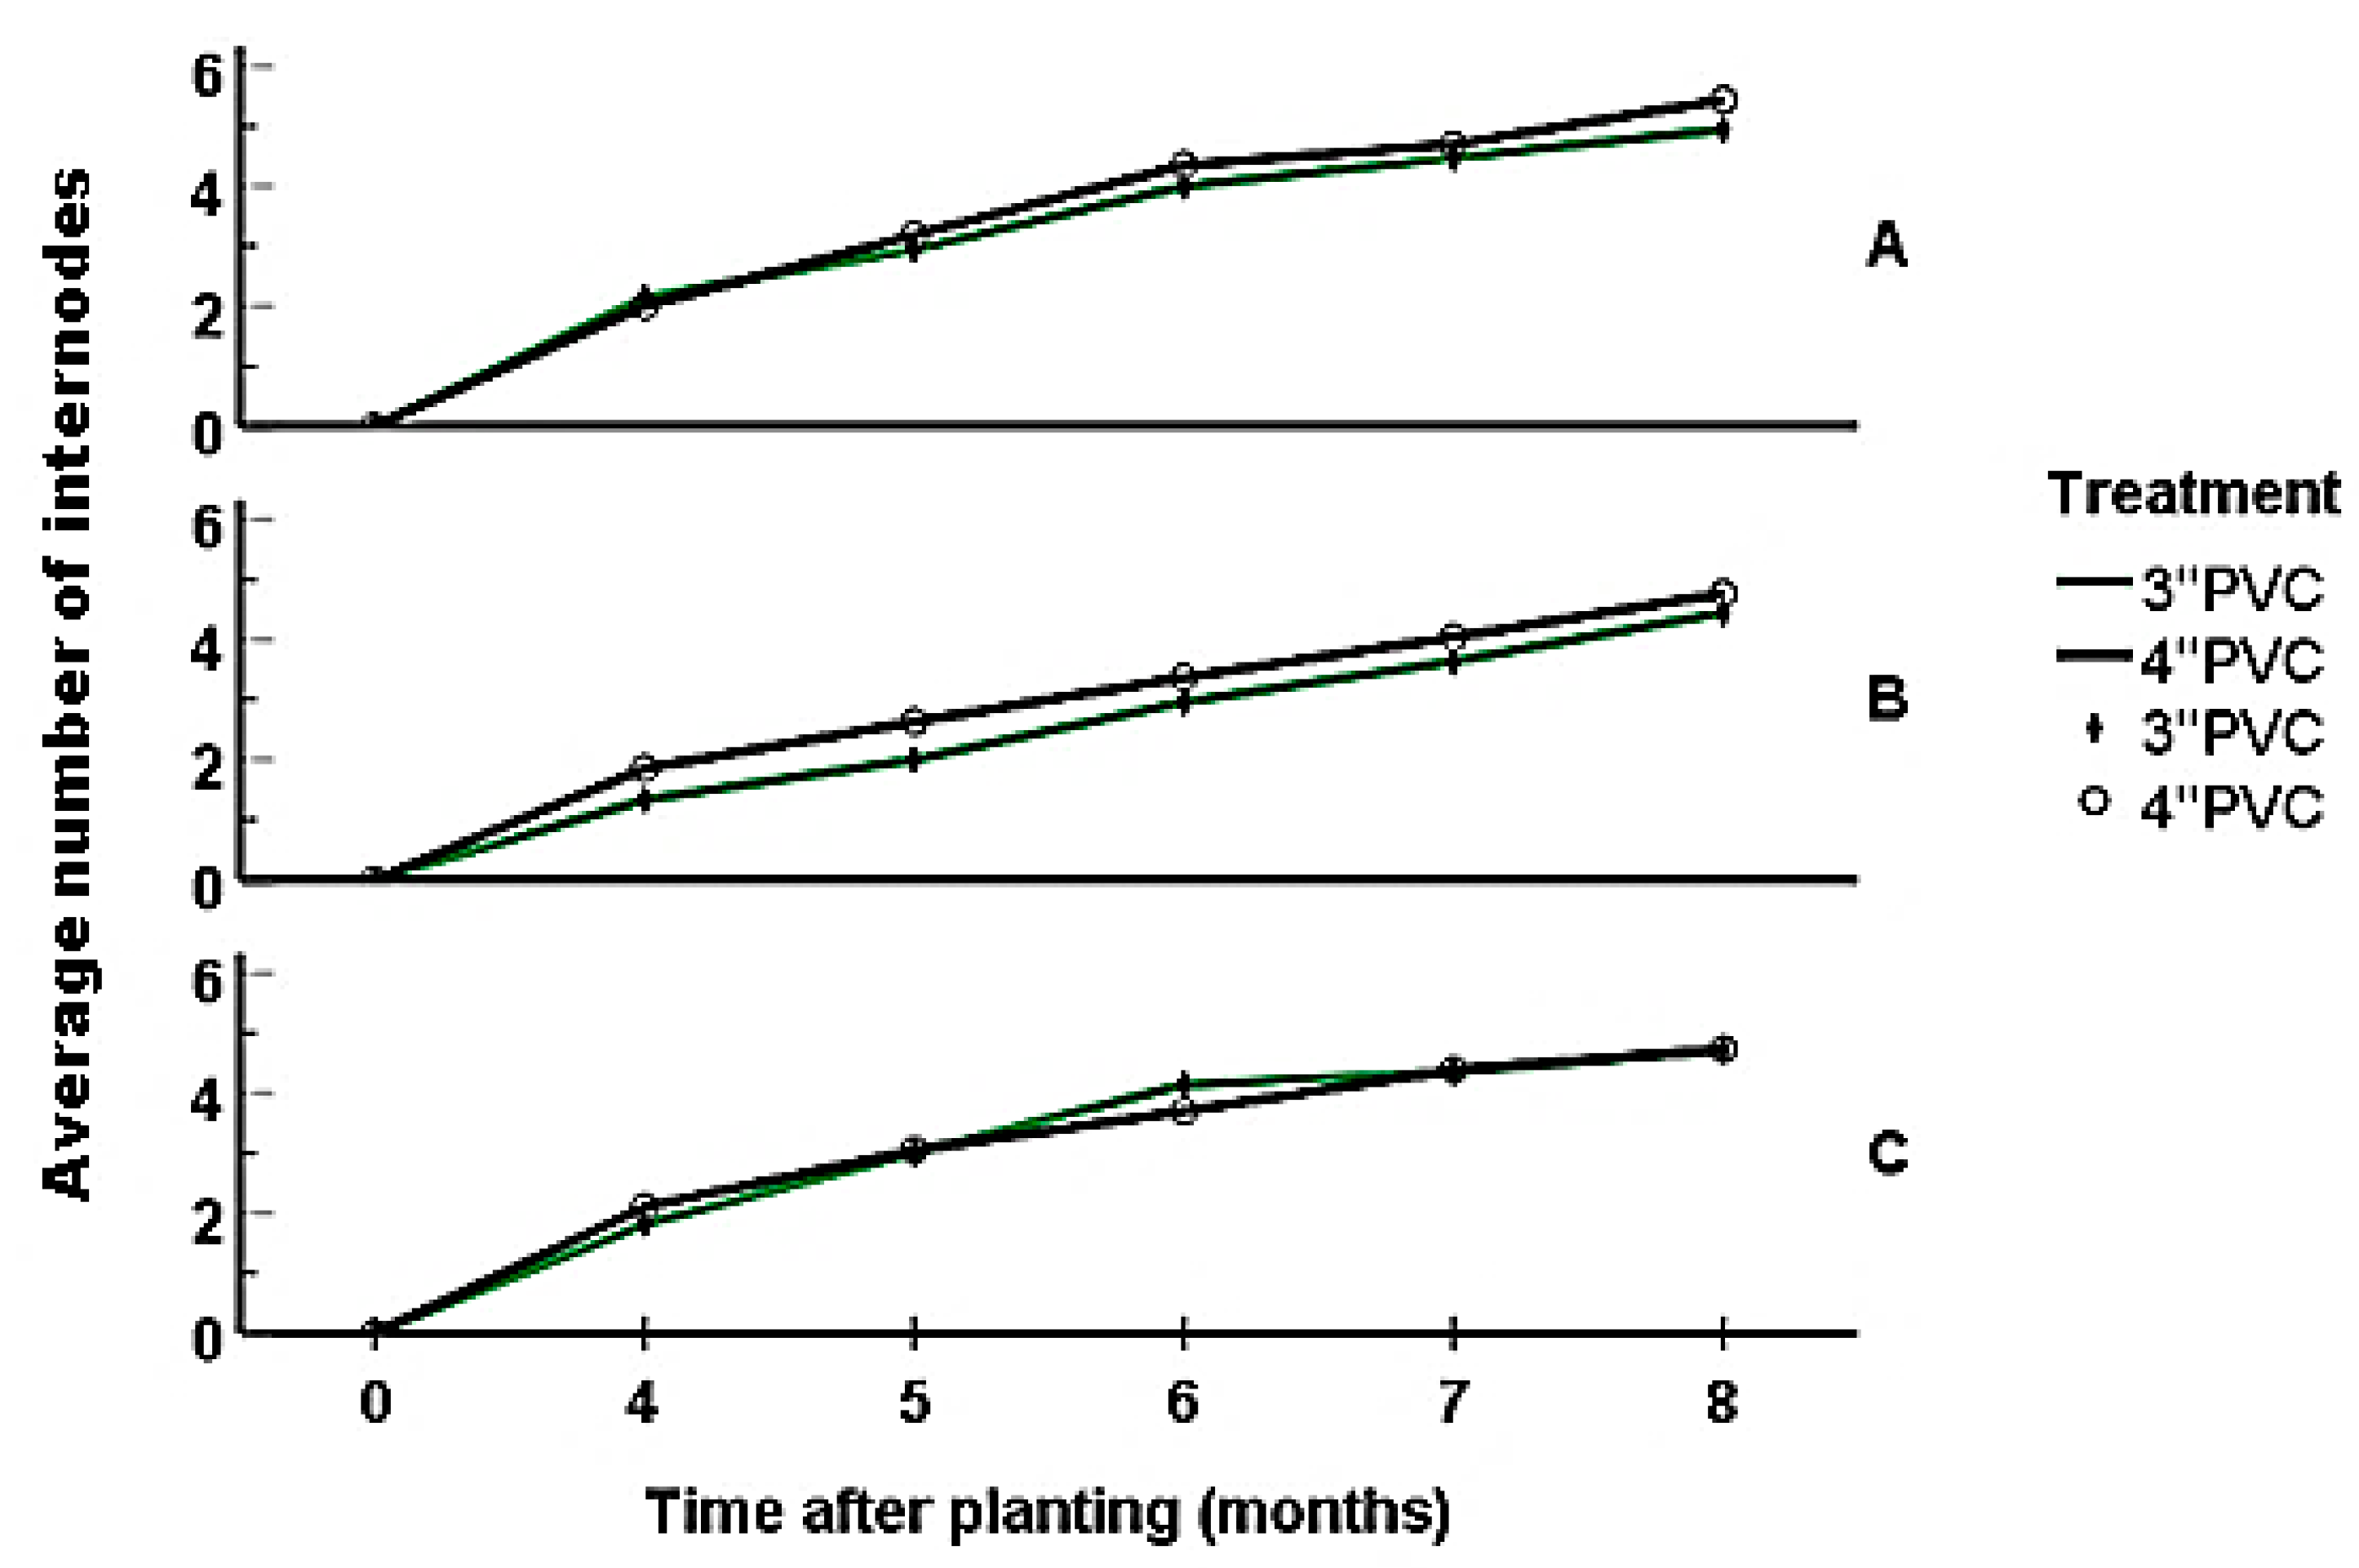
3.3.2. The Growth Performance of the Replanted Mangroves

Four months after planting, seedlings growing in Block A had attained a shoot length of 7.3–22.2 cm (12.82 ± 0.52), with 4–8 leaves (6.15 ± 0.27) and 1–3 internodes (2.08 ± 0.13). At six months, seedlings had a shoot length ranging from 11.8 to 28 cm (18.83 ± 0.62), with 8–12 (10.31 ± 0.2) leaves and 3–5 (4.5 ± 0.1) internodes. By the eighth month, the seedlings’ shoots ranged from 15.5 to 37.2 cm (mean: 25.38 ± 0.83), with those encased in 4’’ PVC and 3’’ PVC attaining a mean of 25.91 ± 1.43 cm and 24.88 ± 0.90 cm, respectively. The number of leaves and internodes ranged between ten and fourteen (12.36 ± 0.2) and four and six (5.18 ± 0.1), respectively, with seedlings encased in 4’’ PVC recording an average of 12.88 ± 0.32 (10–14) leaves and 5.44 ± 0.16 (4–6) internodes while those encased in 3′’ PVC had 10–14 (11.88 ± 0.21) leaves and 4–6 (4.94 ± 0.10) internodes (Figure 7, Figure 8 and Figure 9). There were no significant statistical differences in vegetation attributes among seedlings grown in 3’’ and 4’’ PVC (p > 0.05).
By the fourth month of growing, seedlings planted in Block B had attained a shoot length ranging from 4.9 to 24.3 cm (16.36 ± 0.63), with 2–8 (5.12 ± 0.21) leaves and 1–3 (1.63 ± 0.10) internodes. In six months, the shoot length was ranging between 12.4 and 33 (21.58 ± 0.71), while the number of leaves and internodes ranged between four and twelve (8.36 ± 0.21) and one and five (3.18 ± 0.11), respectively. On reaching the age of eight months, seedlings had attained a shoot length of 26.33 ± 0.67 (15.1–38.1), 8–14 (11.25 ± 0.19) leaves, and 3–6 (4.62 ± 0.10) internodes. Seedlings encased in 4” PVC had an average shoot length of 27.49 ± 0.86 cm, 11.54.88 ± 0.28 leaves, and 4.77 ± 0.14 internodes, while those encased in 3” PVC recorded an average of 25.21 ± 1.08 cm in shoot length, 10.91 ± 0.25 leaves, and 4.45 ± 0.13 internodes (Figure 7, Figure 8 and Figure 9). The differences recorded among seedlings grown in 3′’ and 4′’ PVC were statistically insignificant (p > 0.05).
At four months of growing, seedlings in Block C attained a mean shoot length of 13.28 ± 0.42 cm (range: 4.3–18), 5.81 ± 0.27 (2–8) leaves, and 1.95 ± 0.13 (1–3) internodes. After six months, seedlings attained a shoot length of 8–24.5 cm (18.76 ± 0.46), with 4–12 (9.86 ± 0.21) leaves and 1–5 (3.93 ± 0.1) internodes. By the eighth month, the shoot length reached 24.73 ± 0.48 cm (range: 12.3–35.3 cm), with 11.45 ± 0.22 (8–14) leaves and 4.73 ± 0.11 (3–6) internodes. Seedlings grown in the 3’’ PVC recorded an average shoot length of 21.09 ± 1.17 cm (range: 12.6–31.5 cm), with 11.44 ± 0.27 leaves (range: 10 to 14) and 4.72 ± 0.14 internodes (range: 4 to 6). In contrast, those enclosed within the 4’’ PVC achieved a shoot length of 22.39 ± 1.42 cm (range: 12.3 to 35.3 cm). These seedlings also displayed eight to fourteen leaves (mean: 11.47 ± 0.36) and three to six internodes (mean: 4.73 ± 0.18) (Figure 7, Figure 8 and Figure 9). The variances observed between the two treatments were not statistically significant (p > 0.05).
At the conclusion of the experiment, the growth performances of mangroves enclosed in 3’’ and 4’’ PVC had statistically insignificant differences as indicated in Table 5 (p > 0.05).
Leaf area per plant for seedlings encased in 3’’ and 4’’ PVC varied within the ranges of 41.33–149.29 cm2 and 41.79–146.29 cm2, respectively, at the six-month mark. In Blocks A, B, and C, leaf area ranged from 47.20 to 149.29, 48.10 to 142.91, and 41.33 to 145.51, respectively. On average, considering all blocks together, the leaf area per plant was 100.48 ± 2.05 (with a range of 41.33–149.29).

4. Discussion

4.1. Sediment Characteristics

Sediment particle size distribution is among the most critical physical properties that affect soil properties in regards to erosion [76,77]. The very low amount of percentage silt-clay (3.03 ± 0.17) in sediment compared to those of forested sites (38.38%) in Gazi [78] is an indication of a highly degraded site with low vegetation cover. The proportions of fine sand (53.68 ± 1.35%) are comparable to those of non-reforested sites in Gazi (58.85 ± 6.11%) [78], further indicating a situation of a degraded site. The relatively small amounts of SOM (6.33 ± 0.24%) and SOC (5.52 ± 0.10%) in the sediment compared to values obtained in forested Gazi sites (38.38, 31.04, 17.38%) by Kairo et al. [78] suggests near zero sediment accretion. Mangrove vegetation enhances the build-up of SOM by accreting sediments [78]. Mangrove vegetation boosts sediment trapping and settlement by reducing the speed of water movement [20,79]. With the high proportions of sand (96.97 ± 0.17%) in the sediments, there is a high possibility of decreased soil stability which increases the risk of erosion [80,81] by high tides and other extreme weather events.
Soil bulk density is considered as the soil’s dry weight per unit volume and it indicates soil compaction. Normally, as the soil depth increases, bulk density is known to increase [82] as the weight of the top layer sediments effect soil compaction [83]. However, the results of this study indicate an exact opposite situation where bulk density significantly decreases with increase in soil depth (Figure 10). We would imagine a situation where the top layers of mangrove sediment have experienced physical compaction due to the action of waves, tides, and other forms of disturbance. Such a situation could lead to increased bulk density in the shallow layers as the impact of compaction would diminish with depth, resulting in lower bulk density in deeper layers.

4.2. Mangrove Forest Structure in Gazi

The designated mangrove planting area in Gazi is dominated by Sonneratia alba, thus the higher importance value (IV) as expected. The species naturally occurs in the low lying intertidal areas, in the inundation Class 1 of Watson [84]. This fringing forest is heavily fragmented due to mangrove harvesting for fuelwood in the 1970s [41] that left blank contiguous areas [42], leading to the moderately low stand density. Other mangrove species in the zone are Rhizophora mucronata and Avicennia marina, which exist as both adults and juveniles [63,78]. The presence of mature established species of Rhizophora mucronata in the study area prompted us to use it in the restoration experiment (Figure 11).
Adult Rhizophora species have prop roots for anchorage and breathing [85]. The rooting systems form a strong mesh system that enables them to create wave barriers [86]. As such, Rhizophora have high proficiency in wave attenuation compared to other mangroves species due to the complexity of the root system, which creates greater friction to incoming waves and thus a higher drag coefficient [86,87,88]. This is critical for the designated planting area as it is highly exposed to wave action. The rooting system also accretes sediments and facilitates the natural recruitment of indigenous species. The genus Rhizophora is also known to be a land-builder through sediment accretion and stabilizations [89], thus the potential in revitalizing eroded shorelines and keeping pace with rising sea levels [16,90,91]. As such, the successful establishment of the species in the site will play a critical role in enhancing the restoration of the Gazi shoreline.
The low positive association (R2 = 0.255) between the stem diameters and heights of the mangroves in the degraded Gazi site could probably be a result of the challenging environmental conditions, including sedimentation and exposure to high wave action, that negatively impact the growth patterns of mangrove trees. This might lead to disparities in stem diameter and height thereby weakening the correlation. Such weak correlations have been reported elsewhere, for instance in Mombasa and Mtwapa, Kenya [92], where the mangrove ecosystem is predisposed to human and environmental stressors [93,94]. Overall, conditions along the shoreline of Gazi Bay depict a picture of a highly degraded and exposed mangrove site. This validates the need for alternative restoration approaches to enhance restoration success and ensure that communities are protected as the degraded fringing mangrove belt stands between the land and the sea.

4.3. The Survival and Mortality of the Planted Mangroves

In most mangrove restoration projects, survival rates are used as one of the common indicators for success [48,49]. The results of this study reveal significant differences in survival rates among treatments. Significant variations were particularly noted between the PVC-encased and bamboo-encased and between the PVC-encased and control, as well as between the bamboo-encased and control. There were no significant differences in survival rates between the different PVC encasement sizes. Major losses occurred in the first two months following planting due to tidal washing. This outcome is anticipated in the pre-establishment stage when seedlings have not yet firmly taken root. In the first month, the highest mortality (94%) was recorded for the conventionally planted propagules, which is expected since these propagules had no protection, and thus were highly exposed to strong wave energy [95]. High wave energy has been deemed to be a stressor that limits the success of mangrove establishment [96]. Similar results were observed in high energy mangrove planting areas of Florida [97]. Results also align with a study by Kairo et al., [46] that demonstrated up to 90% mortality for mangrove seedlings exposed to high energy. High mortality for propagules encased in bamboo tubes was also occasioned by washing by tides as a result of the small diameter tube that could not hold enough soil, thus providing a weak support system. This contrasts with the findings of Kent & Lin [98] where the mortality of seedlings encased in bamboo was occasioned by lack of sufficient light. This is so because in the current study seedling were not fully encased, as was the case with Kent and Lin [98], rather, seedlings were set at an elevation that allowed enough light to get into the seedlings.
Survival rates were highest in propagules installed in 3” and 4” PVC tubes. Despite the differences in PVC diameters, there were no significant differences (p > 0.05) in survival rates across the blocks. Actually, at the end of the experiment they recorded similar survival rates (43%) while the bamboo tubes and control had survivals of 1% and 4%, respectively. This could be attributed to the PVC’s ability to hold more sediments thus offering adequate support to the seedlings. Kent and Lin, in their experiment, also reported higher survival rates of above 70% for seedlings encased in full-length PVC, exceeding bamboo-grown and conventionally planted seedlings. This highlights the potential of PVC encasement in mangrove restoration within high-energy areas. Modifications to prevent sediment loss from within the pipes could further enhance the efficacy of PVC. In addition, techniques such as crafting physical barriers around the restoration blocks could help in minimizing the impacts of ocean tides, waves, and currents, thereby enhancing success [99,100]. These defenses have the ability to attenuate incoming waves [101], thus reducing the energy reaching the planted mangroves.
Other eco-engineering approaches used for mangrove restoration in areas exposed to high wave energy often report higher growth and survival rates compared to the conventional planting techniques. For instance, the use of breakwater in Sungai, Malaysia to minimize the wave energy reaching the planted seedlings was moderately successful with 30% of the originally planted seedlings surviving eight months after planting [99]. At Pedada Bay in the Philippines, survival rates higher than 70% were achieved through the use of breakwaters [100]. The effective deployment of breakwaters in Indonesia and Vietnam resulted in decreased wave energy, and thus reducing coastal erosion and sediment accumulation and increasing the rate of mangrove colonization [102]. In Grand Cayman, the use of anchored armored concrete cultivator pots for mangrove planting in a high energy environment was associated with high survival rates above 70% [72].
However, the advancement of mangrove restoration techniques in high-energy environments is an ongoing endeavor essential for effective management. This is particularly important due to the various human and climatic pressures on blue carbon ecosystems like mangroves. The ultimate goal surrounds the innovation of cost-effective methods that can be embraced in sites where conventional methods show limited efficacy [72].

4.4. The Growth Performance of the Planted Mangroves

There were no significance differences (p > 0.05) in sapling shoot length or the numbers of leaves, internodes, and branches for mangroves encased in 3” and 4” PVC. The average number of leaves per plant by the fourth month of growing (5.67 ± 0.65) slightly compares with that of seedlings planted under field conditions (6.17 ± 3.86) by Kairo [39] in Gazi. This is an indication that PVC encasements might have the capability of imitating the natural environment under which mangroves establish. However, other parameters including shoot growth and the number of internodes were relatively high under field conditions (35.11 ± 3.86; 7.29 ± 3.78) by Kairo [39] compared to those in the PVC environment (14.15 ± 0.53; 1.87 ± 0.12) in this study. Additionally, values obtained for the total leaf area per plant at the age of 6 months (100.5 ± 2.1 cm2 (41.3–149.3 cm2) are significantly lower compared to those obtained by Kairo [39] at the age of 12 months (893.1 ± 71.3 cm2 (195.2–1615.5 cm2) under field conditions. This could be attributed to nutrient scarcity within the PVC environment. Over the course of the current experiment, a noticeable removal of sediments from the encasements became apparent, potentially resulting in nutrient depletion. This phenomenon may have contributed to slowed growth and a decrease in leaf area. The primary factor constraining the growth of mangroves is the availability of nutrients [103,104]. Instances of nutrient deficiencies have been associated with stunted growth in mangroves [105,106]. Consequently, there is a need to optimize conditions within the PVC pipes, possibly through improved nutrient management practices.

5. Conclusions

Over the eight months of observation, seedlings encased in 3” and 4” PVC pipes recorded almost similar and greater survival and growth rates compared to the directly planted and bamboo encased seedlings. However, if the monitoring was done for a longer period, significant differences may develop between the different-sized PVC encasements. Results indicate that PVC encasements were more effective in enhancing the survival and growth of the planted seedlings in high-energy areas of Gazi Bay. Performance with PVC encasements would still be enhanced by devising recommended measures such as better nutrient management. Though bamboo encasements were not effective in this study, there is still potential in their use if large diameters are available. A deep substrate would also be suitable for bamboo pipes due to ease of installation. This implies that with the proposed revisions, encasement methodology would facilitate survival rates by minimizing seedling washout, which is the key challenge and cause of mortality in high-energy environments [72]. In the long run, established mangroves are likely to return the ecosystem functions by facilitating soil accretion, minimizing wave energy and encouraging biodiversity and thus, return on investment [107,108]. However, successful restoration demands an obligation from the communities that utilize and are associated with mangroves to ensure the long-term monitoring and maintenance of planted mangroves [109,110]. This study offers future research opportunities on the ecological restoration of mangroves under the changing climate. The results have direct application for mangrove restoration in highly exposed mangrove areas to protect shoreline and minimize disaster risks during the UN’s Decade on Ecosystem Restoration (2021–2030) [111].

Author Contributions

Conceptualization, J.G.K., J.G.N., and G.K.; methodology, J.G.K., J.G.N., B.K.G., and G.K.; software, G.K.; validation, J.G.K. and G.K.; formal analysis, J.G.N. and G.K.; investigation, J.G.K., J.G.N., and G.K.; resources, J.G.K., J.G.N., B.K.G., and G.K.; data curation, G.K.; writing— original draft preparation, G.K.; writing—review and editing, J.G.K., G.K., M.N.G., and R.N.N.; visualization, G.K. and J.G.K.; supervision, M.N.G., R.N.N., and J.G.K.; project administration, G.K. and J.G.K.; funding acquisition, G.K., J.G.N., and J.G.K. All authors have read and agreed to the published version of the manuscript.

Funding

This research was funded by the Marine Research Grant (MARG I) Programme of the Western Indian Ocean Marine Science Association (WIOMSA), under the support of the Swedish Government, Contract Number MARG-I-2021_CO-16. Additional financial support was through 1st Rufford Small Grant, Contract Number 32852-1, and Pew Charitable Trusts Contract: 00032875.

Institutional Review Board Statement

Not applicable.

Data Availability Statement

The data supporting the findings of this study are available upon request from the corresponding author. The data are not publicly available due to privacy reasons.

Acknowledgments

The authors recognize the technical support received during the entire duration of the study by the team at KMFRI. We also thank the Western Indian Ocean Marine Science Association (WIOMSA), The Rufford Organization, and PEW Charitable Trust for their financial support.

Conflicts of Interest

The authors declare no conflicts of interest.

Appendix A

Table A1. Post hoc test results showing group-wise variations in survival rates.
Post Hoc-Tukey HSD
(I) Treatment(J) TreatmentMean Difference (I-J)Std. ErrorSig.95% Confidence Interval
Lower BoundUpper Bound
Control4” PVC−21.167 *1.1870.000−24.28−18.05
3” PVC−21.500 *1.1870.000−24.61−18.39
Bamboo−7.288 *1.4160.000−11.00−3.57
4” PVCControl21.167 *1.1870.00018.0524.28
3” PVC−0.3331.1870.992−3.452.78
Bamboo13.878 *1.4160.00010.1617.59
3” PVCControl21.500 *1.1870.00018.3924.61
4” PVC0.3331.1870.992−2.783.45
Bamboo14.212 *1.4160.00010.5017.93
BambooControl7.288 *1.4160.0003.5711.00
4” PVC−13.878 *1.4160.000−17.59−10.16
3” PVC−14.212 *1.4160.000−17.93−10.50
*. The mean difference is significant at the 0.05 level.

References

  1. Triyanti, A.; Chu, E. An ecosystem approach to disaster risk reduction: The challenges of multilevel governance. Br. GSDR Env. 2016, 3, 202–211. [Google Scholar]
  2. Faridah-Hanum, I.; Yusoff, F.M.; Fitrianto, A.; Ainuddin, N.A.; Gandaseca, S.; Zaiton, S.; Norizah, K.; Nurhidayu, S.; Roslan, M.K.; Hakeem, K.R. Development of a comprehensive mangrove quality index (MQI) in Matang Mangrove: Assessing mangrove ecosystem health. Ecol. Indic. 2019, 102, 103–117. [Google Scholar] [CrossRef]
  3. Barbier, E.B. The protective service of mangrove ecosystems: A review of valuation methods. Mar. Pollut. Bull. 2016, 109, 676–681. [Google Scholar] [CrossRef] [PubMed]
  4. Friess, D.A.; Yando, E.S.; Alemu, J.B.; Wong, L.-W.; Soto, S.D.; Bhatia, N. Ecosystem services and disservices of mangrove forests and salt marshes. In Oceanography and Marine Biology; Taylor & Francis: Abingdon, UK, 2020. [Google Scholar]
  5. Huxham, M.; Dencer-Brown, K.; Kathiresan, K.; Nagelkerken, I.; Wanjiru, C. Mangrove ecosystem services for local communities and their vulnerability to climate change. In Mangrove Ecosystems: A Global Biogeographic Perspective o n Structure, Function and Services; Springer: Cham, Switzerland, 2018. [Google Scholar]
  6. Sanderman, J.; Hengl, T.; Fiske, G.; Solvik, K.; Adame, M.F.; Benson, L.; Bukoski, J.J.; Carnell, P.; Cifuentes-Jara, M.; Donato, D. A global map of mangrove forest soil carbon at 30 m spatial resolution. Environ. Res. Lett. 2018, 13, 55002. [Google Scholar] [CrossRef]
  7. Pendleton, L.; Donato, D.C.; Murray, B.C.; Crooks, S.; Jenkins, W.A.; Sifleet, S.; Craft, C.; Fourqurean, J.W.; Kauffman, J.B.; Marbà, N. Estimating global “blue carbon” emissions from conversion and degradation of vegetated coastal ecosystems. PLoS ONE 2012, 7, e43542. [Google Scholar] [CrossRef] [PubMed]
  8. Sharma, S.; Mackenzie, R.A.; Tieng, T.; Soben, K.; Tulyasuwan, N.; Resanond, A.; Blate, G.; Litton, C.M. The impacts of degradation, deforestation and restoration on mangrove ecosystem carbon stocks across Cambodia. Sci. Total Environ. 2019, 706, 135416. [Google Scholar] [CrossRef]
  9. Howard, J.; Sutton-Grier, A.; Herr, D.; Kleypas, J.; Landis, E.; Mcleod, E.; Pidgeon, E.; Simpson, S. Clarifying the role of coastal and marine systems in climate mitigation. Front. Ecol. Environ. 2017, 15, 42–50. [Google Scholar] [CrossRef]
  10. Sidik, F.; Supriyanto, B.; Krisnawati, H.; Muttaqin, M.Z. Mangrove conservation for climate change mitigation in Indonesia. Wiley Interdiscip. Rev. Clim. Chang. 2018, 9, e529. [Google Scholar] [CrossRef]
  11. Gedan, K.B.; Kirwan, M.L.; Wolanski, E.; Barbier, E.B.; Silliman, B.R. The present and future role of coastal wetland vegetation in protecting shorelines: Answering recent challenges to the paradigm. Clim. Chang. 2011, 106, 7–29. [Google Scholar] [CrossRef]
  12. Shepard, C.C.; Crain, C.M.; Beck, M.W. The protective role of coastal marshes: A systematic review and meta-analysis. PLoS ONE 2011, 6, e27374. [Google Scholar] [CrossRef]
  13. Sandilyan, S.; Kathiresan, K. Mangroves as bioshield: An undisputable fact. Ocean Coast. Manag. 2015, 103, 94–96. [Google Scholar] [CrossRef]
  14. Indarsih, R.; Masruri, M.S. Mangrove conservation as an abration strategy risk reduction based on ecosystem in the coastal area of the Rembang Regency. IOP Conf. Ser. Earth Environ. Sci. 2019, 271, 12021. [Google Scholar] [CrossRef]
  15. Lewis, R.R., III. Ecological engineering for successful management and restoration of mangrove forests. Ecol. Eng. 2005, 24, 403–418. [Google Scholar] [CrossRef]
  16. Alongi, D.M. Mangrove forests: Resilience, protection from tsunamis, and responses to global climate change. Estuar. Coast. Shelf Sci. 2008, 76, 1–13. [Google Scholar] [CrossRef]
  17. Ostling, J.L.; Butler, D.R.; Dixon, R.W. The biogeomorphology of mangroves and their role in natural hazards mitigation. Geogr. Compass 2009, 3, 1607–1624. [Google Scholar] [CrossRef]
  18. Steven, A.; Appeaning Addo, K.; Addo, G.; Llewellyn, V.; Vu, C.; Boateng, I.; Bustamante, R.; Doropoulos, C.; Gillies, C.; Hemer, M.; et al. Coastal Development: Resilience, Restoration and Infrastructure Requirements; World Resources Institute: Washington, DC, USA, 2020. [Google Scholar]
  19. Mclvor, A.; Moller, I.; Spencer, T.; Spalding, M. Reduction of Wind and Swell Waves by Mangroves; Natural Coastal Protection Series: Report 1. Cambridge Coastal Research Unit Working Paper 40; The Nature Conservancy and Wetlands International: Lincoln City, OR, USA, 2012; 27p, ISSN 2050-7941. [Google Scholar]
  20. McKee, K.L.; Cherry, J.A. Hurricane Katrina sediment slowed elevation loss in subsiding brackish marshes of the Mississippi River delta. Wetlands 2009, 29, 2–15. [Google Scholar] [CrossRef]
  21. Wolanski, E. Thematic paper: Synthesis of the protective functions of coastal forests and trees against natural hazards. In Coastal Protection in the Aftermath of the Indian Ocean Tsunami: What Role for Forests and Trees? FAO: Rome, Italy, 2006; pp. 157–179. [Google Scholar]
  22. Day, J.W.; Boesch, D.F.; Clairain, E.J.; Kemp, G.P.; Laska, S.B.; Mitsch, W.J.; Orth, K.; Mashriqui, H.; Reed, D.J.; Shabman, L. Restoration of the Mississippi Delta: Lessons from hurricanes Katrina and Rita. Science 2007, 315, 1679–1684. [Google Scholar] [CrossRef]
  23. McKee, K.L.; Cahoon, D.R.; Feller, I.C. Caribbean mangroves adjust to rising sea level through biotic controls on change in soil elevation. Glob. Ecol. Biogeogr. 2007, 16, 545–556. [Google Scholar] [CrossRef]
  24. Krauss, K.W.; McKee, K.L.; Lovelock, C.E.; Cahoon, D.R.; Saintilan, N.; Reef, R.; Chen, L. How mangrove forests adjust to rising sea level. New Phytol. 2014, 202, 19–34. [Google Scholar] [CrossRef]
  25. Dahdouh-Guebas, F.; Jayatissa, L.P.; Di Nitto, D.; Bosire, J.O.; Lo Seen, D.; Koedam, N. How effective were mangroves as a defence against the recent tsunami? Curr. Biol. 2005, 15, R443–R447. [Google Scholar] [CrossRef]
  26. Patel, D.M.; Patel, V.M.; Bhupesh, K.; Patel, K.A. Peformance of mangrove in tsunami resistance. Int. J. Emerg. Technol. Res. 2014, 1, 29–32. [Google Scholar]
  27. Fehr, I.; Grossi, P.; Hernandez, S.; Krebs, T.; McKay, S.; Muir-Wood, R.; Pomonis, A.; Del Re, D.; Souch, C.; Windeler, D. Managing Tsunami Risk in the Aftermath of the 2004 Indian Ocean Earthquake & Tsunami; RMS Incorporated: Whittier, CA, USA, 2006; Available online: http://www.disastersrus.org/emtools/tsunami/indianoceantsunamireport.pdf (accessed on 20 October 2023).
  28. Hawkes, A.D.; Bird, M.; Cowie, S.; Grundy-Warr, C.; Horton, B.P.; Hwai, A.T.S.; Law, L.; Macgregor, C.; Nott, J.; Ong, J.E. Sediments deposited by the 2004 Indian Ocean tsunami along the Malaysia–Thailand Peninsula. Mar. Geol. 2007, 242, 169–190. [Google Scholar] [CrossRef]
  29. Athukorala, P. Disaster, Generosity and Recovery: Indian Ocean Tsunami; Departmental Working Papers 2012-04; Arndt-Corden Department of Economics, The Australian National University: Canberra, Australia, 2012. [Google Scholar]
  30. Carugati, L.; Gatto, B.; Rastelli, E.; Lo Martire, M.; Coral, C.; Greco, S.; Danovaro, R. Impact of mangrove forests degradation on biodiversity and ecosystem functioning. Sci. Rep. 2018, 8, 13298. [Google Scholar] [CrossRef] [PubMed]
  31. Goldberg, L.; Lagomasino, D.; Thomas, N.; Fatoyinbo, T. Global declines in human-driven mangrove loss. Glob. Chang. Biol. 2020, 26, 5844–5855. [Google Scholar] [CrossRef] [PubMed]
  32. Hamilton, S.E.; Casey, D. Creation of a high spatio-temporal resolution global database of continuous mangrove forest cover for the 21st century (CGMFC-21). Glob. Ecol. Biogeogr. 2016, 25, 729–738. [Google Scholar] [CrossRef]
  33. GoK, G.K. National Mangrove Ecosystem Management Plan; Kenya Forest Service: Nairobi, Kenya, 2017; Available online: https://wiomn.org/wp-content/uploads/2017/10/National-Mangrove-Ecosystem-Management-Plan_Final_170628.pdf (accessed on 22 October 2023).
  34. Bosire, J.O.; Mangora, M.M.; Bandeira, S.O.; Rajkaran, A.; Ratsimbazafy, R.; Appadoo, C.; Kairo, J.G. (Eds.) Mangroves of the Western Indian Ocean: Status and Management; Western Indian Ocean Marine Science Association (WIOMSA): Zanzibar, Tanzania, 2015; 157p, ISBN 9987955940. [Google Scholar]
  35. Murray, B.C.; Pendleton, L.; Jenkins, W.A.; Sifleet, S. Green Payments for Blue Carbon: Economic Incentives for Protecting Threatened Coastal Habitats; Nicholas Institute for Environmental Policy Solutions: Durham, NC, USA, 2011. [Google Scholar]
  36. Primavera, J.H.; Rollon, R.N.; Samson, M.S. 10.10 The Pressing Challenges of Mangrove Rehabilitation: Pond Reversion and Coastal Protection. Biologica 2011, 50, 232. [Google Scholar]
  37. Bandeira, S.; Balidy, H. Limpopo Estuary Mangrove Transformation, Rehabilitation and Management. In Estuaries: A Lifeline of Ecosystem Services in the Western Indian Ocean; Springer: Cham, Switzerland, 2016; pp. 227–237. [Google Scholar] [CrossRef]
  38. Brooks, S.M.; Spencer, T. Shoreline retreat and sediment release in response to accelerating sea level rise: Measuring and modelling cliffline dynamics on the Suffolk Coast, UK. Glob. Planet. Chang. 2012, 80, 165–179. [Google Scholar] [CrossRef]
  39. Kairo, J.G. Artificial Regeneration and Sustainable Yield Management of Mangrove Forests at Gazi Bay, Kenya; University of Nairobi: Nairobi, Kenya, 1995. [Google Scholar]
  40. Bosire, J.O.; Dahdouh-Guebas, F.; Kairo, J.G.; Koedam, N. Colonization of non-planted mangrove species into restored mangrove stands in Gazi Bay, Kenya. Aquat. Bot. 2003, 76, 267–279. [Google Scholar] [CrossRef]
  41. Dahdouh-Guebas, F.; Van Pottelbergh, I.; Kairo, J.G.; Cannicci, S.; Koedam, N. Human-impacted mangroves in Gazi (Kenya): Predicting future vegetation based on retrospective remote sensing, social surveys, and tree distribution. Mar. Ecol. Prog. Ser. 2004, 272, 77–92. [Google Scholar] [CrossRef]
  42. Kirui, K.B.; Kairo, J.G.; Bosire, J.; Viergever, K.M.; Rudra, S.; Huxham, M.; Briers, R.A. Mapping of mangrove forest land cover change along the Kenya coastline using Landsat imagery. Ocean Coast. Manag. 2013, 83, 19–24. [Google Scholar] [CrossRef]
  43. Cadier, C.; Bayraktarov, E.; Piccolo, R.; Adame, M.F. Indicators of coastal wetlands restoration success: A systematic review. Front. Mar. Sci. 2020, 7, 600220. [Google Scholar] [CrossRef]
  44. Airoldi, L.; Beck, M.W.; Firth, L.B.; Bugnot, A.B.; Steinberg, P.D.; Dafforn, K.A. Emerging solutions to return nature to the urban ocean. Ann. Rev. Mar. Sci. 2021, 13, 445–477. [Google Scholar] [CrossRef] [PubMed]
  45. Gerona-Daga, M.E.B.; Salmo, S.G., III. A systematic review of mangrove restoration studies in Southeast Asia: Challenges and opportunities for the United Nation’s Decade on Ecosystem Restoration. Front. Mar. Sci. 2022, 9, 987737. [Google Scholar] [CrossRef]
  46. Kairo, J.G.; Dahdouh-Guebas, F.; Bosire, J.; Koedam, N. Restoration and management of mangrove systems—A lesson for and from the East African region. S. Afri. J. Bot. 2001, 67, 383–389. [Google Scholar] [CrossRef]
  47. UNEP; Nairobi Convention Secretariat; USAID; WIOMSA. Guidelines on Mangrove Ecosystem Restoration for the Western Indian Ocean Region; UNEP: Nairobi, Kenya, 2020; 71p, Available online: https://www.unep.org/resources/report/guidelines-mangrove-restoration-western-indian-ocean-region (accessed on 28 December 2023).
  48. Kodikara, K.A.S.; Mukherjee, N.; Jayatissa, L.P.; Dahdouh-Guebas, F.; Koedam, N. Have mangrove restoration projects worked? An in-depth study in Sri Lanka. Restor. Ecol. 2017, 25, 705–716. [Google Scholar] [CrossRef]
  49. Wodehouse, D.C.J.; Rayment, M.B. Mangrove area and propagule number planting targets produce sub-optimal rehabilitation and afforestation outcomes. Estuar. Coast. Shelf Sci. 2019, 222, 91–102. [Google Scholar] [CrossRef]
  50. Otero, V.; Van De Kerchove, R.; Satyanarayana, B.; Mohd-Lokman, H.; Lucas, R.; Dahdouh-Guebas, F. An analysis of the early regeneration of mangrove forests using Landsat time series in the Matang Mangrove Forest Reserve, Peninsular Malaysia. Remote Sens. 2019, 11, 774. [Google Scholar] [CrossRef]
  51. Kamali, B.; Hashim, R. Mangrove restoration without planting. Ecol. Eng. 2011, 37, 387–391. [Google Scholar] [CrossRef]
  52. Schmitt, K.; Duke, N.C. Mangrove management, assessment and monitoring. In Tropical Forestry Handbook; Springer: Berlin/Heidelberg, Germany, 2015; pp. 1–29. [Google Scholar]
  53. Riley, R.W.; Kent, C.P.S. Riley encased methodology: Principles and processes of mangrove habitat creation and restoration. Mangroves Salt Marshes 1999, 3, 207–213. [Google Scholar] [CrossRef]
  54. Coppejans, E.; Beeckman, H.; De Wit, M. The seagrass and associated macroalgal vegetation of Gazi Bay (Kenya). Hydrobiologia 1992, 247, 59–75. [Google Scholar] [CrossRef]
  55. Tack, J.; Polk, P. The influence of tropical catchments upon the coastal zone: Modelling the links between groundwater and mangrove losses in Kenya, India/Bangladesh and Florida. In The Sustainable Management of Tropical Catchments; John Wiley & Sons: Hoboken, NJ, USA, 1999; pp. 359–371. [Google Scholar]
  56. Kitheka, J.U. Water circulation and coastal trapping of brackish water in a tropical mangrove-dominated bay in Kenya. Limnol. Oceanogr. 1996, 41, 169–176. [Google Scholar] [CrossRef]
  57. Obura, D. Coral reefs and society—Finding a balance? Oryx 2012, 46, 467–468. [Google Scholar] [CrossRef]
  58. Peel, M.C.; Finlayson, B.L.; McMahon, T.A. Updated world map of the Köppen-Geiger climate classification. Hydrol. Earth Syst. Sci. 2007, 11, 1633–1644. [Google Scholar] [CrossRef]
  59. McClanahan, T.R. Seasonality in East Africa’s coastal waters. Mar. Ecol. Prog. Ser. Oldend. 1988, 44, 191–199. [Google Scholar] [CrossRef]
  60. UNEP; Institute of Marine Sciences, University of Dar es Salaam; FAQ; SIDA. Overview of Land-Based Sources and Activities Affecting the Marine, Coastal and Associated Freshwater Environment in the Eastern African Region; UNEP Regional Seas Reports and Studies; UNEP: Nairobi, Kenya, 1998. [Google Scholar]
  61. Kirui, B.; Kairo, J.G.; Karachi, M. Allometric equations for estimating above ground biomass of Rhizophora mucronata Lamk.(Rhizophoraceae) mangroves at Gazi Bay, Kenya. West. Indian Ocean J. Mar. Sci. 2006, 5, 27–34. [Google Scholar]
  62. Neukermans, G.; Dahdouh-Guebas, F.; Kairo, J.G.; Koedam, N. Mangrove species and stand mapping in Gazi Bay (Kenya) using Quickbird satellite imagery. J. Spat. Sci. 2008, 53, 75–86. [Google Scholar] [CrossRef]
  63. Kairu, A.; Kotut, K.; Mbeche, R.; Kairo, J.G. Participatory forestry improves mangrove forest management in Kenya. Int. For. Rev. 2021, 23, 41–54. [Google Scholar] [CrossRef]
  64. Cintron, G.; Schaeffer Novelli, Y. Methods for studying mangrove structure. Monogr. Oceanogr. Methodol. 1984, 8, 91–113. [Google Scholar]
  65. Komiyama, A.; Poungparn, S.; Kato, S. Common allometric equations for estimating the tree weight of mangroves. J. Trop. Ecol. 2005, 21, 471–477. [Google Scholar] [CrossRef]
  66. Kauffman, J.B.; Donato, D.C. Protocols for the Measurement, Monitoring and Reporting of Structure, Biomass, and Carbon Stocks in Mangrove Forests; Working Paper 86; CIFOR: Bogor, Indonesia, 2012. [Google Scholar]
  67. Kershaw Jr, J.A.; Ducey, M.J.; Beers, T.W.; Husch, B. Forest Mensuration, 5th ed.; John Wiley & Sons: Hoboken, NJ, USA, 2016; ISBN 1118902033. Available online: https://books.google.co.ke/books?id=SGVJDQAAQBAJ (accessed on 5 November 2023).
  68. Folk, R.L.; Ward, W.C. Brazos River bar [Texas]; a study in the significance of grain size parameters. J. Sediment. Res. 1957, 27, 3–26. [Google Scholar] [CrossRef]
  69. Blott, S.J.; Pye, K. GRADISTAT: A grain size distribution and statistics package for the analysis of unconsolidated sediments. Earth Surf. Process. Landforms 2001, 26, 1237–1248. [Google Scholar] [CrossRef]
  70. Howard, J.; Hoyt, S.; Isensee, K.; Telszewski, M.; Pidgeon, E. Coastal Blue Carbon: Methods for Assessing Carbon Stocks and Emissions Factors in Mangroves, Tidal Salt Marshes, and Seagrasses; Conservation International: Arlington, VA, USA; Intergovernmental Oceanographic Commission of UNESCO: Paris, France; International Union for Conservation of Nature: Gland, Switzerland, 2014. [Google Scholar]
  71. Kauffman, J.B.; Heider, C.; Cole, T.G.; Dwire, K.A.; Donato, D.C. Ecosystem carbon stocks of micronesian mangrove forests. Wetlands 2011, 31, 343–352. [Google Scholar] [CrossRef]
  72. Krumholz, J.; Jadot, C. Demonstration of a new technology for restoration of Red Mangrove (Rhizophora mangle) in high-energy environments. Mar. Technol. Soc. J. 2009, 43, 64–72. [Google Scholar] [CrossRef]
  73. Clarke, A.; Johns, L. Mangrove Nurseries: Construction, Propagation and Planting; Fish Habitat Guideline FHG 004; Queensland Department of Agriculture and Fisheries: Warwick, Australia, 2002; 32p. [Google Scholar]
  74. Melana, D.M.; Atchue, J., III; Yao, C.E.; Edwards, R.; Melana, E.E.; Gonzales, H.I. Mangrove Management Handbook; Department of Environment and Natural Resources: Cebu City, Philippines, 2000; 96p. [Google Scholar]
  75. Change, C. A Community-Based Mangrove Planting Handbook for Papua New Guinea; Asian Development Bank: Mandaluyong, Philippines, 2018. [Google Scholar]
  76. Rahardjo, H.; Indrawan, I.G.B.; Leong, E.C.; Yong, W.K. Effects of coarse-grained material on hydraulic properties and shear strength of top soil. Eng. Geol. 2008, 101, 165–173. [Google Scholar] [CrossRef]
  77. Zhao, Y.; Cui, Y.; Zhou, H.; Feng, X.; Huang, Z. Effects of void ratio and grain size distribution on water retention properties of compacted infilled joint soils. Soils Found. 2017, 57, 50–59. [Google Scholar] [CrossRef]
  78. Kairo, J.G.; Lang’at, J.K.S.; Dahdouh-Guebas, F.; Bosire, J.; Karachi, M. Structural development and productivity of replanted mangrove plantations in Kenya. For. Ecol. Manage. 2008, 255, 2670–2677. [Google Scholar] [CrossRef]
  79. Tue, N.T.; Quy, T.D.; Amano, A.; Hamaoka, H.; Tanabe, S.; Nhuan, M.T.; Omori, K. Historical profiles of trace element concentrations in mangrove sediments from the Ba Lat Estuary, Red River, Vietnam. Water, Air, Soil Pollut. 2012, 223, 1315–1330. [Google Scholar] [CrossRef]
  80. Al-Shayea, N.A. The combined effect of clay and moisture content on the behavior of remolded unsaturated soils. Eng. Geol. 2001, 62, 319–342. [Google Scholar] [CrossRef]
  81. Dimitrova, R.S.; Yanful, E.K. Factors affecting the shear strength of mine tailings/clay mixtures with varying clay content and clay mineralogy. Eng. Geol. 2012, 125, 11–25. [Google Scholar] [CrossRef]
  82. Cerón-Bretón, J.G.; Cerón-Bretón, R.M.; Rangel-Marrón, M.; Estrella-Cahuich, A. Evaluation of carbon sequestration potential in undisturbed mangrove forest in Términos Lagoon, Campeche. Dev. Energy Environ. Econ 2010, 1, 295–300. [Google Scholar]
  83. Calderón, F.J.; Reeves, J.B.; Collins, H.P.; Paul, E.A. Chemical Differences in Soil Organic Matter Fractions Determined by Diffuse-Reflectance Mid-Infrared Spectroscopy. Soil Sci. Soc. Am. J. 2011, 75, 568–579. [Google Scholar] [CrossRef]
  84. Watson, J. Do Mangrove forests of the Malay Peninsula. Malayan Forest Records 6, Forest Department, Federated Malay States, Kuala Lumpur. Malay For. Rec. 1928, 6, 1–275. [Google Scholar]
  85. Srikanth, S.; Lum, S.K.Y.; Chen, Z. Mangrove root: Adaptations and ecological importance. Trees 2016, 30, 451–465. [Google Scholar] [CrossRef]
  86. Kamil, E.A.; Takaijudin, H.; Hashim, A.M. Mangroves as coastal bio-shield: A review of mangroves performance in wave attenuation. Civ. Eng. J. 2021, 7, 1964–1981. [Google Scholar] [CrossRef]
  87. Tanaka, N.; Sasaki, Y.; Mowjood, M.I.M.; Jinadasa, K.; Homchuen, S. Coastal vegetation structures and their functions in tsunami protection: Experience of the recent Indian Ocean tsunami. Landsc. Ecol. Eng. 2007, 3, 33–45. [Google Scholar] [CrossRef]
  88. Ohira, W.; Honda, K.; Nagai, M.; Ratanasuwan, A. Mangrove stilt root morphology modeling for estimating hydraulic drag in tsunami inundation simulation. Trees 2013, 27, 141–148. [Google Scholar] [CrossRef]
  89. Primavera, J.H.; Dela Cruz, M.; Montilijao, C.; Consunji, H.; Dela Paz, M.; Rollon, R.N.; Maranan, K.; Samson, M.S.; Blanco, A. Preliminary assessment of post-Haiyan mangrove damage and short-term recovery in Eastern Samar, central Philippines. Mar. Pollut. Bull. 2016, 109, 744–750. [Google Scholar] [CrossRef] [PubMed]
  90. Temmerman, S.; Meire, P.; Bouma, T.J.; Herman, P.M.J.; Ysebaert, T.; De Vriend, H.J. Ecosystem-based coastal defence in the face of global change. Nature 2013, 504, 79–83. [Google Scholar] [CrossRef] [PubMed]
  91. Lovelock, C.E.; Adame, M.F.; Bennion, V.; Hayes, M.; Reef, R.; Santini, N.; Cahoon, D.R. Sea level and turbidity controls on mangrove soil surface elevation change. Estuar. Coast. Shelf Sci. 2015, 153, 1–9. [Google Scholar] [CrossRef]
  92. Njiru, D.M.; Githaiga, M.N.; Nyaga, J.M.; Lang’at, K.S.; Kairo, J.G. Geomorphic and climatic drivers are key determinants of structural variability of mangrove forests along the Kenyan Coast. Forests 2022, 13, 870. [Google Scholar] [CrossRef]
  93. Oosterom, A.P. The Geomorphology of Southeast Kenya; Wageningen University and Research: Wageningen, The Netherlands, 1988; ISBN 9798516020117. [Google Scholar]
  94. Mohamed, M.O.S.; Neukermans, G.; Kairo, J.G.; Dahdouh-Guebas, F.; Koedam, N. Mangrove forests in a peri-urban setting: The case of Mombasa (Kenya). Wetl. Ecol. Manag. 2009, 17, 243–255. [Google Scholar] [CrossRef]
  95. Ndirangu, M.D. Bio-Shields: Wave Energy Reduction and Sediment Stabilization by Mangroves in Gazi Bay, Kenya; University of Nairobi: Nairobi, Kenya, 2016. [Google Scholar]
  96. Primavera, J.H.; Esteban, J.M.A. A review of mangrove rehabilitation in the Philippines: Successes, failures and future prospects. Wetl. Ecol. Manag. 2008, 16, 345–358. [Google Scholar] [CrossRef]
  97. Teas, H.J. Ecology and restoration of mangrove shorelines in Florida. Environ. Conserv. 1977, 4, 51–58. [Google Scholar] [CrossRef]
  98. Kent, C.P.S.; Lin, J. A comparison of Riley encased methodology and traditional techniques for planting red mangroves (Rhizophora mangle). Mangroves Salt Marshes 1999, 3, 215–225. [Google Scholar] [CrossRef]
  99. Hashim, R.; Kamali, B.; Tamin, N.M.; Zakaria, R. An integrated approach to coastal rehabilitation: Mangrove restoration in Sungai Haji Dorani, Malaysia. Estuar. Coast. Shelf Sci. 2010, 86, 118–124. [Google Scholar] [CrossRef]
  100. Furukawa, K.; Primavera, J.H.; Loma, R.J.; Montilijao, C.L.; Coching, J.D.; Maria, Y.Y.; Siringan, F.P. A community based mangrove rehabilitation of high energy coasts in Pedada Bay, Philippines. J. Trop. For. Res 2019, 3, 36–53. [Google Scholar]
  101. Shu, A.; Zhu, J.; Cui, B.; Wang, L.; Zhang, Z.; Pi, C. Coastal wave-energy attenuation by artificial wooden fences deployed for mangrove restoration: An experimental study. Front. Mar. Sci. 2023, 10, 1165048. [Google Scholar] [CrossRef]
  102. Le Xuan, T.; Le Manh, H.; Ba, H.T.; Do Van, D.; Vu, H.T.D.; Wright, D.; Bui, V.H.; Anh, D.T. Wave energy dissipation through a hollow triangle breakwater on the coastal Mekong Delta. Ocean Eng. 2022, 245, 110419. [Google Scholar] [CrossRef]
  103. Almahasheer, H.; Duarte, C.M.; Irigoien, X. Nutrient limitation in central Red Sea mangroves. Front. Mar. Sci. 2016, 3, 271. [Google Scholar] [CrossRef]
  104. Alongi, D. Early growth responses of mangroves to different rates of nitrogen and phosphorus supply. J. Exp. Mar. Biol. Ecol. 2011, 397, 85–93. [Google Scholar] [CrossRef]
  105. Krauss, K.W.; Lovelock, C.E.; McKee, K.L.; López-Hoffman, L.; Ewe, S.M.; Sousa, W.P. Environmental drivers in mangrove establishment and early development: A review. Aquat. Bot. 2008, 89, 105–127. [Google Scholar] [CrossRef]
  106. Almahasheer, H.; Duarte, C.M.; Irigoien, X. Phenology and Growth dynamics of Avicennia marina in the Central Red Sea. Sci. Rep. 2016, 6, 37785. [Google Scholar] [CrossRef]
  107. Su, J.; Friess, D.A.; Gasparatos, A. A meta-analysis of the ecological and economic outcomes of mangrove restoration. Nat. Commun. 2021, 12, 5050. [Google Scholar] [CrossRef] [PubMed]
  108. Beck, M.W.; Heck, N.; Narayan, S.; Menéndez, P.; Reguero, B.G.; Bitterwolf, S.; Torres-Ortega, S.; Lange, G.-M.; Pfliegner, K.; McNulty, V.P. Return on investment for mangrove and reef flood protection. Ecosyst. Serv. 2022, 56, 101440. [Google Scholar] [CrossRef]
  109. Ounanian, K.; Carballo-Cárdenas, E.; van Tatenhove, J.P.M.; Delaney, A.; Papadopoulou, K.N.; Smith, C.J. Governing marine ecosystem restoration: The role of discourses and uncertainties. Mar. Policy 2018, 96, 136–144. [Google Scholar] [CrossRef]
  110. Gann, G.D.; McDonald, T.; Walder, B.; Aronson, J.; Nelson, C.R.; Jonson, J.; Hallett, J.G.; Eisenberg, C.; Guariguata, M.R.; Liu, J. International principles and standards for the practice of ecological restoration. Restor. Ecol. 2019, 27, S1–S46. [Google Scholar] [CrossRef]
  111. Waltham, N.J.; Elliott, M.; Lee, S.Y.; Lovelock, C.; Duarte, C.M.; Buelow, C.; Simenstad, C.; Nagelkerken, I.; Claassens, L.; Wen, C.K.C. UN decade on ecosystem restoration 2021–2030—What chance for success in restoring coastal ecosystems? Front. Mar. Sci. 2020, 7, 71. [Google Scholar] [CrossRef]
Figure 1. Map of Gazi Bay showing planting area.
Diversity 16 00135 g001
Figure 2. Schematic presentation of the experimental design showing randomized blocks and treatments in the planting area.
Diversity 16 00135 g002
Figure 3. Elevation of every block relative to the MSL.
Diversity 16 00135 g003
Figure 4. Biometry of a mangrove sapling [47].
Diversity 16 00135 g004
Figure 5. Height–diameter distribution of mangroves in degraded Gazi site.
Diversity 16 00135 g005
Figure 6. Survival rates of mangroves established in three blocks (A, B, C) under different treatments over time. One to eight represent time in months after planting.
Diversity 16 00135 g006
Figure 7. Average shoot growth (in cm) in blocks per treatment. A, B, and C represent the blocks.
Diversity 16 00135 g007
Figure 8. Average number of leaves in blocks per treatment. A, B, and C represent the blocks.
Diversity 16 00135 g008
Figure 9. Average number of internodes in blocks per treatment. A, B, and C represent the blocks.
Diversity 16 00135 g009
Figure 10. The relationship between depth and bulky density. Error bars represent the standard error of mean.
Diversity 16 00135 g010
Figure 11. A photo taken from the study site showing a mature Rhizophora stand establishing in combination with the native species.
Diversity 16 00135 g011
Table 1. Monitoring schedule adopted in assessing the survival and growth performance of the planted seedlings.
Time after PlantingParameters Measured
0 to 3 monthsPercentage Survival
4 to 6 monthsPercentage Survival
Shoot height (from first node to the base of top-most leaves)
Number of leaves (for all individuals)
Number of internodes (for all individuals)
7 to 8 monthsPercentage Survival
Shoot Height
Number of leaves (for all individuals)
Number of internodes (for all individuals)
Table 2. Sediment physico-chemical properties in the different depth intervals of the eroded Gazi site. The values are presented as percentage mean ± S.E.
Sample Depth (cm)Coarse Sand (%)Medium Sand (%)Fine Sand (%)Silt-Clay
(%)
Bulk Density
(g/cm3)
SOM
(%)
SOC
(%)
0–1513.54 ± 0.9827.68 ± 2.3055.33 ± 2.603.45 ± 0.300.335 ± 0.0096.419 ± 0.355.554 ± 0.15
15–3019.50 ± 1.4127.60 ± 1.8750.05 ± 2.302.86 ± 0.240.281 ± 0.0105.948 ± 0.485.358 ± 0.20
30–5018.74 ± 1.5324.66 ± 2.0853.76 ± 2.552.84 ± 0.430.184 ± 0.0086.251 ± 0.555.484 ± 0.23
50–10019.23 ± 1.7319.51 ± 1.7558.65 ± 2.992.60 ± 0.340.065 ± 0.0047.315 ± 0.585.926 ± 0.24
Average17.19 ± 0.7026.10 ± 1.1353.68 ± 1.353.03 ± 0.170.255 ± 0.0076.334 ± 0.245.519 ± 0.10
Table 3. Species composition and importance values of mangroves encountered in the eroding Gazi Bay shoreline.
SpeciesRelative Values (%)
DominanceFrequency Density IV (%)
Avicennia marina2.459.091.70913.25
Rhizophora mucronata1.2513.641.36816.25
Sonneratia alba96.3010096.923293.23
Table 4. ANOVA table showing the effect of treatments and blocks on survival rates.
TreatmentsBlocks
Sum of SquaresdfMean SquareFSig.Sum of SquaresdfMean SquareFSig.
Between Groups7812.52432604.175153.9620.000110.614255.3070.5000.608
Within Groups1370.0648116.914 9071.97482110.634
Total9182.58884 9182.58884
Table 5. Overall growth performances for the replanted mangroves at the end of the experiment. Values are reported as mean ± se.
TreatmentShoot
Growth (cm)
Number of
Leaves
Number of
Internodes
Number of
Branches
3” PVC23.84 ± 0.6611.37 ± 0.154.68 ± 0.081.87 ± 0.13
4” PVC25.65 ± 0.7211.89 ± 0.204.95 ± 0.102.45 ± 0.18
Total24.74 ± 0.6911.63 ± 0.134.82 ± 0.062.27 ± 0.13
Disclaimer/Publisher’s Note: The statements, opinions and data contained in all publications are solely those of the individual author(s) and contributor(s) and not of MDPI and/or the editor(s). MDPI and/or the editor(s) disclaim responsibility for any injury to people or property resulting from any ideas, methods, instructions or products referred to in the content.

