Article

Fish Diversity in Relation to Littoral Habitats in Three Basins of Lake Kivu (East Africa)

1
Unité d’Enseignement et de Recherche en Hydrobiologie Appliquée (UERHA), Département de Biologie-Chimie, ISP of Bukavu, Bukavu 854, Democratic Republic of the Congo
2
Centre for Research in Biodiversity, Ecology and Evolution (CRBEC), Bukavu 854, Democratic Republic of the Congo
3
School of Materials, Energy, Water and Environmental Sciences, The Nelson Mandela African Institution of Science and Technology (NM-AIST), Arusha P.O. Box 447, Tanzania
4
Eawag (Swiss Federal Institute of Aquatic Science and Technology), Surface Waters–Research and Management, 6047 Kastanienbaum, Switzerland
5
Limnology Center, Swiss Federal Institute of Technology Lausanne (EPFL), GR A2 435, Station 2, 1015 Lausanne, Switzerland
6
Centre de Recherche en Environnement et Géo-Ressources (CREGER), Département des Sciences de l’Environnement, Université Catholique de Bukavu, Bukavu 285, Democratic Republic of the Congo
*
Author to whom correspondence should be addressed.
Diversity 2023, 15(9), 1014; https://doi.org/10.3390/d15091014
Submission received: 4 April 2023 / Revised: 19 August 2023 / Accepted: 31 August 2023 / Published: 12 September 2023
(This article belongs to the Special Issue Biodiversity and Biogeography of Freshwater Fish)

Abstract

:
In total, 28 of the 29 fish species reported from the Lake Kivu basin occur in the littoral zone of the lake, but information about their structure, occurrence, and the habitats affecting their distribution is largely lacking. The lake’s inshore area is poorly heterogenous, with rock and macrophyte habitats representing the major habitats. The lack of heterogeneity in the habitats is probably an important factor influencing species richness, abundance, and the association between the species and habitats. We evaluated the fish diversity, abundance, and habitat parameters across 14 sites representing the major habitats of the lake, using data collected between April 2018 and October 2019. We calculated Hull and Jaccard indices and applied uni- and multivariate statistical approaches to the collected data. We identified 18 fish species in the lake. In the north, 17 species were found, with high abundance in rocky sites but low abundance in sandy habitats. In the south, 15 species were reported. We identified 12 species in the Ishungu Basin where the site with rock substrate had high abundance and 13 species in the Bukavu Basin with weak species richness and low abundance across degraded sites. Lamprichthys tanganicanus, a non-native species, was abundant in rocky (north) and macrophyte sites (south). Sand, rock, conductivity, depth, dissolved oxygen, and water transparency were significant parameters that could explain the fish distribution in the north while dissolved oxygen, vegetation cover, depth, and conductivity were significant in the south. A monitoring programme of the fish fauna in Lake Kivu is needed.

1. Introduction

Lake Kivu is located in the western branch of the Great Rift Valley between the Democratic Republic of the Congo (DRC) and the Republic of Rwanda. A recent review of the geology, physics, chemistry, and biology of Lake Kivu highlights the paucity of knowledge of the spatial ecology of its fish [1]. The lake’s fish were taxonomically described, and comments on their zoogeography within the African ichthyogeographical provinces were highlighted [2,3,4]. Snoeks [2] provided useful comments on the ecology of the native species of Haplochromis (Cichlidae), but he did not discuss the distribution patterns of these species within the lake.
The lake is subdivided into five main basins: the north, the western, the eastern, and the Ishungu and Bukavu basins in the south (Figure 1) [5,6,7]. The shores of the east, west, and south basins are populated by macrophytes, and riparian vegetation still exist along the catchment of these basins, while the shores of the north basin are characterised by submerged rock habitats with irregular interruptions of sandy beaches. In general, the bottom in the littoral zone of Lake Kivu is steep with, in rare cases, some shallow and relatively flat sites such as sandy beaches. Due to the steep and deep coastal zone [5], the lake’s littoral is not well separated from the pelagic area except in some sites.
Our knowledge of fish distribution across the littoral zone and within basins is limited, and this can lead to unsustainable management because almost the entire ichthyofauna known from the lake occurs in the littoral zone either temporally or permanently [3,6]. The littoral zone represents only ~10% of the lake area [8]. In general, the native species inhabit the littoral zone although some haplochromine species occur in the littoral and pelagic zones [9]. Limnothrissa miodon (Clupeidae), an introduced pelagic species, which is the most fished species in the pelagic zone, spawns in the littoral zone [10]. Furthermore, Lamprichthys tanganicanus (Procatopodidae), another introduced species, inhabits both the pelagic and littoral zones [11].
Moreover, several anthropogenic activities are likely to be having adverse impacts on the lake ecosystem and particularly along the littoral zone including: the exploitation of methane gas [12], the expansion of cage fish farming since 2018 (our observation), agricultural activities and building construction within the catchment [13], human population growth (including sewerage release) along the lake catchment (without sustainable management policies associated with poor law enforcement), and climate change [1,14]. Although these anthropogenic activities have not been quantified and included in our dataset, they could cause adverse effects on the lake and particularly on the fish abundance across some basins of Lake Kivu such as the Bukavu Basin. For example, Darchambeau et al. [14] argued that climate variation may change the overall ecological functioning of tropical lakes as their primary production is related to the mixing pattern.
To date, studies associating the fish diversity along the shoreline of Lake Kivu with the ecological characteristics underpinning their occurrence at specific sites are lacking. We hypothesised that the composition of fish species along the littoral zone should be similar when habitats are poorly segregated. However, in Lake Kivu, the disparity in the distribution of substrates in the north basin and the anthropogenic activities on the lake shore across the southern basins (Ishungu and Bukavu) might influence the fish abundance between the sites and basins. The fish abundance and the abundance of some species would therefore be greater in some sites dominated by a specific habitat category.
Here, the overarching goal was to identify the fish species diversity in the littoral zone of the north and the southern end basins (the Ishungu and Bukavu basins) and to investigate to what extent habitat parameters can explain the current fish assemblage. The specific aims were to underline the fish diversity across sites which are characterised by a combination of habitat types. Then, we aimed to determine the abundance of individual taxa within a particular site and investigate the habitat parameters together with fish diversity to search for the habitats that might be qualified as key parameters influencing the fish assemblage in the north and south basins and hence in the littoral zone of Lake Kivu. Indeed, the northern and the southern parts of the lake represent the major landscapes of the lake. The findings will provide essential baseline data for conservation efforts in light of increasing anthropogenic activities.

2. Materials and Methods

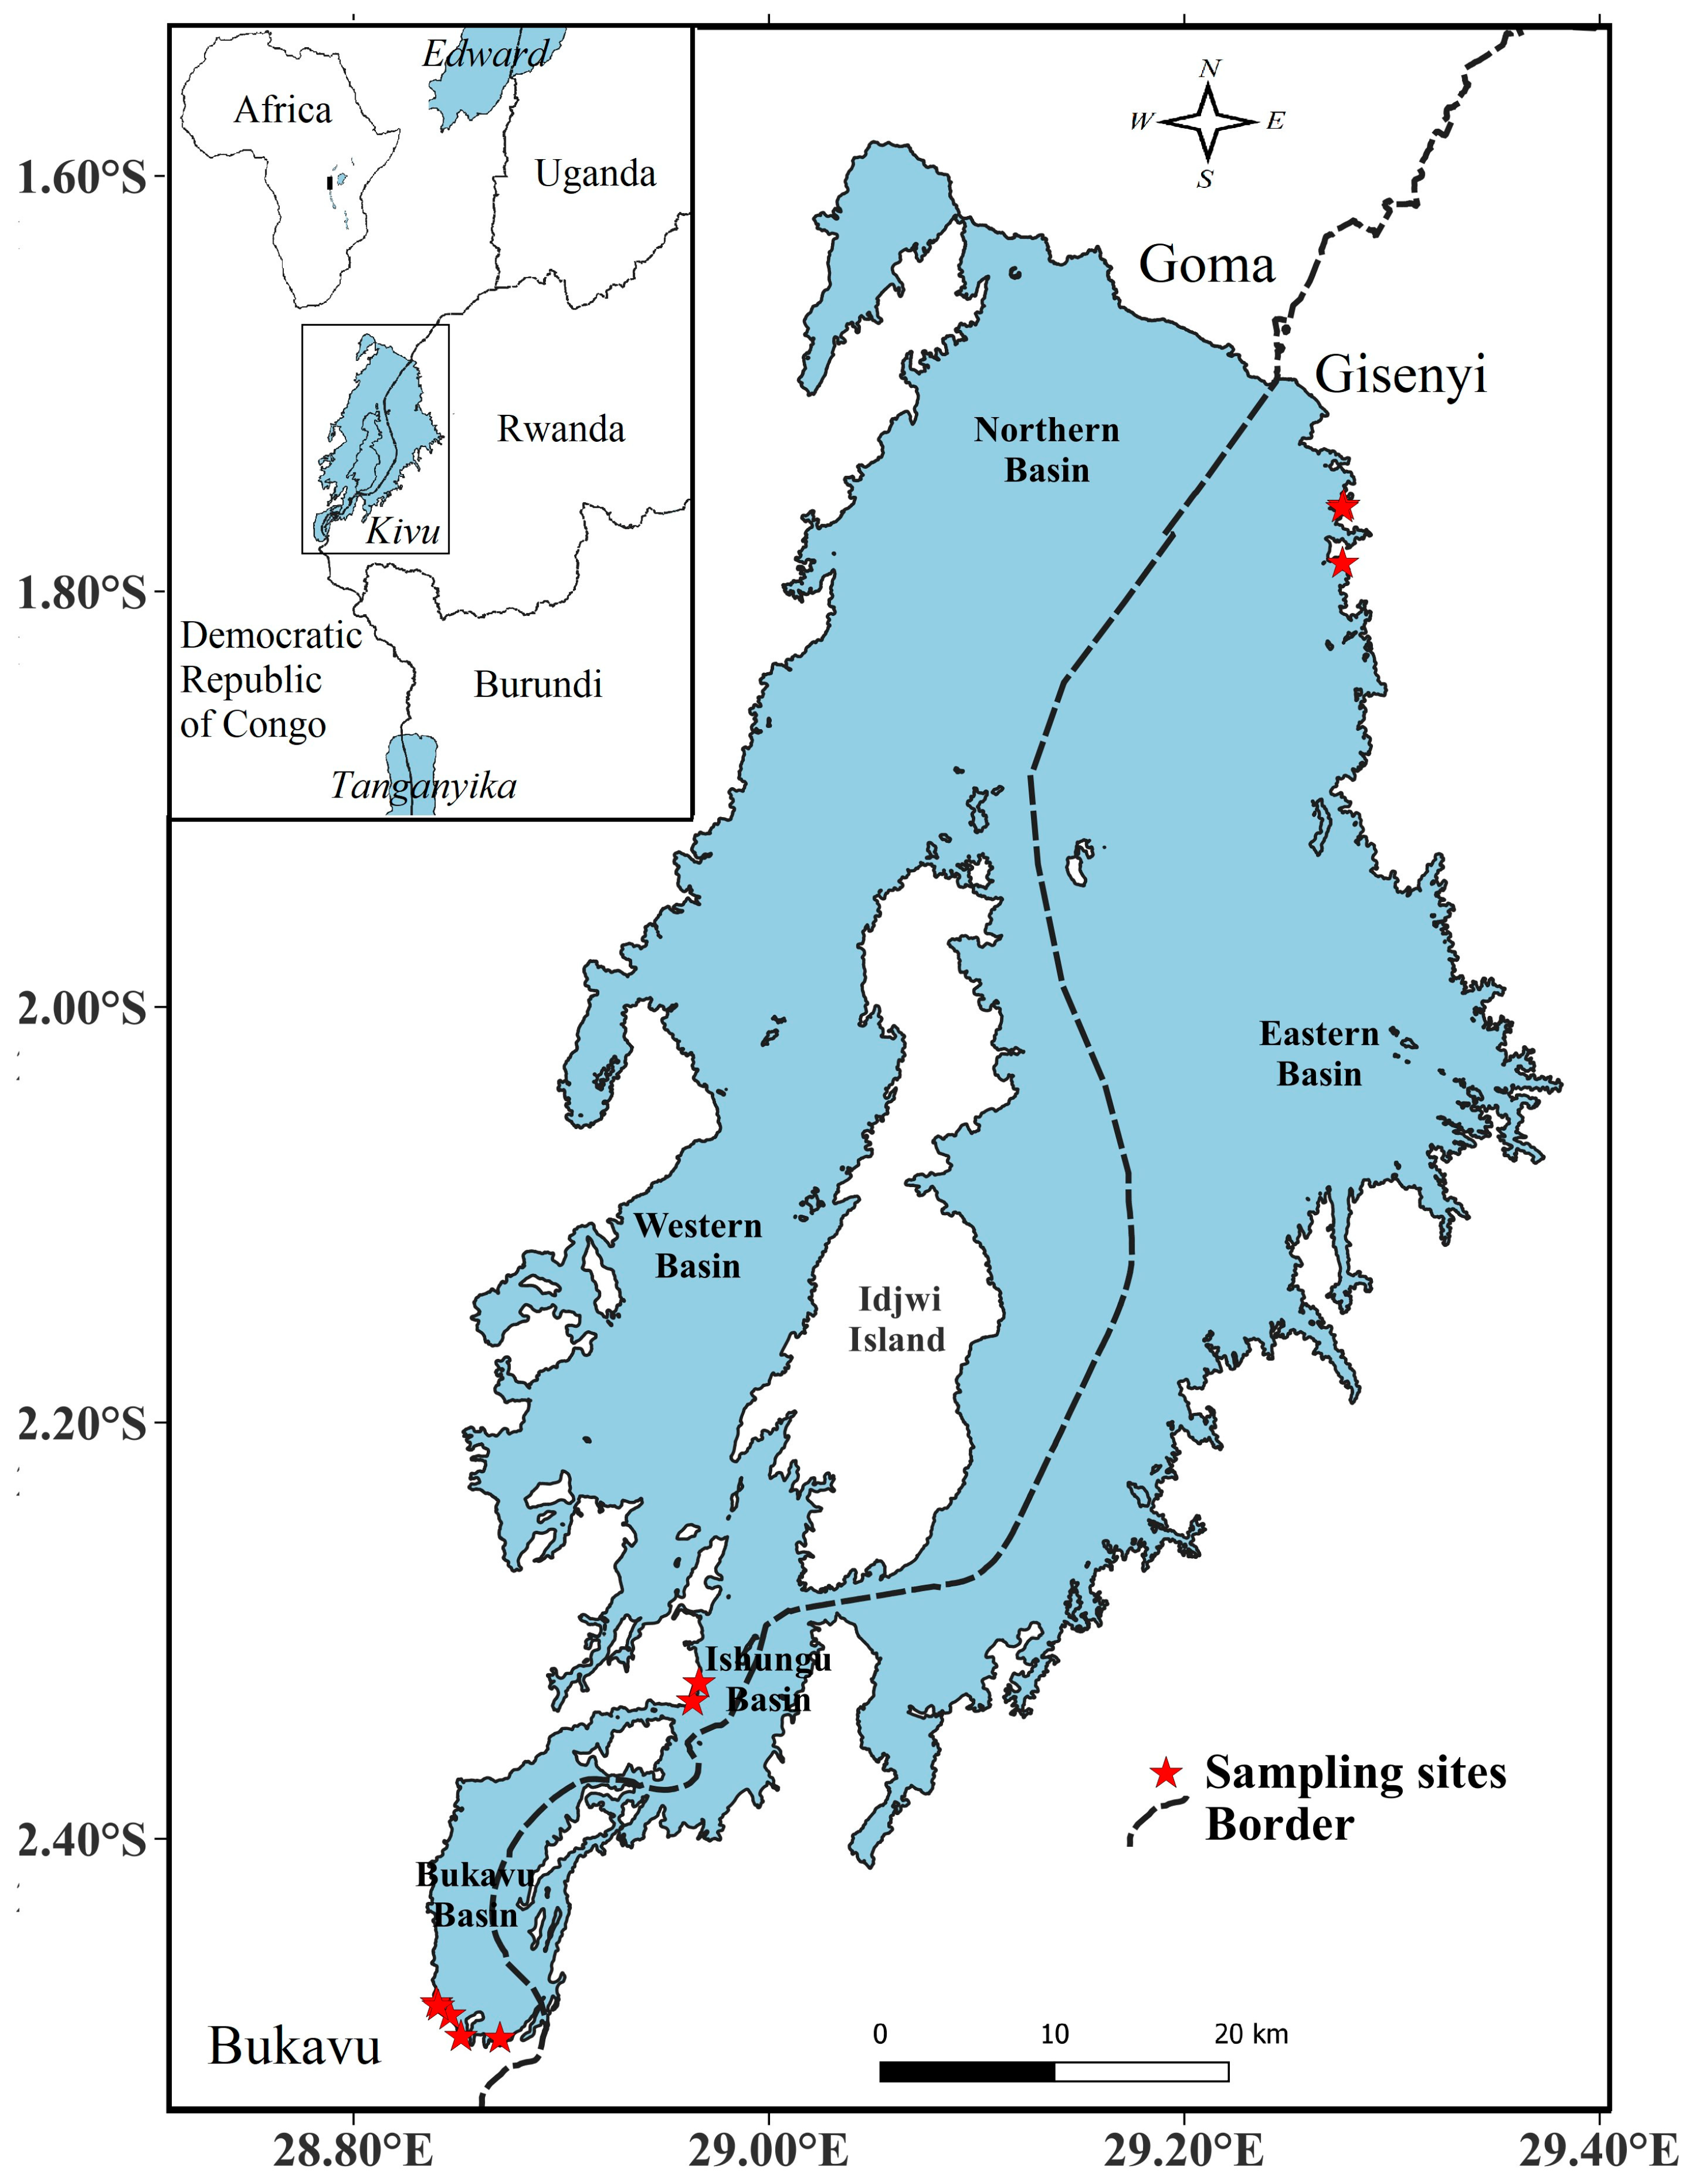
2.1. Overview of Lake Kivu

Lake Kivu is one of the smaller lakes of the African Great Lakes, with a surface area of 2370 km2 and a volume of 650 km3 (Figure 1). It lies in a deep valley, reminiscent of its volcanic origin, at the foot of the active Nyiragongo Volcano. The lake’s maximum depth is 489 m. The water column is stratified into two layers: an oxic mixolimnion of 60–65 m and a deeper monimolimnion enriched with dissolved gases, mainly methane and carbon dioxide [15,16]. The sediments increasingly feed the methane reservoir through biological and geogenic processes, leading to the accumulation of methane in this deeper layer [12,17,18]. This is evidence that Lake Kivu has a highly active and stratified microbiome, as found in some other freshwater and saline eutrophic lakes [19].

2.2. Site Description

Sites were selected in the northeastern part of the basin (near the city of Gisenyi) and the southern Ishungu and Bukavu basins (Figure 1). The selected sample sites represent the typical habitats of the littoral zone of Lake Kivu. The landscape in the north is heterogeneous and weakly affected by human activities, with large fragments of magmatic rock along the shoreline and sandy beaches in other sections where the depth moderately increases. Anthropogenic activities at these sites include bathing, household washing, and unregulated fishing. For the purpose of the diversification of habitat types, two sandy sites were included in the north basin along a 5 km distance. Macrophytes are scarce, but vegetation overhangs the shore covering the shoreline.
The shores of the southern sites are populated mainly by macrophytes, although occasional rocky patches occur along some sections of the shoreline. The Ishungu Basin is about 25 km from Bukavu, in the direction of Goma. It is, therefore, situated far from densely populated areas. Nevertheless, numerous fishermen operate in the Ishungu Basin. The Bukavu Basin is located at the southern end of the lake. Plot extension for house building over the lake waters, water transport activities, and urban pollution are recurrent impacts over this part of the lake. Most of the sites from the Bukavu Basin appeared to be highly degraded due to human activities. However, the shore of some sites was still naturally bordered by overhanging vegetation. The distribution of the habitat categories, covering the lake and the local constraints, imposed by the topography of each shore at the site influenced the selection of sites.
Fourteen sites were explored during this study, consisting of seven in the northern and seven in the southern basins (Table 1). Each site represents a particular habitat or combination of a couple of habitat types except for site 1 and 7 in the north (see below). In the north, the selection was based on the geological substrate characteristics at each site. We identified five littoral habitat types for sampling according to the dominance of one habitat or in association with some minor habitats: (1) sandy substrate, (2) igneous bedrock with submerged macrophytes, (3) igneous bedrock with riparian vegetation that overhangs the shoreline, (4) igneous bedrock mixed with sand, and (5) igneous bedrock alone. Sites (1–3) are situated in the bay, whereas sites (4–7) face the main lake body. Moreover, sites (6) and (7) were selected at ~5 km from sites (1) to (5), situated near a peninsula (Figure 1). Human activities at sites (1), (2), (4), and (7) included household washing and bathing (see Supplementary Materials: Figure S1, 1–7). Two sites were selected in the Ishungu Basin; one is characterised by macrophytes (8) and the other is characterised by a rocky shore (9). The bottom of the site with macrophytes is covered with clay, sand, and cobbles/pebbles, whereas large pieces of rock cover the site with bare bedrock (see Supplementary Materials: Figure S1, 8–9).
Five sites were selected in the Bukavu Basin. They are characterised mainly by the presence of macrophytes, but in some, macrophytes have disappeared. We included two within the five selected sites where macrophytes were cleared by human activities and one across which macrophytes and riparian vegetation were preserved (see further below). Lake Kivu’s shore is degraded by port construction, building, and pollution from households. The shore was devoid of macrophytes at site (10), presumably due to road construction. Although covered with macrophytes, site (11) receives numerous pollutants such as household and plastic waste from adjacent buildings. Site (12) was also devoid of macrophytes due to port construction. Site (13) is still covered with macrophytes at the beach near the office of the Société Nationale de Chemin de Fer du Congo (SNCC). However, the lake (water and shore) is altered by pollutants from small wooden buildings used for multiple commercial activities. Site (14) is situated at the edge of the peninsula of the governor’s palace, surrounded by a large park on Nyofu Street, where the lake is relatively pristine and covered mainly by macrophytes (see Supplementary Materials: Figure S1, 10–14).

2.3. Field Data Collection

The sampling was conducted between April 2018 and October 2019 during 14 sampling campaigns. A total of six and four sampling events were conducted in the north and south, respectively. Sampling of fish specimens was conducted during the daytime in both basins.
Twelve habitat variables, including the physico-chemical parameters, depth, type, and percentage cover of each substrate (clay, sand, cobbles/pebbles, or boulders), and macrophytes rooted in water and the coverage of riparian vegetation were assessed and collected from each site. Water temperature (°C), pH, dissolved oxygen (O2, mg/L), and conductivity (µS/cm) were measured in situ using a field multi-probe (Thermo Scientific Orion, sn G03427, Indonesia). Six depth measurements, including three taken during net dropping and three during net retrieval (one at each extremity and one in the middle of the net), were taken using a PlastimoEchotest II, 59588, and the mean depth was calculated and used for the analyses. The water transparency (cm) was measured in situ using a Secchi Disk following the same approach used for the depth measurement.
The coverage of macrophytes rooted in water in percentage consisting of either Phragmites spp., Scirpus spp., or, more rarely, Cyperus spp. was estimated along the distance of 30 m covered with the net. The percentage of vegetation cover over the site, i.e., from the shore to deep waters at about 5 m, was determined by eye along the shoreline of each site. Such a cover is the effect of riparian trees overhanging the shore. The type and percentage cover of each substrate, including clay, sand, cobbles/pebbles, and a large piece of rock/boulder, were determined separately and estimated along the section covered and on both sides of the net from the shore to about 5 m in open water in each site. A surface of 150 m2 (30 m × 5 m) was covered during the substrate composition assessment by eye at the surface and, when necessary, during diving.
A gillnet of multiple mesh sizes consisting of 8, 10, 12, 20, 30, and 50 mm covering each one with a length of approximately 5 m was used for fishing at each site. The net measures 30 m in length and 1.5 m in height. The nets were soaked between 6:00 a.m. and 8:00 a.m. and retrieved between 2:00 p.m. and 4:00 p.m.
Fish specimens were identified at the species level according to Snoeks [2] and Snoeks et al. [4] and counted. Specimens found live in the nets were anesthetised using clove oil before identification. Some specimens were preserved in the collection room of the ISP of Bukavu and the CRBEC for other studies.

2.4. Statistical Analyses

The consistency of occurrence (C, %) for species “i” was calculated using the formula C = (ni/N) × 100, where ni is the number of sites where the species “i” was reported and N is the total number of sites (e.g., [20]). Based on the values, a classification scheme of the species consistency was applied for each site: euconstants > 75%, constants 50–75%, subconstants 30–50%, accesoric 15%–30%, and accidental taxa < 15% [21].
Analysis of variance (ANOVA) was used to compare variances of physico-chemical parameters (i.e., temperature, conductivity, dissolved oxygen, and pH) between sites from the north and south to determine whether or not they could be ordinated together (results not shown). If all physicochemical parameters were significantly different among the northern and southern sites, the data from these sections of the lake could only be ordinated separately. This was not the case. Thus, both datasets were explored consecutively together and individually.
The total abundance of fish at the sites was tested using the non-parametric Kruskal–Wallis test followed by a Mann–Whitney U test with Bonferroni correction (KW/MWU/BC) to explore the effect of sites and sampling occasion on the abundance distribution [22]. Non-parametric tests were applied to the abundance data because the variance was different among the sites. As the sampling effort was different between the north and south basins, the total number of specimens obtained during the six sampling events in the north basin was divided by four sampling campaigns completed in the south basin to allow for unbiased comparisons.
All univariate analyses and parametric and non-parametric tests were performed in Statistica 12 and Past 3 using Bonferroni correction for multiple comparisons [23]. Significant differences in the significance levels were simply referred to as ‘difference’ to smoothen the text flow.
Two indices were used to characterise the fish assemblage across the sites: Hill N1 (HN1) and Jaccard similarity (JSI). Hill N1 is derived from a transformation of the Shannon–Weaver index. Furthermore, HN1 is sensitive to the number of species reported at a site [24,25]. Since HN1 derives from H, it assesses the entropy and the distribution of specimens between species (see [26,27]). The similarity between the basins was assessed using the Jaccard similarity index (JSI) as a percentage, which compares the presence or absence of species between two communities without being influenced by the density of individual species (e.g., [28]).
Furthermore, site characterisation and the exploration of fish distribution with habitat variables across the sites were conducted using a multivariate approach, including principal component analysis (PCA) and redundancy analysis (RDA). The former provided a general pattern of fish distribution across the sites, while the latter sought to give the output of an ecological model of fish distribution in Lake Kivu. Principal component analysis plots were used to explore the fish and habitat datasets to highlight the relationships between the habitat variables (i.e., potential habitat predictors) and fish-community indices. Principal component analysis is often used together with redundancy analysis to explore the dataset of species and environmental variables (e.g., [29,30]). Principal component analysis ordination is an explorative approach capable of detecting orthogonal space links between habitat variables and communities. Principal component analysis is an unconstrained approach that reduces the dimensionality of a large dataset and increases interpretability while simultaneously creating new uncorrelated variables that maximise variance [31].
Five separate PCA plots were used to explore: (1) habitat variables across sites in the north and south (Figure 2a); (2) the distribution of species across sites (Figure 2b); and (3) the assemblage of sites based on the habitat variables and their fish communities (Figure 2c). Additionally, the PCA plots were computed independently within (4) the north (not illustrated as similar as that seen in the plot obtained in the third ordination) and (5) southern basins (figure illustrated: Figure 2d). The separation of the datasets of the northern and southern basins was justified owing to the different ecological landscapes of the shoreline between the northern basin and southern basins.
The significance of the habitat variables in the current pattern of fish distribution as observed in the PCA, i.e., the variables that are likely suitable for the fish fauna in Lake Kivu, was assessed using the linear RDA model [29,30,32,33]. The model was selected after a dendritic canonical correspondence analysis, which indicated the gradient length (<3). The selection of predictors was refined by using forward selection following the method of Blanchet et al. [34]. The significance of the RDA models was computed with Monte Carlo permutations (n = 999). Significant variables were retained using backward selection followed by forward selection. Three datasets were generated, on which we computed a series of RDAs: the datasets containing all species and predictors and successively on the dataset of the northern basin and the dataset of the southern basins. The latter two analyses sought to test whether the selected variables from the general analysis were similar, while the north and south diverged on the characteristics of the lake shore type. Twelve habitat variables were included in the first PCA and RDA conducted for the lake as a whole. The habitat variables used in the overall analyses were similar to the number of habitat variables used for computing the RDA on the dataset from the southern section of the lake (Ishungu and Bukavu basins). Only ten habitat variables were included in the dataset of habitat variables from the north for running both the PCA and RDA, as the northern sites were not generally covered with clay and cobbles/pebbles. For the PCA and RDA, temperature, conductivity, pH, dissolved oxygen, and depth were log-transformed. In contrast, the data on the substrates and macrophyte coverage in percentage were square-root arcsine transformed to reduce the large range of differences between the raw data. The matrix of species composition was Hellinger-transformed to improve the efficiency of ordination with the community quantitatively obtained: this approach provides suitable results in a Euclidian-based distance ordination [30,33,35]. The community data used for both PCA and RDA models were Hellinger transformed.
Multicollinearity among variables was assessed before running the RDA model. A variance inflation factor (VIF) cut-off value was used [36,37,38]. Sand and rock were needed in the RDA exploration as they, on the one hand, are the frequent and dominant substrate in the north, and, on the other hand, the absence of one notably reduced the VIF (see Results). In the north basin, three RDAs were computed, including the first with the entire dataset and the second and the third including sand and rock, respectively. In the southern basins, we noticed an increase in the VIF upon the substrate in the model regardless of our attempts to remove the most inflated variables. Finally, sand and rock were completely removed, and the final RDA in the southern basins was computed on the ten remaining variables. Furthermore, three species were removed from the PCA and RDA from the south because they were absent from this basin. The RDA model was run in R version 3.6.1 using the rda function of the Vegan package [39]. Principal component analysis plots were created in CaNOCO 4.5 [29,40].

3. Results

3.1. Fish Distribution within the Littoral Zone of Lake Kivu

A total of 18 species were collected belonging to four families, including Cichlidae, Clupeidae, Cyprinidae, and Procatopodidae. The Cichlidae was represented by 15 species, among which 13 were Haplochromis species (Table 2). The remaining families were represented by a single species only. Lamprichthys tanganicanus, an introduced species, and Haplochromis scheffersi were widely distributed over the sites.
The species richness in the north and the south basins was highly dominated by the Haplochromis species and L. tanganicanus. In contrast, Limnothrissa miodon, Enteromius kerstenii, Oreochromis niloticus, and Coptodon rendalli were scarce in the northern basin. Instead, L. miodon occurred more frequently in the sites of the south than in the north basins. It was once reported at site (2), similar to the Cyprinidae at site (4) and C. rendalli at site (7). Oreochromis niloticus was once observed at sites (4), (5), and (7). Enteromius kerstenii, C. rendalli, and H. insidae were absent from the southern basins.
The fish diversity appeared slightly higher in the north basin than in the southern basins, with 17 vs. 15 species from the south as a whole, where 12 and 13 species were identified from the Ishungu and Bukavu basins, respectively (Table 2). The sites dominated by rocky substrates (2, 3, 4, and 5) appeared to be the most diverse, with them harbouring higher species richness. Twelve species were identified from the Ishungu Basin in the south, where both sites (8) and (9) harboured nine species. In the Bukavu Basin in the south, 13 species were identified. Site (11) in Kalengera had seven species only, while ten species were found in sites (12) and (13) along the SNCC beach.
Lamprichthys tanganicanus and H. scheffersi were euconstants in Lake Kivu, i.e., collected at all sites (Table 2). In addition, H. astatodon, H. microchrysomelas, and H. olivaceus were euconstants from the whole lake, while H. crebridens, H. gracilior, H. graueri, and H. vittatus were constants. From the northern sites, additionally, H. astatodon and H. olivaceus were euconstants. Haplochromis adolphifrederici, H. crebridens, H. gracilior, H. microchrysomelas, H. paucidens, and H. vittatus were constants. From the southern sites, H. microchrysomelas, and H. vittatus were euconstants, and L. miodon, H. astatodon, H. crebridens, H. graueri, and H. olivaceus were constants.

3.2. Fish Abundance at the Sites

3.2.1. Quantitative Approach

A total of 2673 specimens were sampled. By standardising the number of specimens with respect to the sampling efforts (see the Materials and Method section), the number of specimens was high in the north (1087 specimens adjusted from 1631) compared to the south, where 639 and 403 specimens were collected in the Ishungu and Bukavu basins from the south, respectively. Nonetheless, the number of specimens at the Ishungu site with a rock habitat was higher (417 specimens) than in the remaining habitat categories (Table 2). Both sandy sites had the lowest number of specimens in the northern sites, with 36 at site (1) and 46 specimens at site (7). In contrast, the highest number of specimens was found at sites covered partially or totally with a rocky bottom surface ((398, 377, 304, 251, and 219 specimens at sites (3), (6), (5), (4), and (2), respectively)).
In the southern basins, the fish species were distributed differently between the Ishungu and Bukavu basins (Table 2). The site from Ishungu covered with rock (9) had a total of 417 collected specimens, the site from the Governor’s park at Nyofu (14) dominated by macrophytes had 231 specimens, and the site from Ishungu with macrophytes (8) had a total of 222 collected specimens. The remaining sites had a low number of specimens regardless of the characteristics of the littoral zone at those sites.
The fish abundance at site (1), covered mainly with sandy patches, was different from that of sites (2, 4, and 5) in the north and site (14) in the south. The abundance at site (2) covered with rocks and macrophytes was different from site (7) in the north and sites (10, 11, and 13) in the southern section. The abundance at site (4), with rocks mixed with sand, was different from site (7) in the north and sites (10 and 11) from the southern section. The abundance of fish at site (14), covered with macrophytes, was different from site (7) from the north (Table 3).

3.2.2. Diversity Indices: Hill N1 and Jaccard Similarity Index

The fish composition and abundance indicated different structures between the north and south (Table 4). A lower value of HN1 suggests the dominance of a species or a few species, whereas a greater value of HN1 suggests that the abundance of individual species oscillated in the same range. In the northern basin, the three sites covered with rocks as the main substrate (6, 3, and 5) had low HN1 (HN1 = 1.31, 1.39, and 1.69, respectively). These results underpinned the dominance of fewer species, principally L. tanganicanus. Instead, sites (1) and (7) had HN1 values of 5.10 and 4.62, respectively. No species was dominant at these sites. The HN1 value at site (2) was 4.01. At the Ishungu site with a rocky bottom, the HN1 value was 1.48, lower than 2.75 at the Ishungu site with macrophytes. In the Bukavu Basin, the HN1 values ranged between 1.92 (site 14) and 7.24 (site 13). At site (14), L. tanganicanus was abundant. The JSI between the north and south basins reflected high homogeneisation of fish species between these two communities, with about 78% of the JSI representing 14 common species. Between the north and Ishungu basins, the value was 61%, and the value for the north and Bukavu was 67%, representing 11 and 12 shared species, respectively. The similarity between Ishungu and Bukavu was about 67%, consisting of 10 common species.

3.3. Patterns and Factors Influencing Fish Assemblage in the Littoral Zone of Lake Kivu

3.3.1. Characterisation of Key Habitat Parameters at Each Site

An ordination of habitat variables over the different sites indicated two clusters on the first axis (PCI) and about three clusters on the second axis (PCII) (Figure 2a). The sites from the southern basins, excluding that of Ishungu Basin with laid bare bedrock at the shore (site 9), are mainly situated at the positive side of the first axis, where notably macrophytes, clay, cobbles/pebbles, and, to a lesser degree, pH are associated (Figure 2a). The remaining sites occupy the second cluster on the first axis (PCI).
Site (9) from the Ishungu Basin occupies an intermediate position. Conductivity, depth, and transparency were also revealed to be important habitat variables influencing the sites from the southern basins. Still, their effect seems to be strong at site (9), which is characterised by rock substrate in the Ishungu Basin.
The sites from the northern basin are split into three groups along a gradient following PCII, comprising: sites (3), (5), and (6), which are dominated by a rocky bottom as the main substrate and situated on the negative part of PCII close to site (9) from the Ishungu Basin with rocks too as the main substrate. Sites (2) and (4) contain rock mixed with other substrates, such as sand representing 60% at site (4) and macrophytes representing 20% at site (2) (Table 1). This second cluster is near the centre of the positive and negative parts of PCII. In this cluster, there are also sites (1) and (7) situated, as well as the remaining part of the sampling replications at site (4), representing sites where sand has been recorded as the major substrate. Cover of riparian vegetation overhanging the shore over sites with large coverage of laid bare bedrock at the shore (sites 3, 5, and 6) are also important.

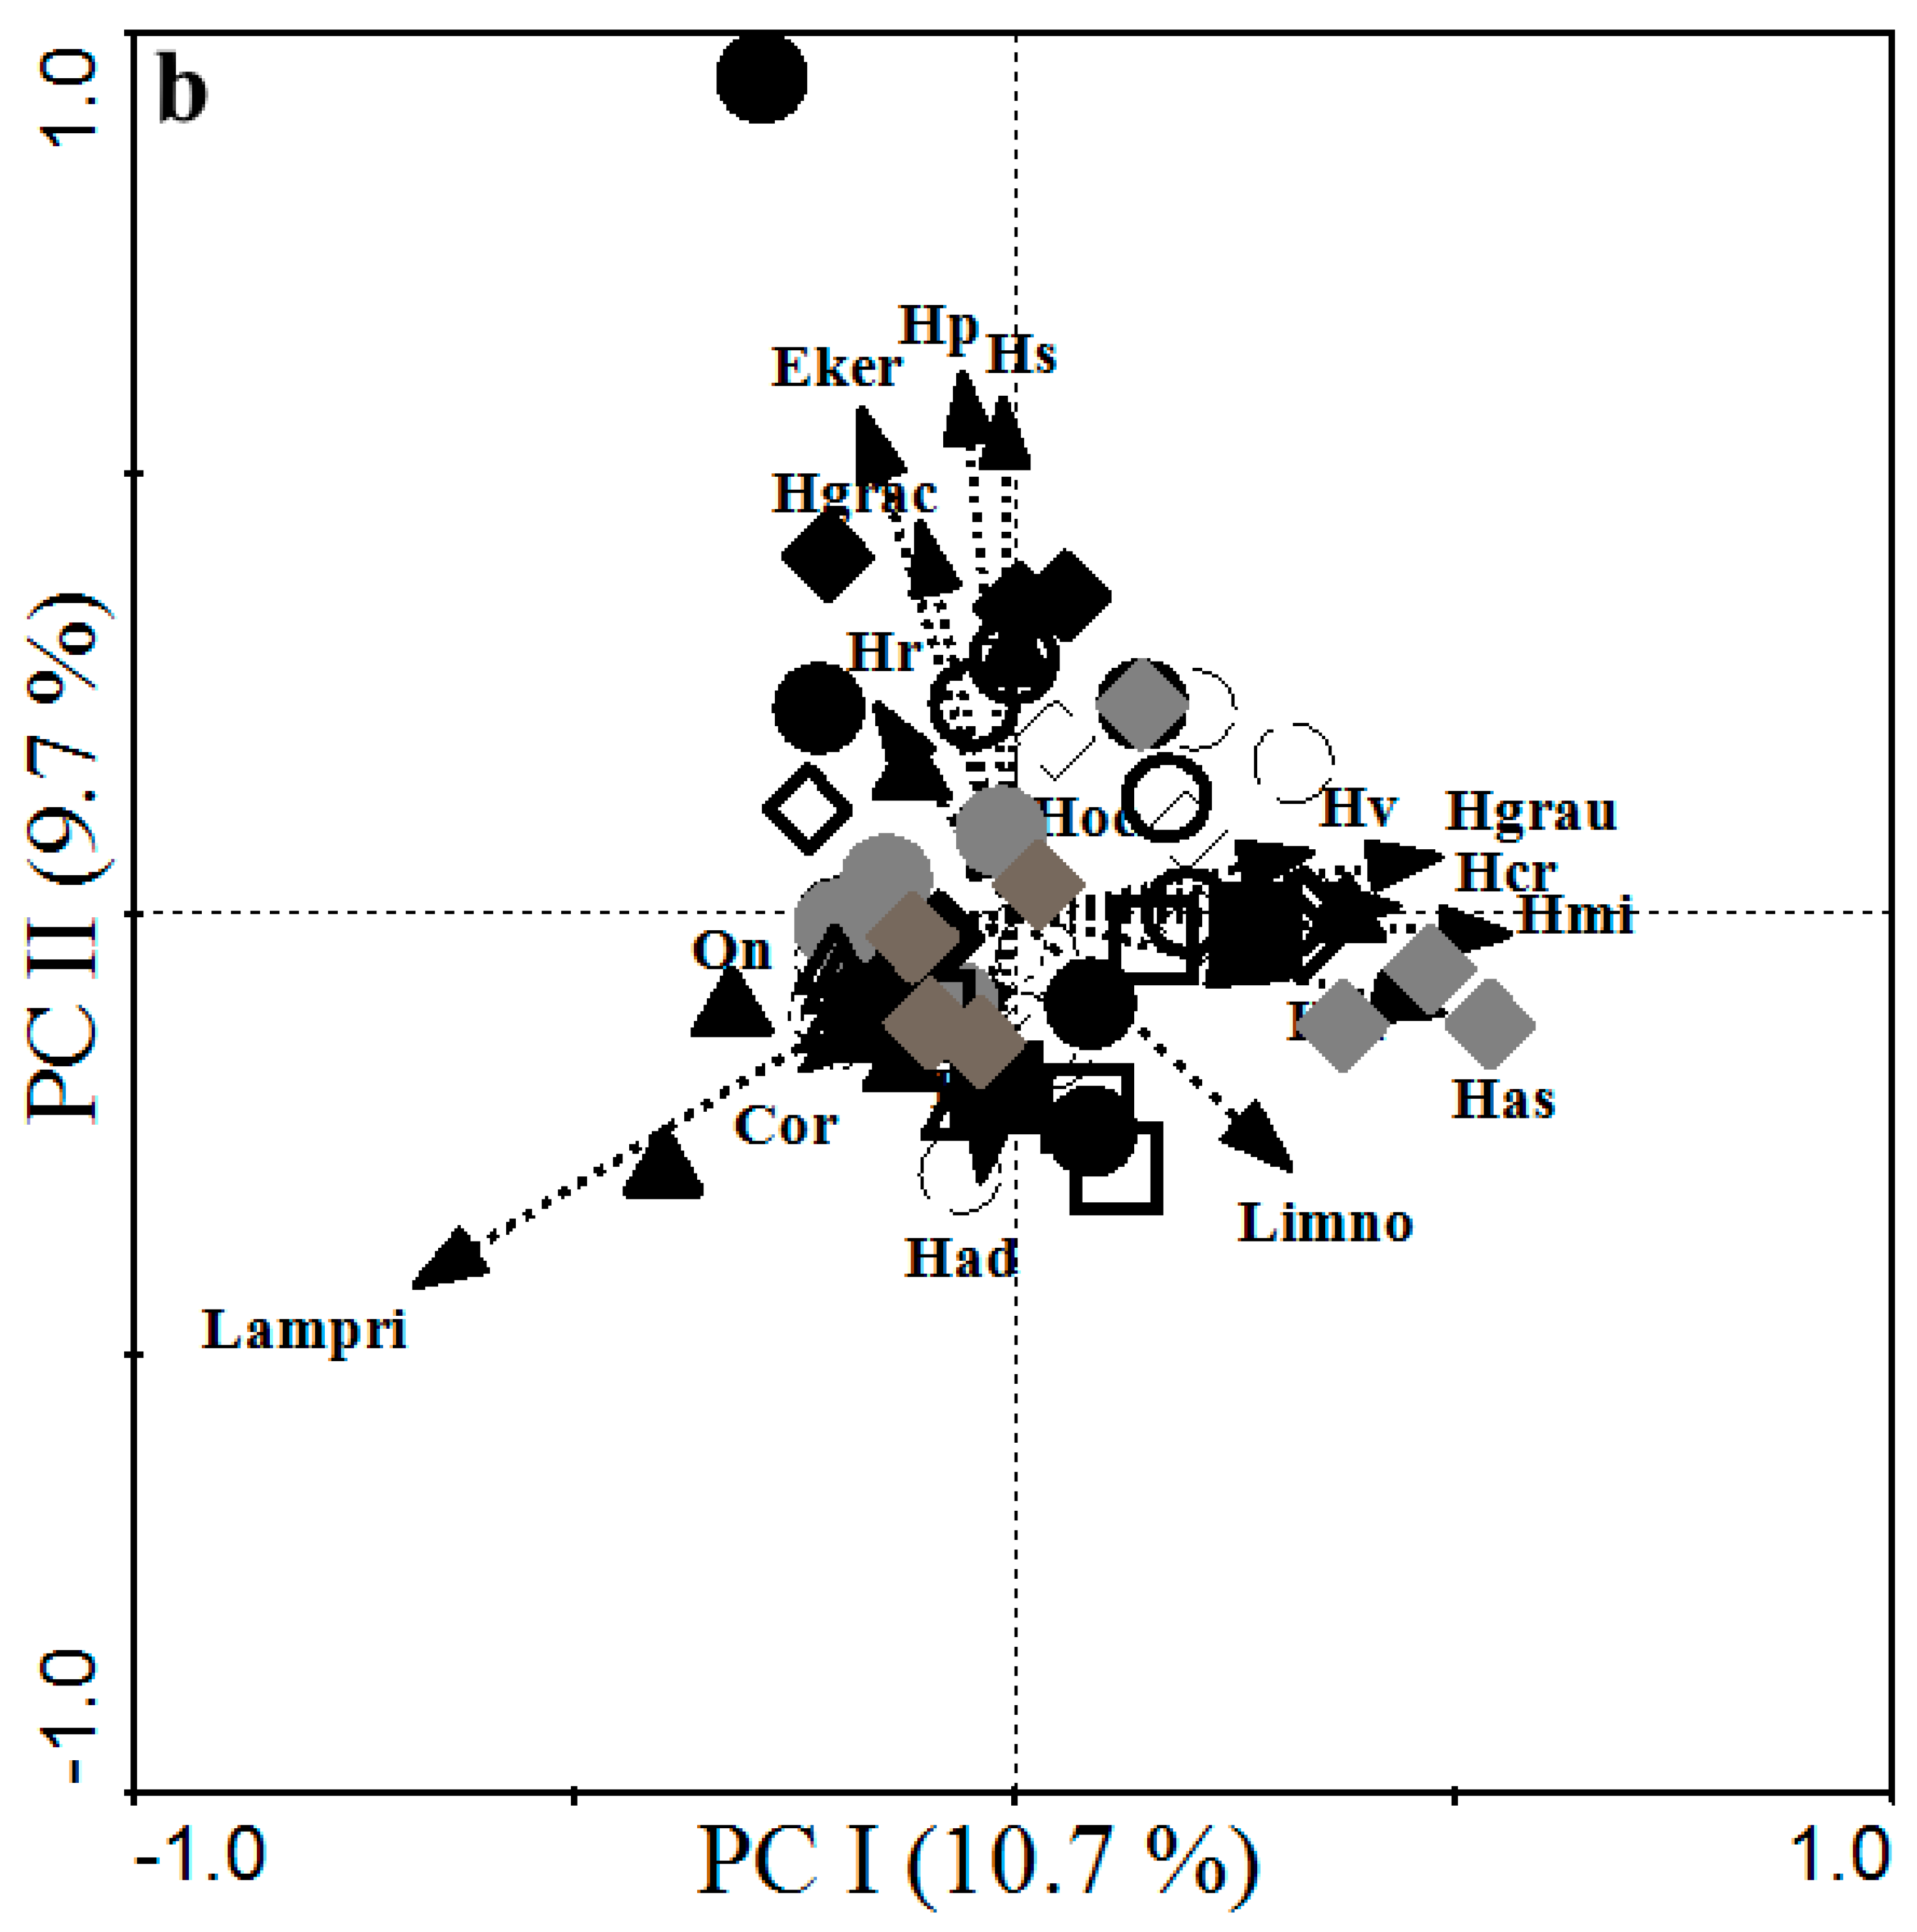
3.3.2. Fish Taxa and Habitat Type Correlated Weakly for Indigenous Species but Strongly for Invasive Species

The ordination of the dataset of fish communities across the sites resulted in unsegregated clustering (Figure 2b), suggesting high homogenisation of species occurrence and abundance across the sites. However, L. tanganicanus seemed to be associated with several sites as addressed below.
Subsequently, another PCA was performed on the dataset of the fish communities and habitat variables (Figure 2c). Clusters of species distribution and abundance over the sites were detected. The dominance of L. tanganicanus across all sites (2–6, 9, 12, and 14) was influential for the present species and sample ordination. This species is clearly situated on the negative side of PCI, where also are situated some sites from the north and some from the south, such as site (14). The shore of these sites, excluding the southern ones, is dominated by laid bare bedrock, and a rocky substrate covers the bottom. The water is deeper and has a high degree of transparency, and the shore is populated by important coverage of overhanging riparian vegetation and seems to be relatively well-oxygenated and warmer (Supplemental Materials: Table S1). In contrast, site (14) is dominated by macrophytes (see Table 1). Instead, the macrophytes moved apart from the cluster that belongs to the site (14) in Figure 2c due to the high relationship between the sites (2 to 6 and 14) where L. tanganicanus was abundant. The sandy patch sites (1 and 7) are situated in the positive part of PCI, where sand is the dominant substrate, an opposite position relative to the major cluster comprising the north’s sites. Such a structure (clustering) reflects the impressible abundance of L. tanganicanus over the remaining species at these sites. The remaining sites from the south (10 to 13) are scattered mainly over the opposite side of the position of L. tanganicanus, denoting the lack of dominance of species over the concerned sites (Figure 2c).
Given the unclear segregation of the southern sites and their fish communities in the PCA (Figure 2c), two PCAs, on both datasets, i.e., from the north and south, were computed separately. The species cluster over sites in the north basin computed on the dataset from the north basin only did not change from that obtained in Figure 2c. Therefore, the plot is not shown. However, from the southern Bukavu and Ishungu basins, the investigated sites are weakly segregated using habitat predictors (Figure 2d). Although the general picture of the species over the habitat variables is comparable with that obtained from Figure 2c, the influential effect of the habitat variables on fish communities across the sites slightly changed. Most southern sites are situated on the negative part of PCI, where L. tanganicanus is located. The habitat variables were not strongly associated with this species, but a rocky shore and transparency could be regarded as the most influenceable (Supplementary Materials: Table S1). In addition, vegetation cover, namely transparency, depth, and rock, might have contributed to the observed pattern. The Haplochromis species were not well segregated, lacking good differentiation across specific sites.

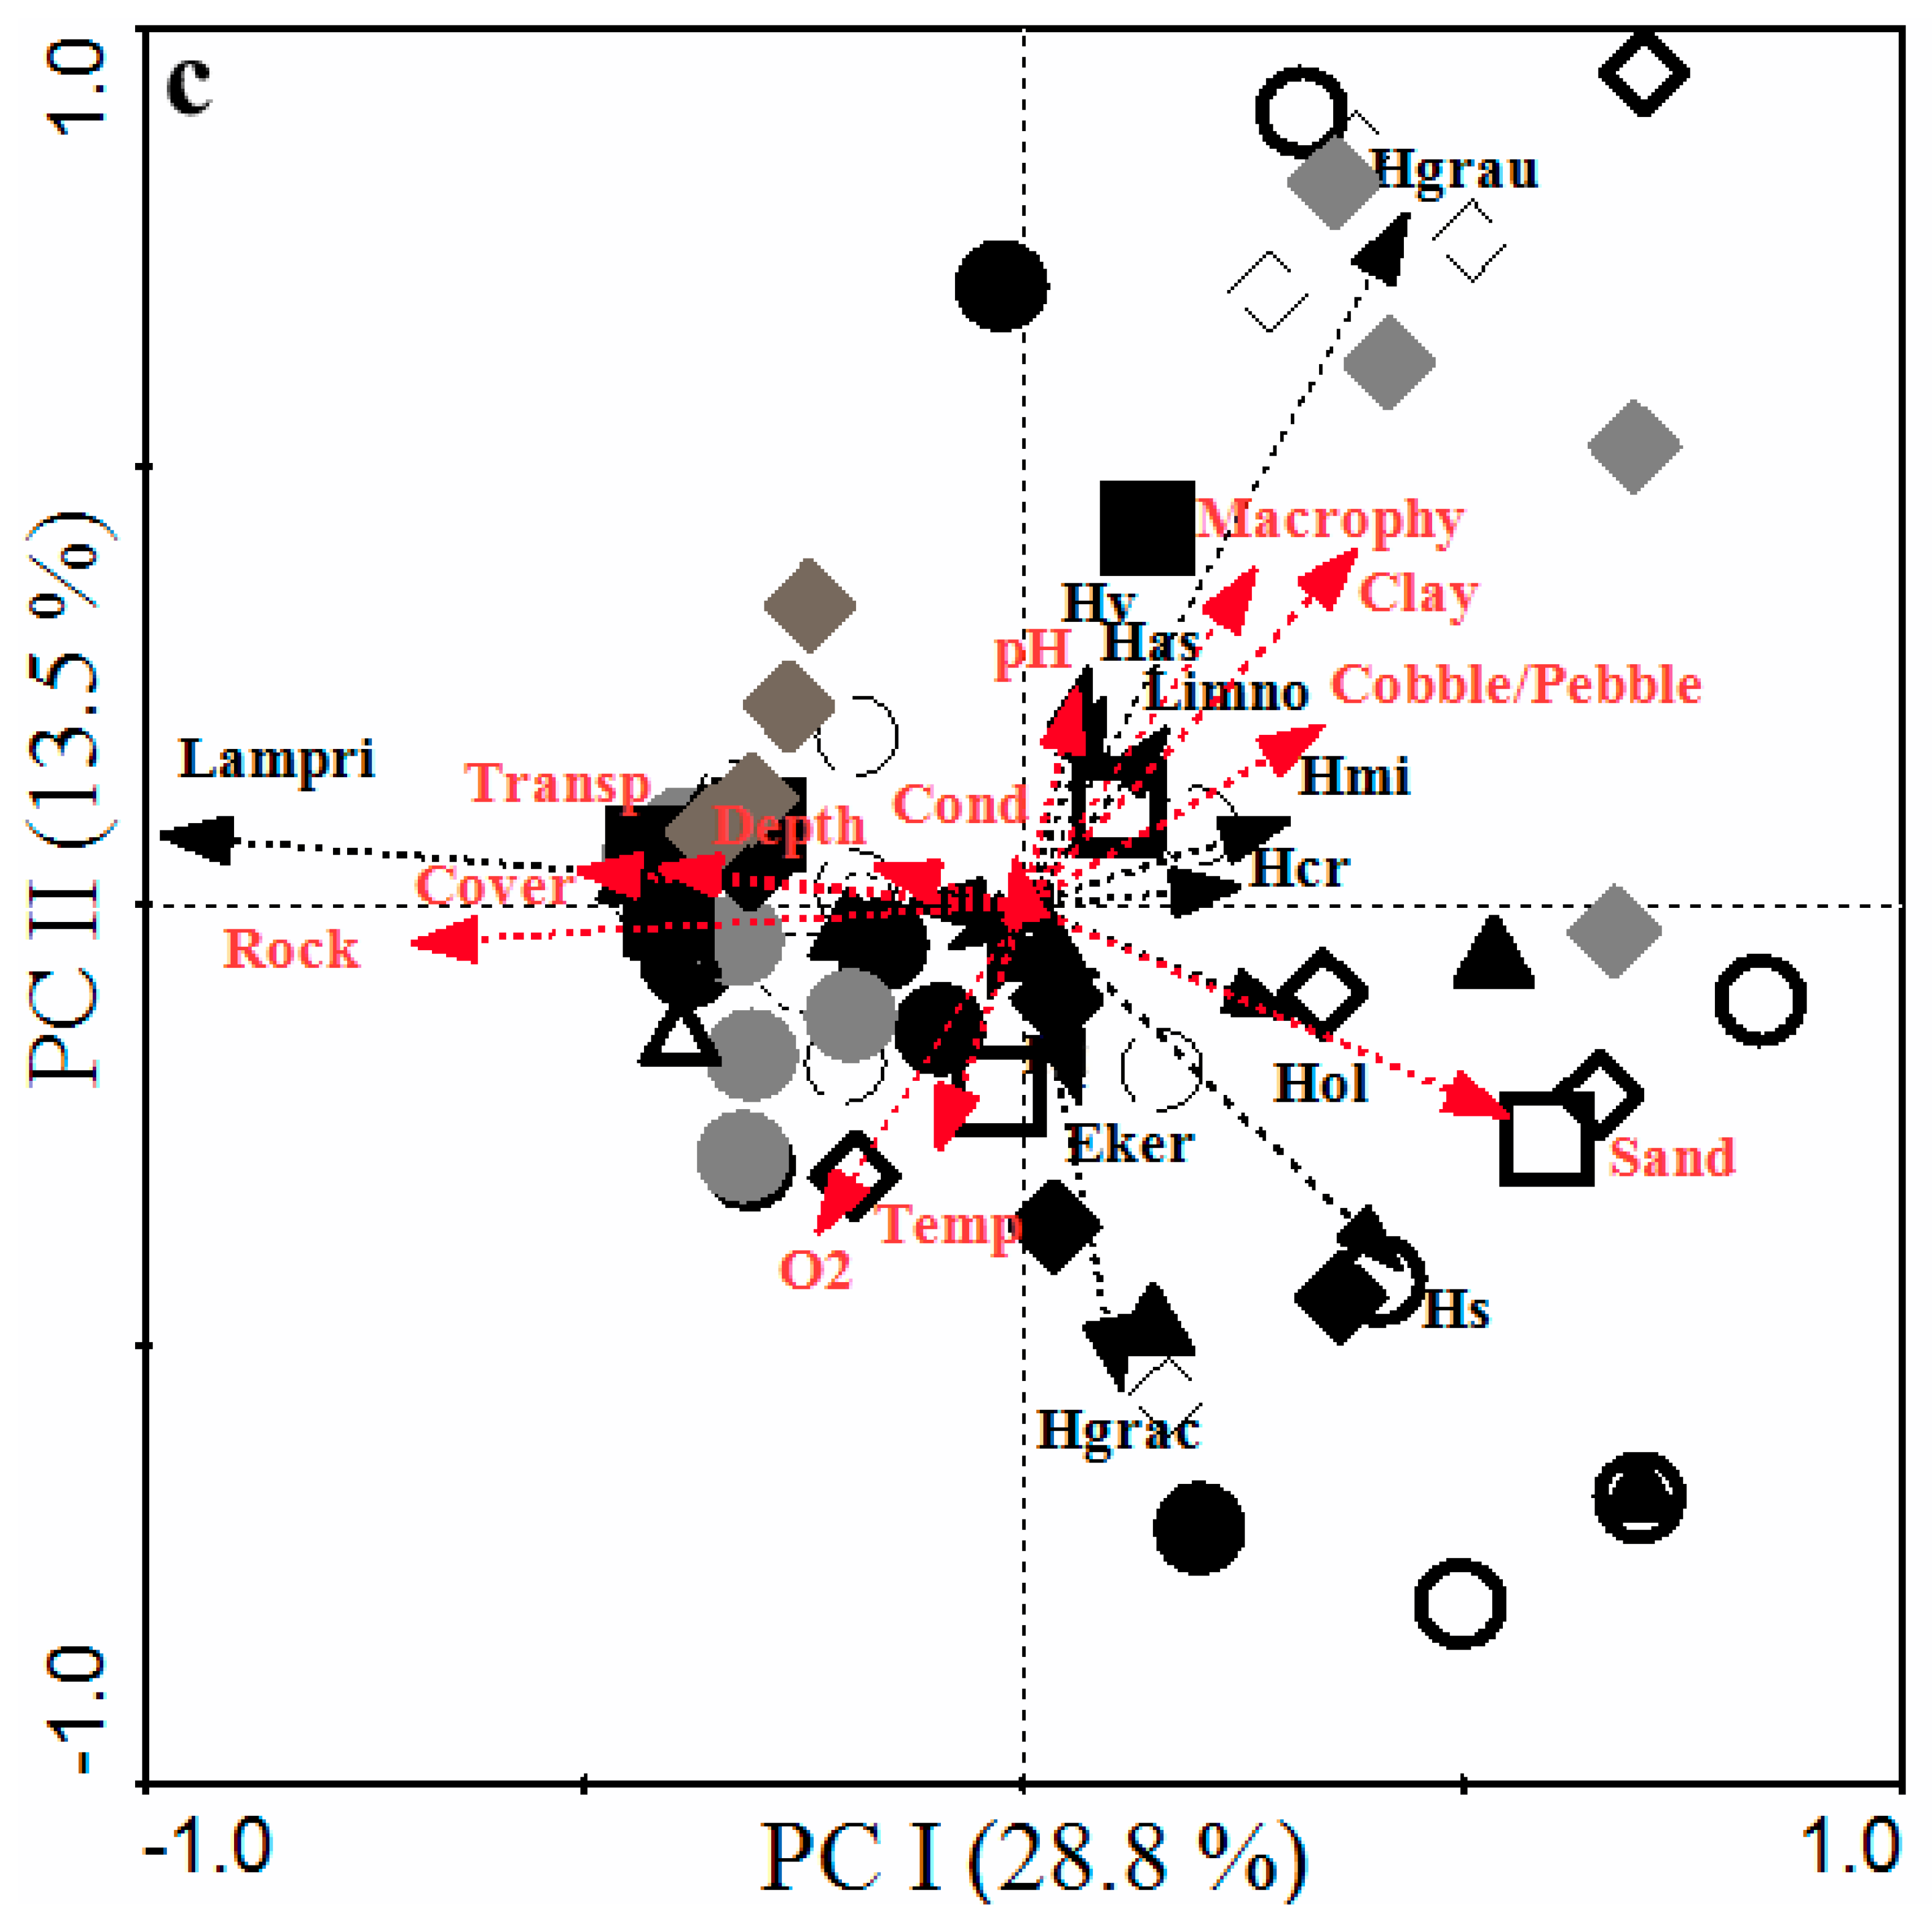
3.3.3. Habitat Variables Influencing the Fish Community in Lake Kivu Using the RDA Model

RDA models were implemented on the full dataset to assess the significant effects of the habitat variables influencing fish abundance. Multicollinearity was detected for the data at the lake scale on the sand and rock variables (27.7 and 56.4, respectively). Indeed, the presence of rock denotes the absence of a sandy patch. After removing these variables, the VIF values on the remaining variables ranged between 1.1 and 4.8. The RDA model was significant (R2 adj = 0.19; p = 0.001). After forward selection, transparency (p = 0.001), vegetation cover (p = 0.002), dissolved oxygen (p = 0.004), clay (p = 0.008), depth (p = 0.023), cobbles/pebbles (p = 0.031), and temperature (p = 0.042) were revealed to be significant. Furthermore, in the two RDAs where sand and rock were separately added to reduce the VIF (the VIF varied between 1.0 and 5.0), both variables were also revealed to be important (p = 0.001 for sand and rock each). The RDA was significant (R2 adj = 0.2; p = 0.001 for both RDA models) with sand and rock separately. Nevertheless, macrophytes were revealed to be an additional important variable (p = 0.047) in the RDA model with rocks. The eigenvalues on RDA axis I and axis II were 9.3 and 5.3% for the RDA model with sand and 9.2 and 3.3% for the RDA model with rocks, respectively.
Subsequently, we tested the potential differential effects of habitat variables on the fish community separately in the north and south basins using two separate RDA models. From the north, the variables sand and rock were collinear (VIF: 26.0 for sand and 35.8 for rock). For the remaining variables, the VIF was less than 3. From this RDA model, the inflated variables shaded the stepwise selection of important variables. Consequently, separate RDA models, including only sand and rock alternatively and consecutively, were performed to refine the selection of habitat variables in this basin. Excluding sand, the VIF was decreased for all habitat variables (<4). The eigenvalues were 10.8 and 4.0% on RDA axis I and axis II, respectively. The model was significant (R2adj = 0.3; p = 0.001). Conductivity, depth, rock (p = 0.001), dissolved oxygen (p = 0.004), and transparency (p = 0.009) were revealed to be significant. These variables were steadily significant even when including sand which also proved to be significant.
In the RDA executed on the dataset of the habitat variables and fish community from the southern basins, clay, cobble/pebble, and sand were highly inflated (VIF 29.7, 64.0, and 125.7, respectively). Removing one of the most inflated variables in the model influenced the remaining variables, thus becoming highly inflated and adding some other inflated variables, such as rock coverage (4527.1). Such a VIF was alleviated in the RDA by excluding sand and rock completely (VIF < 4). The model was significant (R2adj = 0.24; p = 0.001). The eigenvalues on RDA axis I and II were 11.1 and 5.0%, respectively. The forward selection indicated that dissolved oxygen (p = 0.008), vegetation cover (p = 0.011), depth (p = 0.015), and conductivity (p = 0.031) were significantly contributing variables.

4. Discussion

4.1. Fish Diversity in Lake Kivu

4.1.1. Species Occurrence

In the present study, we detected 18 fish species out of the 29 reported by Snoeks et al. [4] in Lake Kivu. Nevertheless, two of these lacking species notably, H. kamiranzovu Snoeks and Thys van den Audernaerde, 1984 and Oreochromis macrochir (Boulenger, 1912), an introduced species, were reported by Joyeuse [41] in the northern part of the lake based on night fishing events. Collating all these species together, we may conclude that only Haplochromis nigroides (Pellegrin, 1928) was lacking from the northern basin among the Haplochromini. Indeed, the species has apparently been scarce since almost three decades ago [2]. The author documented the taxonomical variation of this species using the specimens found in the collection materials reported during the Kivu Edward Albert’s expeditions (1952–1953). Cypriniform species such as Enteromius apleurogramma (Boulenger, 1911), E. pellegrini (Poll, 1939), Labeobarbus altianalis (Boulenger, 1900), and Raiamas moorii (Boulenger, 1900) were also lacking in our catches. These species are scarce in the water body of the lake. The two minnows (Enteromius) are frequent in the affluents of the lake [28], while the two latter frequently occur in the Ruzizi outflow [42].
Furthermore, we have not yet observed a specimen of the loach catfish species (Amphilius) during our sampling occasions in the main waterbody of Lake Kivu in the almost 15 years we have been working on the fish fauna of Lake Kivu. Although an Amphilius species is known in Lake Kivu [4], most amphiliids occur in upland streams with clear waters or large rivers with moderate flow and across rocky habitats [43]. We presume that the species might be scarce in Lake Kivu; sensu stricto, instead, it would seldom occur in affluents of the lake, although explorations along the western lake branch did not support this because the species was lacking during five years of exploration completed by the authors [28].
Similarly, the clariid and one cichlid species were absent during our study. The cichlid Oreochromis leucostictus (Trewavas 1933) is also scarce in the waterbody of the lake. While Clarias gariepinus (Burchell, 1822) and C. liocephalus Boulenger, 1898 might have been overlooked due to our fishing approach because mostly, these catfish are caught with specific fishing equipment such as trap nets or angling [44]. Nevertheless, C. liocephalus was reported and seemed to be frequent in the headwaters of some western affluents of the lake [28].

4.1.2. Qualitative and Quantitative Fish Composition in the North and South at Specific Sites

The lake’s northern part seemed to be more diversified than the south. Two putative reasons can be put forward: (i) the pattern of habitat heterogeneity on the one hand and (ii) insight into human activities, although indirectly assessed as a proxy of site characteristics on the other hand. The sites in the north were denoted to be more ecologically diversified than in the south. Fish fauna might have found hosting on various habitat types present along the shoreline of the north basin. Diversification through habitat fragmentation has been advocated for the Lake Malawi fish fauna, representing about 1000 species where rock and sand habitats frequently alternate [45,46,47,48]. This diversification model has been qualified as the microallopatry model [49]. In the south, the lake is populated mainly by macrophytes, although patches of rocky substrates seldom occur (particularly in the Ishungu Basin).
The sites covered with rock substrates and those covered with macrophytes were quantitatively rich in fish fauna, whereas the sandy sites in the north and those where human activities have already removed macrophytes had weak abundance. Rocky and macrophyte habitats are the major ecological shore features in Lake Kivu. The north is dominated by rock and the south is dominated by macrophytes [5]. Rocky shores are also common in lakes Malawi and Victoria, where this habitat is known to drive the distribution of some species [45,50,51]. Referring to the results from the north, Lake Kivu could host high fish diversity if habitat alternation was more frequent.

4.2. Patterns of and Factors Influencing Fish Assemblage in Lake Kivu

While the PCA did not unequivocally allow segregation between the sites vis-à-vis the habitat variables nor between sites and native species, the RDA model enabled the detection of even small variations between the sites, habitat predictors, and species.
The association between the fish diversity and habitats was not clear for the native Haplochromis species but rather somehow straightforward for a non-native species L. tanganicanus. We observed that Haplochromis species were identified across all sites without a clear association with one of the major sampled habitats. Indeed, it appears that Haplochromis species are ecologically unspecialised when they live under conditions like those in Lake Kivu, where the ecosystem is not well segregated into various habitat types. The geological events in the Lake Kivu basin had caused adverse effects on the lake’s ecological stability up to constraining, likely, Haplochromis species to become generalist and eurytopic species occurring throughout various habitats [52], consistent with our findings. A similar case was also observed in Lake George, where Haplochromis species were ecologically unspecialised, dwelling in a lake characterised by the physical continuity of the available habitat types and the relatively young age of the lake [53]. The author [53] stated that Haplochromis species presumably lack rigid ecological (habitat) requirements under some circumstances. In the same line of thinking, Sturmbauer [54] postulated that some fish species within the Great Lakes of East Africa are more or less specialised sympatric groups inhabiting all existing habitat types. We therefore hypothesise that Haplochromis species coexist by using a highly specialised partition of feeding resources instead of habitat partition. This is a novel avenue to be addressed in the future.
Conversely, the non-indigenous L. tanganicanus is well associated with the presence of laid-bare bedrock and macrophytes. The expansion of this species, occurring with high abundance throughout the lake, is striking. This species was first found in the catches in Lake Kivu between March and September 2006 [55]. Since then, the occurrence and abundance of the species have exponentially increased to colonise the entire lake, from the littoral to pelagic zones as well [11]. The flexibility of its feeding behaviour increases its capacity to occupy the entire lake across all substrate types apart from the sandy patches. Yet, in the pelagic zone, it feeds on mesozooplankton, whereas in the lake’s littoral zone, it consumes a large range of food items [11]. In Lake Tanganyika, in contrast, L. tanganicanus is a rocky dweller and rarely occurs in the pelagic zone [56], with it probably constrained by predators. Such behaviour in exploiting different niches in a new environment makes this species a fast invader, which may compete with native species for habitats and prey and probably, it would subjugate autochthonous species. In the offshore area of Lake Kivu, Masilya et al. [11] expected possible competition for food resources between this species and L. miodon, another species introduced into the lake in 1958–1959 [6].
The effect of habitat variables on Lake Kivu’s fish fauna was different between the northern and southern basins. Fish assemblage in the northern and southern parts of the lake seemed to be influenced by different habitat variables, underpinning the lake’s morphology and the landscape of the riparian zone. The uniform bedrock dominates the north basin’s shoreline, and the sandy site rarely occurs. The pattern of fish distribution seems to concord with the heterogeneity between the rock and sand substrates along the lake’s littoral zone. The remaining habitat predictors rely on the presence of these primarily independent variables.
The sites having primarily rock on the shore are deeper due to the marked vertical profile, where the species richness and abundance were relatively much greater. We noted the almost total absence of clay and cobbles/pebbles from the investigated sites in the north basin. However, they could have been underestimated due to their feeble coverage. The sites covered with sand were shallow due to the gentle extension of sandy beaches in the lake where low fish diversity was recorded.
Fish communities and the habitats underpinning their distribution are poorly known across the Eastern Upper Congo basin sensu lato [22], including Lake Kivu and Lake Tanganyika [3]. Nevertheless, habitat drivers of Labeobarbus spp. distribution in the Luhoho basin have been recently undertaken [22]. These findings underscore the role of hard substrates and some physico-chemical factors in the distribution of scrapped and some rubber-lipped species, respectively. The results based on the RDA model provided in the present study are the first for the fish fauna of Lake Kivu. Although the RDA model has identified different habitats that may drive fish communities, it can be deduced based on the JSI results that the native fish distribution is homogenously distributed across the various explored sites as well as at the basin level (see JSI). Thus, we hypothesised that the fish fauna in Lake Kivu is driven by the ‘mass effect’ [57], a model stipulating that the dispersion of species prevails in determining the fish assemblage/distribution over the variation in environmental predictors. In the coastal region of Lake Kivu, fish may quickly disperse along the littoral zone by swimming from one site to another. The observed results might rely on the interaction between dispersal and poor habitat variables.
Human activities such as port construction and plot extension along the littoral zone of the Bukavu Basin might have, at a local scale, an adverse effect on the water depth at the southern basins. In contrast, household activities might have induced differences among sites with regard to physico-chemical parameters. Vegetation cover on the shore seems important in the southern basins, probably due to a high number of cleared and degraded sites (10–13) where fish abundance was low. Abundance was high at site (14), where macrophytes entirely populated the site, whereas low abundance was recorded in sites where macrophytes were cleared.
The variation in fish abundance could be ascribed to the ecological state in each basin. High fish abundance in the north and the Ishungu Basin could result from the lake’s good environmental state, while in the most southern part, human activities seem to stress the fish fauna. Several authors have argued that human populations are still impacting the lake’s ecological integrity [1,13].
Methane extraction activities in the deep hypolimnion of Lake Kivu are expected to increase to alleviate the region’s energy shortage and prevent the risk of gas eruption. Based on the species richness in the north basin, where methane exploitation has been initiated and developed, we suggest undertaking monitoring of chemical parameters in relation to the fish community in search of any critical point of decline in the lake’s fish community in respect to environmental changes. During the same program, it is necessary to quantify the habitat percentage across the sites carrying out the methane exploitation because these activities may reduce the coverage of habitats that will likely affect the fish community.

5. Conclusions

The results of this study did not indicate a strong link between the presence of native species and environmental parameters. However, for L. tanganicanus, a non-native species, a strong association with rocks and macrophytes was found. The species is a major component of the fish fauna across the littoral habitats because submerged rock, rocky shores, and macrophytes form the major components of the lake’s landscape along the shoreline. The species was rare in sandy habitats. This dominance raises a question with regard to the sustainability of the fisheries in Lake Kivu as all fish and especially Limnothrissa miodon spawn in the littoral habitats. Between the north and south, there was a difference in the fish composition reminiscent of the difference in landscape between the two parts of the lake. The north is covered with rock substrate, supporting high species diversity. The southern part is populated by macrophytes, and the shoreline is irregularly covered with rock habitats also hosting high fish diversity in the lake. Furthermore, the northern side is more pristine than the south. Our results provide an insight into anthropogenic impacts on the lake. Indeed, at the sites where macrophytes and riparian vegetation were cleared, poor fish species richness and low abundance were observed. Thus, changes in fish assemblage in Lake Kivu are likely to happen.

Supplementary Materials

The following supporting information can be downloaded at: https://www.mdpi.com/article/10.3390/d15091014/s1, Table S1: Variation and average of ecological variables across sampling locations (SL) excluding substrate, cover, and macrophyte coverage for which a single value was noted and presented in the main text. Min: minimum, max: maximum, av: average, and std: standard deviation; Figure S1: Photographs of the sampling sites: 1 to 14 represent the different sites. Photographs by Kisekelwa T.

Author Contributions

Conceptualisation, T.K.; methodology, T.K.; software, T.K.; validation, G.N.M. and M.M.; formal analysis, T.K.; investigation and sampling, T.K., W.A., L.M., L.H., H.M., M.J., A.L., M.K. and M.M.; data curation, M.J. and M.K.; writing—original draft preparation, T.K.; writing—review and editing, T.K., G.N.M., A.W., A.M. and M.M.; visualisation, T.K.; supervision, M.M.; funding acquisition for fieldwork, M.M. and L.H. All authors have read and agreed to the published version of the manuscript.

Funding

This research received no external funding. Nevertheless, the authors grasped the opportunity to collect the data used in this paper during the sampling events of the Ecological Functioning of the Littoral Zone of Lake Kivu (ECOLIT) project. This project was subsidised by the ISP of Bukavu via UERHA by the Embassy of the Netherland in Rwanda through the Lake Kivu Monitoring Program (LKMP), an organisation established by the government of Rwanda. All the authors worked on the project.

Institutional Review Board Statement

Not applicable.

Data Availability Statement

Not applicable.

Acknowledgments

Djobas: Silas (DR Congo) and our boat’s captain Pascal (Rwanda) are warmly thanked for their contribution during the data collection process. We are indebted to the team of the African Centre for Aquatic Research and Education (ACARE) who contributed to editing an early version of the paper.

Conflicts of Interest

The authors declare no conflict of interest.

References

  1. Muvundja, F.A.; Masilya, P.M.; Kisekelwa, T.; Muhigirwa, B.C.; Natacha, P.; Lwikitcha, H.B.; Eric, M.R.; Désiré, A.B.; Déo, N.; Migeni, A.Z.; et al. Current status and strategic way forward for long-term management of Lake Kivu (East Africa). J. Great. Lakes Res. 2022. [Google Scholar] [CrossRef]
  2. Snoeks, J. The Haplochromines (Teleostei, Cichlidae) of Lake Kivu (East Africa): Taxonomic Revision with Notes on Their Ecology; MRAC: Tervuren, Belgium, 1994; p. 197. [Google Scholar]
  3. Snoeks, J.; De Vos, L.; Thys van den Audenaerde, D.F.E. The ichthyogeography of Lake Kivu. S. Afr. J. Sci. 1997, 93, 579–584. [Google Scholar]
  4. Snoeks, J.; Kaningini, B.; Masilya, P.; Nyina-Wamwiza, L.; Guillard, J.J. Fishes in Lake Kivu: Diversity and Fisheries. In Lake Kivu: Limnology and Biogeochemistry of a Tropical Great Lake; Descy, J.-P., Darchambeau, F., Schmid, M., Eds.; Springer: Dordrecht, The Netherlands, 2012; pp. 107–126. [Google Scholar]
  5. Verbeke, J. Exploration Hydrobiologique des Lacs Kivu, Edouard et Albert (1952–1954); IRSNB: Bruxelles, Belgique, 1957; Volume III, p. 177. [Google Scholar]
  6. Kaningini, M.; Micha, J.-C.; Vandenhaute, J.; Platteau, J.-P.; Watongoka, H.; Melard, C.; Wilondja, M.K.; Isumbisho, M. Pêche du Sambaza au Filet Maillant Dans le Lac Kivu; Presses Universitaires de Namur: Namur, Belgium, 1999; p. 152. [Google Scholar]
  7. Guillard, J.; Darchambeau, F.; Masilya, P.; Descy, J.-P. Is the fishery of the introduced Tanganyika sardine (Limnothrissa miodon) in Lake Kivu (East Africa) sustainable? J. Great. Lakes Res. 2012, 38, 524–533. [Google Scholar] [CrossRef]
  8. Beadle, L.C. The Inland Waters of Tropical Africa: An Introduction to Tropical Limnology, 2nd ed.; Longman: Harlow, UK, 1981; p. 475. [Google Scholar]
  9. Munyandamutsa, P.; Lazaro, W.J.; Kassam, D.; Mtethiwa, A. Species specificity and sexual dimorphism in tooth shape among the three sympatric haplochromine species in Lake Kivu cichlids. Ecol. Evol. 2020, 10, 5694–5711. [Google Scholar] [CrossRef]
  10. Kaningini, M.B. Etude de la Croissance, de la Reproduction et de L’exploitation de Limnothrissa miodon au Lac Kivu, Bassin de Bukavu (Zaïre). Ph.D. Thesis, Université de Namur, Namur, Belgium, 1995. [Google Scholar]
  11. Masilya, M.P.; Darchambeau, F.; Isumbisho, M.; Descy, J.-P. Diet overlap between the newly introduced Lamprichthys tanganicanus and the Tanganyika sardine in Lake Kivu, Eastern Africa. Hydrobiologia 2011, 675, 75–86. [Google Scholar] [CrossRef]
  12. Schmid, M.; Halbwachs, M.; Wehrli, B.; Wüest, A. Weak mixing in Lake Kivu: New insights indicate increasing risk of uncontrolled gas eruption. Geochem. Geophys. Geosyst. 2005, 6, Q07009. [Google Scholar] [CrossRef]
  13. Muvundja, F.A.; Pasche, N.; Bugenyi, F.W.B.; Isumbisho, M.; Müller, B.; Namugize, J.-N.; Rinta, P.; Schmid, M.; Stierli, R.; Wüest, A. Balancing nutrient inputs to Lake Kivu. J. Great. Lakes Res. 2009, 35, 406–418. [Google Scholar] [CrossRef]
  14. Darchambeau, F.; Sarmento, H.; Descy, J.-P. Primary production in a tropical large lake: The role of phytoplankton composition. Sci. Total Environ. 2014, 473–474, 178–188. [Google Scholar] [CrossRef]
  15. Tietze, K.; Geyh, M.; Müller, H.; Schröder, L.; Stahl, W.; Wehner, H. The genesis of the methane in Lake Kivu (Central Africa). Geol. Rundsch. 1980, 69, 452–472. [Google Scholar] [CrossRef]
  16. Schmid, M.; Wüest, A. Stratification, Mixing and Transport Processes in Lake Kivu. In Lake Kivu: Limnology and Biogeochemistry of a Tropical Great Lake; Descy, J.-P., Darchambeau, F., Schmid, M., Eds.; Springer: Dordrecht, The Netherlands, 2012; pp. 13–29. [Google Scholar]
  17. Kling, G.; MacIntyre, S.; Steenfelt, J.S.; Hirslund, F. Lake Kivu Gas Extraction. Report on Lake Stability; Report 2006, n° 62721-0001.
  18. Pasche, N.; Schmid, M.; Vazquez, F.; Schubert, C.J.; Wüest, A.; Kessler, J.D.; Pack, M.A.; Reeburgh, W.S.; Bürgmann, H. Methane sources and sinks in Lake Kivu. J. Geophys. Res. Biogeosci. 2011, 116, G03006. [Google Scholar] [CrossRef]
  19. Blees, J.; Niemann, H.; Wenk, C.B.; Zopfi, J.; Schubert, C.J.; Kirf, M.K.; Veronesi, M.; Hitz, C.; Lehmann, M.F. Micro-aerobic bacterial methane oxidation in the chemocline and anoxic water column of deep south-Alpine Lake Lugano (Switzerland). Limnol. Oceanogr. 2014, 59, 311–324. [Google Scholar] [CrossRef]
  20. Obolewski, K. Epiphytic macrofauna on water soldiers (Stratiotes aloides L.) in Slupia River oxbows. Oceanol. Hydrobiol. Stud. 2005, 34, 37–54. [Google Scholar]
  21. Glińska-Lewczuk, K.; Burandt, P.; Kujawa, R.; Kobus, S.; Obolewski, K.; Dunalska, J.; Grabowska, M.; Lew, S.; Chormański, J. Environmental factors structuring fish communities in floodplain lakes of the undisturbed system of the Biebrza River. Water 2016, 8, 146. [Google Scholar] [CrossRef]
  22. Kisekelwa, T.; Snoeks, J.; Ibala Zamba, A.; Amzati, G.S.; Isumbisho, M.; Masilya, P.M.; Lemmens, P.; Vreven, E. Association between Labeobarbus spp. (Teleostei: Cyprinidae) and environmental variables in the Luhoho basin (Eastern Congo River basin; DRC). J. Fish Biol. 2021, 99, 321–334. [Google Scholar] [CrossRef] [PubMed]
  23. Rice, W.R. Analyzing tables of statistical tests. Evolution 1989, 43, 223–225. [Google Scholar] [CrossRef] [PubMed]
  24. Hill, M.O. Diversity and evenness: A unifying notation and its consequences. Ecology 1973, 54, 427–432. [Google Scholar] [CrossRef]
  25. Greenstreet, S.P.; Rogers, S.I. Indicators of the health of the North Sea fish community: Identifying reference levels for an ecosystem approach to management. ICES J. Mar. Sci. 2006, 63, 573–593. [Google Scholar] [CrossRef]
  26. Marcon, E. Mesure de la Biodiversité; UMR: Guyane, France, 2010; p. 58. [Google Scholar]
  27. Daly, A.J.; Baetens, J.M.; De Baets, B. Ecological Diversity: Measuring the Unmeasurable. Mathematics 2018, 6, 199. [Google Scholar] [CrossRef]
  28. Kisekelwa, T.; Snoeks, J.; Vreven, E. An annotated checklist of the fish diversity of the fish fauna of the river systems draining the Kahuzi-Biega National Park (Upper Congo: Eastern DR Congo). J. Fish Biol. 2020, 96, 700–721. [Google Scholar] [CrossRef]
  29. Dube, T.; Pinceel, T.; De Necker, L.; Wepener, V.; Lemmens, P.; Brendonck, L. Lateral hydrological connectivity differentially affects the community characteristics of multiple groups of aquatic invertebrates in tropical wetland pans in South Africa. Fresh. Biol. 2019, 64, 2189–2203. [Google Scholar] [CrossRef]
  30. Mwaijengo, G.N.; Vanschoenwinkel, B.; Trevor, D.; Njau, K.N.; Brendonck, L. Seasonal variation in benthic macroinvertebrate assemblages and water quality in an Afrotropical river catchment, northeastern Tanzania. Limnologica 2020, 82, 25780. [Google Scholar] [CrossRef]
  31. Jolliffe, I.T.; Cadima, J. Principal component analysis: A review and recent developments. Phil. Trans. R. Soc. 2016, A374, 20150202. [Google Scholar] [CrossRef]
  32. Cai, Y.; Xu, H.; Vilmi, A.; Tolonen, K.T.; Tang, X.; Qin, B.; Gong, Z.; Heino, J. Relative roles of spatial processes, natural factors and anthropogenic stressors in structuring a lake macroinvertebrate metacommunity. Sci. Total Environ. 2017, 601–602, 1702–1711. [Google Scholar] [CrossRef]
  33. Mwaijengo, G.N.; Msigwa, A.; Njau, K.N.; Brendonck, L.; Vanschoenwinkel, B. Where does land use matter most? Contrasting land use effects on river quality at different spatial scales. Sci. Total Environ. 2020, 715, 134825. [Google Scholar] [CrossRef]
  34. Blanchet, G.F.; Legendre, P.; Borcard, D. Forward selection of explanatory variables. Ecology 2008, 89, 2623–2632. [Google Scholar] [CrossRef]
  35. Legendre, E.; Gallagher, D. Ecologically meaningful transformations for ordination of species data. Oecologia 2001, 129, 271–280. [Google Scholar] [CrossRef]
  36. Cohen, J. Statistical Power Analysis for the Behavioral Sciences; Academic Press: New York, NY, USA, 1977; p. 579. [Google Scholar]
  37. Craney, T.A.; Surles, J.G. Model-dependent variance inflation factor cutoff values. Qual. Eng. 2002, 14, 391–403. [Google Scholar] [CrossRef]
  38. Thompson, C.G.; Kim, R.S.; Aloe, A.M.; Betsy, J.B. Extracting the Variance Inflation Factor and Other Multicollinearity Diagnostics from Typical Regression Results. Basic Appl. Soc. Psychol. 2017, 39, 81–90. [Google Scholar] [CrossRef]
  39. Oksanen, J.; Blanchet, F.G.; Friendly, M.; Kindt, R.; Legendre, P.; Mcglinn, D.; Minchin, P.R.; Hara, R.B.O.; Simpson, G.L.; Solymos, P.; et al. Vegan Community Ecology Package Version 2.4-1. 2016. Available online: http://CRAN.R-project.org/package=vegan (accessed on 8 May 2020).
  40. Ter Braak, C.J.F. Canoco—An extension of decorana to analyze species-environment relationships. Vegetatio 1988, 75, 159–160. [Google Scholar] [CrossRef]
  41. Joyeuse, M. Contribution à L’étude du Peuplement de la Faune Ichtyologique Dans le Bassin Nord du Lac Kivu. Licence Thesis, ISP of Bukavu, Bukavu, Congo, 2020. [Google Scholar]
  42. Mazambi, L.J. Diversité Ichtyologique de la Rivière Ruzizi en Amont et en Aval Des Centrales Hydroélectriques Ruzizi I et II. Master’s Thesis, University of Abomey Calavi, Cotonou, Benin, 2016. [Google Scholar]
  43. Walsh, S.J.; Chapman, L.J.; Rosenberger, A.E.; Chapman, C.A. Redescription of Amphilius jacksonii (Siluriformes: Amphiliidae) with habitat and life-history notes. Ichthyol. Explor. Freshw. 2000, 11, 163–174. [Google Scholar]
  44. Akonkwa, D.B. Effets des Changements Climatiques et Des Pratiques de Pêche sur Les Ressources Halieutiques du Lac Kivu (Afrique de l’Est). Ph.D. Thesis, Université d’Abomey-Calavi, Cotonou, Benin, 2017. [Google Scholar]
  45. Fryer, G. The trophic interrelationships and ecology of some littoral communities of Lake Nyasa with especial reference to the fishes, and a discussion of the evolution of a group of rock-frequenting Cichlidae. Proc. Zool. Soc. Lond. 1959, 132, 153–281. [Google Scholar] [CrossRef]
  46. Beadle, L.C. The Evolution of species in the Lakes of East Africa. Uganda J. 1962, 26, 44–54. [Google Scholar]
  47. Kocher, T.D. Adaptive evolution and explosive speciation: The cichlid fish model. Nat. Rev. Genet. 2004, 5, 288–298. [Google Scholar] [CrossRef] [PubMed]
  48. Salzburger, W. Understanding explosive diversification through cichlid fish genomics. Nat. Rev. Genet. 2018, 19, 705–717. [Google Scholar] [CrossRef]
  49. Seehausen, O.; Magalhaes, I.S. Geographical mode and evolutionary mechanism of ecological speciation in Cichlid Fish. In Research of the Causes of Evolution: From Field Observations to Mechanisms; Grant, P.R., Grant, B.R., Eds.; Princeton: Singapore, 2010; pp. 282–308. [Google Scholar]
  50. Seehausen, O.; Samwel-Terry, A.; Bouton, N. Habitat and ecology of rock-dwelling cichlids. In Lake Victoria Rock Cichlids: Cichlids: Taxonomy, Ecology and Distribution; Seehausen, O., Ed.; Verduijn Cichlids: Zevenhuizen, Germany, 1996; pp. 36–43. [Google Scholar]
  51. Snoeks, J. How well known is the ichthyodiversity of the large East African lakes? Adv. Ecol. Res. 2000, 31, 17–38. [Google Scholar] [CrossRef]
  52. Lévêque, C.; Agnèse, F. Diversity of African fish: Heritage of evolution. In The Inland Water Fishes of Africa: Diversity, Ecology and Human Use; Paugy, D., Lévêque, C., Otero, O., Eds.; IRD: Paris, France; MRAC: Tervuren, Belgium, 2017; pp. 127–145. [Google Scholar]
  53. Dunn, I.G. Ecological notes on the Haplochromis (Pisces: Cichlidae) species-flock of Lake George, Uganda (East Africa). J. Fish Biol. 1975, 7, 651–666. [Google Scholar] [CrossRef]
  54. Sturmbauer, C. Explosive speciation in cichlid fishes of the African Great Lakes: A dynamic model of adaptive radiation. J. Fish Biol. 1998, 53, 18–36. [Google Scholar] [CrossRef]
  55. Muderhwa, N.; Lushombo, M. The introduction of the endemic fish species, Lamprichthys tanganicanus (Poeciliidae), from Lake Tanganyika into Lake Kivu: Possible causes and effects. Aquat. Ecosyst. Health Manag. 2010, 13, 203–213. [Google Scholar] [CrossRef]
  56. Coulter, G.W. Lake Tanganyika and Its Life; Oxford University Press: Oxford, UK, 1991; p. 362. [Google Scholar]
  57. Heino, J.; Melo, A.S.; Siqueira, T.; Soininen, J.; Valanko, S.; Bini, L.M. Metacommunity organisation, spatial extent and dispersal in aquatic systems: Patterns, processes and prospects. Freshw. Biol. 2015, 60, 845–869. [Google Scholar] [CrossRef]
Figure 1. Lake Kivu situated between the east part of the DR of Congo and Rwanda. (★) indicates the sampling sites. Two major sites from the northern basin are indicated. The first star in the north represents five sites (sites: 1 to 5, from north to south), and the second one stands for two sites (sites: 6 and 7). In Ishungu, two adjacent sites were sampled (sites: 8 and 9). Finally, five sites were sampled near Bukavu (sites 10 to 14), from west to east. For details about the sampled sites, see the text.
Diversity 15 01014 g001
Figure 2. Ordination plot of principal component analysis (PCA) of sites with (a) ecological variables, (b) species composition of the fish fauna of Lake Kivu, (c) ecological variables and species composition (community), and (d) ecological variables and species composition from the southern basins (Ishungu and Bukavu basins). The circles, triangles, squares, and diamonds represent the samples. Solid circle (site 1), dashed circle (site 2), dotted (site 3), black filled (site 4), and grey filled (site 5). Empty triangle (site 6) and black filled triangle (site 7). Empty square (site 8) and filled square (site 9). Empty diamond (site 10), dashed diamond (site 11), black filled diamond (site 12), grey filled diamond (site 13), and brown–grey filled diamond (site 14). The following species were plotted at the centre, pinpointing their feeble occurrence over the sites where they occurred. Therefore, they were omitted in the figure to smooth figure reading: Limnothrissa miodon was deleted in (b), whereas Coptodon rendalli, Haplochromis adolphifrederici, H. insidae, H. paucidens, H. rubescens, H. occultidens, and Oreochromis niloticus were removed in Figure 2c. The number of symbols for each locality corresponds to the number of sampling replicates.
Diversity 15 01014 g002aDiversity 15 01014 g002bDiversity 15 01014 g002cDiversity 15 01014 g002d
Table 1. Proportion of each substrate category, cover, and macrophytes in all 14 sampling sites. SNCC: Société Nationale de Chemin de Fer du Congo.
Clay (%)Sand (%)Cobble/Pebble (%)Large Coarse (%)Cover (%)Macrophytes (%)
North basin
(1) Sandy patch0.0100.00.00.00.00.0
(2) Rock and macrophytes0.00.00.080.00.020.0
(3) Rocky shore0.00.00.0100.010.00.0
(4) Rocks mixed with sand0.060.00.040.00.00.0
(5) Rocky shore0.00.00.0100.00.00.0
(6) Rocky shore—shaded0.00.00.0100.010.00.0
(7) Sandy patch0.0100.00.00.00.00.0
South basin
(8) Ishungu with macrophytes25.025.050.00.00.0100.0
(9) Ishungu with a rocky shore0.00.00.0100.00.00.0
(10) Kalengera with a denuded shore50.025.025.00.00.00.0
(11) Kalengera with macrophytes50.025.025.00.00.0100.0
(12) Alleluia Port with a denuded shore0.025.050.025.00.00.0
(13) SNCC beach with macrophytes50.025.025.00.00.0100.0
(14) Governor’s park with macrophytes50.025.025.00.05.0100.0
Table 2. Species richness and distribution over the lake according to the different sites (1 to 14). Sites (1) to (7) are from the northern basins and sites (8) to (14) are from the southern basins. For details about the names, see the Materials and Methods section. We have provided the occurrence in percentage for each species for the entire area of Lake Kivu (LK), C: occurrence, i: introduced species, and N and S refer to the name of the major basin where the sites were selected, i.e., from the north basin and south basin, respectively.
NorthSouth
IshunguBukavu
1234567C (%N)891011121314C (%S)C (%LK)
Clupeidae
Limnothrissa miodon (Boulenger, 1906) (i)01000001414115000675736
Cyprinidae
Enteromius kerstenii (Peters, 1868)000100014000000007
Procatopodidae
Lamprichthys tanganicanus (Boulenger, 1898) (i)2145374183274357151005838577273200100100
Cichlidae
Coptodon rendalli (Boulenger, 1897) (i)000000114000000007
Haplochromis adolphifrederici (Boulenger, 1914)01110105720000001436
H. astatodon Regan, 19210124721318604301247179
H. crebridens Snoeks, de Vos, Coenen, and Thys van den Audenaerde, 1990090021175700112105757
H. gracilior Boulenger, 1914580147207100234004357
H. graueri Boulenger, 191463026000430161701285757
H. insidae Snoeks, 19940730004430000000021
H. microchrysomelas Snoeks, 1994815422007123540928679
H. occultidens Snoeks, 19880000000010001024329
H. olivaceus Snoeks, de Vos, Coenen, and Thys van den Audenaerde, 1990186112086145904307179
H. paucidens Regan, 192104432005700004124350
H. rubescens Snoeks, 199400010001401306004329
H. scheffersi Snoeks and Thys van den Audenaerde 1987131286151002113513100100
H. vittatus (Boulenger, 1901)15037005712033238671
Oreochromis niloticus (Linnaeus, 1758)00011034310000001429
Total number of specimens3621939825130437746 22241737385740231
Species richness7138131087 999710109
Species richness per basin17 1213
Table 3. P-value results of Mann–Whitney U-tests between fish abundance among the sites. Correction of alpha was achieved after dividing 0.05, 0.01, and 0.001 by 2 as each pair comparison was independent. * refers to pairwise comparison where the significant difference was obtained after correction of the alpha value.
(1)(2)(3)(4)(5)(6)(7)(8)(9)(10)(11)(12)(13)
(1) Sandy patch
(2) Rock and macrophytes0.00 *
(3) Rocky shore0.030.57
(4) Rocks mixed with sand0.00 *0.930.57
(5) Rocky shore0.01 *0.810.680.93
(6) Rocky shore—shaded0.050.810.680.930.93
(7) Sandy patch0.800.00 *0.070.01 *0.030.12
(8) Ishungu with macrophytes0.110.910.910.910.910.910.16
(9) Ishungu with a rocky shore0.030.590.740.590.590.590.040.47
(10) Kalengera with a denuded shore0.230.01 *0.100.01 *0.110.110.320.310.11
(11) Kalengera with macrophytes0.160.01 *0.110.01 *0.060.110.330.310.141.00
(12) Alleluia Port with a denuded shore0.160.060.160.110.280.330.230.310.190.450.47
(13) SNCC beach with macrophytes0.130.01 *0.100.030.110.110.230.310.110.650.880.66
(14) Governor’s park with macrophytes0.01 *0.451.000.590.590.590.01 *0.880.880.030.030.060.03
Table 4. Hill N1 index obtained at each site.
SitesHillN1 Diversity
North
(1) Sandy patch5.10
(2) Rock and macrophytes4.01
(3) Rocky shore1.39
(4) Rocks mixed with sand2.97
(5) Rocky shore1.67
(6) Rocky shore—shaded1.31
(7) Sandy patch4.62
South
(8) Ishungu with macrophytes2.75
(9) Ishungu with a rocky shore1.48
(10) Kalengera with a denuded shore7.24
(11) Kalengera with macrophytes4.95
(12) Alleluia Port with a denuded shore5.87
(13) SNCC beach with macrophytes6.96
(14) Governor’s park with macrophytes1.92
Disclaimer/Publisher’s Note: The statements, opinions and data contained in all publications are solely those of the individual author(s) and contributor(s) and not of MDPI and/or the editor(s). MDPI and/or the editor(s) disclaim responsibility for any injury to people or property resulting from any ideas, methods, instructions or products referred to in the content.

