Article

Annual Dynamics of a Layered Phytoplankton Structure in a Meromictic Lagoon Partially Isolated from the White Sea

by
Irina G. Radchenko
1,
Vasilisa A. Aksenova
1,
Dmitry A. Voronov
2,
Dmitry Viktorovich Rostanets
1 and
Elena Dmitrievna Krasnova
1,*
1
Faculty of Biology, Lomonosov Moscow State University, 119234 Moscow, Russia
2
Kharkevich Institute for Information Transmission Problems, Russian Academy of Sciences, 127051 Moscow, Russia
*
Author to whom correspondence should be addressed.
Diversity 2023, 15(9), 1009; https://doi.org/10.3390/d15091009
Submission received: 10 August 2023 / Revised: 4 September 2023 / Accepted: 5 September 2023 / Published: 11 September 2023
(This article belongs to the Special Issue Estuaries Ecology and Coastal Marine Waters)

Abstract

:
In a saline semi-isolated lagoon on Cape Zeleny (White Sea), the annual dynamics of the vertical hydrological structure and the seasonal dynamics of phytoplankton were traced. Species composition, vertical distribution, abundance, nutrition type, and biomass were analyzed. In total, 293 species and supraspecific taxa of algae and cyanobacteria were found. Most of the identified species are marine, and 38 species are freshwater. Taxonomic composition changed in the lagoon throughout the year. Dinoflagellates dominated in winter and early June; unidentified cocci and flagellates in July; diatoms, dinoflagellates, and unidentified cells in August; dinoflagellates in September; and unidentified cocci and flagellates in October–November. The abundance of algae also changed in the lagoon throughout the year. The integrated biomass in the water column varied from 0.01 g C/m2 in January to 0.78 g C/m2 in early September. According to the environmental parameters, the water column of the lagoon was subdivided into several zones with different environmental conditions and corresponding phytoplankton communities. The similarity between the communities of different horizons was 32–46% in summer and 7% in winter. The chemocline layer was the most populous. It contained a maximum of phytoplankton biomass, 1–2 orders of magnitude higher than that in the overlying horizons. Despite the connection to the sea, the phytoplankton structure in the surface water layer in the lagoon and in the sea differed significantly in composition, quantitative parameters, and seasonal dynamics. The similarity between the communities never exceeded 50%. In terms of biomass dynamics, the lagoon lagged behind the sea until mid-summer, but, starting from August, it outnumbered it, and the phytoplankton development in the lagoon lasted longer, until late autumn. According to sequential tests DistLM, the phytoplankton structure and dynamics in the lagoon and in the sea were related to the daylength, water salinity, oxygen content, and pH by 24.5%. At the same time, the PhP structure did not depend on water temperature, underwater illuminance, or depth. Oxygen content and pH were defined by PhP activity. Salinity serves as a vector of the vertical sequence of ecological niches. The day length seems to be the crucial factor of the seasonal PhP dynamics in the semi-isolated coastal stratified lakes and lagoons.

1. Introduction

Throughout the geological history of the Earth, transgressions and regressions of the sea have occurred in various regions. Shifting of the coastline towards the sea (regression) leads in some cases to the separation of a part of the sea area and its transformation into a residual, relict reservoir. A crucial restructuring of all components of the ecosystem takes place. Water salinity decreases, and marine species are replaced by brackish and then freshwater ones. Bottom sediment layers retain residues of organisms that lived at different stages of isolation. Changes in the species composition allow for a reconstruction of the history of the reservoir. The plausibility of reconstructions would be better if they could be corrected in accordance with direct observations of community changes during the gradual increase in isolation. There is a unique opportunity for this in the western part of the White Sea, where, as a result of the post-glacial uplift, many coastal water bodies were formed, which are at different stages of isolation from the sea [1,2].
In the course of increasing isolation from the sea, a former sea bay can pass through the stage of coastal meromictic lake, with vertical stratification that persists year after year for a long time [3]. Species composition of phytoplankton (PhP) and its quantitative characteristics are determined by many factors. In part, they are similar to holomictic water bodies (with seasonal mixing of the entire water column). They depend on the climate, chemical composition of the water, the water’s mineralization, trophic status of the water body, etc. Nevertheless, there are some peculiarities in the structure of PhP in water bodies with stable stratification. Among them is a decrease in quantitative characteristics and species richness. This has also been noted in lakes that alternate meromictic periods with complete mixing episodes [4,5,6]. Prolonged stratification results in the deposition of nutrients in the monimolimnion (bottom layer not involved in vertical circulation) which makes them inaccessible to aerobic PhP [7]. This also causes a weakened spring algal bloom because of long-lasting nutrient deposition in the deep layers.
In most continental meromictic lakes, PhP is represented by a small number of species that can reach high biomass, especially in the chemocline zone [8,9,10,11,12,13,14]. The most abundant component of PhP is often cyanobacteria [15,16,17]; in some cases, it is diatoms [14,18,19,20], or sometimes Chlorophyta [7]. Diatoms often dominate in meromictic lakes of marine origin [21,22]. Deep chlorophyll maximum is a typical phenomenon in stratified water bodies [23]. It is often associated with the development of cyanobacteria [15,16] or cryptophytes capable of mixotrophy [23,24,25,26,27,28].
PhP communities in surface water layers usually differ from the community of the chemocline (the gradient zone separating aerobic and anaerobic zones). For example, in Lake Svetloe (Arkhangelsk region, Russia), in most of the water column, diatoms bloom in spring and early summer, while only cyanobacteria inhabit the chemocline [29,30]. A high intensity of oxygenic photosynthesis can be recorded near the lake surface, while anoxygenic photosynthesis is more important in the chemocline [17].
In meromictic water bodies of marine origin, two zones of PhP concentration were observed: one near the surface (more often consisting of diatoms, but often with the dominance of cyanobacteria), and the other in the depths of the water body where cryptophytes were an important PhP component [31,32,33,34]. In the relict meromictic Lake Mogilnoye (Barents Sea, Kildin Island), the freshwater mixolimnion (surface mixing layer) is usually dominated by diatoms and cyanobacteria, while the underlying salt layer is dominated by the dinophyte order Gymnodiniales [2,35]. In coastal stratified marine water bodies, dinophytes also play an important role, reaching a high diversity there [22,32,34,36]. Flagellates, including cryptophytes, dominate in Antarctic meromictic lakes [37].
Although the PhP of continental meromictic water bodies is well studied, the same cannot be said of coastal marine meromictic water bodies, especially in the Russian Arctic. There are very few papers on phytoplankton and there is only one study of seasonal succession. One of the most studied is Lake Mogilnoye on Kildin Island in the Barents Sea [21,35], but due to its geographical remoteness, research in this lake is limited to episodic summer expeditions. Meromictic water bodies on the coast of the White Sea are much more convenient for monitoring studies [1,2]. Nevertheless, PhP is in the very initial phase of being studied. The taxonomic composition, vertical distribution, and seasonal succession of PhP have been studied only in one isolated basin: in the salt lagoon called Lake Kislo-Sladkoe (literally “Sour-and-Sweet”) near the White Sea Biological Station of Lomonosov Moscow State University [22]. The second example is the lagoon on Cape Zeleny [38]. Benthos [39], coastal vegetation [40], microbial community [41], and partly zooplankton [42,43] were studied in this lagoon, but information on PhP is still fragmentary [1,44]. The aim of this work is to trace the seasonal dynamics of PhP in the coastal meromictic lagoon on Cape Zeleny, partially isolated from the White Sea. The composition, abundance, and biomass of PhP in different layers of the water column were studied; their dynamics were compared to the marine PhP community; and abiotic factors determining the dynamics of the PhP structure were analyzed.

2. Materials and Methods

Water samples were taken in the lagoon on Cape Zeleny (hereinafter “Lagoon”) at a station located above a maximum depth of 6.5 m, and in the surface layer of the adjacent marine area in Kislaya Bay. Sampling was provided in January and from June to November 2020.

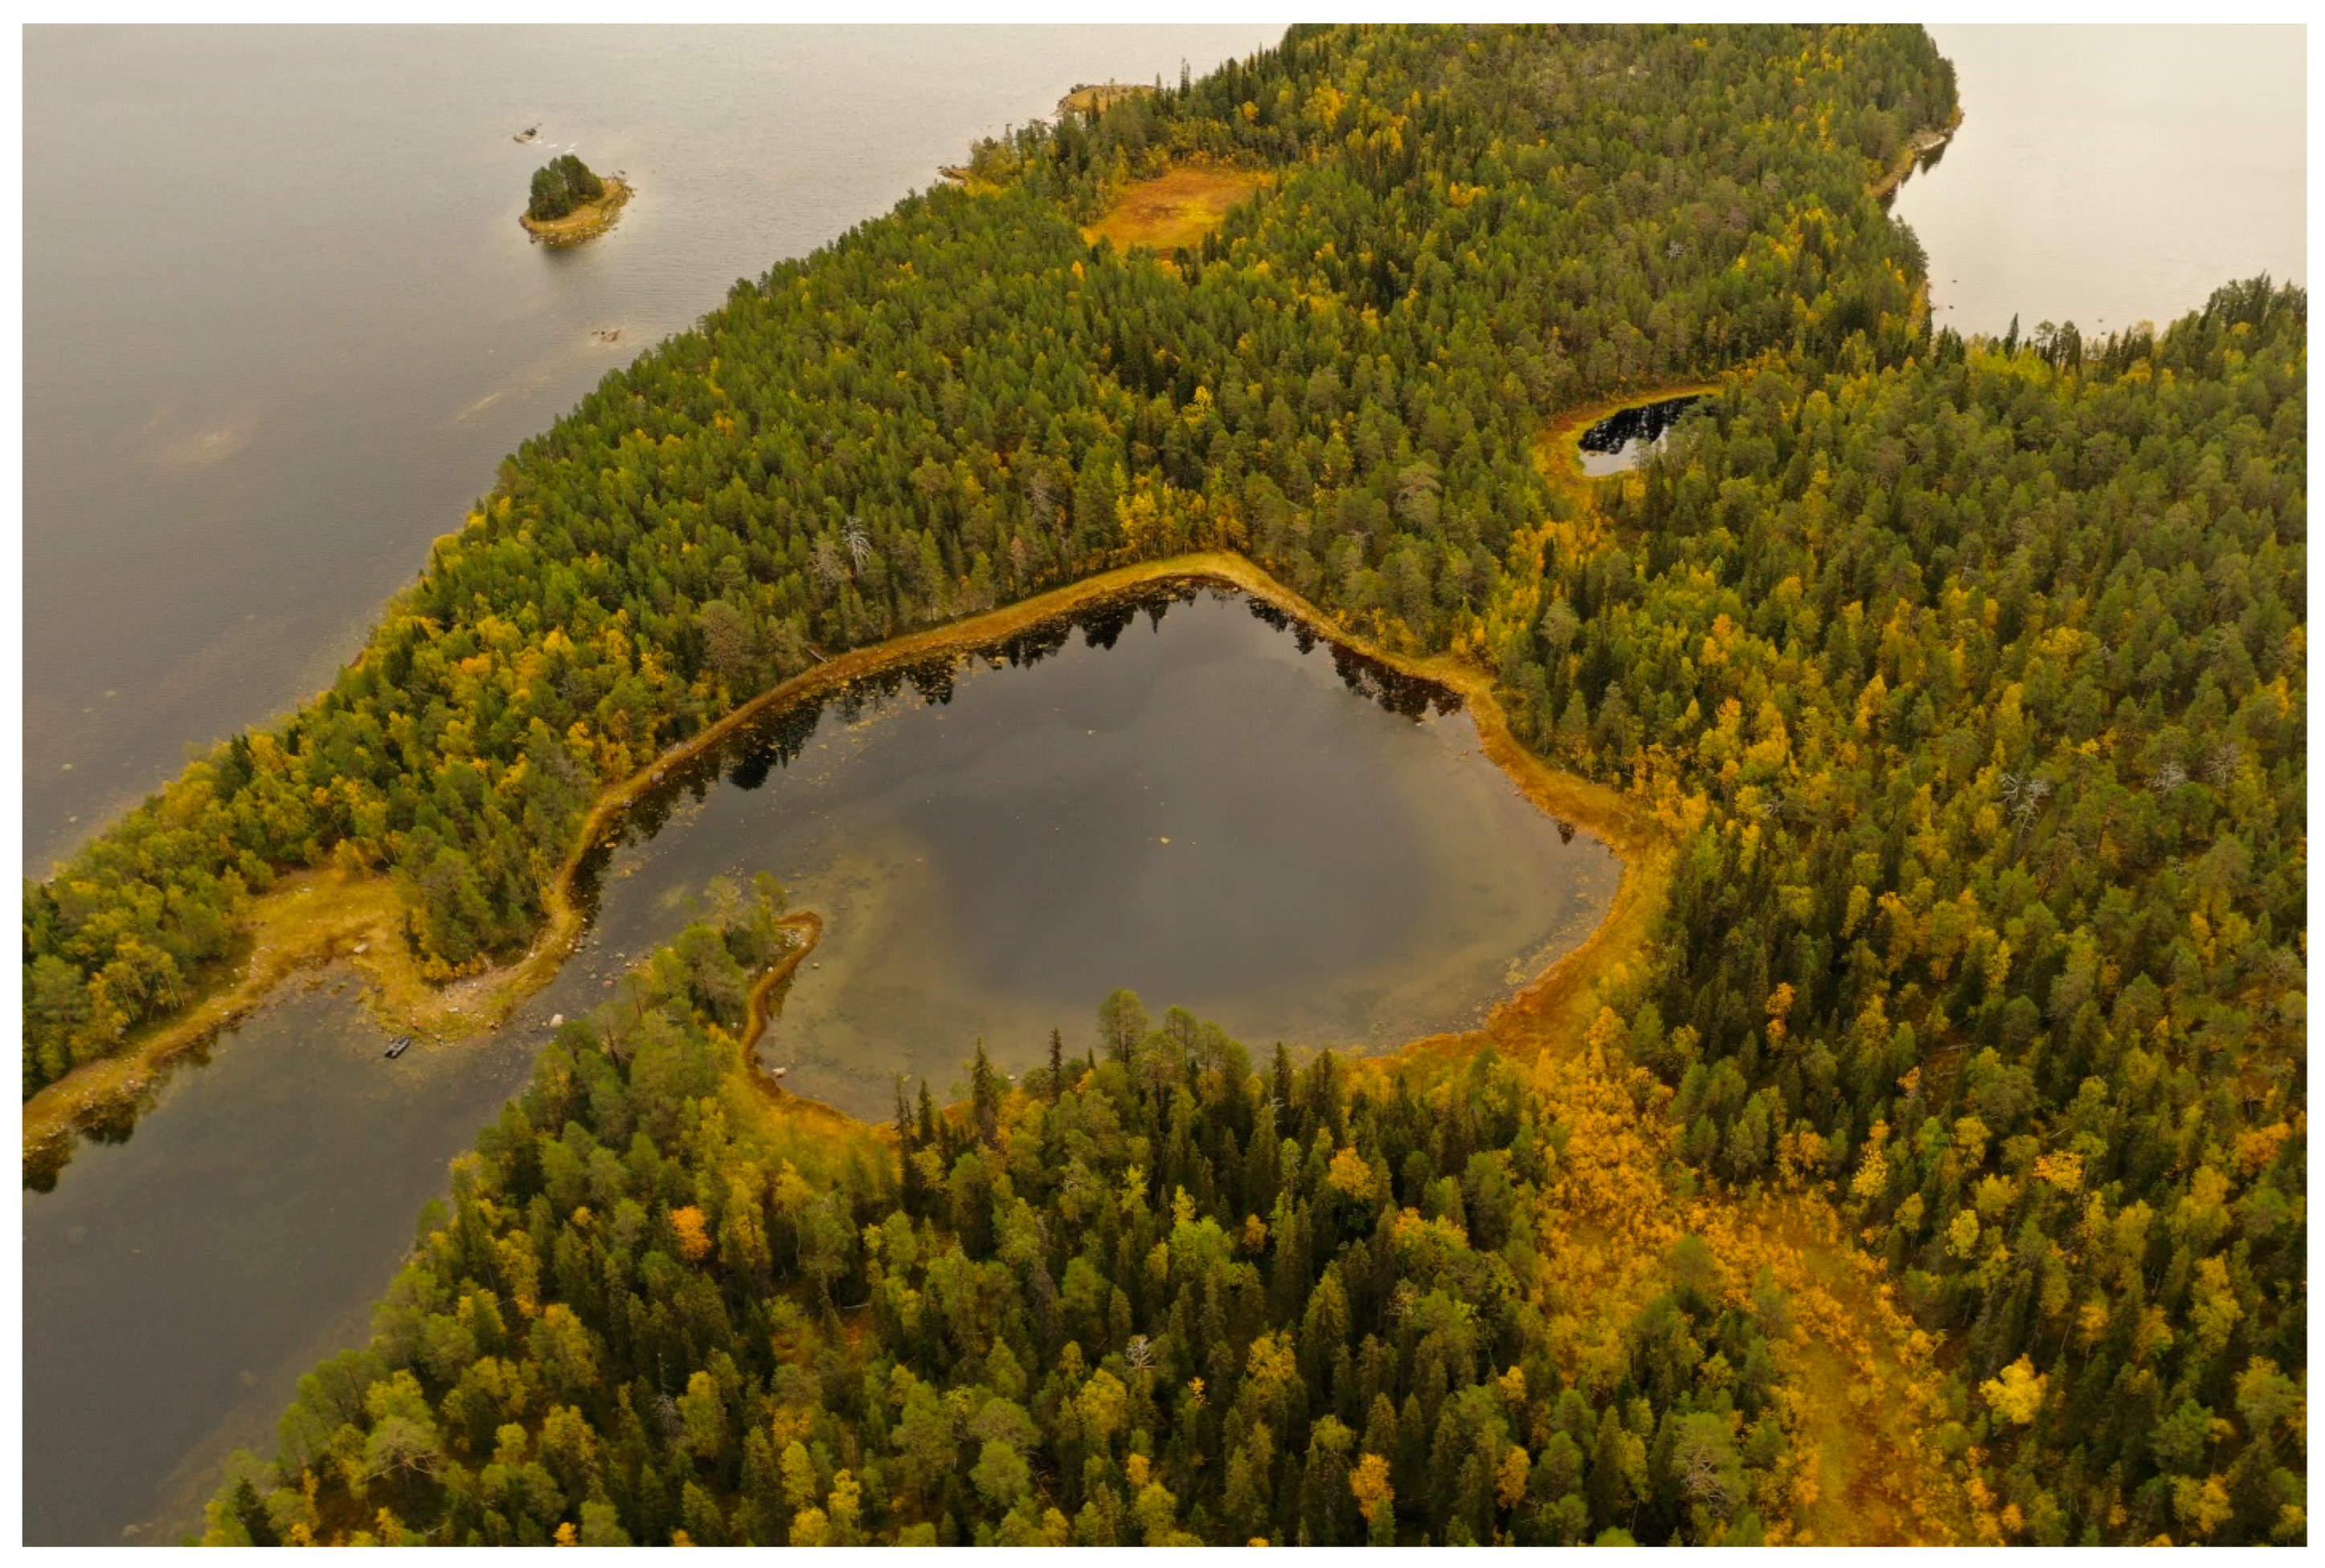
2.1. Characteristics of the Study Area

The studied Lagoon (66°31′49″ N, 33°05′42″ E) is located on the isthmus of the Cape Zeleny peninsula, which separates the Kislaya and Chernorechenskaya bays (White Sea, Kandalaksha Bay) (Figure 1). The area is 2 hectares; the maximum depth is 6.5 m. The Lagoon was formed as a residual of an ancient strait that separated the mainland and former island, which turned to the present-day peninsula (Figure 2). The Lagoon is connected to the sea through a narrow rocky sill with the height between high tide and low tide, so sea water enters from the sea for a short time at high water. While the tides in the sea are approximately 2 m high, in the Lagoon, water level fluctuations do not exceed 0.5 m and are sharply asymmetric: the high tide is shorter (1–1.5 h on average) than the low tide (4.5–5 h). In winter, ice hummocks can block the path of the tidal current, so the Lagoon stays isolated for a short time [45]. Freezing over begins in late October–early November, and ice melts in late May. In November, the sea water temperature is still positive (in degrees Celsius), but in the Lagoon, the water surface cools down to a negative temperature, and young ice reaches a thickness of 1–2 cm. In January 2020, the ice thickness was 20 cm, and gradually increased to 40 cm by March.
Due to regular water exchange with the sea, and a very small catchment area, which is just 7.2 times the size of the water surface of the Lagoon [1,38], the entire water column in the Lagoon is salty. In the upper part of the water column, the salinity is the same as in the sea (22–25‰). Below a depth of 1.5 m, salinity increases and exceeds that in the adjacent marine area; below the horizon of 4 m it reaches 27.0–29.7‰ (in different years).
Near the bottom hole, there is a permanent sulfide zone with the boundary at a depth of 4.5–5.5 m in summer; in winter it rises by 1–1.5 m. During 13 years of observations, complete flushing with sea water happened only once, leading to vertical structure failure and the anaerobic zone disappearing. This happened in November 2011 as a high spring tide and wind surge coincided. The following summer, stratification was restored, and the anaerobic zone reappeared. In the years prior to this study, the stratification in the Lagoon was steady.

2.2. Sampling

In 2020, PhP observations began in January, when the Lagoon was covered with ice, continued in early June shortly after the ice melted, and finished in November, when the ice cover re-established. Thus, the surveys cover the full annual hydrological cycle. In June, July, and September, samples were taken twice a month with an interval of 10–18 days; in January, August, October, and November, once a month.
At each survey, one sample was taken every meter in depth from the surface to the chemocline, which in different months was located a little differently between the horizons of 4.5 m and 5.4 m. In total, 58 samples were taken in the Lagoon with a volume from 50 to 1465 mL. Below the chemocline, PhP was not studied, since it is not viable in the presence of hydrogen sulfide. In addition, one sample with a volume of 880–2135 mL was taken in the neighboring marine area from a depth of 0.5 m.
Samples were taken using a Whale Premium Submersible Pump GP1352 (Bangor, UK) and fixed with formaldehyde at a final concentration of 2%.
For every survey, hydrological parameters were measured throughout the entire water column, including PhP sampling horizons. In the zone with sharp hydrological gradients (chemocline), measurements were taken every 10 cm. Salinity, temperature (°C), and redox potential (Eh) were measured in situ with a YSI Pro multiparameter meter (San Diego, CA, USA); the dissolved oxygen content was determined using a YSI Pro ODO dissolved oxygen instrument (San Diego, CA, USA), pH was measured with a WaterLiner WMM-73 portable pH-meter (Metronx, Taiwan), and illuminance with a LuxLiner LMI-20 light meter (MetroniX, Beijing, China) modified for underwater usage. In January, all measurements were taken under a hole drilled in the ice.
The daylength was calculated according to the data of the site [46]. The boundary of the photic zone was considered to be the depth to which 1% of the solar radiation penetrated.

2.3. Sample Processing

To count cells in the counting chamber, water samples were concentrated by reverse filtration technique using nuclear track membrane filters (Dubna, Russia) with a pore diameter of 4–5 μm, and using the settling method [47,48]. Algae were counted in a Nageotte chamber (volume 0.05 mL) under a MICMED-1 light microscope (LOMO, Saint-Petersburg, Russia) at ×300 magnification and with water immersion at ×600 magnification. A total of 4–7 cameras were counted.
The modern classification of algae utilized corresponds to the Algae Base electronic database [49]. Unidentified algae were divided into size groups according to the maximum linear size. Coccoid and flagellated cells that have not been identified were combined into a group of NCF (not-identified cocci and flagellates) with gradation by size. Diatoms were additionally examined using a scanning electron microscope (Camscan S-2 Cambridge Scanning Electron Microscope, UK) at the Center for Collective Use of Lomonosov Moscow State University. The procedure for preparing samples for examination through scanning electron microscopy was carried out according to the Simonsen method [47].
When counting and identifying, algae cells were measured with an eyepiece micrometer. Cell volumes were determined using the formulae presented in the Nordic Microalgae electronic database [50]. Carbon biomass was calculated according to the equations of [51] and assuming that 1 µm3 corresponds to 1 pg (10−12 g) of cell biomass [47]. The measurements were carried out for 1–25 cells of each species and the average carbon biomass of the species (or group of species of a certain size range) was determined. Carbon biomass of PhP (BC) was calculated by multiplying the number of cells by their carbon biomass. The integrated carbon biomass (Bint, mg C/m2) in the water column was estimated by trapezoidal integration of BC from the surface to the chemocline.
Algae trophic type was determined using [50], for Micracanthodinium claytonii using [52], or visually by the presence of chlorophyll.

2.4. Statistical Analysis

Statistical analysis was performed using the PRIMER (v.6) and PERMANOVA+ software package [53]. BC of PhP taxa was normalized by square root transformation, allowing each taxon to influence the similarity within and among samples. Bray–Curtis similarity index was calculated for each pair of samples. A non-metric multidimensional scaling (nMDS) plot was used to visually display the similarity relationship between the respective pairs of samples. The closest samples were combined into Groups. A post hoc analysis of similarity (one-way ANOSIM) was used to determine if the groups identified by nMDS differ from each other significantly. ANOSIM was also used to estimate the reliability of differences between samples from different horizons and between samples taken on different dates. The similarity percentage analysis (SIMPER) routine was used to explore the dissimilarities between groups of samples and the similarities within groups of samples. Moreover, this output was used to identify the contribution of each taxon to the overall similarity within groups [54] at a cutoff of 90% cumulative contribution. The species that contributed to similarity within groups are described as typical (TSs) of groups.
To analyze the effects of environmental parameters (depth, daylength, air temperature, water temperature, salinity, dissolved oxygen concentration, water pH, and illuminance) on the BC and community structure, distance-based linear modeling (DistLM) was performed. Distance-based redundancy analysis (dbRDA) was used for the ordination and visualization of the fitted model [53,55].
Correlation analysis was performed using the Microsoft Excel 2016 program.

3. Results

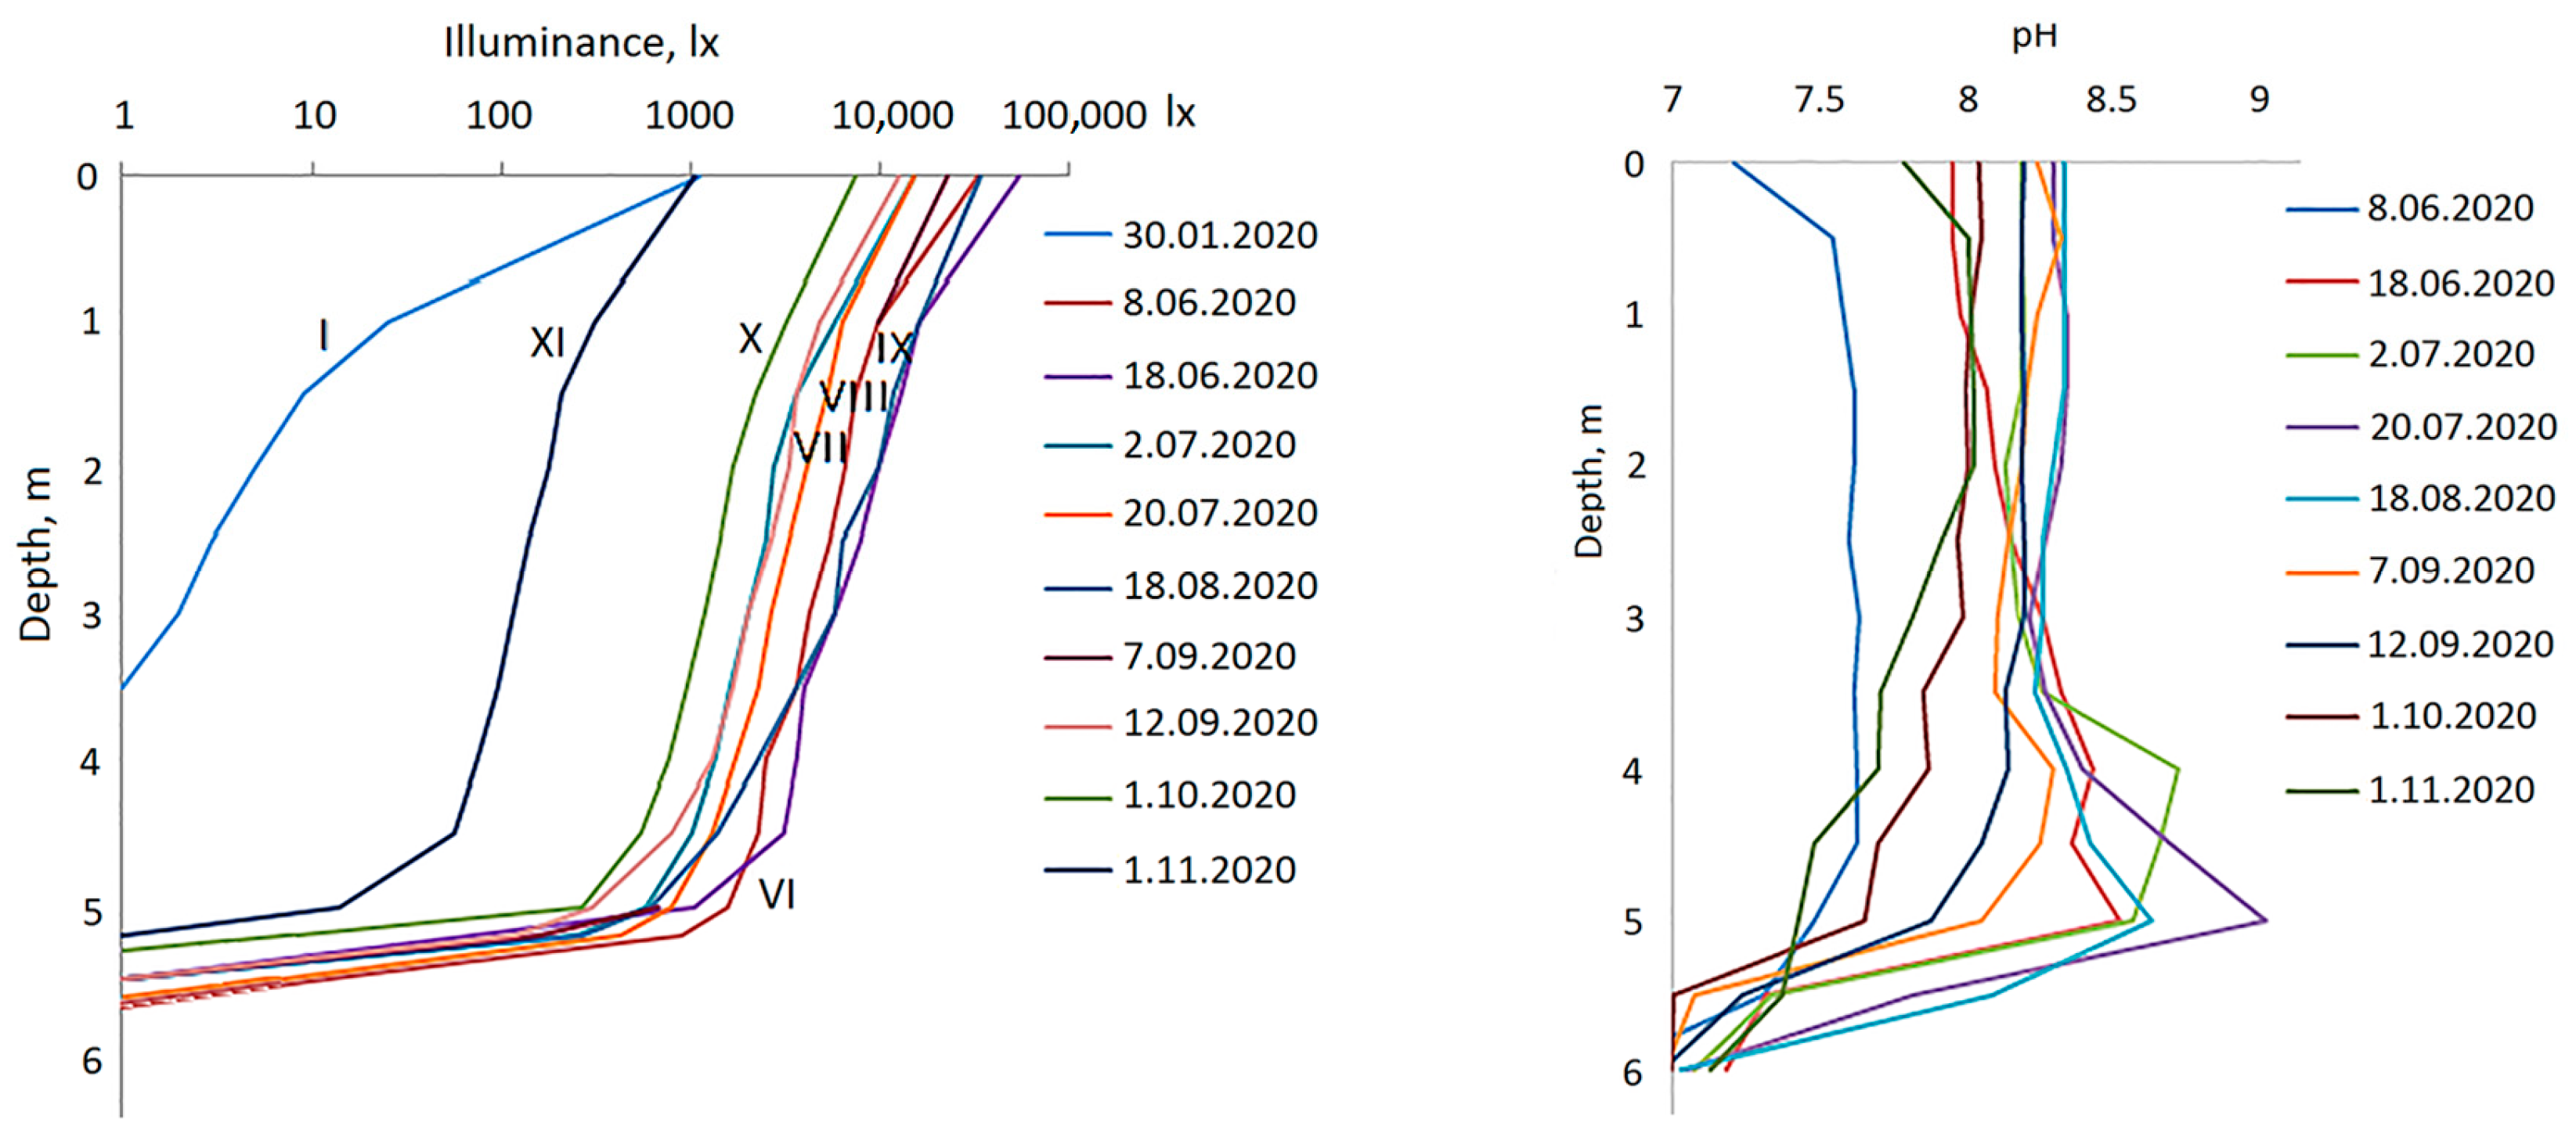
3.1. Hydrological Conditions

The entire water column in the Lagoon was salty throughout the year (Figure 3). Despite the influence of the fresh runoff and precipitation, the salinity of the surface layer never fell below 20‰, and during the freeze-up period it increased to 25.7‰. At a depth of 1 m, the range of seasonal salinity fluctuations was 21.1–25.8‰, at deeper levels they attenuated. Starting from a depth of 4 m, salinity variations did not exceed 1‰. Based on salinity in the Lagoon, the water column can be divided into several zones: (1) the surface layer (0–1 m) characterized by the widest range of seasonal variations; (2) the halocline at 1–2.5 m; (3) the 2.5–4 m layer with higher salinity; (4) a depth of 4–5 m is the second halocline; (5) and from a depth of 5.5 m and below is a near-bottom zone with high salinity (more than 28‰). In the sea, salinity values varied in the range of 20.2–24.6‰ in the summer–autumn period, and increased to 27‰ in winter.
The temperature also varied at different depths of the Lagoon (Figure 3). During winter, the cooling to negative temperatures (°C) spread to the depth of 4 m; starting from 4.5 m and below, the temperature was positive throughout the year. Near the surface, the temperature varied from −1.1 °C (in January) to +22.6 °C (at the end of July); in the near-bottom horizon at a depth of 6 m, the temperature varied from +2.8 °C to +8.4 °C. The seasonal course of temperature varied at different horizons. In the layer from the surface to a depth of 2.5 m, maximum heating was recorded at the end of July, at the depths of 3–4 m it was recorded in August, at 4.5–5.5 min September, and in the bottom zone in October.
The seasonal course of temperature in the adjacent marine area was similar to that in the surface layer of the Lagoon, but the summer temperature was 1–5 degrees Celsius lower in the sea. In November, the surface water layer in the Lagoon cooled down faster than in the sea, favoring a freezing outrun.
The oxygen regime varied significantly in different water layers of the Lagoon (Figure 4). In the surface layer of 0–1 m, the dissolved oxygen concentration corresponded to the saturation throughout the year, just slightly lower in January (88%). In January, October, and November, the concentration of oxygen decreased with depth, to zero at a depth of 4.5–5.0 m. In the summer months, a deep oxygen maximum was observed, amounting to 14–22 mg/L (up to 186% saturation) in the middle part of the water column. Immediately below this horizon, just 0.5 m lower, oxygen dropped sharply. The upper border of the anaerobic zone was situated at a depth of 5.2–5.5 m in summer. The profiles of the redox potential clearly show how abruptly the jump from an aerobic environment with positive Eh to an anaerobic environment with negative values occurs in the chemocline (Figure 4). Near the bottom, Eh was always less than −300 mV, while in the zone supersaturated with oxygen, its values were (+100)–(+200) mV. Thus, the potential difference recorded in the chemocline of the studied Lagoon could reach up to 0.4–0.5 V.
In the sea, concentration of dissolved oxygen corresponded to saturation at a given temperature. The minimum value of 10.2 mg/L was recorded during the warmest time and the maximum value of 13 mg/L in November. In January, the oxygen concentration in the sea was not measured.
The pH profiles were in good agreement with vertical zonation for other hydrological parameters (Figure 5). The surface layer stands out, where the pH was, at times, slightly lower than in the underlying water. Between the depths of 0.5 m and 3.5 m, pH was almost uniform. It varied seasonally, gradually shifting to the alkaline during the PhP growing season. In summer, pH was noticeably higher at a depth of 4–5 m than in the overlying stratum. Below the 5 m horizon, pH sharply decreased; the lowest values were recorded near the bottom. In this water body, pH never dropped below the neutral value of 7.0.
The light regime in the water column of the Lagoon in summer was characterized by a gradual light attenuation from the surface to a depth of 4.5–5 m and sharp drop at a depth of 5.0–5.5 m, where the chemocline was located (Figure 5). In a chemocline, a suspension of microorganisms absorbs and scatters light, so the near-bottom 1–1.5 m zone is aphotic. When the Lagoon was covered with ice, the underwater light intensity was lower than in summer. In January, the maximum depth of light propagation (under the measuring hole drilled in the ice) was 3 m, and in November it was 5 m.
The compensation depth, where 1% of sunlight penetrates, was in the upper part of the chemocline at a depth of 5.1–5.3 m from June to November; in January it was at 1.5 m. According to measurements of underwater illuminance, all the samples were taken in the euphotic zone, but the ones from the chemocline at a depth of 5.0–5.4 m were taken on its lower boundary.
The daylength was 6 h in January, 24 h in June–early July, then gradually decreased until it had decreased by 7.2 h in the beginning of November.

3.2. Taxonomic Composition of Algal Flora

In total, 293 species were found, including 227 identified to species or genus level, belonging to 19 classes and 10 phyla (Table 1).
Most of the identified algal flora is represented by marine species, but there were also 38 freshwater species belonging to seven classes: Cyanophyceae (25), Bacillariophyceae (5), Coscinodiscophyceae (2), Chlorophyceae (2), Chrysophyceae (2), Trebouxiophyceae (1), and Zygnematophyceae (1).
Lists of the phytoplankton taxa indicating their occurrence at different depths (m), and in the surface water layer (0.5 m) of the adjacent White Sea area are given in the Electronic Supplementary Materials (Tables S1–S10).

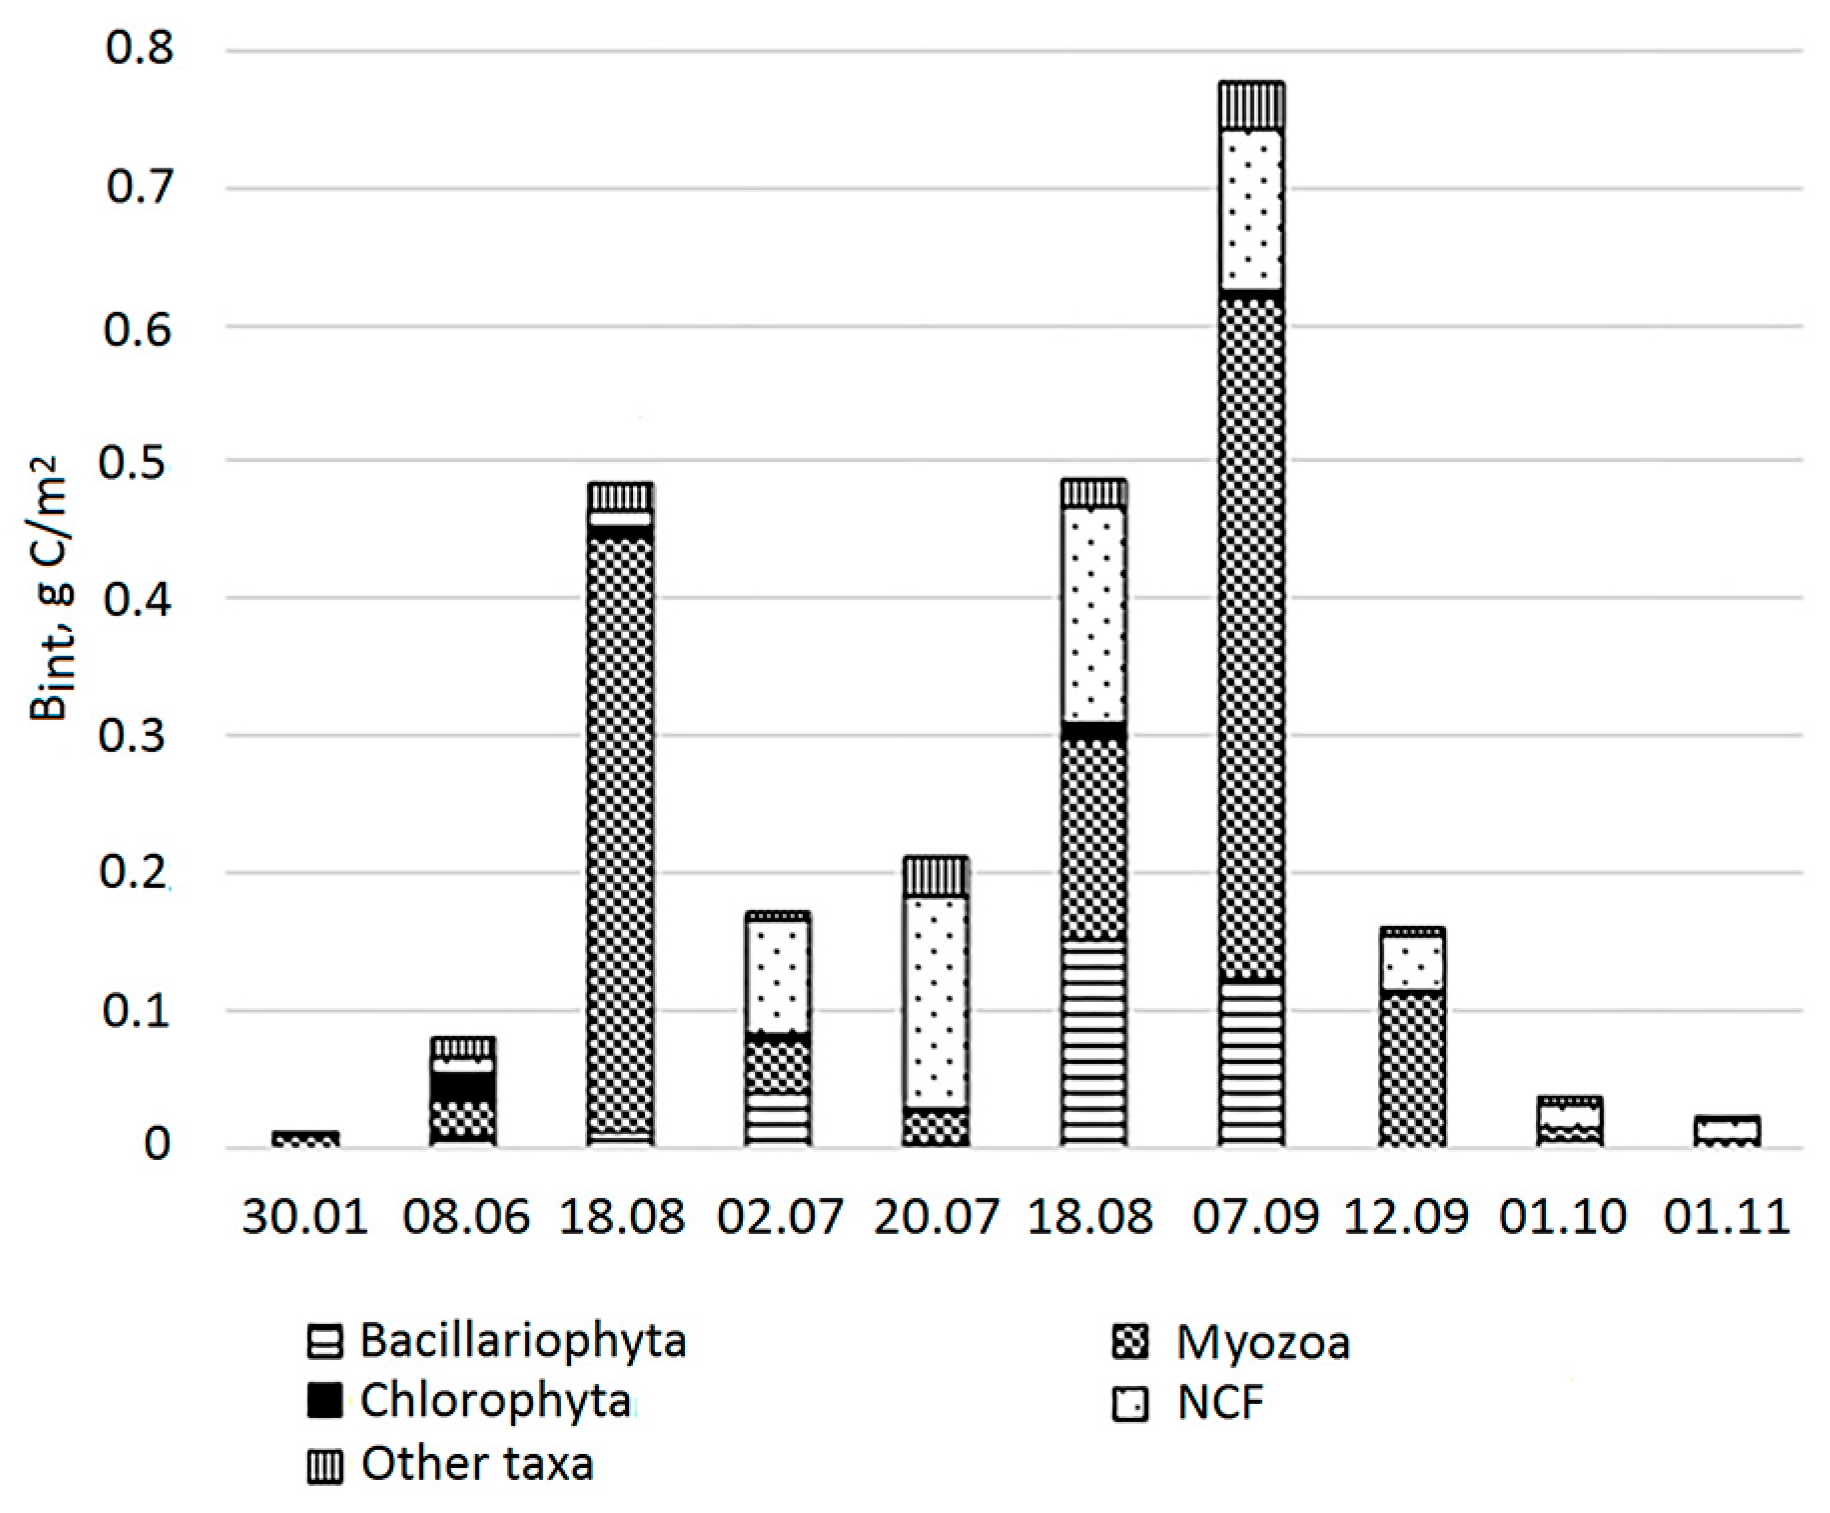
3.3. Biomass and Dominant Taxa in the Lagoon

Bint in the water column varied from 0.01 g C/m2 in January to 0.78 g C/m2 in early September (Figure 6).
In winter, PhP in the Lagoon was scarce, a little more concentrated in the chemocline below the redox transition, where oxygen was already absent (Table 2 and Table S1). The upper horizons were dominated by autotrophic dinoflagellates and freshwater cyanobacteria. At the depth of 2.5–3.5 m, various types of heterotrophic dinoflagellates and autotrophic NCF predominated. In the chemocline, algae were presented mostly by heterotrophic dinoflagellates. The similarity between communities from different depths was low and determined by seven common species (Table 3). The most important contributors to the similarity were Gymnodinium wulffii, which dominated at a depth of 2.5–4.5 m, and Paralia sulcata, which was not among the dominants.
In early June, the Bint was also low. It was represented by different phyla, among which dinoflagellates and green algae predominated, and to a lesser extent, diatoms and NCF (Table S2). Autotrophs accounted for the largest share (0.75) in Bint (Figure 7). They dominated mostly in the surface layer of the Lagoon and in the chemocline, as well as in the surface layer of the sea. The highest BC was noticed in the chemocline of the Lagoon. According to a SIMPER analysis, the similarity between the communities at different depths was 38% based on 19 species (Table 3 and Table S2). Major contributors were dinoflagellate Heterocapsa rotundata and prasinophyte flagellate Pyramimonas cf. diskoicola.
In mid-June, Bint increased due to the growth of dinoflagellates, mostly autotrophic. Autotrophs dominated in the surface layer and in the chemocline. The highest BC was observed in the chemocline, where Gymnodinium arcticum dominated (0.97). The similarity between communities at different depths was 37% and was determined by 16 species (Table S3). TSs were diatom Cyclotella choctawhatcheeana and marine heterotrophic Cercozoa Ebria tripartita, brackish-water cyanobacterium Synechocystis salina, and dinoflagellate G. arcticum.
In early July, Bint decreased by more than 2 times compared to that in mid-June, mainly due to a decrease in the Bint of dinoflagellates by more than 11 times. At the same time, the Bint of diatoms and NCF increased. Just like in June, PhP was mostly autotrophic in the Lagoon with the dominance of autotrophs at all depths except for 1.5 m. The highest BC, as before, was observed in the chemocline, but this time due to the growth of small-cell NCF. The similarity between the communities at different depths was 40%, and was determined by 10 species (Table S4). The TSs for all horizons were C. choctawhatcheeana and chrysophyte Ollicola vangoorii.
In mid-July, Bint was close to that in early July. The Bint of diatoms and dinoflagellates continued to decrease, while the abundance of NCF and other taxa (Ochrophyta, Cercozoa, and Cryptophyta) increased. The PhP continued to be mostly autotrophic with the dominance of autotrophs in the surface layer and in two samples close to chemocline. The highest BC was also observed in the chemocline due to the abundance of small unidentified cells. The similarity between the communities of different horizons was 42% and was determined by 19 species. C. choctawhatcheeana, as well as cryptomonads and E. tripartita, remained TS in all layers of the Lagoon (Table S5).
In mid-August, Bint increased again to the level of mid-June due to an abundance of diatoms and dinoflagellates. PhP continued to be mostly autotrophic, but the Bint of hetero- and mixotrophs increased. Autotrophs dominated from the surface down to a depth of 3.5, while in the chemocline, unlike in previous periods, both autotrophs and heterotrophs dominated. The highest BC was observed in the chemocline due to the development of unidentified species with green oval cells, as well as heterotrophic dinoflagellate O. marina. The similarity between the communities at different depths was 40% and was determined by 19 species with C. choctawhatcheeana as the most typical species throughout the lagoon water column (Table S6).
In early September, Bint increased to maximum values mainly due to increase in the abundance of dinoflagellates. The trophic statue of the PhP shifted to mostly heterotrophic and mixotrophic. Autotrophs continued to dominate from the surface to a depth of 3.5 m and in the chemocline, while heterotrophs dominated above the chemocline. An increase in the number of two species (Kryptoperidinium triquetrum and C. choctawhatcheeana) led to a significant growth of BC at the horizons of 1.5 m and 3.5 m. Nevertheless, the highest BC, as previously, was observed in the chemocline where dinoflagellates O. marina and Lebouridinium glaucum, Gymnodinium sp., and unidentified species with small green oval cells dominated. The similarity between the communities at different depths was 45% and was determined by 25 species (Table S7). C. choctawhatcheeana was TS in the lagoon community again, and dinoflagellate K. triquetrum spores were added.
In mid-September, 5 days after the previous sampling, the values of Bint decreased by almost five times, along with decrease in the abundance of all taxa. PhP became mostly heterotrophic. Heterotrophs dominated in all horizons except for the surface layer. The highest BC, as before, was observed in the chemocline; the main contributor was heterotrophic dinoflagellate O. marina, and to a lesser extent NCF. The similarity between the communities at different depths was 46% and was determined by 21 species, none of which contributed more than 10% to the similarity. K. triquetrum was the TS (Table S8).
In the beginning of October, Bint decreased by more than four times due to a decrease in the abundance of all taxa. This time, autotrophs dominated. BC was the highest in the chemocline. O. marina constituted the bulk of the PhP in the chemocline. The similarity between the communities at different depths was 41% and was determined by nine species (Table S9). TSs for the PhP community in the Lagoon were C. choctawhatcheeana, cryptomonads, and K. triquetrum.
By the beginning of November, the abundance of all taxa continued to decline; Bint decreased by another 1.5 times. PhP remained mostly autotrophic. It is not possible to assess the difference in trophic status between the horizons, since many horizons were dominated by unidentified species. The highest BC recorded was at a depth of 1.5 m, where a large amount of NCF with a cell diameter of 10 µm were observed. O. marina was absent in the chemocline, replaced by cryptomonads, a few species of Gymnodinium, and the heterotrophic dinoflagellate Micracanthodinium claytonii as dominants. The similarity between the communities at different depths was 32% and was determined by 13 species (Table S10). The TSs in the lagoon PhP community were species of the genus Gymnodinium and the freshwater algae Monoraphidium contortum (Chlorophyceae).

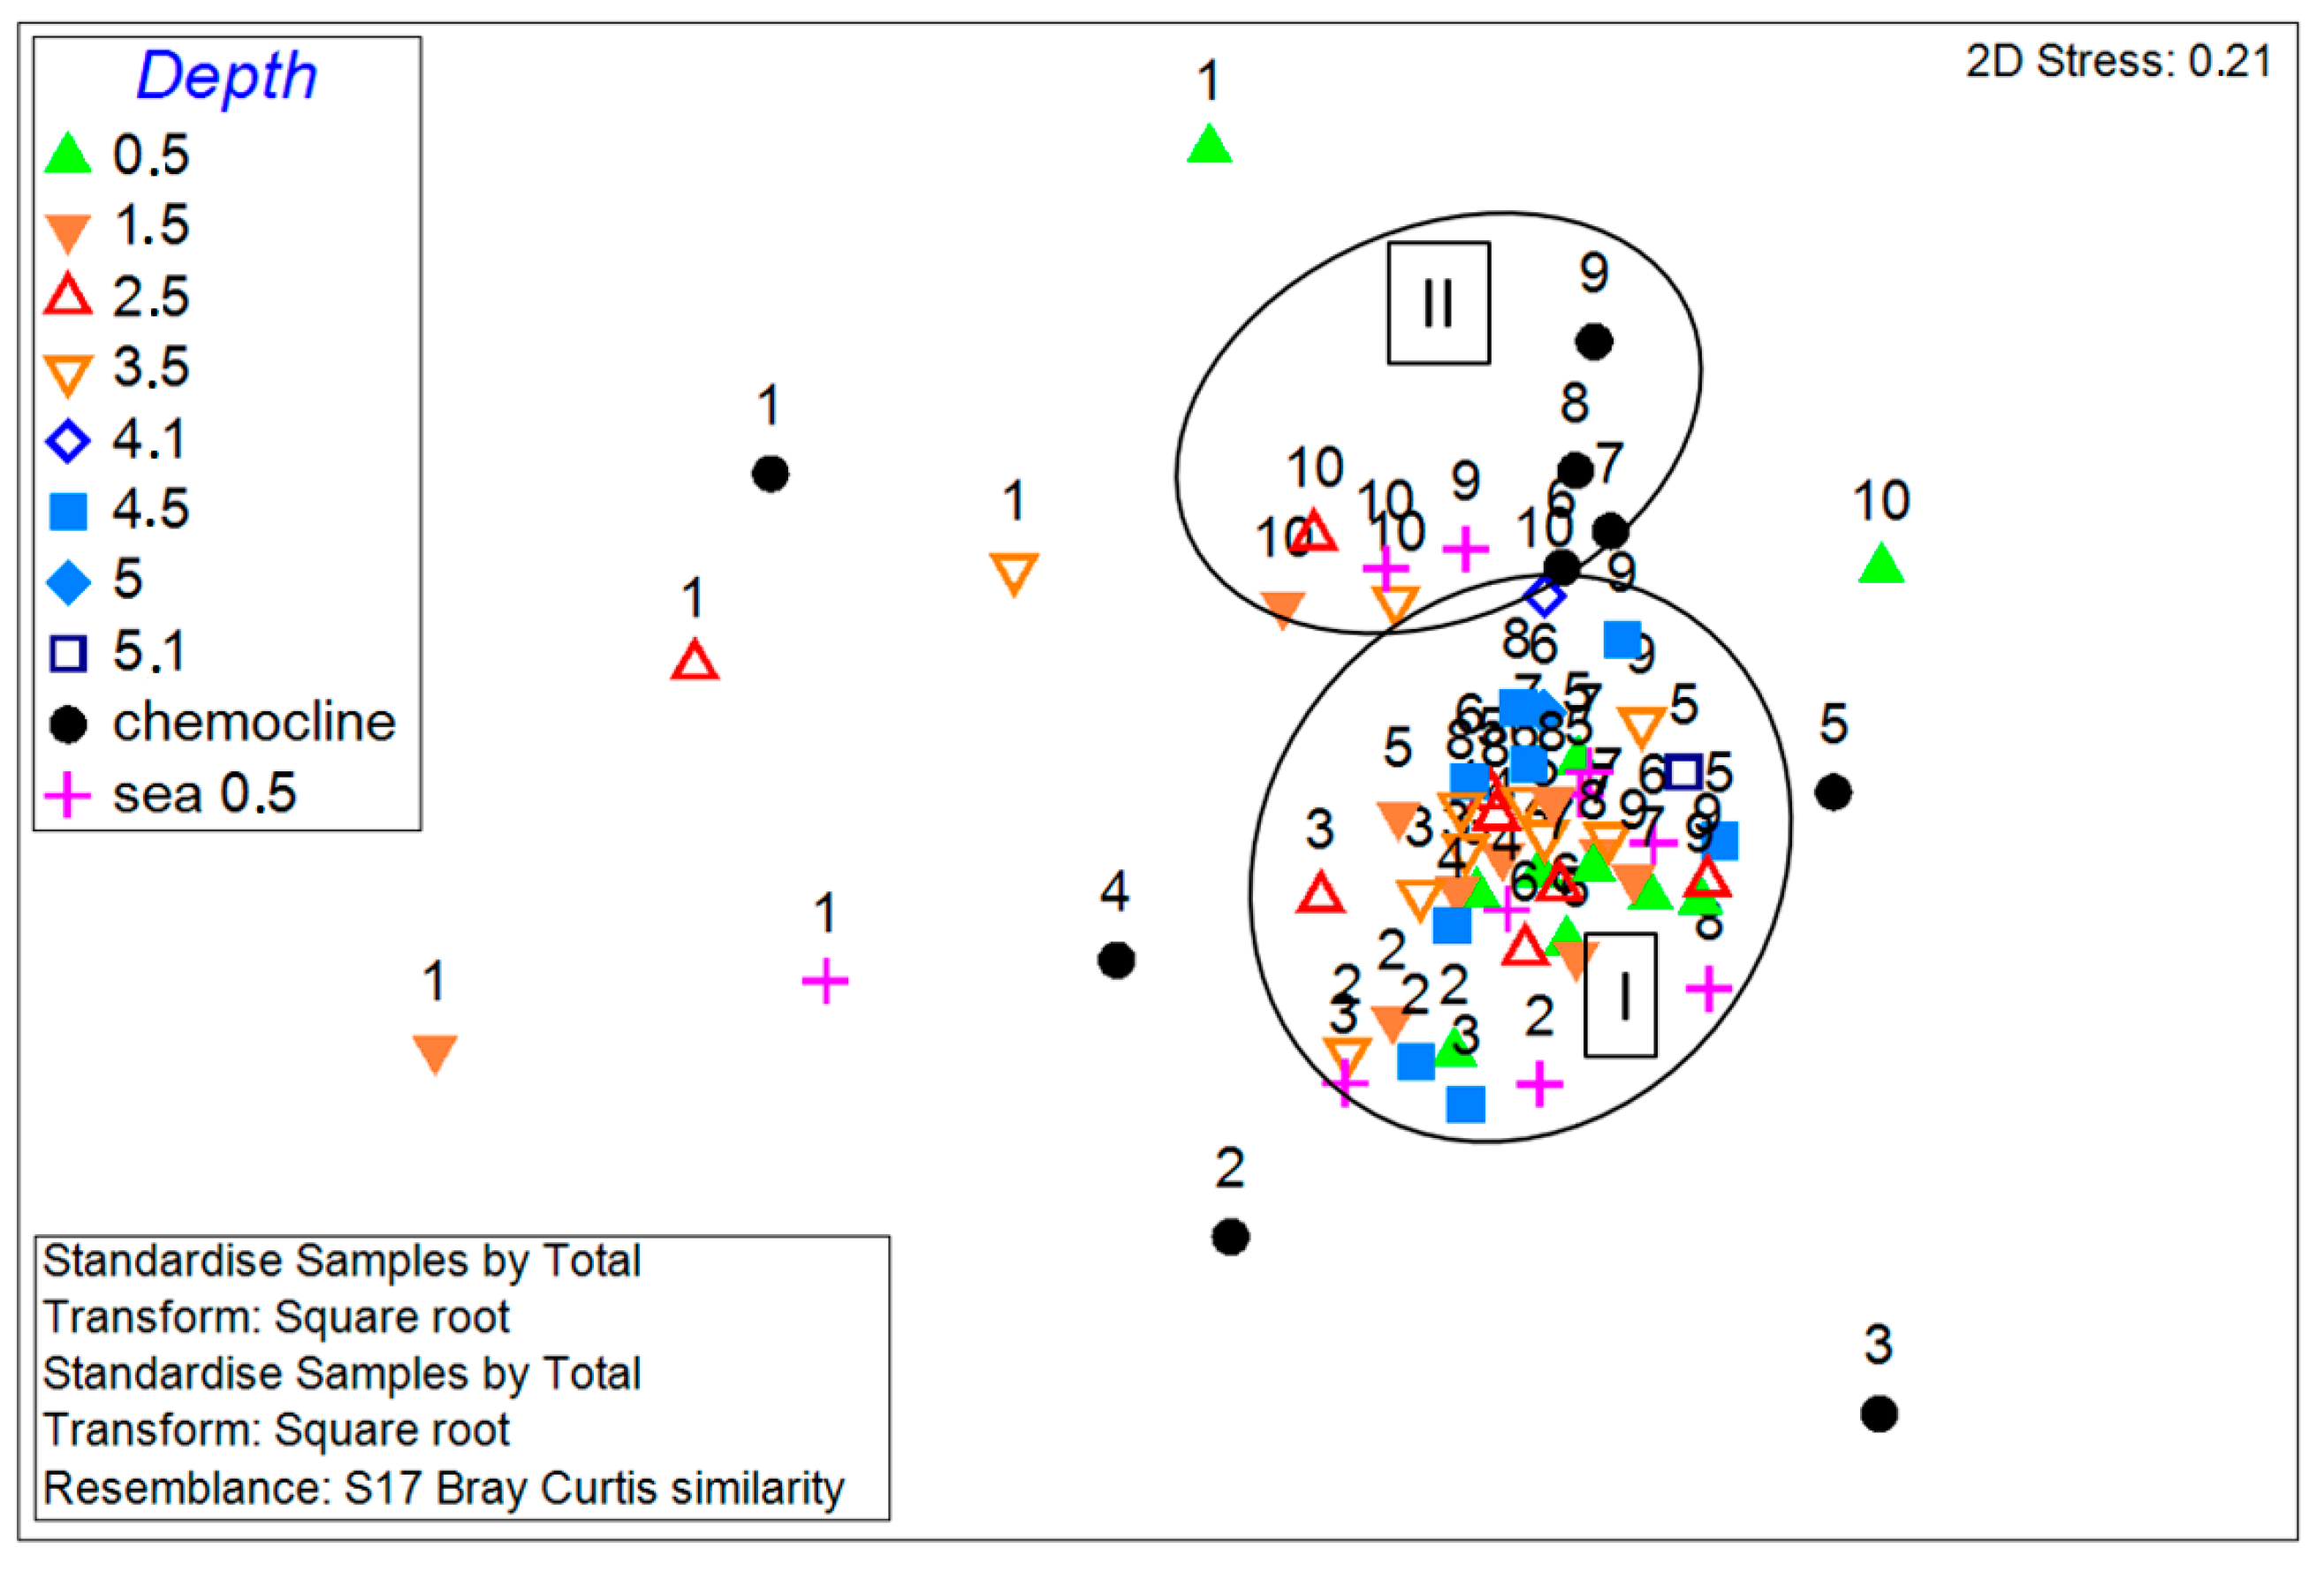
3.4. Phytoplankton Communities in the Lagoon and Sea

One-way ANOSIM revealed significant differences only between samples collected on different dates (R = 0.442, p = 0.1%) and insignificant differences in PhP communities from different horizons (R = 0.07, p = 2.7).
Non-metric multidimensional scaling (nMDS) of biomass-based (BC) PhP samples grouped the samples into two similarity groups (Figure 8). Group I includes samples from the water column above the chemocline collected from June to October, and marine samples from June to September. Group II includes almost all November samples throughout the water column in the Lagoon, most of the seasonal samples from the chemocline, and samples from the sea collected in October–November. None of the similarity groups include samples taken in January. June and July samples from the chemocline are located separately, as is the November sample from the surface layer.
One-level ANOSIM revealed significant differences between the two similarity groups (R = 0.677, p = 0.1%). According to the results of the SIMPER analysis, the groups differ by 79%; differentiating species are O. marina, Gymnodinium spp., H. rotundata, and P. cf. diskoicola. The similarity of the PhP structure within Group I was 35%; TSs of the group were C. choctawhatcheeana, P. cf. diskoicola, and H. rotundata. The similarity within Group II was 32%; TSs of the group were Gymnodinium spp., O. marina, and C. choctawhatcheeana. The last species was TS in both groups, but its abundance differed, being higher in Group I.

3.5. The Structure of the PhP in the Surface Layer of the Lagoon and the Sea

In winter, BC in the sea was several times higher than the in the Lagoon. The composition of dominants in the surface layer of the Lagoon and in the sea differed. Autotrophic dinoflagellates predominated in the Lagoon, and mixo- and heterotrophic forms vegetated in the sea (Table 2). Two species of Dinophysiales (Dinophysis acuminata and Phalacroma rotundatum) dominated in the sea, and BC was low there. The similarity between the marine and lagoon communities was 10% due to Protoperidinium brevipes vegetating in both areas (Table 4).
In early June, BC was the same in the sea and in the Lagoon. Marine PhP was partly similar to those in the Lagoon: two dominating species were the same (Heterocapsa rotundata and P. cf. diskoicola), but co-dominants were different. There were NCF cells (3–5 µm) in the lagoon; Skeletonema costatum and cryptomonads dominated in the sea. S. costatum was present in all horizons of the Lagoon except for the surface layer; cryptomonads appeared everywhere, but in smaller quantities (Electronic Supplementary Material, Table S2). Due to 10 common species, the similarity between PhP in the sea and in the Lagoon (42%) was higher than the similarity between the communities from different horizons of the Lagoon. Dominants H. rotundata, P. cf. diskoicola, along with cryptomonads and golden algae O. vangoorii contributed the most to the similarity between the marine and lagoon communities.
In mid-June, BC in the sea was several times higher than that in the Lagoon, and the dominants were different. In the sea, it was the filamentous diatom S. costatum, but in the Lagoon it was C. choctawhatcheeana. The similarity between the PhP from the sea and the Lagoon was only 23% due to nine TSs. The main contributors were E. tripartita and euglenoids.
In early July, the BC in the sea was also several times higher than in the Lagoon. In marine plankton, S. costatum continued blooming accompanied by dinoflagellate H. rotundata. In the Lagoon, C. choctawhatcheeana remained among the dominant species; the dinoflagellates H. rotundata and the green algae P. cf. diskoicola were common to the Lagoon and to the sea; the most abundant were unidentified flagellates. The similarity between the sea and lagoon communities was quite high and amounted to 42% due to nine characteristic species. H. rotundata and P. cf. diskoicola were the main contributors.
In mid-July, the BC in the sea slightly exceeded that in the lagoon surface water layer. In the sea, the dominants had changed. Vegetative cells and spores of dinoflagellates K.triquetrum appeared, and cryptomonad cells and NCF appeared in high numbers. In contrast, in the Lagoon, the dominants remained the same: H. rotundata and P. cf. diskoicola. The similarity between the communities of the sea and the Lagoon was high (47%) due to 14 TSs. H. rotundata and Gymnodinium spp. had the greatest influence on the similarity.
Starting from mid-August, the BC in the sea began to lag behind the Lagoon, where it was several times higher. The sea was dominated by H. rotundata and P. cf. diskoicola; in the Lagoon, H. rotundata and Tripos arcticus dominated. The similarity between the surface PhP community in the sea and in the Lagoon was 47% due to nine TSs. H. rotundata and P. cf. diskoicola made the greatest contribution to the similarity.
In early September, BC in the sea was slightly lower than that in the Lagoon. In the marine area, P. cf. diskoicola remained among the dominants, and cryptomonads were added. In the Lagoon, H. rotundata, which dominated here in the previous period, reduced its contribution to BC, while K. triquetrum, Lepidodinium chlorophorum, and C. choctawhatcheeana came to the forefront. The similarity between the communities of the sea and the Lagoon decreased to 40%, and it was determined by nine TSs. The greatest contribution to the similarity, as in the previous period, was made by H. rotundata and P. cf. diskoicola, together with C. choctawhatcheeana and cryptomonads.
By mid-September, the BC in the sea became somewhat higher than in the Lagoon. Marine PhP was represented mainly by cryptomonads, while K. triquetrum, H. rotundata, and cryptomonads continued dominating in the Lagoon. The similarity between the sea and lagoon PhP communities increased up to 43% and was determined by six TSs. As in the previous period, H. rotundata, cryptomonads, P. diskoicola, as well as C. choctawhatcheeana contributed to the similarity the most.
In October and November, BC in the sea decreased faster than in the Lagoon. In early October, BC in the sea was more than eight times lower compared with the marine one. Marine PhP was dominated by cryptomonad cells and NCF; in the Lagoon, cryptomonads, C. choctawhatcheeana, and a few species of the genus Gyrodinium were dominating. The similarity between PhP communities of the sea and the lagoon was 32%, and it was determined by four TSs with the largest contribution coming from cryptomonads, C. choctawhatcheeana, and K. triquetrum.
In early November, BC in the sea was five times less than that in the Lagoon. At the same time, only NCF (10 μm) dominated in the sea, while E. tripartita and the diatom Melosira sp. dominated in the Lagoon. The similarity of PhP was 25%, and it was determined by seven TSs with the largest contribution coming from K. triquetrum, Cocconeiscostata, M. contortum, and Thalassionema nitzschioides.

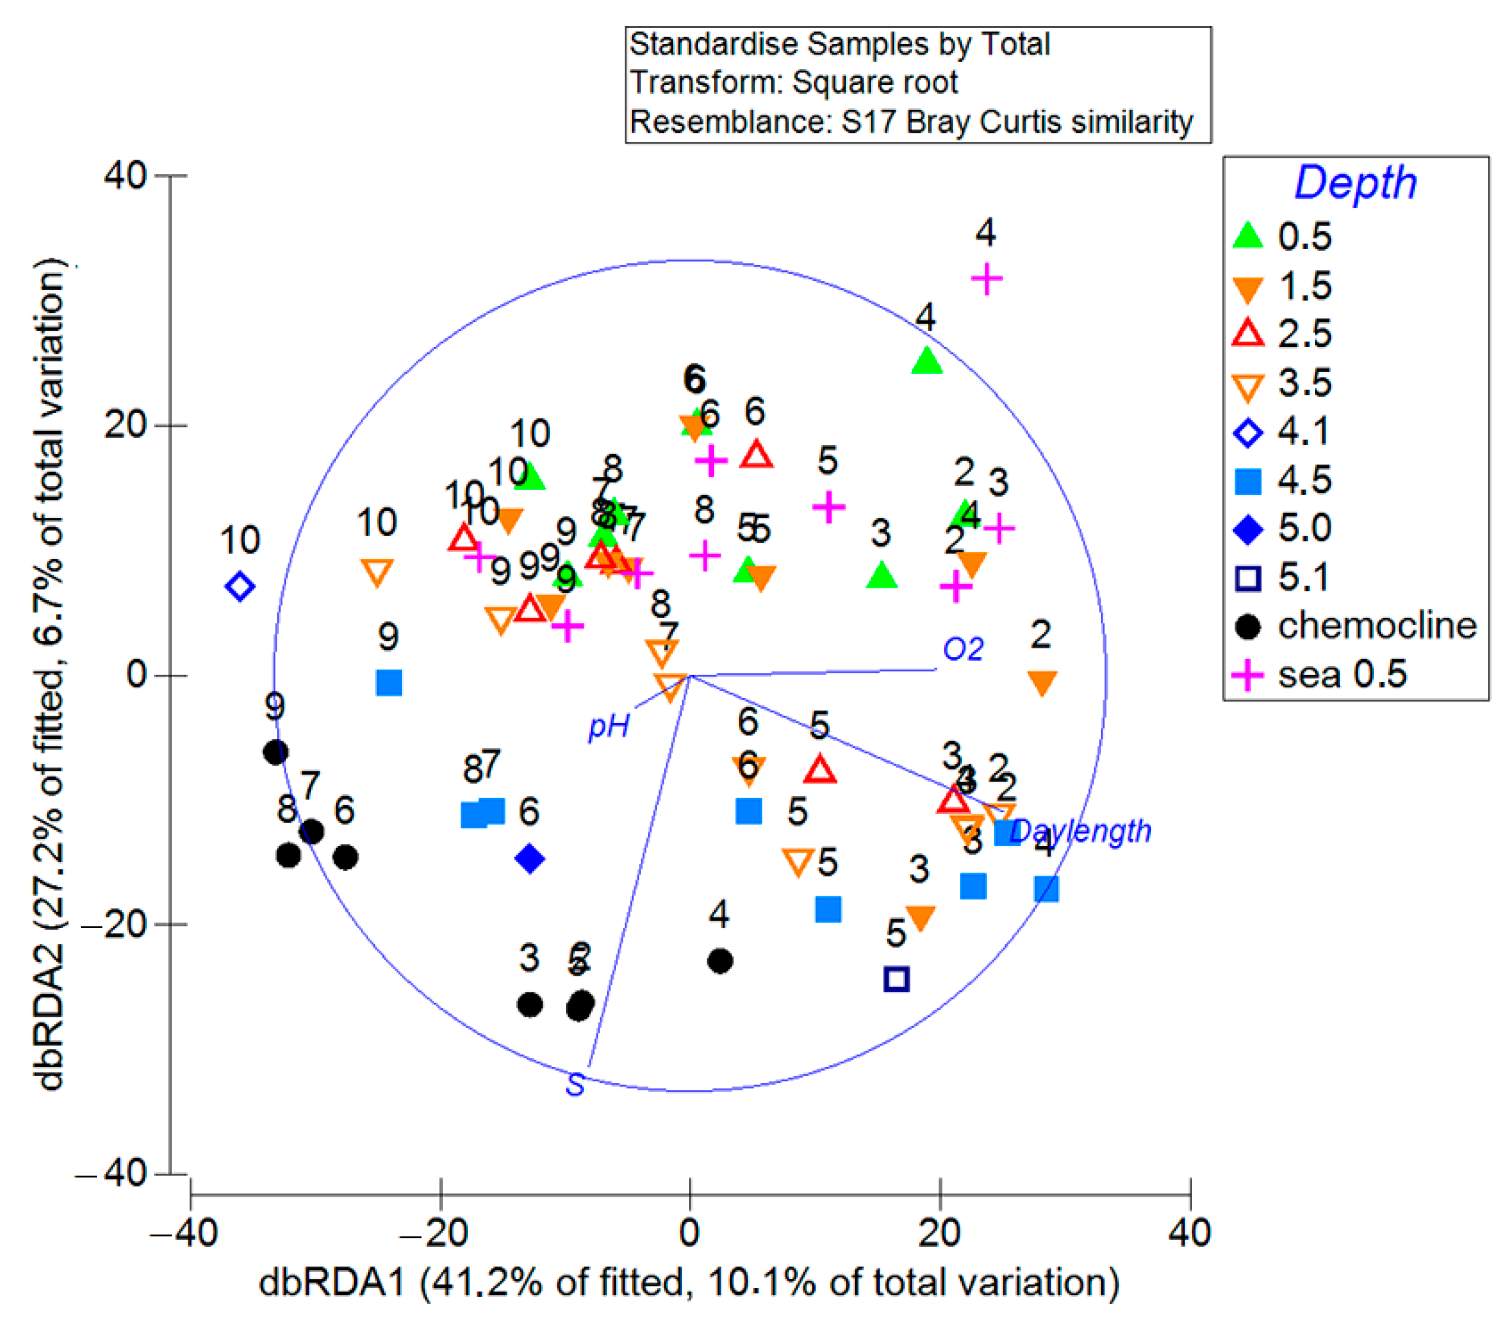
3.6. Environmental Factors That Determine the Dynamics and Structure of Phytoplankton

In the marginal test DistLM, which determines the relationship of each factor with the structure of the community, regardless of other environmental factors, seven of the eight studied parameters (salinity, air temperature, concentration of dissolved O2, pH, Eh, daylength, and depth) correlated statistically significantly with the dynamics of PhP (p < 0.0003 in all cases). Only the effect of water temperature was found to be unreliable. In sequential tests, only four out of seven studied parameters showed a statistically significant relationship with the dynamics of the PhP structure (p < 0.0004 in all cases): daylength, salinity, dissolved oxygen, and pH. All of these predictor variables combined explained 24.5% of the variation in the species data cloud. Distance-based redundancy analysis (dbRDA) showed that during the year, the PhP structure in the sea and in the entire water column of the Lagoon changed chronologically along the gradient of the daylength (Figure 9).
The dependence of the PhP structure on the water salinity was also clearly expressed. Moreover, the division of samples into two groups was clearly visible: while one was confined to the upper part of the water column, the other was confined to the lower part. The boundary between the two groups of samples in early June was located at a depth of between 0.5 and 1.5 m, from mid-June to early September between 1.5 and 2.5 m, and from mid-September to November between 2.5 and 3.5 m. Despite the distinct division of the Lagoon samples into groups, ANOSIM did not reveal significant differences between the communities of these groups (R = 0.08, p = 0.4%). The vector of oxygen content in the water was close to the daylength vector and reflected its chronological decrease. BC and O2 were negatively correlated (−0.42), while the correlation of BC of autotrophs and BC of heterotrophs with O2 were also negative (−0.31 and −0.39, respectively). In summer, the pH values were more significantly associated with the development of PhP in the chemocline zone, where pH was shifted in the alkaline direction, indicating a decrease in the concentration of carbonates as a result of their use in photosynthesis.

4. Discussion

The Lagoon on Cape Zeleny is the second coastal stratified body of water, after lake Kislo-Sladkoe, in which similar studies have been carried out. Unlike lake Kislo-Sladkoe, the Lagoon is at an earlier stage of separation from the sea [1].
Several hydrological phenomena typical of coastal meromictic water bodies are observed in the Lagoon, and at the same time there are a number of atypical features [38]. The Lagoon is connected to the sea and receives daily injections of sea water during the ice-free period; however, this does not impair stable stratification, which was confirmed in this study. During the annual cycle, the layers with different water densities persisted: the upper water mass with a salinity approximately the same as in the sea; the underlying layer with a higher salinity; and the bottom layer with a salinity significantly exceeding that of the sea. We explain the latter by the release of brine during the freezing of salt water and its accumulation in the bottom depression. This Lagoon does not have a desalinated layer, despite the fact that the surface layer of water receives runoff from the catchment and precipitation. The reason is that the Lagoon has a very small catchment area, only seven times the area of the water table [1].
According to the totality of abiotic parameters, the water column of the Lagoon can be divided into several zones with different habitats and corresponding PhP communities: (1) The surface layer 0–1 m is a zone of wind mixing, heat exchange with the atmosphere, maximum insolation, influenced by an fresh runoff in summer, and partially frozen in winter; therefore, wide daily and seasonal fluctuations in temperature and salinity of water are observed here. (2) A layer at a depth of 1–2 m is a halocline. (3) At a depth of 2–4.5 m is a layer with a higher salinity compared to the top layer; due to solar heating in the absence of convection, a mid-depth temperature maximum as well as high dissolved oxygen concentration exceeding saturation sometimes appear in summer. The deep oxygen maximum is apparently associated with the photosynthetic activity of oxygenic phototrophs. This is also evidenced by a local increase in pH, indicating the consumption of the bicarbonate ion. The thermal and salinity regime is steadier here. In autumn, heat is retained in this layer of water longer than in the overlying surface layer. (4) In the depth range of 4.5–5.5 m, the boundary of the anaerobic zone (chemocline) is observed. The chemocline is characterized by sharp gradients of a variety of hydrological parameters, including salinity, temperature, oxygen concentration, Eh, pH, and, according to previous studies [38], concentration of nutrients. It also serves as a boundary of the photic zone because of the dense population of microorganisms absorbing and scattering sun light. The chemocline can contain eukaryotes and bacteria, including anoxygenic phototrophic purple sulfur bacteria and brown-colored green sulfur bacteria characteristic of the chemocline of this Lagoon [41,44,56]; (5) from a horizon of 5.5 m and below, there is a euxinic zone unsuitable for the vast majority of PhP representatives. Here, the salinity is even higher (more than 28‰), exceeding the salinity in the adjacent marine area.
Despite the fact that the Lagoon and the marine area are significantly different in hydrology and hydrochemistry, due to the periodic injection of water from the sea (to a lesser extent) and the historical origin of the Lagoon from the sea (to a greater extent), the Lagoon contains species common with the sea. There are many common species in the surface layer of the sea and in the water column above the chemocline of the Lagoon. In particular, there was a PhP community with C. choctawhatcheeana, P. cf. diskoicola and H. rotundata as TSs from June to October in the Lagoon (with the exception of the layer above the chemocline), and from June to September in the sea. Interestingly, in October–November, the structure of PhP near the sea surface was more consistent with the PhP structure in the lagoon chemocline.
On the other hand, the PhP of the surface layer in the Lagoon and in the sea differ significantly in composition, quantitative parameters, and seasonal dynamics. Not only did dominants differ, but so did the ratio of taxa with different nourishment.
Some forms that dominated the Lagoon were not found at sea, such as L. chlorophorum which was not found in the White Sea before, and T. arcticus which has previously dominated in the Velikaya Salma Straight not far from the study area at different times [57]. Three mass species that dominated the Lagoon, P. brevipes, C. choctawhatcheeana, and E. tripartita, never achieved a high biomass in the sea. These species are common in the White Sea [57], but rarely listed among the dominants. C. choctawhatcheeana was among the mass species in the under-ice water in the estuarine zone of the Severnaya Dvina River (Dvina bay of the White Sea) in March [58]. The dominance of C. choctawhatcheeana in nano-micro-phytoplankton was also noted in autumn samples from the Velikaya Salma Strait and the Rugozerskaya Bay of the Kandalaksha Bay of the White Sea [59]. C. choctawhatcheeana was also among the dominants in the Siberian saline meromictic lake Shira [14]. In the coastal lake Kislo-Sladkoe in 2019, C. choctawhatcheeana was also present in plankton, although it was not among the dominant and typical species; but E. tripartita was among the dominants almost all summer [22]. The last species was also among the dominants in the Dvina bay of the White Sea [57]; the domination of P. brevipes was also registered earlier under ice in Kandalaksha Bay [57]. Characteristic species of both the Lagoon and the lake were P. cf. diskoicola, H. rotundata, and K. triquetrum; they all are typical of the White Sea [57,60]. H. rotundata sometimes dominated in Kandalaksha Bay in July–August [57], or in July and October [61]; K. triquetrumas under the name of its synonym Gymnodiniumtriquetrum dominated in a vast area of Dvina and Onega bays and in the central part of the White Sea in the beginning of July [62]. Species of the genus Pyramimonas have also been found in the White Sea in recent years [57,60,61]. This species identity is not always clear, but P. cf. diskoicola was probably one of the PhP dominants in the Chupa Bay in summer [63].
Vice versa, all the species that dominated the sea were also found in the Lagoon. But the structure of dominance was different. Some of the usual dominants in the PhP of the White Sea, such as the filamentous diatom S.costatum and dinoflagellate D. acuminata [57], or dinoflagellate P. rotundatum found in the White Sea by [60], have never been abundant in the Lagoon.
Autotrophs always dominated in the surface water layer in the Lagoon, except for the moment of the onset of freeze-up (the late autumn period, 1 October and 1 November), while at the same depth in the sea, the contribution of cryptomonads potentially capable of mixotrophy was often high [64]. The similarity of the communities in the sea and the Lagoon never exceeded 42% during the ice-free period, as well as in summer (less than 47%). The largest contribution to the similarity came from, as a rule, to the dinoflagellates H. rotundata, K. triquetrum, diatom C. choctawhatcheeana, and green prasinophyte flagellate P. cf. diskoicola.
The seasonal trends of BC in the sea and in the Lagoon were also different. The mass development of PhP in the Lagoon began later than in the sea; in early summer, it lagged behind the sea in terms of biomass. But in August, as a result of an outbreak of H. rotundata, BC in the surface layer of the Lagoon exceeded that in the sea by an order of magnitude. In September, it decreased, but, nevertheless, remained quite high, although the sea experienced a depression of PhP. Even in November, the BC in the surface water layer in the Lagoon was more than five times greater than in the sea.
But even more significant were the differences in the structure of PhP within the Lagoon itself, on its different horizons. The most plentiful throughout the year was the chemocline layer, where the BC was 1–2 orders of magnitude higher than that in the overlying horizons. The dominant species in it were usually different from those in the overlying water column. Different species of the genus Gymnodinium, Gyrodinium spirale, Tetraselmis cordiformis, S. costatum, O. marina, L. glaucum, and small unidentified cocci and flagellates were typical of the chemocline in different seasons.
In addition, a regular change in the predominant type of nutrition was observed in the chemocline. In January, heterotrophs dominated in the chemocline, in the first half of the growing season, autotrophs dominated, in mid-August, the community changed from autotrophic to mixed, and by early October, to heterotrophic due to the actively growing heterotrophic species O. marina. In Lake Kislo-Sladkoe, heterotrophic flagellates, including O. marina, appeared in the Lagoon a month earlier, already in July [22]. Compared to a lake, the Lagoon is characterized by higher water transparency and a thicker photic zone, which creates favorable conditions for autotrophic PhP, including in the chemocline. Good light conditions last longer there. Light conditions worsen only in autumn, and as a result, mixotrophs and heterotrophs have an advantage in the chemocline where they have enough food such as bacteria, including phototrophic sulfur bacteria that form a high-density population there, and their metabolic products. In autumn, heterotrophic dinoflagellates O. marina develop in mass, actively eating the cells of small autotrophic algae, so the PhP in the chemocline is reduced. A similar effect was observed in Lake Kislo-Sladkoe in 2018, where this predatory protist, together with E. tripartita, significantly reduced the abundance of PhP in the chemocline [65].
Other layers than the chemocline differing in abiotic parameters also differ in the structure of PhP. The similarity between communities in different horizons during different months was 32–46% in summer and only 7% in winter, which is significantly lower than the similarity of the PhP structure of different layers noted in the White Sea during the full period from hydrological winter (end of March) to the beginning of hydrological summer (mid-June): 18–49% during the ice cover period from March to April, and 45–75% in May–mid-June [55]. The gradual increase in the role of heterotrophs in the PhP community during the growing season, the high BC in the chemocline, and the autumn dominance of O. marina in the chemocline are all patterns that were also noted in Lake Kislo-Sladkoe [22].
Among the important differences, one should mention the different seasonal biomass dynamics, the biomass’s higher values in the Lagoon as a whole, as well as differences in the species composition and dominants. Two summer and one autumn increase in Bint were noted in the seasonal PhP dynamics of the Lagoon; while there was no summer peak in Lake Kislo-Sladkoe, a PhP bloom was noted in spring, and an increase in autumn [22].
The maximum values of Bint in the Lagoon were noted in mid-June (0.49 g C/m2) and mid-August (0.49 g C/m2), which were almost three times higher than the values of Bint in the same months in the lake [22]. In autumn, the BC peak in the Lagoon started earlier: it was noted in early September, while in the lake it occurred in early October, and Bint in the Lagoon (0.78 g C/m2) was more than two times higher than that in the lake. Studies of the PhP in the White Sea show a difference in the dynamics of the abundance of PhP depending on local conditions and in different years [22]. The values of Bint and its dynamics in the Lagoon were close to those in the Chupa Bay of the Kandalaksha Bay of the White Sea [61], where Bint increased to 0.61 g C/m2 in early June and was 0.55 g C/m2 in mid-July, 0.62 g C/m2 at the end of August, and reached its maximum in early September (1.08 g C/m2). The difference in the dynamics and abundance of PhP was also shown for the lakes separated from the Sea of Okhotsk on Sakhalin Island [31,32,33,36].
Not only the abundance of algae, but also their taxonomic composition, changed in the Lagoon during the year. Dinoflagellates dominated in winter and early June, NCF in July, diatoms, dinoflagellates, and NCF in August, dinoflagellates in September, and NCF in October–November. In Lake Kislo-Sladkoe, E. tripartita and dinoflagellates contributed mainly to BC in the summer–autumn, while the contribution of NCF to Bint was insignificant, and diatoms dominated only in spring [22].
The most populated water layer in the Lagoon is the chemocline. Throughout the study period maximum algal BC in the water column was above the chemocline, except for 1 November, when maximum BC appeared at a depth of 1.5 m due to the development of NCF. The deep maximum of the PhP biomass is quite common in lakes during the stratification period [23,66]. In the relict meromictic Lake Mogilnoye, in August 2018, a maximum BC of up to 6 g/m3 was noted above the chemocline due to the development of the heterotrophic algae O. marina [67]. In our studies, the maximum BC of PhP with the dominance of O. marina (along with other dinoflagellates and NCF) in the chemocline was recorded in early September. At that time, the BC reached 1.5 g C/m3, which, in approximate conversion to wet biomass, was 25 g/m3, and several times exceeded the biomass in Lake Mogilnoye. An even higher BC value (1.73 g C/m3) was noted in the chemocline of the Lagoon in mid-June with the dominance of autotrophic dinoflagellates G. arcticum. In water bodies with an anaerobic zone, nutrients accumulate there [7]. If the photic zone reaches the chemocline, then conditions for the active growth of PhP are created above it due to the upward diffusion of nutrients [22].
One of the features of the chemocline is the concentration of heterotrophic and mixotrophic algae there, since this zone contains a larger number of their food objects, as well as suspended and dissolved organic matter [68]. In the water bodies separated from the White Sea, cryptophyte flagellates Rhodomonas bloom often appears at the early stages of isolation, causing a coloration of water in the chemocline [27,44]. In the water bodies more advanced on the path of isolation with a fresh mixolimnion, a colored layer is sometimes formed by Cryptomonas algae, or Euglena sp. [44]. They are all mixotrophs. In the Lagoon, in previous summer seasons, there was a red layer with Rhodomonas sp. [27,44]. In 2020, when this study was carried out, these flagellates were not abundant; they did not form a colored layer.
In November, the BC maximum shifted upward, into the subsurface horizon, which is apparently associated with water cooling and increased vertical circulation, partially eroding the chemocline, so that the algae appear in overlying layers.
On the contrary, in Lake Kislo-Sladkoe, algae were concentrated not only in the chemocline zone, but also in the middle part of the water column in the summer–autumn period. A possible reason is a release of nutrients from the anaerobic zone as a result of the previous complete mixing of water [22].
The PhP structure and dynamics in the Lagoon and the sea by 24.5% was related to the daylight, water salinity, oxygen content and pH. In in the lake Kislo-Sladkoe similar pattern was described. Unlike the lake, PhP structure in the lagoon was not associated with water temperature, values of underwater illuminance, and sampling depth.
In Lake Kislo-Sladkoe some valuable patterns were noticed: (1) complex temperature profiles were observed with the appearance of a “greenhouse effect” from May to September; (2) limitation of photic layer by low water transparency; (3) desalination of the surface water layer after ice and snow melting, which led to a freshwater PhP development there in June.
Among three factors that were important in Lake Kislo-Sladkoe (temperature, salinity, and illumination), only salinity correlates with the structure of the PhP in the Lagoon. The layered hydrological structure in coastal meromictic water bodies is associated with different water densities, which are determined by the concentration of substances dissolved in water, and temperature. At the same time, the contribution of temperature to variations in water density is much smaller than the contribution of its mineralization. Thus, the salinity profile reflects the vertical sequence of biotopes better than other parameters, not only as an ecological factor in itself, but as a vector of environmental variability.
Underwater illuminance did not limit the development of autotrophic PhP in the Lagoon, since its water is transparent, and most of the year light reaches the chemocline, below which PhP does not inhabit due to the presence of toxic hydrogen sulfide. It is interesting that BC usually reaches its highest values at the lower boundary of the photic zone, despite shaded conditions.
Dissolved oxygen concentration and pH depend on the activity of PhP. In summer, at a depth of 1.5–4.5 m, a layer appeared that was supersaturated with oxygen due to the accumulation of oxygen, realized as a result of photosynthesis. During the growing season, the oxygen content in the water declined with the increase in the BC, both auto- and heterotrophic. A shift of proportions between these groups towards the heterotrophs only partially explains this phenomenon. Additionally, total PhP biomass growth contributes to an increase in the microbial loop and an intensification of oxygen consumption for bacterial respiration and organic oxidation. The relationship between the structure of PhP and the pH factor above the chemocline reflects the shift of the carbonate equilibrium to the alkaline side due to the consumption of carbon dioxide during PhP photosynthesis.
The day length is important for phototrophic organisms and determines the seasonal dynamics of the PhP structure as a whole. In the Lagoon, this manifests itself in an increase in Bint in summer, a successive change in dominant forms, an increase in the role of mixotrophs and heterotrophs in the community with a decrease in daylight hours, and a biomass reduction in autumn. In Lake Kislo-Sladkoe, a seasonal change in the dominant abiotic factors was observed [22]. In the Lagoon, seasonality manifested itself in differences in the structure of the PhP and in the summer–autumn period (from June to October), and in November. At the same time, the chemocline community and the community of the overlying water mass are differently affected by the combination of the above-mentioned factors.

5. Conclusions

A total of 293 species and supraspecific taxa of algae and cyanobacteria were found in a saline semi-isolated meromictic lagoon on Cape Zeleny on the coast of the White Sea. Most of the identified species are marine, and 38 species are freshwater.
Despite the fact that the Lagoon is connected to the sea, the structure of their respective PhPs differ significantly in composition, quantitative parameters, and seasonal dynamics. According to a SIMPER analysis, the similarity of the communities in the sea and the Lagoon never exceeded 50%. In terms of biomass, the PhP development in the Lagoon lags behind the sea until mid-summer, but, starting from August, it surpasses it, and lasts longer than in the sea, until late autumn.
The vertical heterogeneity of PhP in the Lagoon corresponds to its vertical hydrological structure. The similarity between the communities of individual horizons was 32–46% in summer and 7% in winter. Throughout the year, the chemocline PhP community differs from the PhP of the overlying water column. The community of the chemocline is closer to the PhP of the adjacent marine area.
The most plentiful throughout the year was the chemocline layer. Here, for almost the entire year, there is a maximum BC, which is 1–2 orders of magnitude higher than that in the overlying horizons. Starting from the second half of the summer, mixo- and heterotrophic species of algae predominate.
The PhP structure and dynamics in the Lagoon and the sea were related to the day length, water salinity, oxygen content, and pH by 24.5%. It did not depend on water temperature, illumination in water, and depth.
According to the marginal tests DistLM, seven of the eight studied parameters (salinity, air temperature, concentration of dissolved O2, pH, Eh, daylength, and depth) correlated with the dynamics of the PhP in the Lagoon as well as in the sea at statistically significant levels; the effect of water temperature was found to be unreliable. Daylength, salinity, dissolved oxygen, and pH showed statistically significant relationships with the dynamics of the PhP structure in the Lagoon and in the sea. Salinity serves as a vector of the vertical sequence of ecological niches in the Lagoon. The daylength seems to be the crucial factor of the seasonal PhP dynamics in semi-isolated coastal stratified lakes and lagoons.

Supplementary Materials

The following supporting information can be downloaded at: https://www.mdpi.com/article/10.3390/d15091009/s1, Table S1. List of the phytoplankton taxa and their occurrence at different depths (m) in the Lagoon on the Cape Zeleny, and in the surface water layer (0.5 m) of adjacent White Sea area on 30 January 2020. Typical species that contribute to the similarity of phytoplankton communities from different depths in the Lagoon are highlighted in bold. Table S2. List of the phytoplankton taxa and their occurrence at different depths (m) in the Lagoon on the Cape, and in the surface water layer (0.5 m) of adjacent White Sea area on 8 June 2020. Typical species that contribute to the similarity of phytoplankton communities from different depths in the Lagoon are highlighted in bold. Table S3. List of the phytoplankton taxa and their occurrence at different depths (m) in the Lagoon on the Cape, and in the surface water layer (0.5 m) of adjacent White Sea area on 18 June 2020. Typical species that contribute to the similarity of phytoplankton communities from different depths in the Lagoon are highlighted in bold. Table S4. List of the phytoplankton taxa and their occurrence at different depths (m) in the Lagoon on the Cape, and in the surface water layer (0.5 m) of adjacent White Sea area on 2 July 2020. Typical species that contribute to the similarity of phytoplankton communities from different depths in the Lagoon are highlighted in bold. Table S5. List of the phytoplankton taxa ane their occurrence in the Lagoon on the Cape, and in the surface water layer of adjacent White Sea area on 20 July 2020. Typical species that contribute to the similarity of phytoplankton communities from different depths in the Lagoon are highlighted in bold. Table S6. List of the phytoplankton taxa and their occurrence at different depths (m) in the Lagoon on the Cape, and in the surface water layer (0.5 m) of adjacent White Sea area on 18 August 2020. Typical species that contribute to the similarity of phytoplankton communities from different depths in the Lagoon are highlighted in bold. Table S7. List of the phytoplankton taxa and their occurrence at different depths (m) in the Lagoon on the Cape, and in the surface water layer (0.5 m) of adjacent White Sea area on 7 September 2020. Typical species that contribute to the similarity of phytoplankton communities from different depths in the Lagoon are highlighted in bold. Table S8. List of the phytoplankton taxa and their occurrence at different depths (m) in the Lagoon on the Cape, and in the surface water layer (0.5 m) of adjacent White Sea area on 12 September 2020. Typical species that contribute to the similarity of phytoplankton communities from different depths in the Lagoon are highlighted in bold. Table S9. List of the phytoplankton taxa and their occurrence at different depths (m) in the Lagoon on the Cape Zeleny, and in the surface water layer (0.5 m) of adjacent White Sea area on 1 October 2020. Typical species that contribute to the similarity of phytoplankton communities from different depths in the Lagoon are highlighted in bold. Table S10. List of the phytoplankton taxa with their occurrences in the Lagoon on the Cape Zeleny at different depths (m), and in the surface water layer (0.5 m) of adjacent White Sea area on 1 October 2020. Typical species that contribute to the similarity of phytoplankton communities from different depths in the Lagoon are highlighted in bold.

Author Contributions

Conceptualization, E.D.K. and I.G.R.; methodology, I.G.R. and D.A.V.; investigation, V.A.A., D.V.R., I.G.R., D.A.V. and E.D.K.; writing—original draft preparation, I.G.R. and E.D.K.; supervision and project administration, E.D.K. All authors have read and agreed to the published version of the manuscript.

Funding

This research received no external funding.

Institutional Review Board Statement

Not applicable.

Data Availability Statement

Not applicable.

Acknowledgments

The authors are cordially thankful to the administration of the White Sea Biological Station of Lomonosov Moscow State University for the possibility of year-round research at this base.

Conflicts of Interest

The authors declare no conflict of interest.

References

  1. Krasnova, E.; Voronov, D.; Frolova, N.; Pantyulin, A.; Samsonov, T. Salt lakes separated from the White Sea. EARSeL eProc. 2015, 14, 8–22. [Google Scholar] [CrossRef]
  2. Krasnova, E.D. Ecology of meromictic lakes of Russia. 1. Coastal marine waterbodies. Water Resour. 2021, 48, 427–438. [Google Scholar] [CrossRef]
  3. Hakala, A. Meromixis as a part of lake evolution—Observations and a revised classification of true meromictic lakes in Finland. Boreal Environ. Res. 2004, 9, 37–53. [Google Scholar]
  4. Judd, K.E.; Adams, H.E.; Bosch, N.S.; Kling, G.W. A case history: Effects of mixing regime on nutrient dynamics and community structure in Third Sister Lake, Michigan during late winter and early spring 2003. Lake Reserv. Manag. 2005, 21, 316–329. [Google Scholar] [CrossRef]
  5. Ciglenečki, I.; Ljubešić, Z.; Janeković, I.; Batistić, M. Rogoznica Lake, a Euxinic Marine Lake on the Adriatic Coast (Croatia) that Fluctuates between Anoxic Holomictic and Meromictic Conditions. In Ecology of Meromictic Lakes. Ecological Studies; Gulati, R., Zadereev, E., Degermendzhi, A., Eds.; Springer: Cham, Switzerland, 2017; Volume 228. [Google Scholar] [CrossRef]
  6. Melack, J.M.; Jellison, R.; MacIntyre, S.; Hollibaugh, J.T. Mono Lake: Plankton Dynamics over Three Decades of Meromixis or Monomixis. In Ecology of Meromictic Lakes. Ecological Studies; Gulati, R., Zadereev, E., Degermendzhi, A., Eds.; Springer: Cham, Switzerland, 2017; Volume 228, pp. 325–351. [Google Scholar] [CrossRef]
  7. Zadereev, E.S.; Boehrer, B.; Gulati, R.D. Biological and ecological features, trophic structure and energy flow in meromictic lakes. In Ecology of Meromictic Lakes. Ecological Studies; Gulati, R., Zadereev, E., Degermendzhi, A., Eds.; Springer: Cham, Switzerland, 2017; Volume 228, pp. 61–86. [Google Scholar]
  8. Zotina, T.A.; Tolomeyev, A.P.; Degermendzhy, N.N. Lake Shira, a Siberian salt lake: Ecosystem, structure and function. 1. Major physico-chemical and biological features. Intern. J. Salt Lake Res. 1999, 8, 211–232. [Google Scholar] [CrossRef]
  9. Degermendzhy, A.G.; Belolipetsky, V.M.; Zotina, T.A.; Gulati, R.D. Formation of the vertical heterogeneity in the Lake Shira ecosystem: The biological mechanisms and mathematical model. Aquat. Ecol. 2002, 36, 271–297. [Google Scholar] [CrossRef]
  10. Kopylov, A.I.; Kosolapov, D.B.; Degermendzhy, N.N.; Zotina, T.A.; Romanenko, A.V. Phytoplankton, bacterial production and protozoan bacterivory in stratified, brackish-water Lake Shira (Khakasia, Siberia). Aquat. Ecol. 2002, 36, 205–218. [Google Scholar] [CrossRef]
  11. Wilk-Woźniak, E.; Żurek, R. Phytoplankton and its relationships with chemical parameters and zooplankton in meromictic Piaseczno reservoir, Southern Poland. Aquat. Ecol. 2006, 40, 165–176. [Google Scholar] [CrossRef]
  12. Khromechek, E.B.; Barkhatov, Y.V.; Rogozin, D.Y. Distribution of ciliates and Cryptomonas in the chemocline region of saline meromictic Lake Shunet (Siberia, Russia). Aquat. Ecol. 2010, 44, 497–511. [Google Scholar] [CrossRef]
  13. Makeeva, E.G.A. Algae of Lake Shira. In Natural Complex and Biodiversity of the “Lake Shira” Section of the "Khakasskiy” Reserve; Nepomnyaschiy, V.V., Ed.; Khakassky Publish House: Abakan, Russia, 2011; pp. 150–173. (In Russian) [Google Scholar]
  14. Rogozin, D.; Zadereev, E.; Prokopkin, I.; Tolomeev, A.; Barkhatov, Y.; Khromechek, E.; Degermendzhi, N.; Drobotov, A.; Degermendzhi, A. Comparative Study of the Stability of Stratification and the Food Web Structure in the Meromictic Lakes Shira and Shunet (South Siberia, Russia). In Ecology of Meromictic Lakes. Ecological Studies; Gulati, R., Zadereev, E., Degermendzhi, A., Eds.; Springer: Cham, Switzerland, 2017; Volume 228, pp. 89–124. [Google Scholar]
  15. Gorbunov, M.Y.; Umanskaya, M.V. The vertical distribution of prokaryotic phototrophic plankton in the Nizhnii Pond in Samara Botanic Garden. Samar. Luka Byul. 2007, 16, 144–155. [Google Scholar]
  16. Gorbunov, M.Y.; Umanskaya, M.V. Planktonic microbial communities of the meromictic and holomictic basins of lake Kichier. In Proceedings of the IV International Conference “Ozernye Ecosistemy: Biologicheskie Process, Antropogennaya Transformatsiya, Kachestvo Vody”, Minsk-Naroch, Belarus, 12–17 September 2011; p. 57. [Google Scholar]
  17. Gorlenko, V.M.; Buryukhaev, S.P.; Matyugina, E.B.; Borzenko, S.V.; Namsaraev, Z.B.; Bryantseva, I.A.; Boldareva, E.N.; Sorokin, D.Y.; Namsaraev, B.B. Microbial communities of the stratified soda Lake Doroninskoe (Transbaikal region). Microbiology 2010, 79, 390–401. [Google Scholar] [CrossRef]
  18. Malešević, N.; Ciglenečki, I.; Bura-Nakić, E.; Caric, M.; Radic, I.D.; Hrustić, E.; Viličić, D.; Ljubesic, Z. Diatoms in the extreme euxinic environment (Rogoznica Lake, Eastern Adriatic coast). Acta Bot. Croat. 2015, 74, 333–343. [Google Scholar] [CrossRef]
  19. Schanz, F.; Stalder, S. Phytoplankton summer dynamics: Sedimentation in the themally stratified Lake Cadagno. In Lake Cadagno: A Meromictic Alpine Lake; Peduzzi, R., Bachofen, R., Tonolla, M., Eds.; DocumentaDell’istituto di Idrobiologia: Pallanza, Italy, 1998; Volume 63, pp. 71–76. [Google Scholar]
  20. Kiss, K.T.; Acs, E.; Szabό, K.E.; Miracle, M.; Vicente, E. Morphological observations on Cyclotella distinguenda Hustedt and C. delicatula Hustedt from the core sample of a meromictic karstic lake of Spain (Lake La Cruz) with aspects of their ecology. Diatom Res. 2007, 22, 287–308. [Google Scholar] [CrossRef]
  21. Lange, E.K. Phytoplankton community of the meromictic Lake Mogilnoye (Kildin Island, Barents Sea). In Proceedings of the Thesis of International Scientific Conference “Nature of Marine Arctic: Modern Challenges and the Role of Science”, Murmansk, Russia, 10–12 March 2010; pp. 126–128. (In Russian). [Google Scholar]
  22. Ivanova, D.A.; Krasnova, E.D.; Voronov, D.A.; Radchenko, I.G. Seasonal dynamics of algal flora in the stratified Kislo-Sladkoe Lake partially separated from the White Sea. Oceanology 2022, 62, 207–220. [Google Scholar] [CrossRef]
  23. Camacho, A. On the occurrence and ecological features of deep chlorophyll maxima (DCM) in Spanish stratified lakes. Limnetica 2006, 25, 453–478. [Google Scholar] [CrossRef]
  24. Dokulil, M. Seasonal and spatial distribution of cryptophycean species in the deep, stratifying, alpine lake Mondsee and their role in the food web. Hydrobiologia 1988, 161, 185–201. [Google Scholar] [CrossRef]
  25. Gervais, F. Ecology of cryptophytes coexisting near a freshwater chemocline. Freshw. Biol. 1998, 39, 61–78. [Google Scholar] [CrossRef]
  26. Klaveness, D. Biology and ecology of the Cryptophyceae: Status and challenges. Biol. Oceanogr. 1989, 6, 257–270. [Google Scholar]
  27. Krasnova, E.D.; Pantyulin, A.N.; Matorin, D.N.; Todorenko, D.A.; Belevich, T.A.; Milyutina, I.A.; Voronov, D.A. Blooming of the cryptomonad alga Rhodomonas sp. (Cryptophyta, Pyrenomonadaceae) in the redox zone of the basins separating from the White Sea. Microbiology 2014, 83, 270–277. [Google Scholar] [CrossRef]
  28. Barkhatov, Y.V.; Khromechek, E.B.; Zykov, V.V.; Rogozin, D.Y. Cryptophytes of Lake Shira (Khakassia, Russia): Explosive growth during breakdown of meromixis. Hydrobiologia 2022, 849, 3373–3387. [Google Scholar] [CrossRef]
  29. Chupakov, A.V.; Chupakova, A.A.; Moreva, O.Y.; Shirokova, L.S.; Zabelina, S.A.; Vorobieva, T.Y.; Klimov, S.I.; Brovko, O.S.; Pokrovsky, O.S. Allochthonous and autochthonous carbon in deep, organic-rich and organic-poor lakes of the Europian Russian subarctic. Boreal Environ. Res. 2017, 22, 213–230. [Google Scholar]
  30. Savvichev, A.; Kokryatskaya, N.; Zabelina, S.; Rusanov, I.; Zakharova, E.; Veslopolova, E.; Lunina, O.; Patutina, E.; Bumazhkin, B.; Gruzdev, D.; et al. Microbial processes of the carbon and sulfur cycles in an ice-covered, iron-rich meromictic lake Svetloe (Arkhangelsk region, Russia). Environ. Microbiol. 2017, 19, 659–672. [Google Scholar] [CrossRef]
  31. Motylkova, I.V.; Konovalova, N.V. Spring Phytoplankton of the Tunaicha Lake (South Sakhalin). In Chteniya Pamyati V.Ya. Levanidova (Readings in Memory of V.Ya. Levanidov); Dal’nauka: Vladivostok, Russia, 2003; pp. 287–294. [Google Scholar]
  32. Motylkova, I.V.; Konovalova, N.V. Seasonal dynamics of phytoplankton in a lagoon-type lake Izmenchivoye (Southeast Sakhalin). Russ. J. Mar. Biol. 2010, 36, 86–92. [Google Scholar] [CrossRef]
  33. Motylkova, I.V.; Konovalova, N.V. Structure and seasonal dynamics of phytoplankton in Ptichye lake of the lagoon-type (south Sakhalin). In The Researches of the Aquatic Biological Resources of Kamchatka and the North-West Part of the Pacific Ocean; Kamchatka Research Institute of Fisheries and Oceanography: Petropavlovsk-Kamchatsky, Russia, 2018; pp. 3–76, (In Russian). [Google Scholar] [CrossRef]
  34. Konovalova, N.V.; Motylkova, I.V. The Phytoplankton of Tunaicha Lake (Southern Sakhalin). In Proceedings of the 21st International Symposium on Okhotsk Sea and Sea Ice, Monbetsu, Japan, 19–24 February 2006; Okhotsk Sea and Cold Ocean Research Association: Mombetsu, Japan, 2006; pp. 200–204. [Google Scholar]
  35. Ezhova, E.E.; Lange, E.K.; Polunina, Y.Y.; Kravtsov, V.A.; Emelyanov, E.M. Plankton and benthos of the meromictic Lake Mogilnoye (Kildin Island, Barents Sea). In Proceedings of the International Scientific Conference “Nature of Marine Arctic: Modern Challenges and Role of Science”, Murmansk, Russia, 10–12 March 2010; pp. 71–73. (In Russian). [Google Scholar]
  36. Motylkova, I.V.; Konovalova, N.V. The Composition and Structure of Phytoplankton in the Busse Lagoon, Southeastern Sakhalin Island. Russ. J. Mar. Biol. 2021, 47, 337–345. [Google Scholar] [CrossRef]
  37. Burch, M.D. Annual cycle of phytoplankton in Ace Lake, an ice covered, saline meromictic lake. Hydrobiologia 1988, 165, 59–75. [Google Scholar] [CrossRef]
  38. Krasnova, E.D.; Voronov, D.A.; Mardashova, M.V.; Pantulin, A.N.; Frolova, N.L. Long-term variability of physical and chemical parameters in a partially isolated lagoon on the Cape Zeleny (Karelian Coast of the White Sea). In Proceedings of the IV International Scientific and Practical Conference “Marine Education and Research (MARESEDU-2015)”, Moscow, Russia, 19–24 October 2015; pp. 451–454. (In Russian). [Google Scholar]
  39. Mardashova, M.V.; Voronov, D.A.; Krasnova, E.D. Benthic Communities of Coastal Water Bodies at Different Stages of Isolation from the White Sea in the Vicinity of the White Sea Biological Station, Moscow State University, Kandalaksha Bay, White Sea. Biol. Bull. 2020, 47, 1133–1152. [Google Scholar] [CrossRef]
  40. Luybeznova, N.V.; Mardashova, M.V. Features of growth of Ophioglossum vulgatum L. at the White Sea coasts. Phytodiversity East. Eur. 2017, XI, 74–80. (In Russian) [Google Scholar]
  41. Grouzdev, D.; Gaisin, V.; Lunina, O.; Krutkina, M.; Krasnova, E.; Voronov, D.; Baslerov, R.; Sigalevich, P.; Savvichev, A.; Gorlenko, V. Microbial communities of stratified aquatic ecosystems of Kandalaksha Bay (White Sea) shed light on the evolutionary history of green and brown morphotypes of Chlorobiota. FEMS Micriobiol. Ecol. 2022, 98, fiac103. [Google Scholar] [CrossRef] [PubMed]
  42. Krasnova, E.D.; Voronov, D.A. Influence of chemocline on vertical unevenness of zooplankton in coastal stratified water bodies separated from the White Sea. In Proceedings of the X International Conference «Marine Research and Education, MARESEDU-2021», Moscow, Russia, 24–28 October 2021; PolyPRESS: Tver, Russia, 2022; pp. 82–86. (In Russian). [Google Scholar]
  43. Shaporenko, S.I.; Korneeva, G.A.; Pantyulin, A.N.; Pertsova, N.M. Specific features of the ecosystems of isolated waterbodies of the White Sea Kandalaksha Bay. Vodn. Resur. 2005, 32, 517–532. [Google Scholar]
  44. Krasnova, E.; Matorin, D.; Belevich, T.; Efimova, L.; Kharcheva, A.; Kokryatskaya, N.; Losyuk, G.; Todorenko, D.; Voronov, D.; Patsaeva, S. The characteristic pattern of multiple colored layers in coastal stratified lakes in the process of separation from the White Sea. Chin. J. Ocean. Limn. 2018, 36, 1962–1977. [Google Scholar] [CrossRef]
  45. Vasilenko, A.N. Study of the level regime of water bodies of the north-western coast of the White Sea. In Proceedings of the IV International Scientific and Practical Conference “Marine Education and Research (MARESEDU-2015)”, Moscow, Russia, 19–24 October 2015; pp. 468–470. (In Russian). [Google Scholar]
  46. Available online: World-weather.ru (accessed on 10 July 2023). (In Russian).
  47. Sournia, A. (Ed.) Phytoplankton Manual. Monographs on Oceanographic Methodology 1978; UNESCO: Paris, France, 1978; Volume 6, 337p. [Google Scholar]
  48. Vinogradov, M.E. (Ed.) Modern Methods for Quantifying the Distribution of Marine Plankton; Nauka: Moscow, Russia, 1983; 280p. (In Russian) [Google Scholar]
  49. Guiry, M.D.; Guiry, G.M. (Eds.) AlgaeBase; World-Wide Electronic Publication, National University of Ireland: Galway, Ireland, 2016; Available online: https://www.algaebase.org (accessed on 31 August 2023).
  50. Nordic Microalgae and Aquatic Protozoa. Electronic Database. Swedish Meteorological and Hydrological Institute (SMHI). Available online: http://nordicmicroalgae.org (accessed on 8 August 2023).
  51. Menden-Deuer, S.; Lessard, E.J. Carbon to volume relationships for dinoflagellates, diatoms, and other protest plankton. Limnol. Oceanogr. 2000, 45, 569–579. [Google Scholar] [CrossRef]
  52. Okolodkov, Y.N. Differentication of phototrophic and heterotrophic dinoflagellates (Dinophyceae) by epifluorescence microscopy in the northern Greenland Sea. Bot. J. Russ. Acad. Sci. 1999, 4, 53–61. [Google Scholar]
  53. Clarke, R.K.; Gorley, R.N. PRIMER V6: User Manual—Tutorial; Plymouth Marine Laboratory: Plymouth, UK, 2006; 190p. [Google Scholar]
  54. Clarke, K.R. Non-parametric multivariate analyses of changes in community structure. Aust. J. Ecol. 1993, 18, 117–143. [Google Scholar] [CrossRef]
  55. Anderson, M.J.; Gorley, R.N.; Clarke, K.R. PERMANOVA+ for PRIMER: Guide to Software and Statistical Methods; PRIMER-E: Plymouth, UK, 2008. [Google Scholar]
  56. Krasnova, E.D.; Kharcheva, A.V.; Milyutina, I.A.; Voronov, D.A.; Patsaeva, S.V. Study of microbial communities in redox zone of meromictic lakes isolated from the White Sea using spectral and molecular methods. J. Mar. Biol. Assoc. 2015, 95, 1579–1590. [Google Scholar] [CrossRef]
  57. Ilyash, L.V.; Belevich, T.A.; Zhitina, L.S.; Radchenko, I.G.; Ratkova, T.N. Phytoplankton of the White Sea. In Biogeochemistry of the Atmosphere, Ice and Water of the White Sea. The Handbook of Environmental Chemistry; Lisitsyn, A., Gordeev, V., Eds.; Springer: Cham, Switzerland, 2018; Volume 81. [Google Scholar] [CrossRef]
  58. Sazhin, A.F.; Sapozhnikov, F.V.; Rat’kova, T.N.; Romanova, N.D.; Shevchenko, V.P.; Filippov, A.S. The inhabitants of the spring ice, under-icewater, and sediments of the White Sea in the estuarine zone of the Severnaya Dvina River. Oceanology 2011, 51, 295–305. [Google Scholar] [CrossRef]
  59. Nikishova, E.R.; Radchenko, I.G.; Belevich, T.A. Small Photosynthetic Flagellates of the White Sea: Seasonal Dynamics and Their Role in Plankton and Ice Communities. Moscow Univ. Biol. Sci. Bull. 2020, 75, 147–152. [Google Scholar] [CrossRef]
  60. Radchenko, I.; Smirnov, V.; Ilyash, L.; Sukhotin, A. Phytoplankton dynamics in a subarctic fjord during the under-ice—Open water transition. Mar. Environ. Res. 2021, 164, 105242. [Google Scholar] [CrossRef]
  61. Ilyash, L.V.; Radchenko, I.G.; Shevchenko, V.P.; Zdorovennov, R.E.; Pantyulin, A.N. Contrasting summer phytoplankton communities in stratified and mixed waters of the White Sea. Oceanology 2014, 54, 730–738. [Google Scholar] [CrossRef]
  62. Ilyash, L.V.; Zhitina, L.S.; Belevich, T.A.; Shevchenko, V.P.; Kravchishina, M.D.; Pantyulin, A.N.; Tolstikov, A.V.; Tchultsova, A.L. Spatial distribution of phytoplankton in the White Sea during atypical dinoflagellates domination (July 2009). Oceanology 2016, 56, 372–381. [Google Scholar] [CrossRef]
  63. Radchenko, I.G.; Smirnov, V.V.; Usov, N.V.; Sukhotin, A.A. Seasonal dynamics of phytoplankton in the Chupa Inlet (Kandalaksha bay, White Sea). Mosc. Univ. Biol. Sci. Bull. 2022, 77, 32–39. [Google Scholar] [CrossRef]
  64. Stoecker, D.K.; Lavrentyev, P.J. Mixotrophic Plankton in the Polar Seas: A Pan-Arctic Review. Rev. Front. Mar. Sci. 2018, 5, 292. [Google Scholar] [CrossRef]
  65. Plotnikov, A.O.; Selivanova, E.A.; Khlopko, Y.A.; Voronov, D.A.; Matorin, D.N.; Todorenko, D.A.; Krasnova, E.D. Structure and Functioning of Plankton Communities of Phototrophic and Mixotrophic Protists in the Coastal Lagoon “Lake Kislo-Sladkoe” (White Sea, Karelian Coast). Izv. Ross. Akad. Nauk. Seriya Geogr. 2022, 86, 985–1001. (In Russian) [Google Scholar]
  66. Rogozin, D.Y.; Tarnovsky, M.O.; Belolipetskii, V.M.; Zykov, V.V.; Zadereev, E.S.; Tolomeev, A.P.; Drobotov, A.V.; Barkhatov, Y.V.; Gaevsky, N.A.; Gorbaneva, T.B.; et al. Disturbance of meromixis in saline Lake Shira (Siberia, Russia): Possible reasons and ecosystem response. Limnologica 2017, 66, 12–23. [Google Scholar] [CrossRef]
  67. Lange, E.K. Spatial and temporal variability of phytoplankton indicators of the relict lake Mogilnoye (Kildin Island, the Barents Sea). In Proceedings of the All-Russian Conference with International Participation “XXIX Coastal Conference: Field-Based and Theoretical Research in Shore Use Practice”, Kaliningrad, Russia, 18–24 April 2022; pp. 428–430. (In Russian). [Google Scholar]
  68. Saini, J.S.; Hassler, C.; Cable, R.; Fourquez, M.; Danza, F.; Roman, S.; Tonolla, M.; Storelli, N.; Jacquet, S.; Zdobnov, E.M.; et al. Bacterial, phytoplankton, and viral dynamics of meromictic Lake Cadagno offer insights into the Proterozoic ocean microbial loop. MBio 2022, 13, e0005222. [Google Scholar] [CrossRef]
Figure 1. Geographic location of the studied lagoon. The lagoon is circled and indicated by an arrow.
Diversity 15 01009 g001
Figure 2. The Lagoon on Cape Zeleny. Aerial view.
Diversity 15 01009 g002
Figure 3. Vertical salinity and temperature profiles in the lagoon on Cape Zeleny. Months are indicated by Roman numerals.
Diversity 15 01009 g003
Figure 4. Vertical profiles of dissolved oxygen concentration and redox potential (Eh) in water of the lagoon on Cape Zeleny. Months are indicated by Roman numerals.
Diversity 15 01009 g004
Figure 5. Vertical profiles of underwater illuminance and pH in water of the lagoon on Cape Zeleny. Months are indicated by Roman numerals.
Diversity 15 01009 g005
Figure 6. Seasonal dynamics of integrated phytoplankton biomass (Bint) in the Lagoon on Cape Zeleny in 2020, and contribution of different taxa. “Other taxa” included: Ochrophyta, Cercozoa, Charophyta, Euglenozoa, Haptophyta, Cryptista, and Cyanobacteria. NCF—not identified cocci and flagellates.
Diversity 15 01009 g006
Figure 7. Contribution of algae with different modes of nutrition to the integrated phytoplankton biomass (Bint) in the Lagoon on Cape Zeleny in 2020. A—autotrophs, H—heterotrophs, M—mixotrophs, “?”—unknown.
Diversity 15 01009 g007
Figure 8. Ordination (nMDS) of phytoplankton samples from the lagoon on Cape Zeleny and from the neighboring marine area based on BC transformed into a square root. The marker number corresponds to the chronological number of the sampling date: 1—30 January; 2—8 June; 3—18 June; 4—2 July; 5—20 July; 6—18 August; 7—7 September; 8—12 September; 9—1 October; and 10—1 November 2020. I and II indicate groups of the samples combined by non-metric multidimensional scaling (nMDS) based on phytoplankton biomass.
Diversity 15 01009 g008
Figure 9. DbRDA ordination describing the relationship between environmental factors: salinity (S), dissolved oxygen concentration (O2), pH, daylength, and phytoplankton structure in the lagoon at Cape Zeleny and in the neighboring marine area in 2020. The marker number corresponds to the chronological number of the sampling date relative to the first one (30 January 2020). 2—8 June; 3—18 June; 4—2 July; 5—20 July; 6—18 August; 7—7 September; 8—12 September; 9—1 October; and 10—1 November. Number 1 is missing because no factor measurements were made for the winter sample.
Diversity 15 01009 g009
Table 1. Taxonomic composition of phytoplankton in the lagoon on Cape Zeleny.
PhylumClassNumber of Species
MyozoaDinophyceae68
Oxyrrhidophyceae1
BacillariophytaBacillariophyceae61
Mediophyceae34
Coscinodiscophyceae9
CyanobacteriaCyanophyceae25
ChlorophytaPyramimonadophyceae7
Chlorophyceae3
Chlorodendrophyceae2
Trebouxiophyceae1
OchrophytaChrysophyceae4
Dictyochophyceae4
EuglenozoaEuglenophyceae3
CercozoaImbricatea1
Thecofilosea1
CharophytaZygnematophyceae1
HaptophytaCoccolithophyceae1
CryptistaKatablepharidophyceae1
Cryptophyceaenot identified
Table 2. Phytoplankton biomass (BC), dominant species, their contribution to BC, and mode of nutrition (P—phototrophs, H—heterotrophs, M—mixotrophs, “?”—protists with an undetermined mode of nutrition) in the Lagoon on Cape Zeleny at different depths, and in the adjacent area of the White Sea in 2020. In parentheses, the depth of the chemocline (Zchem) and the boundary of the euphotic zone (Zeu) in the lagoon are indicated. NCF—not identified cocci and flagellates.
Biotope (Depth, m)BC, mg C/m3TaxonMode of Nutrition
30 January 2020
0.50.06Protoperidinium brevipes (0.58)P
1.5 (Zeu)0.23cf. Planktolyngbya limnetica (0.78)P
2.50.16Oscillatoria sp.3 (0.19) P
Gymnodinium wulffii (0.15)H
NCF 10 μm (0.15)P
3.50.92Gymnodinium wulffii (0.33)H
NCF 9–14 μm (0.21)P
Dinophyta spp. (0.18)?
4.5
(Zchem)
16.60Gymnodinium wulffii (0.65)H
Gyrodinium spirale (0.35)H
Sea0.47Dinophysis acuminata (0.57)M
Phalacroma rotundatum (0.21)H
8 June 2020
0.510.63NCF 3–5 μm (0.21)P
Pyramimonas cf. diskoicola (0.20)P
Heterocapsa rotundata (0.16)P
1.515.82Ebria tripartita (0.26)H
Heterocapsa rotundata (0.12)P
Diplopsalis lenticula (0.11)H
3.510.30Pyramimonas cf. diskoicola (0.38)P
Heterocapsa rotundata (0.11)P
4.58.87Gyrodinium spirale (0.21)H
NCF 6–8 μm (0.17)P
Heterocapsa rotundata (0.12)P
5.2
(Zchem; Zeu)
80.37Tetraselmis cordiformis (0.35)P
Gymnodinium arcticum (0.18)P
Skeletonema costatum (0.11)P
Sea10.22Heterocapsa rotundata (0.16)P
Pyramimonas cf. diskoicola (0.11)P
Skeletonema costatum (0.11)P
Unidentified cryptomonad cells 10–20 μm (0.11)P
18 June 2020
0.525.46Cyclotella choctawhatcheeana (0.55)P
1.523.55Ebria tripartita (0.30)H
Cyclotella choctawhatcheeana (0.21)P
2.53.17Protoperidinium pellucidum (0.23)H
3.57.56Dinophysis norvegica (0.22)M
Ebria tripartita (0.17)H
Dinophysis acuminata (0.12)M
4.57.26Tripos arcticus (0.31)P
Bunch of unidentified species with green cells 3 μm (0.29)P
5
(Zchem; Zeu)
1730.91Gymnodinium arcticum (0.97)P
Sea98.09Skeletonema costatum (0.75)P
2 July 2020
0.512.44Flagellate non det. 10–14 μm (0.30)P
Heterocapsa rotundata (0.14)P
Pyramimonas cf. diskoicola (0.14)P
Cyclotella choctawhatcheeana (0.12)P
1.521.10Diplopsalis lenticula (0.37)H
3.513.90Cyclotella choctawhatcheeana (0.63)P
4.588.42Cyclotella choctawhatcheeana (0.33)P
Bunch of unidentified species with green cells 3 μm (0.29)P
NCF 3–5 μm (0.11)P
5
(Zchem)
197.19Flagellate non det. 5 μm (0.54)P
NCF 3–5 μm (0.29)P
Sea35.25Heterocapsa rotundata (0.47)P
Skeletonema costatum (0.14)P
20 July 2020
0.510.82Heterocapsa rotundata (0.24)P
Pyramimonas cf. diskoicola (0.14)P
1.512.93Diplopsalis lenticula (0.19)H
NCF 13 μm (0.11)P
2.525.75Gonyaulax spinifera (0.30)P
Ebria tripartita (0.11)H
3.55.43NCF 3–5 μm (0.23)P
Ebria tripartita (0.20)H
Akashiwo sanguinea (0.15)P
NCF 6–8 μm (0.13)P
4.524.90Ebria tripartita (0.36)H
NCF 3–5 μm (0.23)P
NCF 6–8 μm (0.18)P
5.1261.85Unidentified species with green oval cells 5–6 μm (0.73)P
NCF 3–5 μm (0.12)P
5.4
(Zchem; Zeu)
182.94Unidentified species with green oval cells 5–6 μm (0.82)P
Sea14.08Kryptoperidinium triquetrum vegetative cells and spores (0.18)P
Unidentified cryptomonad cells 10–20 μm (0.14)?
NCF 6–8 μm (0.14)P
NCF 3–5 μm (0.11)P
18 August 2020
0.5124.77Heterocapsa rotundata (0.42)P
Tripos arcticus (0.16)P
1.515.18Heterocapsa rotundata (0.24)P
Kryptoperidinium triquetrum vegetative cells and spores (0.22)P
NCF 6–8 μm (0.12)P
NCF 3–5 μm (0.12)P
2.546.49Kryptoperidinium triquetrum (0.18)P
Kryptoperidinium triquetrum spores (0.17)P
Heterocapsa rotundata (0.11)P
3.5151.06Cyclotella choctawhatcheeana (0.89)P
4.536.15Unidentified species with green oval cells 5–6 μm (0.22)P
NCF 3–5 μm (0.20)P
Ebria tripartita (0.11)H
5280.03Unidentified species with green oval cells 5–6 μm (0.39)P
NCF 3–5 μm (0.33)P
5.4
(Zchem; Zeu)
303.40Unidentified species with green oval cells 5–6 μm (0.53)P
Oxyrrhis marina (0.32)H
Sea20.22Heterocapsa rotundata (0.36)P
Pyramimonas cf. diskoicola (0.12)P
7 September 2020
0.521.70Kryptoperidinium triquetrum spores (0.20)P
Lepidodinium chlorophorum (0.19)P
Cyclotella choctawhatcheeana (0.14)P
Heterocapsa rotundata (0.11)P
1.5120.56Cyclotella choctawhatcheeana (0.31)P
Kryptoperidinium triquetrum spores (0.28)P
Kryptoperidinium triquetrum (0.16)P
2.531.38Cyclotella choctawhatcheeana (0.40)P
Kryptoperidinium triquetrum vegetative cells and spores (0.29)P
3.5130.55Cyclotella choctawhatcheeana (0.41)P
Kryptoperidinium triquetrum vegetative cells and spores (0.25)P
Ebria tripartita (0.12)H
4.545.75Ebria tripartita (0.28)H
Micracanthodinium claytonii (0.25)H
5.1
(Zchem; Zeu)
1492.99Oxyrrhis marina/Lebouridinium glaucum (0.44)H
Gymnodinium spp. 8–15 μm (0.25)?
Unidentified species with green oval cells 5–6 μm (0.21)P
Sea17.23Pyramimonas cf. diskoicola (0.18)P
Unidentified cryptomonad cells 10–20 μm (0.11)?
12 September 2020
0.515.54Kryptoperidinium triquetrum vegetative cells and spores (0.44)P
Heterocapsa rotundata (0.14)P
Unidentified cryptomonad cells 6–10 μm (0.12)?
1.55.79Protoperidinium bipes (0.14)H
Tripos fusus (0.11)P
Gonyaulaxspinifera (0.11)P
2.58.58Gonyaulaxspinifera (0.13)P
3.519.89Micracanthodiniumclaytonii (0.33)H
NCF 6–8 μm (0.13)P
Gonyaulax spinifera (0.11)P
4.532.36NCF 6–8 μm (0.57)P
NCF 3–5 μm (0.25)P
5.1
(Zchem; Zeu)
310.55Oxyrrhis marina (0.75)H
NCF 3–5 μm (0.11)P
Sea18.77Unidentified cryptomonad cells 10–20 μm (0.36)?
Unidentified cryptomonad cells 6–10 μm (0.25)?
1 October 2020
0.512.16Unidentified cryptomonad cells 10–20 μm (0.34)?
Unidentified cryptomonad cells 6–10 μm (0.18)?
Cyclotella choctawhatcheeana (0.18)P
Gyrodinium spp. 21–32 μm (0.11)?
1.513.78NCF 6–8 μm (0.60)P
Cyclotella choctawhatcheeana (0.16)P
2.55.97NCF 6–8 μm (0.31)P
Cyclotella choctawhatcheeana (0.20)P
NCF 10 μm (0.13)P
Heterocapsarotundata (0.11)P
3.52.91Cyclotella choctawhatcheeana (0.31)P
NCF 6–8 μm (0.21)P
NCF 3–5μm (0.17)P
4.53.84NCF 6–8 μm (0.41)P
NCF 3–5 μm (0.22)P
Unidentified cryptomonad cells 10–20 μm (0.12)?
4.9
(Zchem)
35.98Oxyrrhis marina (0.94)H
Sea1.45Unidentified cryptomonad cells 10–20 μm (0.19)?
NCF 6–8 μm (0.16)P
NCF11 μm (0.11)P
1 November 2020
0.53.84Ebria tripartia (0.31)H
Melosira sp. (0.15)P
1.519.76NCF 10 μm (0.59)P
2.50.92Melosira arctica (0.26)P
Unidentified cryptomonad cells 6–10 μm (0.19)?
Protoperidinium brevipes (0.13)H
Odontella aurita (0.11)P
3.51.04Gymnodinium spp. 11–15 μm (0.22)?
Unidentified cryptomonad cells 10–20 μm (0.19)?
Unidentified cryptomonad cells 6–10 μm (0.15)?
4.16.48Gymnodinium spp. 11–15 μm (0.27)?
Unidentified cryptomonad cells 10–20 μm (0.19)?
Micracanthodinium claytonii (0.18)H
Unidentified cryptomonad cells 6–10 μm (0.13)?
Sea0.69NCF 10 μm (0.13)P
Table 3. Average similarity of phytoplankton communities integrated throughout a water column, number of taxa with cumulative contribution 90–92%, and taxa contributing at least 10% (9% in one case) to similarity (in brackets—percentage contribution to the similarity) in the Lagoon on Cape Zeleny in 2020. NCF—not identified cocci and flagellates.
DateAverage Similarity (%)Number of Taxa Cumulatively Contributing 90–92%Taxa Contributing at Least 9% to Similarity, and Their Percentage Contribution
30 January 202077Gymnodinium wulffii (46),
Paralia sulcata (17)
8 June 20203819Heterocapsa rotundata (14),
Pyramimonas cf. diskoicola (10)
18 June 20203716Cyclotella choctawhatcheeana (14),
Ebria tripartita (12),
Synechocystis salina (11),
Gymnodinium arcticum (11)
2 July 20204010Cyclotella choctawhatcheeana (30),
Ollicola vangoorii (11)
20 July 20204219Unidentified cryptomonad cells 6–10 μm (11),
Ebria tripartita (11),
Cyclotella choctawhatcheeana (10)
18 August 20204019Cyclotella choctawhatcheeana (13)
7 September 20204525Cyclotella choctawhatcheeana (13), Kryptoperidinium triquetrum spore (11)
12 September 20204621Kryptoperidinium triquetrum (9)
1 October 2020419Cyclotella choctawhatcheeana (27)
Unidentified cryptomonad cells 10–20 μm (17)
Unidentified cryptomonad cells 6–10 μm (17)
Kryptoperidinium triquetrum (11)
1 November 20203213Gymnodinium spp. 11–15 μm (18),
cf. Peridiniella danica (12),
Monoraphidium contortum (11)
Table 4. Average similarity of surface phytoplankton communities in the Lagoon and adjacent marine area in 2020. Number of taxa cumulatively contributed 90–92% and typical species contributing at least 10% (9% in two cases) to similarity (in brackets—individual percentage contribution to the similarity). NCF—not identified cocci and flagellates.
Average Similarity (%)Number of Taxa Cumulatively Contributing
90–92%
Taxa Contributing at Least 9% to Similarity,
and Their Percentage Contribution
30 January 2020
101Protoperidinium brevipes (100)
8 June 2020
4210Heterocapsarotundata (21), Pyramimonas cf. diskoicola (13), Unidentified cryptomonad cells 10–20 μm (13), Ollicola vangoorii (11)
18 June 2020
239Ebria tripartita (18), Euglenozoa cells 21–40 μm (14), Unidentified cryptomonad cells 10–20 μm (11), Kryptoperidinium triquetrum (11)
2 July 2020
429Heterocapsa rotundata (21), Pyramimonas cf. diskoicola (13)
20 July 2020
4714Heterocapsa rotundata (9), Gymnodinium spp. 16–20 μm (9)
18 August 2020
479Heterocapsa rotundata (18), Pyramimonas cf. diskoicola (11)
7 September 2020
409Heterocapsarotundata (16), Cyclotella choctawhatcheeana (14),
Unidentified cryptomonad cells 6–10 μm (13), Pyramimonas cf. diskoicola (13)
12 September 2020
436Heterocapsa rotundata (23), Unidentified cryptomonad cells 6–10 μm (22), Unidentified cryptomonad cells 10–20 μm (17), Pyramimonas cf. diskoicola (14), Cyclotella choctawhatcheeana (11)
1 October 2020
324Unidentified cryptomonad cells 10–20 μm (34), Unidentified cryptomonad cells 6–10 μm (26), Cyclotella choctawhatcheeana (18), Kryptoperidinium triquetrum (17)
1 November 2020
257Kryptoperidinium triquetrum (19), Cocconeis costata (18),
Monoraphidium contortum (16), Thalassionema nitzschioides(15), Paulinella ovalis (11), Pterosperma sp.1 (11), Cyclotella choctawhatcheeana (11)
Disclaimer/Publisher’s Note: The statements, opinions and data contained in all publications are solely those of the individual author(s) and contributor(s) and not of MDPI and/or the editor(s). MDPI and/or the editor(s) disclaim responsibility for any injury to people or property resulting from any ideas, methods, instructions or products referred to in the content.

