Article

Role of Tree Vegetation and Associated Environmental Factors on the Understory Herb-Layer Composition in a Reforested Area: A Study from “Kulon Progo Community Forestry”

1
Department of Forest Science, Kongju National University, #54, Daehak-ro, Yesan-eup, Yesan-gun 32439, Chungnam, Republic of Korea
2
Center for Implementation Standard of Environment and Forestry Instruments, #Jl. Jend. A. Yani, Pabelan, Solo City 10270, Indonesia
*
Author to whom correspondence should be addressed.
Diversity 2023, 15(8), 900; https://doi.org/10.3390/d15080900
Submission received: 30 June 2023 / Revised: 21 July 2023 / Accepted: 28 July 2023 / Published: 30 July 2023
(This article belongs to the Topic Forest Ecosystem Restoration)

Abstract

:
We assessed the understory herb-layer species composition in response to tree vegetation and its associated environmental factors in the reforested area of the Kulon Progo Community Forestry, Yogyakarta, Indonesia. The understory herb-layer composition among different stand types, including Pinus (PN), Aleurites-Swietenia (AS), Swietenia-Acacia (SA), Melaleuca-Acacia (MA) and Tectona-Dalbergia (TD), was compared using some comparison analyses. The influence of tree vegetation characteristics and associated environmental factors on the understory herb-layer species was analyzed by employing canonical correspondence analysis (CCA). Our result showed variation in understory herb-layer species composition despite equality in richness and diversity indices. Among all stand types, the MA stand showed fewer shade-tolerant species, and the TD stand exhibited the smallest number of shade-intolerant species. Seedling availability also varied between AS and MA, which contained fewer seedling species. One of the main species in the two stands did not even regenerate. Moreover, all indicator species in MA were shade-intolerant species with invasive characteristics, while those in TD were shade-tolerant and semi-shade-tolerant species. CCA showed that stand types held an important role in the herb-layer species composition, where the number of shade-tolerant and seedling species commonly native to forest were directly proportional to tree canopy coverage, silt proportion in soil texture and concentration of soil organic carbon yet inversely proportional to below-stand utilization. In contrast, the number of shade-intolerant species had positive correlation to below-stand utilization and inversely to other correlated factors. Our study also indicated the possibility of tree vegetation controlling several environmental factors, where the increase in canopy coverage was followed by an increasing proportion of silt in soil texture and concentration of soil organic carbon, as well as a decreasing percentage of below-stand utilization. Accordingly, we recommend tree species enrichment with dense-canopy trees and adaptive management of below-stand utilization for better forest development and tree regeneration. This finding provides important knowledge for evaluation and improvement in the ecological restoration of degraded forests.

Graphical Abstract

1. Introduction

Understory vegetation is an important component in forest ecosystems, providing a high contribution to stand development and canopy succession [1,2]. This species level also demonstrates high turnover rates, which plays a crucial role in nutrient cycling and energy flow [3,4,5]. In addition, the understory holds the largest proportion of the floristic diversity [6] and has the potential to increase the complexity of forest structure as well as provide a life support system for other biotic diversity [7]. The presence of understory vegetation also determines the level of regeneration [3,8], as particular understory species influence the survival level, germination and growth of seedlings and propagules [9,10,11]. Therefore, understory species are often considered an efficient tool to assess the impact of environmental disturbances on an ecosystem [12].
The importance of understory species has been widely discussed in numerous studies, including those concerning composition, distribution and its relationship to tree cover called the overstory [11,13,14,15]. According to Böhnert et al. [13], Barbier et al. [16], and Pilon et al. [17], the tree stand commonly alters the availability of many resources for understory herb-layer species, such as light, soil, nutrients, water, and temperature. Accordingly, trees facilitate understory vegetation [16,18] and might accelerate forest succession [19] by improving these resources [16,20,21]. Therefore, the colonization of understory species often reflects the quality of the overstory (tree stand), where the abundance, diversity, and composition of understory vegetation are possible to change temporally with stand development [14,22]. Nevertheless, the understory herb-layer composition also relates to many factors, including biotic, edaphic, topographic and anthropogenic [21,23,24].
Influences of tree vegetation cover and environmental factors vary from one forest area to another. Wu et al. [15] reported that soil moisture content, altitude, and soil organic carbon content were the largest contributors to the variation in the understory in the Loess Plateau, China. Meanwhile, Ou et al. [21] found that elevation, soil and canopy structure affect understory plants. Another finding by Siswo et al. [25] revealed that understory species in a pine forest plantation were positively correlated to soil pH and negatively correlated to the dominance level of Pinus merkusii. Accordingly, understory vegetation can also be a good predictor to evaluate the success of restoration activities such as rehabilitation programs related to ecosystem function [25,26], biodiversity [11,14] and provisioning services [27].
Forest rehabilitation programs have been widely implemented in Indonesia [28], especially in response to degraded forests because of illegal logging, forest fires, forest conversion, unplanned agricultural expansion, and socio-economic issues related to the reformation era since 1998 [29]. In the protected forest of Kulon Progo Community Forestry and many other rehabilitation areas in Indonesia, a socio-economic approach through community-based forest management is commonly implemented to accommodate community interest in the forest resources, especially in a protected forest. Consequently, planting trees is generally dependent on community preference, which is usually exotic species with high economic value such as Tectona grandis, Dalbergia latifolia and Swietenia macrophylla [14,30]. Most exotic species have been reported as hampering the growth of understory species, in particular when they are planted in monoculture forests [10]. However, selecting suitable tree species for a given environment and keeping them protected will improve the understory’s development and diversity [12,14]. Therefore, comprehensive information on understory herb-layer composition, including species diversity, indicative species and tree regeneration potential, as well as the influencing factors, is necessary to provide recommendations and support for better management in improving biodiversity and ecosystem function.
The current study comprehensively assessed understory herb-layer composition in various stand types and the relationship to tree vegetation characteristics and associated environmental factors in the protected forest of Kulon Progo Community Forestry. Our study site is a reforested area consisting of randomly distributed mixed tree vegetation, which can be classified into several stand types to compare [31,32]. In addition, comprehensive studies on the understory’s relationship to tree vegetation characteristics and associated environmental factors around the study site were barely published. Vegetation studies are mostly limited to quantitative values of species composition such as species richness, diversity index, dominance index and importance value [33,34]. In this study, we compared understory herb-layer composition among five stand types, including Pinus (PN), Aleurites-Swietenia (AS), Swietenia-Acacia (SA), Melaleuca-Acacia (MA) and Tectona-Dalbergia (TD). Furthermore, tree vegetation characteristics and some environmental factors related to topographic, edaphic and anthropogenic factors were assessed using the ordination method to detect factors influencing the understory herb-layer species composition. We expected that: (1) different stand types would show different sets of understory herb-layer species; and (2) tree vegetation characteristics would provide more influence on the understory herb-layer composition/distribution than other environmental factors.

2. Materials and Methods

2.1. Study Site

This study was carried out in the protected forest of Kulon Progo state forest, where about 196.8 ha of the forest were managed by the local community by adopting a social forestry program through the Community Forestry scheme. The area of the Community Forestry scheme with protected status reached about 114 ha, or 60% of the total area of Community Forestry in the region [35,36]. Administratively, the study site belongs to the Kokap Sub-district, Kulon Progo Region, Special Territory of Yogyakarta, Indonesia (Figure 1). Topographically, Kulon Progo Community Forestry is a hilly area [36], located at an altitude of 100–450 m asl with a slope variation of 5% to 42% [32,36]. Based on Schmidt–Ferguson classification, the climate in the whole study site is categorized as a C type of climate with high rainfall (>2500 mm/year, 4.5–6 dry months, and 6–7.5 wet months) and warm to hot temperatures (about 26.9 to 30 °C) as typical of the tropics [35,37,38].
Kulon Progo Community Forestry is a reforested area after massive deforestation since 1970, which peaked in 1998 [39]. As the forest rehabilitation progresses, a large part of the forest area was designated as a protected forest by the Indonesian Ministry of Forestry in 2007 [40]. The protected forest of Kulon Progo Community Forestry is a successful participatory forest rehabilitation story that has been officially carried out since 2003 [30]. The afforestation was carried out according to community preferences and seedling availability. Accordingly, tree planting was not strictly patterned in a block management scheme, so the tree distribution looks unorganized. Currently, the forest cover is generally a mixed forest dominated by trees such as Tectona grandis Linn, F., Dalbergia latifolia Roxb., Swietenia macrophylla G. King, Acacia mangium Wild., Pinus merkusii Jungh. & de Vriese, Melaleuca Leucadendra Linn., Aleurites molucana (L.) Wild. and Eucalyptus sp. [30,32].

2.2. Data Collection

The forest stand in the protected forest of Kulon Progo Community Forestry was classified by taking 72 quadratic sample plots sized 20 × 20 m [31,32]. Based on cover-abundance of tree vegetation, the forest stand was classified into five stand types, including Pinus stand (PN), Aleurites-Swietenia stand (AS), Swietenia-Acacia stand (SA), Melaleuca-Acacia stand (MA) and Tectona-Dalbergia stand (TD). Tree vegetation composition, diversity, and tree structural characteristics varied from one stand type to another, as shown in Table 1 [32]. To investigate variation in understory herb-layer species composition among stand types with respect to the effects of tree vegetation and environmental factors, we conducted a vegetation survey using a quantitative survey. We purposefully selected 35 existing plots, where each stand type was represented by 7 plots. In each selected plot, we created a 2 × 2 m quadratic plot to observe understory herb-layer species, including seedlings (tree species <2 cm stem diameter and <1.5 m height) and herbaceous plants (herb-layer species other than seedlings). Quadratic plots sized 2 × 2 m have been widely used to investigate herb-layer species in vegetation surveys [11,25,41].
We noted the presence of understory herb-layer species, including species names, numbers of species and their abundance. Species unable to be identified directly in the field were documented by taking photos for further identification. We counted the number of individuals of both seedlings and herbaceous species within each 2 × 2 m quadratic plot. In addition to observation and measurement of understory herb-layer species, we generated a list of tree characteristics and some environmental factors related to topographic, edaphic and accessibility or anthropogenic aspects from Siswo et al. [31] and Siswo et al. [32], as summarized in Table 1. Climatic data were not included in this study because it has been considered a single stretch/area with the same temperature and annual rainfall [35].

2.3. Data Arrangement

We listed and classified all collected data in some distribution tables prior to data analysis. Unidentified species in the field were determined referring to some determination keys, including books [42,43] and some websites (assessed on 21 September 2022), such as wikipedia.com, Plantamor.com, and identify.plantnet.org, based on the local names and the collected photos. Moreover, we categorized the understory herb-layer species based on their distribution, including restricted species (present in one stand type), intermediate species (growing in more than one stand type), and widespread species (growing in all stand types). Furthermore, we classified these species as shade-tolerant species, semi-shade-tolerant species and shade-intolerant species, which were also related to invasive and non-invasive characters based on some literature [44,45,46,47]. In addition, we also counted the number of seedling species found in the understory herb-layer species composition and the number of individuals, which were then compared to those at higher growth levels (saplings and poles/trees) to describe forest regeneration potential [8,48,49].
In a further step, we performed quantitative calculations for species abundance and diversity. We calculated understory species abundance, including the number of species, frequency, density (number of individuals), dominance (basal area) and importance value (IV). We referred to McCune and Grace [50] to calculate IV averaging from two or more relative values (among relative frequency, relative density and relative dominance). Accordingly, the IV of seedlings and herbs was averaged from relative frequency and relative density [11,25,41]. Moreover, we took into account species diversity indices to provide important information reflecting forest structure. Species diversity indices were represented by the species Margalef richness index and Shannon diversity index, calculated through the following formula [50,51]:
D m g = S 1 I n N
H = n . i N ln n . i N
where Dmg is the Margalef Index of Richness, H′ is the Shannon diversity index, S = total number of species, N is the total number of individuals, and n.i is the number of the ith species.
After completing the species abundance calculations, we prepared data matrices for further analysis. To compare the understory herb-layer composition among stand types and determine the indicator species of each stand type, we prepared two data matrices, including the understory herb-layer species abundance per plot and the list of plots per group. Specific to indicator species analysis, we calculated the mean abundance, relative abundance and relative frequency data [50]. In addition, we also arrange data matrices of tree vegetation characteristics and associated environmental factors to detect the influence of these factors on understory herb-layer species. The abundance of understory herb-layer species was set as a dependent variable, while tree vegetation characteristics and associated environmental factors were set as independent/predictor variables [50,52].

2.4. Statistical Analysis

We compared the understory herb-layer species composition among stand types by employing a multi-response permutation procedure analysis (MRPP). This is a nonparametric analysis that disregards distributional assumptions commonly chosen as a fit analysis for ecological community data [50]. Furthermore, we assessed indicator species for each forest type by employing Indicator Species Analysis (ISA) [50,52,53]. We determined indicator species using a threshold of 25% indicator value [53] at alpha 0.05 of the Monte Carlo Significance Test [50]. MRPP and ISA were run using PC-ORD software version 7.
Diversity indices (Margalef richness index and Shannon diversity indices), number of shade-tolerant species, number of shade-intolerant species, number of seedling species, and number of individuals were compared using a one-way analysis of variance (ANOVA) and the Kruskal–Wallis test. Prior to running comparison analyses, we applied Shapiro–Wilk tests to check normality and Levene’s test to examine homogeneity. A log transformation was also performed to improve normality. ANOVA was then employed when the data met the requirements for normality and homogeneity in parametric analysis [54]. Otherwise, we employed the Kruskal–Wallis test followed by Mann–Whitney U-tests [55]. We run ANOVA and Kruskal–Wallis tests, as well as the post hoc test, using Statistical Product and Service Solution (SPSS) software version 25.0.
To describe tree regeneration potential, we analyzed the regeneration status of tree species by comparing the density (number of individuals per ha) of seedlings, saplings, poles and mature trees. We followed Malik and Bhatt [8], Sarkar and Devi [48], and Nelson and Noweg [49] to categorize the regeneration status of tree species as “good regeneration” if seedlings  >  saplings  > poles >  mature trees; “fair regeneration” if mature trees  <  saplings  < or >  seedlings; “poor regeneration” if a species survives only in sapling; “none regeneration” if a species is absent in both sapling and seedling stages but present as mature trees; and “new species” if a species has no mature but only sapling and/or seedling stages.
Moreover, canonical correspondence analysis (CCA) was performed in PC-ORD version 7 to examine the influence of tree vegetation characteristics and associated environmental factors on the understory herb-layer composition [50,52,56]. Pearson correlation analysis was used to detect inter-correlation among predictor variables [50].

3. Results

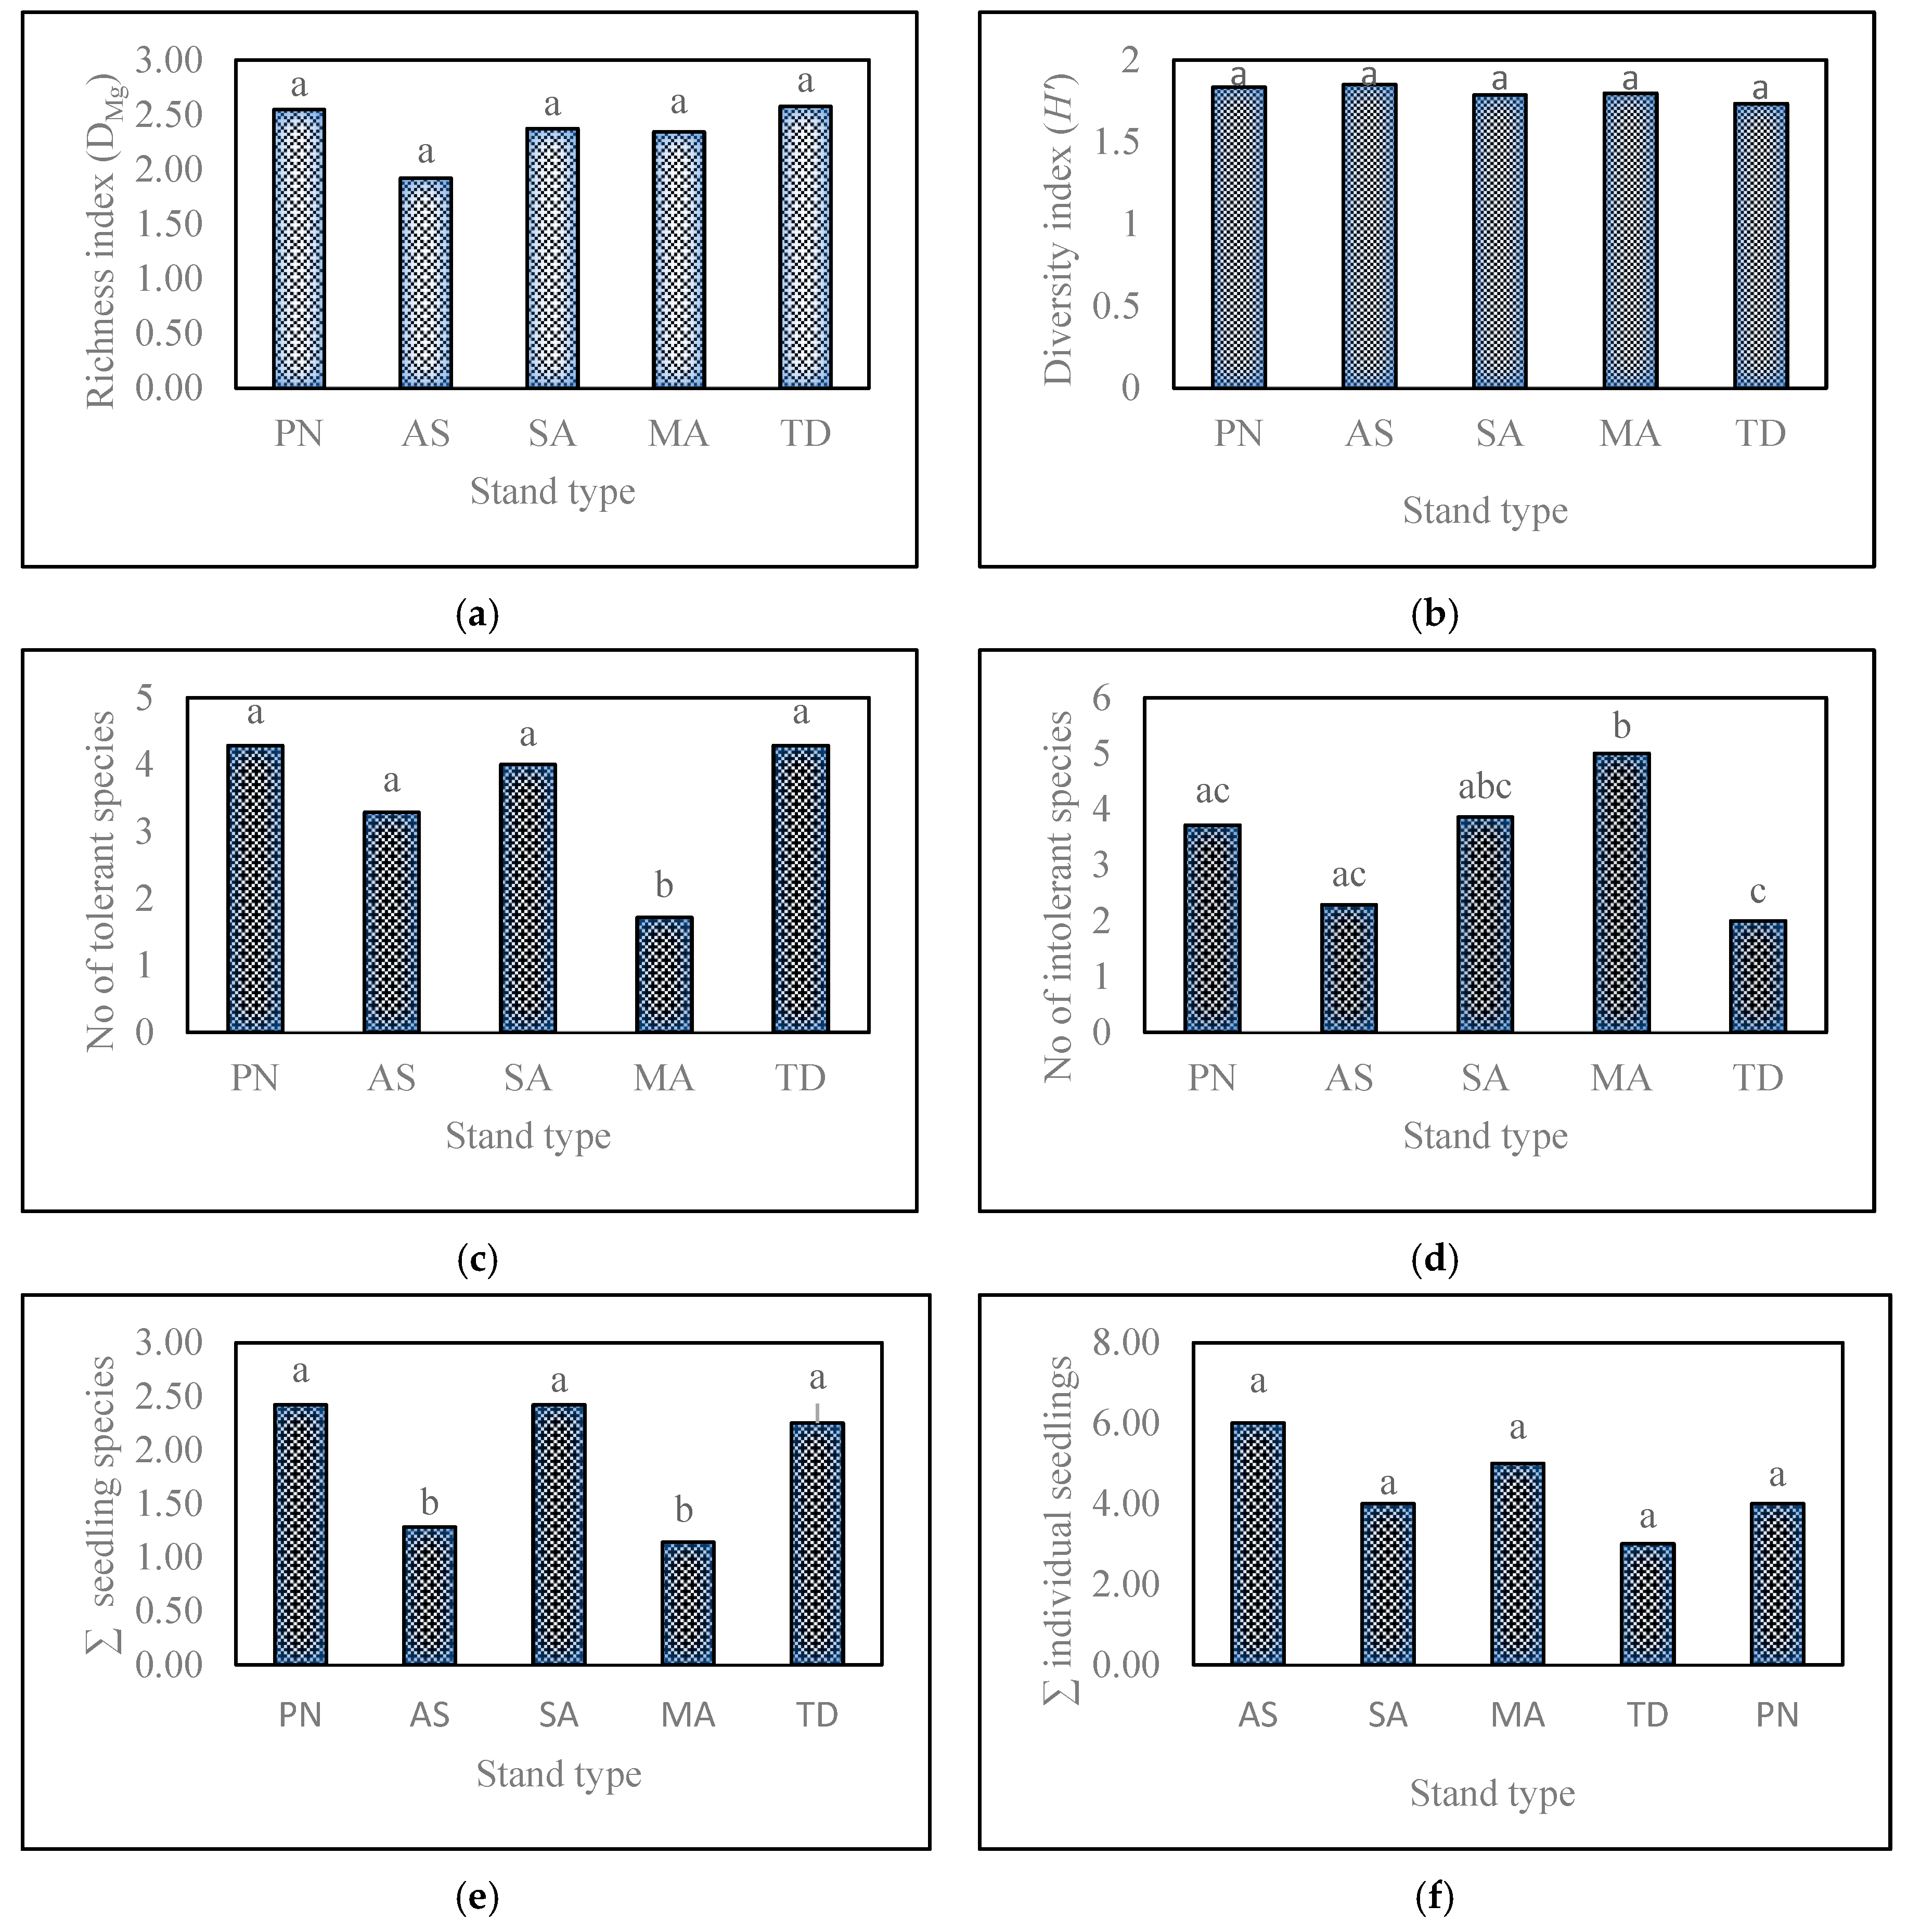
3.1. Effect of Stand Type on Understory Herb-Layer Composition

From a total of thirty-five selected plots, we recorded seventy-two understory herb-layer species belonging to thirty-five families spread across five stand types (Appendix A, Table A1). Among the total of 72 species, 16 were identified as shade-tolerant species, 33 were semi-shade-tolerant species, and 23 were shade-intolerant species. Those species included 14 seedlings and 58 herbaceous species.
The abundance distribution of the understory herb-layer species among stand types was relatively similar, where the ten most dominant species in all stand types similarly held more than half of the total proportion in the composition as shown by IV (Appendix A, Table A1). Accordingly, diversity indexes among stand types were relatively similar in spite of differences in the species list. The diversity index of all stand types was between two and three. Nevertheless, the list of species in the composition varied from one stand type to another. A number of particular species were infrequent and limited to specific stand types (restricted species), which were PN, AS, SA, MA and TD and contained eight, five, ten, four and seven restricted species, respectively. As shown in Appendix A, Table A1, only seven species grew widely in all stand types, while most of the understory herb-layer species were growing in more than one stand type (intermediate).
At the plot level, our analysis confirmed similarity and dissimilarity among the five stand types. MRPP analysis significantly showed the difference in the understory herb-layer species composition among the five stand types, as indicated by the negative value of the t statistic (T) at alpha 0.05 (Table 2). Meanwhile, the similarity value within the group (A) was generally fair (0.19). The more negative the “T” is, the stronger the separation between groups will be [50]. Furthermore, McCune and Grace [50] also stated that the low value of “A” in community data is generally small, even below 0.1. The greater dissimilarity was seen between TD and PN, TD and AS, TD and SA, and PN and SA compared to other pairwise comparisons. Although we found no significant differences in species richness and diversity index (Figure 2a,b), understory herb-layer species composition among stand types was significantly different in terms of species list. As shown in Figure 2c, MA contained the least number of shade-tolerant species among all stand types. Inversely, the least number of shade-intolerant species was shown in TD (Figure 2d). In addition, understory herb-layer species in the five stand types also performed differently in seedling availability, which is related to regeneration potential (Figure 2e).
Our result found significant differences in the number of seedling species (Figure 2e) despite the equal number of individuals (Figure 2f). As shown in Figure 2e, AS and MA significantly showed fewer seedling species compared to PN, SA and TD (Kruskal–Wallis chi-square 14.05, p-value 0.007). In relation to the number of individuals, all stand types generally displayed “good regeneration” status as the seedling density in all stand types was much higher than the density of the higher growth levels, including saplings, poles and mature trees, consecutively (Appendix A, Table A2). However, one of the main species in AS (A. molucana) and MA (M. Leucadendron) were not regenerated, with no seedlings or saplings explored (Appendix A, Table A1; Appendix A, Table A2).
A more detailed description in relation to different sets of understory herb species was performed by indicator species analysis. Based on the 25% indicator value threshold suggested by Dufrêne and Legendre [53] at alpha 0.05, indicator species analysis identified thirteen significant indicator species where TN, AS, SA, MA and TD were indicated by two, one, one, three, and six species, respectively (Table 3). Other species were not significant indicators because they were mostly singleton and infrequent species with no possibility of being statistically significant indicator species [50,53]. Furthermore, we found different characteristics of indicator species among stand types (Table 3). All indicator species in MA were shade-intolerant species. This species was also presented as an indicator species in PN and SA stand types, although in fewer numbers. In contrast, TD exhibited two shade-tolerant and four semi-shade-tolerant species as indicator species, and one of these species was a seedling species (D. latifolia). Uniquely, shade-tolerant species also became indicator species in AS, which was a seedling species (S. macrophylla), regardless of the fewer seedling species in AS. In addition, there were no shade-intolerant species fulfilling the indicator value threshold in AS, despite the equal number of those species in PN, SA and MA (Figure 2c; Table 3).

3.2. Influencing Factors Determining the Understory Herb-Layer Composition

3.2.1. Control of Tree Stand Characteristics and Associated Environmental Factors on Understory Species

Among the total of 35 selected plots, the highlighted tree vegetation characteristics and the associated environmental factors mostly varied among stand types and plots (Table 1). Moreover, Ordination analysis using canonical correspondence analysis (CCA) indicated the influence of tree vegetation and other highlighted environmental factors on understory vegetation as explained by the first two axes (Table 4; Figure 3a,b). As shown in Table 4, CCA displayed a fairly convincing result with >0.3 eigenvalues, which is categorized as strong [56]. In addition, 18% of the variance explained by the first two axes satisfied our result because it is commonly low for ecological data, even less than 10% [57]. We considered factors correlated with the first two axes to have greater influences on the understory herb-layer composition, as the eigenvalues of the first two axes were higher than those of the third axis [50].
The first two axes showed significant correlations to tree canopy coverage (Veg-CC), silt proportion in soil texture (Ed-Silt), soil organic carbon (Ed-SOC) and below-stand utilization (Ant-BsU). As shown in Figure 3a, most plots of TD stands containing a greater number of shade-tolerant and seedling species were positively correlated to tree canopy coverage (Veg-CC), silt proportion in soil texture (Ed-Silt) and soil organic carbon (Ed-SOC), yet negatively correlated to below-stand utilization (Ant-BsU). Inversely, most plots in the MA stand have more shade-intolerant species and fewer seedling species, demonstrating the opposite correlation. Figure 3b then exhibited that most of the shade-tolerant and seedling species were grouped on the left side of the ordination diagram along with tree canopy coverage (Veg-CC), silt proportion in soil texture (Ed-Silt) and soil organic carbon (Ed-SOC). Meanwhile, shade-intolerant species were clustered following below-stand utilization (BsU) on the right side.

3.2.2. Inter-Correlation between Factors

In addition to direct relationships between predictor variables (tree stand characteristics and the associated environmental factors) and response variables (the understory herb-layer species), we also found inter-correlation or mutual relationships between two or more predictor variables (Table 5). Among five vegetation factors (tree stand characteristics), we saw that tree density (Veg-dy) was positively correlated to the basal area (Veg-BA), which was positively correlated to tree canopy coverage (Veg-CC). Meanwhile, the tree diversity index (Veg-H’) and canopy height (Veg-CH) did not show significant correlations to other tree vegetation characteristics. Nevertheless, the five vegetation factors significantly showed their relationship to some associated environmental factors related to topographic, edaphic and anthropogenic factors. As shown in Table 5, the diversity index (Veg-H’) had a significant correlation with slope position (Top-slope po), total nitrogen (Ed-TN) and distance from the river (Ant-river). Basal area (Veg-BA) was negatively correlated to sand content (Ed-sand), while density showed a negative correlation with slope position (Top-slope po) and a positive correlation with silt content (Ed-silt). Moreover, Table 5 also showed that tree canopy height (Veg-CH) was negatively correlated to altitude (Top-alt) and below-stand utilization (Ant-BsU), while tree canopy coverage (Veg-CC) was positively correlated to silt proportion in soil texture (Ed-silt) and soil organic carbon (Ed-SOC) and negatively correlated to below-stand utilization (Ant-BsU).

4. Discussion

The forest area of Kulon Progo Community Forestry has been recovering gradually since the implementation of forest rehabilitation in the 2000s [30,35]. Exceedingly, since it was designated as a protected forest in 2007 [40]. The success of tree planting and the designation of this area as a protected forest obviously play an important role in plant biodiversity. Our study implied a positive impact of the stand type on the variability of below-stand environmental conditions. Although the five stand types showed no differences in the quantitative values of diversity (Margalef richness index and Shannon diversity index), these stand types exhibited variation in the composition of understory herb-layer species among each other (Table 3; Appendix A, Table A1). Differences in environmental conditions at each stand type apparently led to the loss and growth of certain species. Our finding was in line with some previous studies revealing that certain understory herb layers are prone to changes in local factors such as shade, fertility, humidity, sunlight, etc. [58,59,60]. The limited number of widespread species and the presence of restricted species in this study (Appendix A, Table A1) could imply variability in particular environmental conditions among stand types. Meanwhile, the widely explored species might indicate the existence of similarities in certain conditions because the availability of suitable habitats determines the species distribution [51,61]. However, many species growing in more than one stand type might also reflect their high adaptability [62,63].
Regarding the similarity in the quantitative values of diversity (Figure 2a,b), the similarity in species richness might reflect the tropics of the study site because high species richness is typical of the tropics [64]. Moreover, we found that understory herb-layer species in the five stand types similarly showed moderate diversity. According to Oddum [65], a diversity index between two and three is categorized as moderate. The equality of the diversity index was related to the similarity in the number of species and abundance. It was unsurprising because the change in tree vegetation cover not only removes certain species but also provides opportunities for the growth of other species [11,12,66,67]. As shown in Appendix A, Table A1, IV of understory herb-layer species in the five stand types indicated a similar pattern in species abundance and distribution. Although each stand is composed of a different set of species, the ten most dominant species in all stand types similarly hold more than 50% of IV (Appendix A, Table A1). This pattern then fell into the equal diversity index since the abundance of individual species is a key component in calculating diversity indices [50,51]. According to Indrianto [68], IV reflects species dominance in a community, and the diversity index will be high if a community is composed of many species with low dominance of particular species.
In relation to the loss and growth of particular species, the presence of widespread species, especially natural seedlings such as Macaranga sp. from the Euphorbiaceae family, reflected a similar stage of the succession process for all stand types. Species from this family were common in secondary forests [69,70]. However, differences in the number of tolerant species (Figure 2c), the number of intolerant species (Figure 2d), and the number of seedling species (Figure 2e) clearly explained the effect of stand type on plant biodiversity in this study. The lower number of shade-tolerant species in MA (Figure 2c) compared to other stand types, especially TD (Figure 2d), indicated the more open forest of the MA stand (Table 1). On the other hand, the fewer shade-intolerant species in TD indicated a better condition of the tree stand. According to Wahyuni et al. [9] and Rembold et al. [67], a more open and disturbed forest usually loses many native herb-layer species with shade-tolerant characteristics and rapidly overgrows many non-native shade-intolerant species with invasive characteristics.
In terms of seedling availability, the more open forest also affected the growth of particular seedlings. The greater number of shade-intolerant species contributes to the smaller number of seedling species (Figure 2e), despite the similarity in the total number of individuals (Figure 2f). However, anthropogenic disturbances such as non-timber forest product utilization [30] might also determine the number of seedlings at the study site. According to HKm Mandiri [30], there were fruits/seeds collected by A. molucana in AS and leaves collected by M. Leucadendra in MA, in addition to below-stand utilization as in other stand types. Such utilization might lead to the removal of seeds and even facilitate the growth of invasive species. Fu et al. [10] revealed that anthropogenic disturbance hampers the growth of seedlings and ultimately disturbs tree species regeneration. Similarly, Freeman [71] suggested that anthropogenic disturbance leads to the growth of invasive species that invade forest species. Accordingly, we found that the number of seedling species in AS and MA was similarly fewer than other stand types (Figure 2e), although AS actually had equal tree canopy coverage to TD (Table 1). Our study did not even find seedlings of the most dominant tree species in both AS (A. molucana) and MA (M. Leucadendra). This fact implied the “none” regeneration status of these species, although the total number of individuals of all stand types showed “good” regeneration status (Appendix A, Table A2).
Indicator species analysis deeply confirmed the understory herb-layer species differences among stand types, where each stand type had its own indicator species. This fact implies that environmental conditions among stand types are still different. According to Siswo et al. [11], McCune and Grace [50], and Dufrene and Legendre [53], indicator species describe specific environmental conditions. For instance, the more open MA stand was characterized by some indicator species with shade-intolerant and light-demanding characteristics, including A. conyzoides [45], Lantana camara [46] and Scleria sp. [9]. Meanwhile, indicator species in TD with a wider/denser canopy were shade-tolerant and semi-shade-tolerant species such as Nephrolepis sp., Bauhunia sp. and Otochloa gracillima, which reflected the shadier condition of the TD stand formed by the lush and dense crown of D. latifolia [42,43] and the wide crown and broad leaves of T. grandis [43].
At the plot level, ordination analysis using CCA clearly showed the influence of tree vegetation characteristics and some associated environmental factors on the understory herb-layer species composition. Our results indicated that tree canopy coverage (Veg-CC), silt proportion in soil texture (Ed-silt), soil organic carbon (Ed-SOC) and below-stand utilization (BsU) influenced the understory herb-layer composition in this study (Table 4; Figure 3a,b). Meanwhile, topographic factors did not show a significant impact because all the highlighted factors related to topography in the study site had relatively low variations [32,35]. Some previous studies also revealed a similar finding that canopy coverage influences the understory herb-layer species composition, along with other influencing factors such as soil and topographic factors [21,23]. Tree vegetation determines understory herb-layer species composition [6,9] related to positive impacts on lighting [66], microclimate [59], and litter layer related to nutrient content [60]. Meanwhile, other environmental factors related to topographic and edaphic aspects have been widely recognized as influencing species distribution [21,24,72]. In relation to silt proportion in soil texture (Ed-Silt) and soil organic carbon (Ed-SOC), silty soil is generally fertile and contains a sufficient amount of nutrients [73], while soil organic carbon is one of the most important factors for soil quality, nutrient availability, plant growth and productivity [74]. Moreover, anthropogenic disturbances such as below-stand utilization (BsU) highly determine the understory herb-layer composition. According to Pereira [75], agricultural activities in the forest area could be a crucial factor for habitat change.
A deeper analysis of the role of tree vegetation implied that tree vegetation factors other than tree canopy coverage also seemed to make an important contribution. Although only canopy coverage showed direct influence (Figure 3a,b), other tree vegetation characteristics were also indirectly determining the understory herb-layer species composition. As shown in Table 5, the canopy coverage increased with the increase in basal area, and the basal area was also correlated to tree density. In addition, tree canopy coverage also indicated the possibility of having an influence on other associated environmental factors. Tree canopy coverage in this study was correlated to silt proportion in soil texture (Ed-silt), soil organic carbon (Ed-SOC) and below-stand utilization (BsU) (Figure 3; Table 5). Regarding the silt proportion in the soil (Ed-Silt), silt, sand and clay proportions in the soil texture may change in the long term and under particular conditions, although soil texture is barely changing (stable) in a normal condition [76]. The presence of tree vegetation cover might protect the soil from textural damage due to excessive erosion, considering the soil erosion control provided by vegetation [77]. Tree vegetation reduces the rate of erosion through canopy coverage by protecting the soil from the direct impact of raindrops on the ground [78,79]. Without protection from tree vegetation cover, silt is possible to be leached during the erosion process because silt is easily transported in water [80]. Furthermore, the rate of erosion also influences the loss of SOC and soil fertility [81,82]. Wenjie et al. [83] and Fan et al. [84] suggested that the dense canopy cover also reduces evaporation from the forest floor, leading to a cold temperature and maintaining and increasing SOC [85,86]. Accordingly, a previous report by Siswo et al. [32] revealed that canopy coverage is one of the most influential factors for soil organic carbon and soil organic matter in this area. Moreover, as the canopy coverage increased (Veg-CC), the below-stand utilization (Ant-BsU) decreased (Figure 3a,b; Table 5). According to Joshi et al. [87] and Siswo et al. [11], farmers’ interest in cash crop cultivation usually declines because the dense canopy of tree vegetation commonly inhibits the growth of the cash crop cultivated below the stand.

5. Conclusions

In general, different stand types led to variation in the understory herb-layer composition despite the possibility of maintaining the quantitative values of diversity. As per our hypothesis, we found dissimilarity in the understory herb-layer composition, where each stand type showed a different set of species related to species characteristics and regeneration potential. In more detail, indicator species analysis significantly exhibited that all indicator species in the Melaleuca-Acacia stand were shade-intolerant species with invasive characteristics, while those in the Tectona-Dalbergia stand were shade-tolerant and semi-shade-tolerant species. Stand type influences understory herb-layer species composition through tree vegetation characteristics and several associated environmental factors below the stand. The number of shade-tolerant and seedling species commonly native to forest were directly proportional to tree canopy coverage, silt proportion in soil texture and concentration of soil organic carbon yet inversely proportional to below-stand utilization. In contrast, the number of shade-intolerant species had positive correlation to below-stand utilization and inversely to other correlated factors Tree vegetation also showed the possibility of controlling several environmental factors, where the increase in canopy coverage was followed by an increasing proportion of silt in soil texture and the content of soil organic carbon. Moreover, the increase in tree canopy cover was also followed by a decreasing percentage of below-stand utilization. This finding recommended species enrichment using dense-canopy trees while considering community dependence on forests through adaptive management in below-stand utilization, both in the study area and other reforestation programs. Thus, this is important knowledge for the evaluation and improvement of species diversity and ecological restoration in degraded forests.

Author Contributions

Conceptualization, S.; methodology, S. and C.-W.Y.; software, S. and J.L.; validation, S. and C.-W.Y.; formal analysis, S.; investigation, S. and J.L.; resources, C.-W.Y.; data curation, S.; writing—original draft preparation, S.; writing—review and editing, S.; visualization, S. and J.L.; supervision, C.-W.Y.; project administration, J.L.; funding acquisition, C.-W.Y. All authors have read and agreed to the published version of the manuscript.

Funding

This work was carried out with the support of the R&D Program for Forest Science Technology (Project No. 2021332A10-2323-AA01) provided by the Korea Forest Service (Korea Forestry Promotion Institute) in 2023.

Institutional Review Board Statement

Not applicable.

Data Availability Statement

Data are contained within the manuscript.

Acknowledgments

The authors would like to thank Bambang Dwi Atmoko, Lathif Brahmantya, Eko Priyanto and Uchu Waluya Heri Pahlana for their valuable support in data collection. The authors also thank Susi Abdiyani for providing a careful proofread of the manuscript, especially for checking the English style, spelling, and grammar.

Conflicts of Interest

The authors declare no conflict of interest.

Appendix A

Table A1. Understory herb-layer species composition and distribution in five stand types in the protected forest of Kulon Progo Community Forestry.
NoSpecies NameFamily NameImportant Value IndexShadingDistribution
PNASSAMATDCharacteristicCategory
1Dryopteris sp.Dryopteridaceae7.335.774.483.544.5611
2CytrococumPoaceae23.8117.2924.8824.753.0221
3OttochloaPoaceae6.354.741.384.7326.8911
4Curcuma sp.Zingeberacerae2.254.530.002.901.1031
5Urena lobataMalvaceae1.481.252.375.061.8521
6Clidemia hirtaMelastomaceae6.352.726.595.264.3931
7Borreria latifoliaRubiaceae1.410.000.000.880.0012
8Elletaria cardomomumZingeberacerae1.410.000.000.000.0023
9Impatiens balsaminaBalsaminaceae1.480.000.000.000.0023
10Andrographis paniculataAcanthaceae3.105.092.460.006.9912
11Colocasia giganteaAraceae1.622.260.730.000.0022
12Slaginella sp.Slaginellaceae9.314.970.002.630.0022
13Coctus spicatusCostaceae1.691.360.730.740.0022
14Scleria sp.Poaceae1.900.000.004.990.8632
15Euphorbia hirtaEuphorbiaceae0.923.171.550.000.0032
16Eupatorium odoratumAsteraceae5.420.002.130.811.5832
17Oxalis corniculataOxalidaceae0.631.470.820.000.7422
18Stachytarpheta jamaicensisVerbenaceae0.000.001.731.820.0032
19Spilanthes paniculataAsteraceae3.450.000.000.000.0033
20Pennisetum purpureumPoaceae0.630.002.302.901.4622
21Commelina benghalensisClommelinaceae0.700.000.000.000.0033
22Lantana camaraVerbenaceae0.701.701.104.991.6122
23Setaria viridisPoaceae1.130.000.000.000.0033
24Phylanthus urinariaFabaceae0.001.150.823.170.0032
25Acalypha australisEuphorbiaceae1.690.000.000.000.0033
26Imperata cylindricaPoaceae1.270.000.000.000.0033
27Centrosema sp.Fabaceae0.635.663.383.514.5621
28Passiflota foetidaPassifloraceae0.000.910.000.000.0023
29Ficus montanaMoraceae0.001.810.000.000.0033
30Almorphophallus muelleriAraceae0.000.910.000.000.0023
31Panicum repensPoaceae0.002.150.000.880.0022
32Melastoma cadidumMelastomaceae0.002.261.762.161.9732
33Ageratum conyzoidesAsteraceae0.007.572.848.913.1932
34Mimosa pudicaFabaceae0.001.250.000.000.0033
35Elephantopus scaberAsteraceae0.001.931.100.000.0022
36Cymbopogon citratusPoaceae0.001.921.012.290.0022
37Flemingia macrophyllaFabaceae0.000.000.001.150.8622
38Hyptis capitataLamiaceae0.002.261.830.000.0032
39Stenochlaena palustrisBlechnaceae0.000.002.490.000.0023
40Hibiscus rosa-sinensisMalvaceae0.000.000.820.000.0023
41Cynodon dactylonPoaceae0.000.0010.220.000.9832
42Mikania micranthaAsteraceae0.000.002.200.000.0033
43Tinospora cordifoliaMenispermaceae0.000.000.000.001.8513
44Pteris ensiformisPteridaceae0.000.001.100.000.0013
45Cosmos caudatusCoreopsideae0.000.000.910.000.0013
46Gynura procumbensAsteraceae0.000.000.000.880.0023
47Cynoglosum sp.Boraginaceae0.000.001.010.000.0013
48Wedelia trilobataAsteraceae0.000.001.290.001.2232
49Peperonema pellucidaPiperaceae0.000.000.000.000.7413
50Lygodium circinnatumLygodiaceae0.000.000.001.622.3522
51Portulaca sp.Portulacaceae0.000.000.820.000.0033
52Andiatum caudatumAndiataceae0.000.000.000.740.0023
53Crassocephalum crepidioidesAsteraceae0.000.000.000.740.8632
54Clausena excavataRutaceae0.000.000.000.000.7423
55Bauhinia sp.Fabaceae0.000.000.000.004.8013
56Cleome rutidospermaCleomaceae0.001.470.000.000.8622
57Clitoria ternateaFabaceae0.000.000.000.000.8623
58Nephrolepis bisserataPteridacerae0.000.000.000.002.7123
59Syzigium aromaticumMyrtaceae0.700.000.000.000.0023
60Pinus merkusii *Pinaceae0.920.000.000.000.0023
61Macaranga sp. *Euphorbiaceae2.391.001.732.701.8522
62Dalbergia latifolia *Fabaceae2.950.002.652.435.0412
63Swietenia macrophyla *Meliaceae0.636.683.470.743.1011
64Gmelina elliptica *Lamiaceae0.000.000.000.004.0822
65Tectona grandis *Lamiaceae0.000.910.000.001.4932
66Ardisi ellipticaPrimulaceae4.502.041.920.000.7412
67Parkia speciosa *Fabaceae0.000.001.100.000.0023
68Genetum genemon *Genetaceae0.000.910.000.000.0013
69Ficus septica *Moraceae1.270.910.730.000.0012
70Acacia auriculiformis *Fabaceae0.000.000.820.740.0012
71Leucaena leucocephala *Fabaceae0.000.000.730.000.0023
72Paraserientes falcataria *Fabaceae0.000.000.001.350.0023
100100100100100
Note: Species with an asterisk indicate tree species (seedlings); Shading category: 1 = tolerant species, 2 = semi/facultative, 3 = intolerant species; Distribution category: 1 = widespread, 2 = intermediate, 3 = restricted species. PN = Pinus stand, AS = Aleurites-Swietenia stand, SA = Swietenia-Acacia stand, MA = Melaleuca-Acacia stand, TD = Tectona-Dalbergia stand.
Table A2. Seedling availability and tree regeneration status.
Stand Type Tree Regeneration Species
Number of Seedling SpeciesSpeciesFamilyDensity (n/ha)RS
SeedlingSaplingPoleTree
PN2P. merkusiiLauraceae1786-14311
Other species 14,285886186164Good
Total 16,071886200375Good
AS1A. molucanaEuphorbiaceae---104None
S. macrophyllaEuphorbiaceae718834316732Good
Other species 351268517668
Total 10,7001028343204Good
SA2S. macrophyllaMoraceae187568622954Good
A. auriculiformisEuphorbiaceae20831711454Good
Other species 9242985285124Good
Total 13,2001842528232Good
MA1M. LeucadendronMoraceae--18679None
A. auriculiformisEuphorbiaceae682296736Good
Other species 7868111314736Good
Total 85501142400154Good
TD2D. latifoliaMoraceae3958514167118Good
T. grandisEuphorbiaceae-576774Poor
Other species 568440019519Good
TotalEuphorbiaceae9642971429211Good
Note: Stand types include PN = Pinus stand, AS = Aleurites-Swietenia stand, SA = Swietenia-Acacia stand, MA = Melaleuca-Acacia stand, and TD = Tectona-Dalbergia stand. RS = Regeneration status.

References

  1. Nilsson, M.; Wardle, D.A. Understory vegetation as a forest ecosystem driver: Evidence from the northern Swedish boreal forest. Front. Ecol. Environ. 2005, 3, 421–428. [Google Scholar] [CrossRef]
  2. Jules, M.J.; Sawyer, J.O.; Jules, E.S. Assessing the relationships between stand development and understory vegetation using a 420-year chronosequence. For. Ecol. Manag. 2008, 255, 2384–2393. [Google Scholar] [CrossRef]
  3. Gilliam, F.S. The ecological significance of the herbaceous layer in temperate forest ecosystems. Bioscience 2007, 57, 845–858. [Google Scholar] [CrossRef]
  4. Hubau, W.; De Mil, T.; Van den Bulcke, J.; Phillips, O.L.; Angoboy Ilondea, B.; Van Acker, J.; Sullivan, M.J.P.; Nsenga, L.; Toirambe, B.; Couralet, C.; et al. The persistence of carbon in the African forest understory. Nat. Plants 2019, 5, 133–140. [Google Scholar] [CrossRef] [PubMed]
  5. Landuyt, D.; De Lombaerde, E.; Perring, M.P.; Hertzog, L.R.; Ampoorter, E.; Maes, S.L.; De Frenne, P.; Ma, S.; Proesmans, W.; Blondeel, H. The functional role of temperate forest understorey vegetation in a changing world. Glob. Chang. Biol. 2019, 25, 3625–3641. [Google Scholar] [CrossRef]
  6. Bartels, S.F.; Chen, H.Y.H. Is understory plant species diversity driven by resource quantity or resource heterogeneity? Ecology 2010, 91, 1931–1938. [Google Scholar] [CrossRef]
  7. Dauber, J.; Hirsch, M.; Simmering, D.; Waldhardt, R.; Otte, A.; Wolters, V. Landscape structure as an indicator of biodiversity: Matrix effects on species richness. Agric. Ecosyst. Environ. 2003, 98, 321–329. [Google Scholar] [CrossRef]
  8. Malik, Z.A.; Bhatt, A.B. Regeneration status of tree species and survival of their seedlings in Kedarnath Wildlife Sanctuary and its adjoining areas in Western Himalaya, India. Trop. Ecol. 2016, 57, 677–690. [Google Scholar]
  9. Wahyuni, I. Distribution of invasive plant species in different land-use systems in Sumatera, Indonesia. Biotropia 2016, 23, 127–135. [Google Scholar] [CrossRef]
  10. Fu, D.; Wu, X.; Huang, N.; Duan, C. Effects of the invasive herb Ageratina adenophora on understory plant communities and tree seedling growth in Pinus yunnanensis forests in Yunnan, China. J. For. Res. 2018, 23, 112–119. [Google Scholar] [CrossRef]
  11. Siswo, S.; Yun, C.W.; Kim, H.; Lee, J.; Atmoko, B.D.; Brahmantya, L. Assessing herb layer composition under jungle rubber in Sungai Manau Forest, Jambi, Indonesia: Indicator species and tree regeneration potential. Biodiversitas 2022, 23. [Google Scholar] [CrossRef]
  12. Beukema, H.; van Noordwijk, M. Terrestrial pteridophytes as indicators of a forest-like environment in rubber production systems in the lowlands of Jambi, Sumatra. Agric. Ecosyst. Environ. 2004, 104, 63–73. [Google Scholar] [CrossRef]
  13. Böhnert, T.; Wenzel, A.; Altenhövel, C.; Beeretz, L.; Tjitrosoedirdjo, S.S.; Meijide, A.; Rembold, K.; Kreft, H. Effects of land-use change on vascular epiphyte diversity in Sumatra (Indonesia). Biol. Conserv. 2016, 202, 20–29. [Google Scholar] [CrossRef]
  14. Udayana, C.; Andreassen, H.P.; Skarpe, C. Understory diversity and composition after planting of teak and mahogany in Yogyakarta, Indonesia. J. Sustain. For. 2020, 39, 494–510. [Google Scholar] [CrossRef] [Green Version]
  15. Wu, H.F.; Gao, T.; Zhang, W.; Li, G.; Hao, W.F. Understory Vegetation Composition and Stand Are Mainly Limited by Soil Moisture in Black Locust Plantations of Loess Plateau. Forests 2021, 12, 195. [Google Scholar] [CrossRef]
  16. Barbier, S.; Gosselin, F.; Balandier, P. Influence of tree species on understory vegetation diversity and mechanisms involved— A critical review for temperate and boreal forests. For. Ecol. Manag. 2008, 254, 1–15. [Google Scholar] [CrossRef]
  17. Pilon, N.A.; Durigan, G.; Rickenback, J.; Pennington, R.T.; Dexter, K.G.; Hoffmann, W.A.; Abreu, R.C.; Lehmann, C.E. Shade alters savanna grass layer structure and function along a gradient of canopy cover. J. Veg. Sci. 2021, 32, e12959. [Google Scholar] [CrossRef]
  18. Ren, Y.; Guo, M.; Yin, F.; Zhang, M.-J.; Wei, J. Tree Cover Improved the Species Diversity of Understory Spontaneous Herbs in a Small City. Forests 2022, 13, 1310. [Google Scholar] [CrossRef]
  19. Wang, F.; Wang, Z.; Yang, Z.; Ji, X. Vegetation succession process induced by reforestation in erosion areas. Front. For. China 2008, 3, 279–285. [Google Scholar] [CrossRef]
  20. Lamb, D.; Erskine, P.D.; Parrotta, J.A. Restoration of degraded tropical forest landscapes. Science 2005, 310, 1628–1632. [Google Scholar] [CrossRef] [Green Version]
  21. Ou, Z.; Pang, S.; He, Q.; Peng, Y.; Huang, X.; Shen, W. Effects of vegetation restoration and environmental factors on understory vascular plants in a typical karst ecosystem in southern China. Sci. Rep. 2020, 10, 12011. [Google Scholar] [CrossRef] [PubMed]
  22. Hart, S.A.; Chen, H.Y.H. Understory vegetation dynamics of North American boreal forests. Crit. Rev. Plant Sci. 2006, 25, 381–397. [Google Scholar] [CrossRef]
  23. Huo, H.; Feng, Q.; Su, Y.H. The influences of canopy species and topographic variables on understory species diversity and composition in coniferous forests. Sci. World J. 2014, 1, 252489. [Google Scholar] [CrossRef] [PubMed] [Green Version]
  24. Thammanu, S.; Marod, D.; Han, H.; Bhusal, N.; Asanok, L.; Ketdee, P.; Gaewsingha, N.; Lee, S.; Chung, J. The influence of environmental factors on species composition and distribution in a community forest in Northern Thailand. J. For. Res. 2020, 32, 649–662. [Google Scholar] [CrossRef]
  25. Siswo; Yun, C.-W.; Abdiyani, S. Assessing Vegetation Composition and the Indicator Species around Water Source Areas in a Pine Forest Plantation: A Case Study from Watujali and Silengkong Catchments, Kebumen, Indonesia. Forests 2019, 10, 825. [Google Scholar] [CrossRef] [Green Version]
  26. De Steven, D.; Faulkner, S.P.; Keeland, B.D.; Baldwin, M.J.; McCoy, J.W.; Hughes, S.C. Understory vegetation as an indicator for floodplain forest restoration in the Mississippi River Alluvial Valley, USA. Restor. Ecol. 2015, 23, 402–412. [Google Scholar] [CrossRef]
  27. Udayana, C.; Andreassen, H.P.; Skarpe, C. Wood and non-wood forest products of Central Java, Indonesia. J. Sustain. For. 2019, 38, 715–732. [Google Scholar] [CrossRef] [Green Version]
  28. Mahfudz; Rahman, T.; Lukmansjah, D. (Eds.) Statistik Kementeria n Lingkungan Hidup dan Kehutanan Tahun 2019 [Ministry of Environment and Forestry Statistics for 2019]; Kementerian Lingkungan Hidup dan kehutanan [Ministry of Environment and Forestry]: Jakarta, Indonesia, 2020. [Google Scholar]
  29. Nawir, A.A.; Rumboko, L. Forest Rehabilitation in Indonesia: Where to after More Than Three Decades? Center for International Forestry Research (CIFOR): Bogor, Indonesia, 2007. [Google Scholar]
  30. HKm Mandiri. Profil Kelompok Tani Hutan Kemasyarakatan [Profile of Community Forest Farmer Groups]; HKm Mandiri: Yogyakarta, Indonesia, 2022. [Google Scholar]
  31. Siswo; Atmoko, D.A.; Brahmantya, L.; Pahlana, U.W.; Yun, C.W. Overseas Forest Survey; Tree Species Distribution and the Rela-tionship to Environmental Factors in the Protected Forest of Kulon Progo Community Forestry; Report; Kongju National University: Yesan-gun, Republic of Korea, 2022. [Google Scholar]
  32. Siswo; Kim, H.; Lee, J.; Yun, C.-W. Influence of Tree Vegetation and The Associated Environmental Factors on Soil Organic Carbon; Evidence from “Kulon Progo Community Forestry,” Yogyakarta, Indonesia. Forests 2023, 14, 365. [Google Scholar] [CrossRef]
  33. Hadi, E.E.W.; Widyastuti, S.M.; Wahyuono, S. Keanekaragaman Dan Pemanfaatan Tumbuhan Bawah Pada Sistem Agroforestri Di Perbukitan Menoreh, Kabupaten Kulon Progo [Diversity and Untilization of Understorey in Agroforestry System of Menoreh Hill, Kulon Progo Regency]. J. People Environ. 2016, 23, 206–214. [Google Scholar] [CrossRef] [Green Version]
  34. Zuhri, S. Keanekaragaman Jenis Tumbuhan Bawah Pada Lahan Andil Kelompok Tani Hutan “Mandiri” di Kalibiru, Kabupaten Kulon Progo [Diversity of Understorey Species on the Utilization Permits of the “Mandiri” Forest Farmer Group in Kalibiru, Kulon Progo Regency]. Ph.D. Thesis, Universitas Gadjah Mada, Yogyakarta, Indonesia, 2021. [Google Scholar]
  35. Balai KPH Yogyakarta. Ringkasan Eksekutif Rencana Pengelolaan KPH Yogykarta Jangka Tahun 2014–2023 [Executive Summary of the KPH Yogyakarta Management Plan for the 2014–2023 Term]; Balai Kesatuan Pengelolaan Hutan: Yogyakarta, Indonesia, 2013. [Google Scholar]
  36. Arsalan, A.; Gravitiani, E.; Irianto, H. Biomassa di Atas Tanah dan Penghitungan Simpanan Karbon Hutan Kalibiru Kabupaten Kulon Progo [Aboveground Biomass and Calculation of Carbon Stores in the Kalibiru Forest, Kulon Progo Regency]. J. Penelit. Biol. 2020, 6, 1–8. [Google Scholar] [CrossRef]
  37. BPS Kabupaten Kulon Progo. Kabupaten Kulon Progo Dalam Angka Tahun 2021 [Kulon Progo Regency in Figures for 2021]; Biro Pusat Statistik: Kulon Progo, Indonesia, 2022. [Google Scholar]
  38. Climate Engine. Computing Climate and Remote Sensing Data. Available online: https://app.climateengine.com/climateEngine (accessed on 22 September 2022).
  39. Wikipedia. Sejarah Terjadinya Hutan Negara di Kulon Progo. Available online: https://id.wikipedia.org/wiki/Kalibiru (accessed on 22 September 2022).
  40. Kementerian Kehutanan. Keputusan Menteri Kehutanan no SK.437/Menhut-II/2007 Tentang Penetapan Areal Kerja Hutan Kemasyarakatan di Kabupaten Kulon Progo Provinsi Daerah Istimewa Yogyakarta [Decree of the Minister of Forestry no SK.437/Menhut-II/2007 Regarding the Determination of Community Forestry Areas in Kulon Progo Regency, Special Teritory of Yogyakarta Province]; Kemeterian Kehutanan [Ministry of Forestry]: Jakarta, Indonesia, 2007. [Google Scholar]
  41. Kusmana, C. Metode Survey Vegetasi [Vegetation Survey Method]; Institut Pertanian Bogor: Bogor, Indonesia, 1997. [Google Scholar]
  42. Backer, C.A.; Van-Den- Bakhuizen, B. Flora of Java (Spermatophytes Only); Nordhoff: Groningen, The Nederland, 1963. [Google Scholar]
  43. Yudhoyono, A.; Sukarya, D.G. 3500 Plant Species of the Botanic Gardens of Indonesia; PT. Sukarya dan Sukarya Pendetama: Jakarta, Indonesia, 2013. [Google Scholar]
  44. Kudo, Y.; Mutaqien, Z.; Simbolon, H.; Suzuki, E. Spread of invasive plants along trails in two national parks in West Java, Indonesia. Tropics 2014, 23, 99–110. [Google Scholar] [CrossRef] [Green Version]
  45. GISD 2022. Invasive Species Specialist Group. Available online: http://www.iucngisd.org/gisd/search.php (accessed on 19 January 2022).
  46. Setyawati, T.; Narulita, S.; Bahri, I.P.; Raharjo, G.T. A Guide Book to Invasive Alien Plant Species in Indonesia; Research, Development and Innovation Agency. Ministry of Environment and Forestry: Bogor, Indonesia, 2015. [Google Scholar]
  47. Dar, J.A.; Subashree, K.; Sundarapandian, S.; Saikia, P.; Kumar, A.; Khare, P.K.; Dayanadan, S.; Khan, M.L. Invasive Species and Their Impact on Tropical Forests of Central India: A Review. In Tropical Ecosystems: Structure, Functions and Challenges in the Face of Global Change; Springer: Singapore, 2019; pp. 69–109. [Google Scholar] [CrossRef]
  48. Sarkar, M.; Devi, A. Assessment of diversity, population structure and regeneration status of tree species in Hollongapar Gibbon Wildlife Sanctuary, Assam, Northeast India. Trop. Plant Res. 2014, 1, 26–36. [Google Scholar]
  49. Nelson, J.; Noweg, T. Assessment of Forest Regeneration following series of disturbances in two types of primary forest at Bungo Range, Bau, Sarawak. J. Trop. For. Sci. 2021, 33, 126–136. [Google Scholar] [CrossRef]
  50. McCune, B.; Grace, J.B. Analysis of Ecological Communities; MJM Software Design: Corvallis, OR, USA, 2002. [Google Scholar]
  51. Magurran, A.E. Measuring Biological Diversity; Blackwell Science: Malden, MA, USA, 2004. [Google Scholar]
  52. Peck, J.E. Multivariate Analysis for Community Ecologists; MJM Software Design: Corvallis, OR, USA, 2010. [Google Scholar]
  53. Dufrêne, M.; Legendre, P. Species assemblages and indicator species: The need for a flexible asymmetrical approach. Ecol. Monogr. 1997, 67, 345–366. [Google Scholar] [CrossRef]
  54. Cardinal, R.N.; Aitken, M.R. ANOVA for the Behavioral Sciences Researcher; Psychology Press: London, UK, 2013. [Google Scholar]
  55. Cleophas, T.J.; Zwinderman, A.H. Non-Parametric Tests for Three or More Samples (Friedman and Kruskal Wallis); Clinical Data Analysis on a Poscket Calculator; Springer: Berlin/Heidelberg, Germany, 2016. [Google Scholar]
  56. Ter Braak, C.J.; Verdonschot, P.F. Canonical correspondence analysis and related multivariate methods in aquatic ecology. Aquat. Sci. 1995, 57, 255–289. [Google Scholar] [CrossRef]
  57. Møller, A.; Jennions, M.D. How much variance can be explained by ecologists and evolutionary biologists? Oecologia 2022, 132, 492–500. [Google Scholar] [CrossRef]
  58. Abood, S.A.; Lee, J.S.H.; Burialova, Z.; Garcia-Ulloa, J.; Koh, L.P. Relative contributions of the logging, fiber, oil palm, and mining industries to forest loss in Indonesia. Conserv. Lett. 2015, 8, 58–67. [Google Scholar] [CrossRef] [Green Version]
  59. Meijide, A.; Badu, C.S.; Moyano, F.; Tiralla, N.; Gunawan, D.; Knohl, A. Impact of forest conversion to oil palm and rubber plantations on microclimate and the role of the 2015 ENSO event. Agric. For. Meteorol. 2018, 252, 208–219. [Google Scholar] [CrossRef]
  60. Osborne, B.; Nasto, M.K.; Soper, F.M.; Asner, G.P.; Balzotti, C.S.; Cleveland, C.C.; Taylor, P.G.; Townsend, A.R.; Porder, S. Leaf litter inputs reinforce islands of nitrogen fertility in a lowland tropical forest. Biogeochemistry 2020, 147, 293–306. [Google Scholar] [CrossRef]
  61. Ehrlén, J.; Eriksson, O. Dispersal limitation and patch occupancy in forest herbs. Ecology 2000, 81, 1667–1674. [Google Scholar] [CrossRef]
  62. Ismaini, L. Pengaruh alelopati tumbuhan invasif (Clidemia hirta) terhadap germinasi biji tumbuhan asli (Impatiens platypetala) [Effect of invasive plant allelopathy (Clidemia hirta) on seed germination of native plants (Impatiens platypetala)]. Pros. Sem. Nas. Masy. Biodiv. Indon. 2015, 1, 834–837. [Google Scholar]
  63. Breaden, R.C.; Brooks, S.J.; Murphy, H.T. The biology of Australia weeds Clidemia hirta (L.) D.Don. Plant Prot. Q. 2012, 27, 3–18. [Google Scholar]
  64. Brown, J.H. Why are there so many species in the tropics? J. Biogeogr. 2014, 41, 8–22. [Google Scholar] [CrossRef] [PubMed] [Green Version]
  65. Odum, H.T. Scales of ecological engineering. Ecol. Eng. 1996, 6, 7–19. [Google Scholar] [CrossRef]
  66. Su, X.; Wang, M.; Huang, Z.; Fu, S.; Chen, H.Y. Forest understorey vegetation: Colonization and the availability and heterogeneity of Resources. Forests 2019, 10, 944. [Google Scholar] [CrossRef] [Green Version]
  67. Rembold, K.; Mangopo, H.; Tjitrosoedirdjo, S.S.; Kreft, H. Plant diversity, forest dependency, and alien plant invasions in tropical agricultural landscapes. Biol. Conserv. 2017, 213, 234–242. [Google Scholar] [CrossRef]
  68. Indriyanto. Ekologi Hutan [Forest Ecology]; Bumi Aksara: Jakarta, Indonesia, 2008. [Google Scholar]
  69. Aoyagi, R.; Imai, N.; Kitayama, K. Ecological significance of the patches dominated by pioneer trees for the regeneration of dipterocarps in a Bornean logged-over secondary forest. For. Ecol. Manag. 2013, 289, 378–384. [Google Scholar] [CrossRef]
  70. Yassir, I. Diversity of plant communities in secondary succession of Imperata grasslands in Samboja Lestari, East Kalimantan, Indonesia. Indones. J. For. Res. 2014, 1, 139–149. [Google Scholar] [CrossRef] [Green Version]
  71. Freeman, C. The impact of treefall gaps on the species richness of invasive plants. J. Young Investig. 2015, 28, 1. [Google Scholar]
  72. Waheed, M.; Haq, S.M.; Fatima, K.; Arshad, F.; Bussmann, R.W.; Masood, F.R.; Alataway, A.; Dewidar, A.Z.; Almutairi, K.F.; Elansary, H.O.; et al. Ecological Distribution Patterns and Indicator Species Analysis of Climber Plants in Changa Manga Forest Plantation. Diversity 2022, 14, 988. [Google Scholar] [CrossRef]
  73. EOS Data Analytics. Type of Soil in Agriculture to Grow Crops Efficiency. Available online: https://eos.com/blog/types-of-soil/ (accessed on 19 July 2023).
  74. Janzen, H.H. The soil carbon dilemma: Shall we hoard it or use it? Soil Biol. Biochem. 2006, 38, 419–424. [Google Scholar] [CrossRef]
  75. Pereira, H.; Navarro, L.; Martins, I. Global biodiversity change: The bad, the good, and the unknown. Annu. Rev. Environ. Resour. 2012, 37, 25–50. [Google Scholar] [CrossRef] [Green Version]
  76. Gu, C.; Mu, X.; Gao, P.; Zhao, G.; Sun, W.; Tatarko, J.; Tan, X. Influence of vegetation restoration on soil physical properties in the Loess Plateau, China. J. Soils Sediments 2019, 19, 716–728. [Google Scholar] [CrossRef]
  77. Labrière, N.; Locatelli, B.; Laumonier, Y.; Freycon, V.; Bernoux, M. Soil erosion in the humid tropics: A systematic quantitative review. Agric. Ecosyst. Environ. 2015, 203, 127–139. [Google Scholar] [CrossRef]
  78. Zhang, C.; Liu, G.; Xue, S.; Sun, C. Soil organic carbon and total nitrogen storage as affected by land use in a small watershed of the Loess Plateau, China. Eur. J. Soil Biol. 2013, 54, 16–24. [Google Scholar] [CrossRef]
  79. Hu, P.L.; Liu, S.J.; Ye, Y.Y.; Zhang, W.; Wang, K.L.; Su, Y.R. Effects of environmental factors on soil organic carbon under natural or managed vegetation restoration. Land Degrad. Dev. 2018, 29, 387–397. [Google Scholar] [CrossRef]
  80. Chengrui, M.; Dregne, H.E. Review article: Silt and the future development of China’s Yellow River. Geogr. J. 2001, 167, 7–22. [Google Scholar] [CrossRef]
  81. Roose, E.J.R.; Lal, C.; Feller, B.; Barthes; Stewart, B.A. Advances in Soil Science: Soil Erosion and Carbon Dynamics; CRC Press, Taylor & Francis Group, LLC.: Boca Raton, FL, USA, 2006; Volume 352, p. 88. [Google Scholar]
  82. Wang, Y.; Fu, B.; Lü, Y.; Chen, L. Effects of vegetation restoration on soil organic carbon sequestration at multiple scales in semi-arid Loess Plateau, China. Catena 2011, 85, 58–66. [Google Scholar] [CrossRef]
  83. Wenjie, L.; Pengju, L.; Hongmei, L.; Weinping, D. Estimation of evaporation rate from soil surface using stable isotopic com-position of throughfall and stream water in a tropical seasonal rain forest of Xishuangbanna, Southwest China. Acta Ecol. Sin. 2016, 26, 1303–1310. [Google Scholar] [CrossRef]
  84. Fan, J.; Ostergaard, K.T.; Guyot, A.; Fujiwara, S.; Lockington, D.A. Estimating groundwater evapotranspiration by a sub-tropical pine plantation using diurnal water table fluctuations: Implication from night-time water use. J. Hydrol. 2016, 542, 679–685. [Google Scholar] [CrossRef] [Green Version]
  85. Liu, Y.; Li, S.; Sun, X.; Yu, X. Variations of forest soil organic carbon and its influencing factors in east China. Ann. For. Sci. 2016, 73, 501–511. [Google Scholar] [CrossRef] [Green Version]
  86. Devi, A.S. Influence of trees and associated variables on soil organic carbon: A review. J. Ecol. Environ. 2021, 45, 5. [Google Scholar] [CrossRef]
  87. Joshi, L.; Wibawa, G.; Vincent, G.; Boutin, D.; Akiefnawati, R.; Manurung, G.; Van-Noordwijk, M.; Williams, S. Jungle Rubber; World Agroforestry Center: Bogor, Indonesia, 2002. [Google Scholar]
Figure 1. Protected forest of Kulon Progo Community Forestry. Stand type and abbreviations: PN = Pinus stand, AS = Aleurites-Swietenia stand, SA = Swietenia-Accacia stand, MA = Meulaleuca-Swietenia stand, TD = Tectona-Dalbergia stand. Red rectangle is the research location.
Diversity 15 00900 g001
Figure 2. Plot-level understory herb-layer species characteristics; (a) Margalef richness index (ANOVA, df 4, p-value 0.293); (b) Shannon diversity index (ANOVA, df 4, p-value 0.985); (c) number of shade-tolerant species (ANOVA, df 4, p-value 0.003); (d) number of shade-intolerant species (ANOVA, df 4, p-value 0.005); (e) number of seedlings (Kruskal–Wallis, df 4, p-value 0.007); (f) number of individual seedlings (Kruskal–Wallis, df 4, p-value 0.324). Different letters (a, b, c) demonstrate significant differences between plot groups (p-value < 0.05).
Diversity 15 00900 g002
Figure 3. Canonical correspondence analysis (CCA); (a) ordination of 32 selected plots and environmental factors; and (b) ordination of 72 species and environmental factors. Ed-SOC = soil organic carbon, Veg-CC = canopy coverage, Ed-Silt = silt proportion in soil texture, and Ant-BsU = below-stand utilization. Number 1 to 72 reflect the total of 72 species. Details of the species from no. 1 to 72 are listed in Appendix A, Table A1. Factors with weak or no correlation are not shown.
Diversity 15 00900 g003
Table 1. Average values of tree vegetation characteristics and associated environmental conditions in the five stand types of the protected forest of Kulon Progo Community Forestry [32].
ItemsPNASSAMATDNote
  • Tree vegetation characteristics:
-
Most dominant species
PMAM, SMAA, SMML, AADL, TG
-
∑ of tree species
86151010
-
Diversity index
0.48 a0.54 b1.11 b1.07 b0.75 b**
-
Basal area
27.61 a17.56 a15.94 a19.91 a23.55 a*
-
Density
375 a204 b232 b15 b211 b*
-
Canopy height
28.14 a19.29 b21.29 ab21 ab27.14 a*
-
Canopy coverage
68.43 a75.5 abc74.29 abc59.71 ab85.43 c**
2.
Environmental factors related to topographic conditions:
-
Altitude (masl)
244 a353 a303 a319 a307 a**
-
Slope (%)
28 a31 a32 a32 a34 a**
-
Bare rock
18 a22 a16 a19 a17**
3.
Environmental factors related to Edaphic conditions:
-
Soil texture (silt)
37.00 a30.04 bc36.65 ab31.35 c35.76 ab**
-
Soil texture (clay)
25.52 a31.26 a22.67 a29.76 a24.77 a**
-
Soil texture (sand)
37.5 a38.7 a40.67 a38.89 a39.46 a**
-
Bulk density (BD)
1.14 a1.15 a1.19 a1.15 a1.18 a*
-
Soil acidity (pH)
6.11 a6.15 a6.17 a6.31 a6.38 a*
-
Soil Organic Carbon (SOC)
1.05 a1.33 ab1.17 ab0.99 a1.72 b*
-
Soil Total Nitrogen (STN)
0.20 a0.2 ab0.26 b0.22 ab0.24 ab*
4.
Environmental factors related to Anthropogenic disturbances:
-
Below-stand utilization
40 a54.29 a39.29 a45 a25.71 b**
-
Distance from road
122 a143.57 a200.71 a236.29 a255.71 a*
-
Distance from the river
125.71 a331.57 b347.29 b384.43 b344.14 b**
Note: Stand types are included. PN = Pinus stand, AS = Aleurites-Swietenia stand, SA = Swietenia-Acacia stand, MA = Melaleuca-Acacia stand and TD = Tectona-Dalbergia stand. Dominant species inclusive of PM = Pinus merkusii, AM = Aleurites molucana, SM = Swietenia macrophylla, ML = Melaleuca leucadendra, AA = Accacia auriculiformis, DL = Dalbergia latifolia and TG = Tectona grandis. Comparison analyses are analysis of variance (*) and Kruskal–Wallis (**). Different letters (a, b, c) indicated significant differences between stand types.
Table 2. Summary statistics of multi-response permutation procedure (MRPP) analysis for understory herb-layer communities.
NoComparison of the Sorensen DistanceTAp-Value
1General Comparison−7.050.190.000
2Pairwise Comparison:
PN vs. AS−1.650.050.066
PN vs. SA−5.730.160.000
PN vs. MA−3.340.080.006
PN vs. TD−5.970.320.001
AS vs. SA−1.470.040.085
AS vs. MA0.440.010.576
AS vs. TD−4.810.220.002
SA vs. MA−0.890.020.162
SA vs. TD−6.130.290.001
MA vs. TD−3.490.170.012
Note: T = separation between groups, A = within-group homogeneity, p = significance level at alpha 0.05, PN = Pinus stand, AS = Aleurites-Swietenia stand, SA = Swietenia-Acacia stand, MA = Melaleuca-Acacia stand and TD = Tectona-Dalbergia stand.
Table 3. Indicator species distinguishing stand types.
Stand TypeSpeciesIvalp ValueTypical
PNSlaginella sp.
Spilanthes paniculata
48.7
71.4
0.005
0.000
Semi-shade-tolerant
Shade-intolerant
ASSwietenia macrophylla46.50.008Shade-tolerant
SACynodon dactylon54.60.003Shade-intolerant
MAAgeratum conyzoides
Lantana camara
Scleira sp.
43.6
31.4
27.1
0.020
0.024
0.000
Shade-intolerant
Shade-intolerant
Shade-intolerant
TDOttochloa nodosa
Andrographis paniculata
Bauhinia sp.
Nephrolepis sp.
Dalbergia latifolia
Gmelina elliptica
60.2
34.4
71.4
42.9
46.5
71.4
0.001
0.006
0.000
0.031
0.045
0.000
Shade-tolerant
Semi-shade-tolerant
Semi-shade-tolerant
Semi-shade-tolerant
Shade-tolerant
Semi-shade-tolerant
Note: PN = Pinus stand, AS = Aleurites-Swietenia stand, SA = Swietenia-Acacia stand, MA = Melaleuca-Acacia stand, TD = Tectona-Dalbergia stand, IVal = indicator value, p = significance of the Montecarlo test at alpha 0.05. Infrequent species (<25% of the indicator value) are omitted, and only statistically significant indicator species are shown. Typical species are determined according to some references [9,11,44,45,46,47].
Table 4. Summary Statistics of Canonical Correspondence Analysis (CCA) between understory herb-layer communities and environmental factors.
Axis 1Axis 2Axis 3
Summary statistic:
Eigenvalues0.4360.3360.281
Variance Explained (%)10.2007.8006.500
Cumulative explained (%)10.20018.00024.500
Pearson correlation0.9250.9000.929
Table 5. Correlation coefficient showing inter-correlation between highlighted influencing factors of understory herb-layer species related to vegetation, topographic, edaphic and anthropogenic factors.
VariablesVeg-H’Veg-BAVeg-DyVeg-CHVeg-CCTop-AltTop-SlopeEd-SiltEd-SandEd-SOCEd-TNAnt-BsUAnt-River
Veg-H’ −0.29 ns−0.147 ns−0.290 ns0.100 ns0.210 ns0.388 *−0.002 ns0.025 ns0.125 ns0.480 **−0.184 ns0.434 **
Veg-BA- 0.602 **0.243 ns0.382 *0.092 ns−0.189 ns0.171 ns−0.380 *0.131 ns0.087 ns−232 ns0.300 ns
Veg-Dy-- 0.329 ns0.265 ns−0.195 ns−420 *0.511 **−0.305 ns0.098 ns−0.053 ns−0.287 ns−0.292 ns
Veg-CH--- 0.125 ns−0.366 *−0.308 ns0.261 ns−0.220 ns0.088 ns−246 ns−561 **−0.268 ns
Veg-CC---- 0.242 ns−0.172 ns0.362 *−0.259 ns0.686 **0.269 ns−436 *0.149 ns
Top-Alt----- 0.479 **−0.142 ns−0.102 ns−0.034 ns0.111 ns0.065 ns0.614 **
Top-slope------ −0.339 *−0.033 ns−0.198 ns0.130 ns0.199 ns0.524 **
Ed-Silt------- −0.033 v0.311 ns0.120 ns−0.330 ns−0.264 ns
Ed-sand-------- −0.065 ns0.140 ns0.282 ns−0.210 ns
Ed-SOC--------- 0.233 ns−0.327 ns−0.22 ns
Ed-TN---------- −0.141 ns0.004 ns
Ant-BsU----------- −0.070 ns
Ant-River------------
Note: Veg-H′ = Tree vegetation related—diversity index, Veg-BA = Tree vegetation related—basal area, Veg-Dy = Tree vegetation related—density, Veg CH = Tree vegetation related—Canopy height, Veg-CC = Tree vegetation related—canopy coverage, Top-Alt = Topographic related—altitude, Top-slopo = Topographic related—slope position, Ed-Silt = Edaphic related—Silt proportion in soil texture, Sand-Silt = Edaphic related—Sand soil texture, Ed-SOC = Edaphic related Soil organic carbon, Ed-TN = Edaphic related—Total nitrogen, Ant-BsU = Anthropogenic related—Below-stand utilization, Ant-River = Distance from river. ns = non-significant, * = significant at alpha 0.05, ** = significant at alpha 0.01. Only factors with a significant relationship to other factors are shown in the Table.
Disclaimer/Publisher’s Note: The statements, opinions and data contained in all publications are solely those of the individual author(s) and contributor(s) and not of MDPI and/or the editor(s). MDPI and/or the editor(s) disclaim responsibility for any injury to people or property resulting from any ideas, methods, instructions or products referred to in the content.

