Article

Influence of Distance from Forest Edges on Spontaneous Vegetation Succession Following Small-Scale Gold Mining in the Southeast Peruvian Amazon

by
Jorge Garate-Quispe
1,2,3,*,
Manuel Velásquez Ramírez
4,
Edwin Becerra-Lira
5,
Sufer Baez-Quispe
1,
Milagro Abril-Surichaqui
6,7,
Liset Rodriguez-Achata
8,
Adenka Muñoz-Ushñahua
5,
Pedro Nascimento Herbay
5,
Yoni Fernandez-Mamani
2,
Gabriel Alarcon-Aguirre
1,
Marx Herrera-Machaca
2,
Litcely Hilares Vargas
5,
Ronald Corvera Gomringer
5 and
Dennis del Castillo Torres
5
1
Departamento Académico de Ingeniería Forestal y Medio Ambiente, Facultad de Ingeniería, Universidad Nacional Amazónica de Madre de Dios, Puerto Maldonado 17001, Peru
2
Ecology & Restoration of Tropical Ecosystems Research Group (ECORET), Universidad Nacional Amazónica de Madre de Dios, Puerto Maldonado 17001, Peru
3
Department of Evolutionary Biology, Ecology and Environmental Sciences, Universitat de Barcelona, 08028 Barcelona, Spain
4
Proyecto Recuperación de Áreas Degradadas, Instituto de Investigaciones de la Amazonía Peruana (IIAP), Puerto Maldonado 17001, Peru
5
Instituto de Investigaciones de la Amazonía Peruana (IIAP), Puerto Maldonado 17001, Peru
6
Science Support Peru S.A.C., Lima 15026, Peru
7
Universidad Peruana Cayetano Heredia (UPCH), Lima 15102, Peru
8
Departamento Académico de Ciencias Básicas, Universidad Nacional Amazónica de Madre de Dios, Puerto Maldonado 17001, Peru
*
Author to whom correspondence should be addressed.
Diversity 2023, 15(6), 793; https://doi.org/10.3390/d15060793
Submission received: 27 April 2023 / Revised: 13 June 2023 / Accepted: 15 June 2023 / Published: 19 June 2023
(This article belongs to the Special Issue Plant Succession and Vegetation Dynamics)

Abstract

:
Few studies describe the factors that influence the natural regeneration in abandoned gold mining areas in the Amazon. Here we focus on the influence of the distance to the forest edge and abandonment time in a spontaneous succession of degraded areas by gold mining in the southeastern Peruvian Amazon. We assessed woody species composition (DBH ≥ 1 cm) and forest stand structure across a chronosequence (2–23 years). A total of 79 species belonging to 30 families were identified. The natural regeneration was dominated by Fabaceae, Malvaceae, and Urticaceae. Together, they represented 60% of the importance index. Cecropia membranacea and Ochroma pyramidale were the dominant pioneer species at the initial successional stage. The basal area and species diversity were directly related to time after abandonment and inversely related to the distance to forest edges. The distance-based redundancy analysis showed that more of the variation in species composition was explained by distance to the forest edge than the abandonment time. Our study revealed that regeneration was relatively slow and provided evidence that the distance to the forest edge is important for natural regeneration in areas degraded by gold mining.

1. Introduction

Mining has been a crucial activity for the world economy and the development of human societies [1,2]. However, mining-related activities cause large-scale disturbance and fragmentation when original habitats are removed, excavated, or buried by the deposition of sterile material [3,4]. Even though mining-related activities take part only in less than 1% of the earth’s land surface [1], they are a major cause of environmental degradation [5,6], serious health issues in local communities [7], and a threat to tropical ecosystems [8].
Amazon rainforests harbor a big part of worldwide terrestrial biodiversity [8]. However, they are being heavily affected by anthropogenic activities and changing environmental conditions [9]. The National Peruvian Forestry and Wild Fauna Entity (also known as SERFOR) confirmed that between 2017 and 2018, deforestation in Peru (128,069 ha/year) increased [10]. Artisanal and small-scale gold mining (ASGM) in Madre de Dios is the main cause of vegetation and soil degradation [2,4]. A common method to restore post-mining areas, in general, is reforestation (restoration or rehabilitation), which includes complex landscape preparation, planting, and maintenance techniques [3]. However, spontaneous succession can, in many cases, lead to the establishment of a functional forest ecosystem in disturbed areas, including post-mining sites [11,12], but it can be limited by the level of degradation [6] in soil quality, both in terms of structure and chemical properties [13,14]. On the other hand, ASGM is still an important part of the local economy in many developing countries [1].
Previous studies have found that naturally recovered areas are commonly more diverse, provide more ecosystem services, and are more robust against disturbances. At the same time, restored forests often are more similar to plantations with few fast-growing species [3,11,12]. However, such cover will depend on the impact level of the perturbation, the type of mining carried out, the available seed sources, and the distance to seed sources. Natural regeneration (passive restoration) is the process in which trees establish from seeds that fall and germinate in situ without anthropic intervention [15,16]. This restoration method does not include any complementary activities to improve restoration [17]. Under these conditions, the establishment and development of natural regeneration are affected by several factors: poor seed dispersal, site morphology, poor soil nutrient availability, drought, and competition between herbaceous or invasive species [4,18].
Natural regeneration has been favored for lands degraded by mining due to its low cost and importance for successional trajectory management [19]. There are several studies that suggest that the distance to forest edges influences the natural regeneration of abandoned pastures. Alarcon-Aguirre et al. [4] reported that nearby forests and fragments that were not affected by gold mining in the Madre de Dios Amazon provided seeds that favored vegetation development (distances between 22 m to 152 m). However, distance to the forest showed an inverse relationship with species abundance, recovery time after abandonment was directly and significantly correlated with the basal area, species richness, and diversity. Günter et al. [20] found a significant influence of distance on the floristic composition of natural regeneration in an Ecuadorian forest, where unique species were replaced by more common ones, with higher prevalence in places that were further away from reference forests [20]. Cubiña and Aide [21] reported that distance from forest edges had an influence on seed rain and soil seed bank in a tropical pasture in Puerto Rico.
In addition, the natural regeneration of degraded areas by mining in tropical forests in Brazil revealed that the number of individuals, species, families, and diversity decreases with greater distance from the remaining forest fragment [3]. Studies have also reported a positive relationship between abandonment time and the increase in abundance and diversity of species [1,6,15,22].
The Amazon forest facilitates the study of plant community formation due to the rapid recovery of diversity and structure of successional communities, even in case of anthropogenic disruption [23]. While successions occur under similar climatic, environmental, and soil conditions, they might differ in abandonment time [24]. Chronosequence studies represent a useful approach to understanding successional dynamics in tropical forests [25] by sampling the natural regeneration of areas of different stages of succession [26]. Chronosequence studies are widely used because they provide results with minimal effort and extend over long periods of time [27,28]. There are several articles related to the secondary succession of tropical forests in areas abandoned by agriculture, livestock, pastures, etc. [18,28,29,30] and on the recovery of vegetation cover after mining in the Brazilian Amazon [6,30,31]. However, studies on natural colonization in areas abandoned by gold mining and the influence of distance from the forest edge on floristic diversity, structure, and composition are particularly rare in the Peruvian Amazon, especially in Madre de Dios, a department known as the “Capital of the Biodiversity of Peru”.
The present study analyzes the influence of the distance to the forest edge and abandonment time on spontaneous succession (natural regeneration) in abandoned gold-mining lands in the southeast of the Peruvian Amazon (Madre de Dios). In this study, we address the speed of regeneration in the early years after mining abandonment and how the rate of natural regeneration in abandoned mining is influenced by abandonment time and distance to the forest edge. This is one of the first studies in the Peruvian Amazon on the influence of the distance to the forest edge, abandonment time, and influence of ecological factors and their interactions on the establishment of species in the spontaneous succession of areas abandoned by the ASGM. The study highlights the importance of understanding the regular plant community in the early stage of secondary forest, and it could be used as a reference point for restoration practices in the Peruvian Amazon, Department of Madre de Dios.

2. Materials and Methods
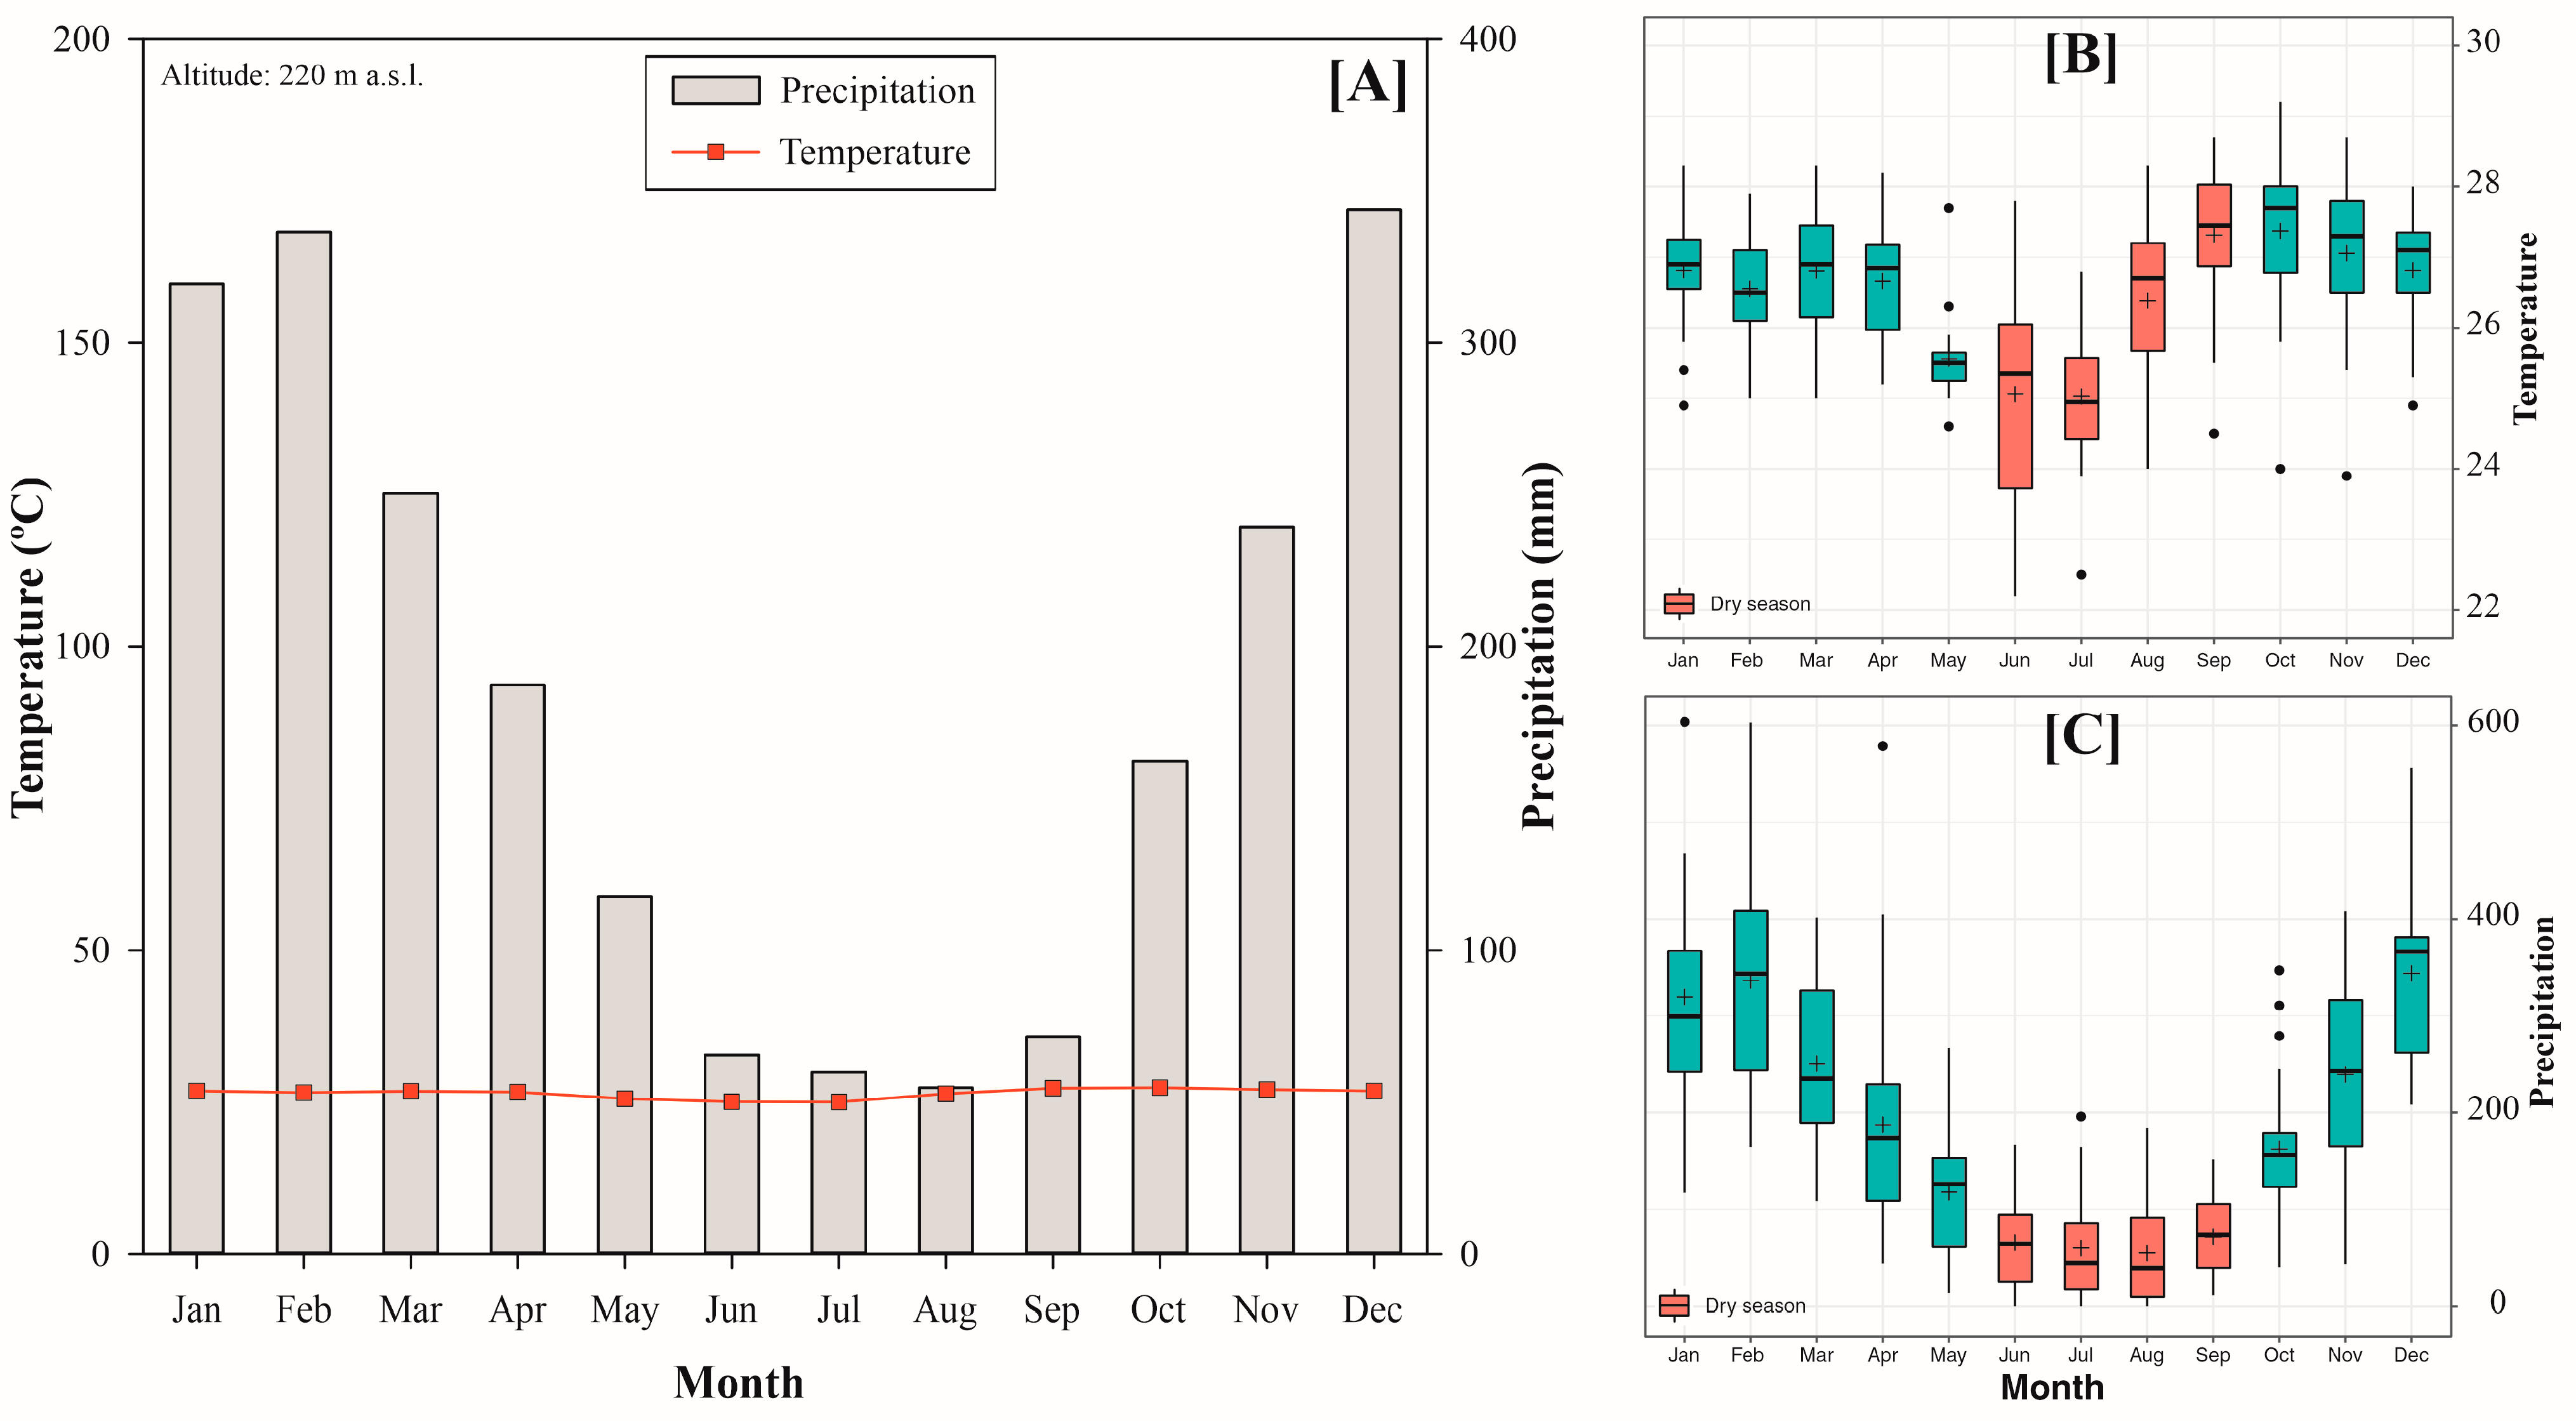
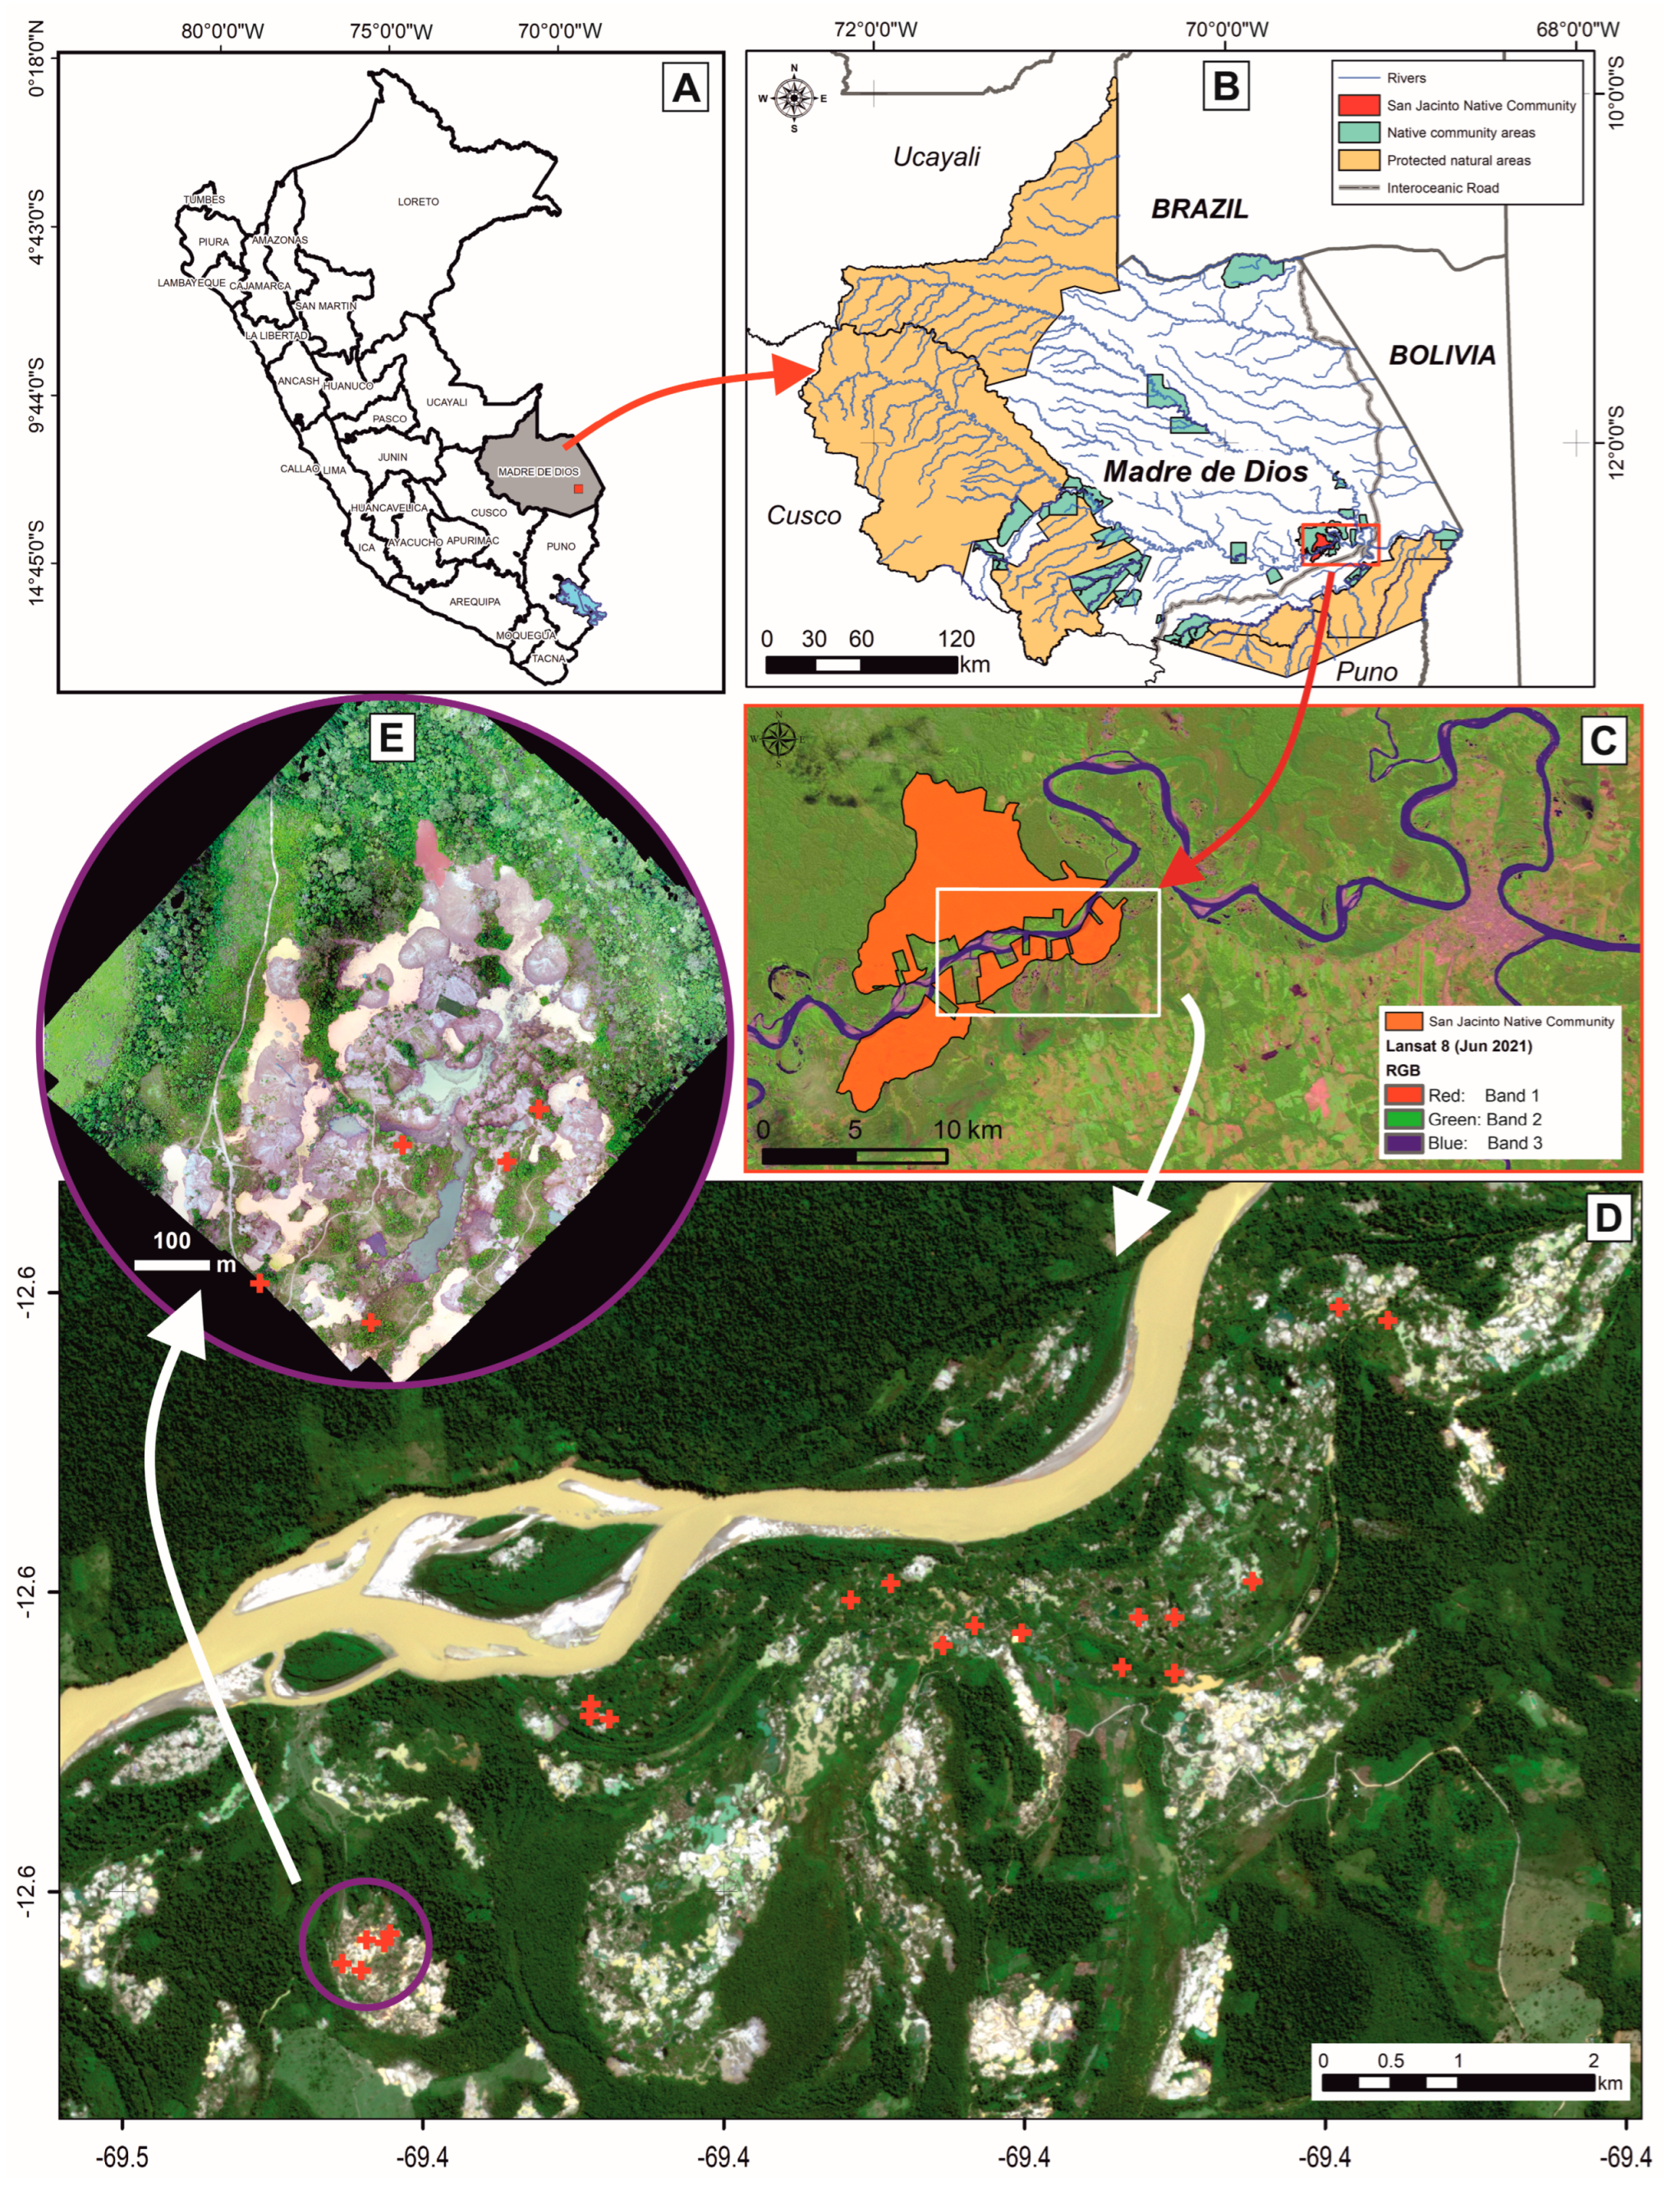
2.1. Study Area

The study took place in abandoned gold mining areas (12°31′34.22″ S and 69°23′45.77″ W) in San Jacinto native community, Madre de Dios department, located 35 km northeast of Puerto Maldonado city, southeastern Peruvian Amazon. Average annual temperature and precipitation (between the years 1980–2022) were 25.4 °C and 2120 mm, respectively. The dry season lasts from June to September, in which precipitation is lower than 100 mm per month (Figure 1).
The study area is a patchwork of abandoned mining areas with different times of abandonment after ASGM (Figure 2). Twenty areas were selected with covered soil of natural regeneration [32] of different abandoned times to establish a 23-year chronosequence which includes initial (<5 years), intermediate (5 to <10 years), and advanced successional stage (≥10 years) [33]. Covered soil, as defined by Velásquez-Ramírez [34], is an impacted area by gold mining and covered ground by natural regeneration with predominant sand particles.
Figure 1. The climatic conditions at the study area (1980–2022), San Jacinto Native Community in the Peruvian Amazon. (A) Vertical bars show the mean monthly sums of precipitation, and the red line shows the monthly average air temperature. (B,C) Box plots of monthly mean temperature and precipitation for the study area (1980–2022).
Diversity 15 00793 g001
Time elapsed from the abandonment of gold extraction, distance to the forest edge, plot locations, and discard areas with re-entries of gold mining activity was determined by using multi-temporal Landsat (1975–2010), RapidEye, and Planet imagery (2010–2021).
The gold deposits in Madre de Dios are classified as secondary deposits or placer deposits because they were formed by the weathering and erosion of hard rock ores in the Andes, which produced fine grains of gold that were then carried down rivers to the lowlands of Madre de Dios. These fine gold particles settle in deposits along the inside of river meanders and have formed near-surface deposits in the floodplains of these rivers over time due to changes in river geomorphology and seasonal inundation [7].
In the study area, to obtain gold, the miners used an open-pit mining process. In such operations, all aboveground vegetation must be cut, and the soil must be completely removed. Then, during dredging operations, gold-containing soils are pumped from the deep pits (up to 10 m deep) to a sluice box, which collects gold particles. In the San Jacinto Native Community, the small area mines have an aggregated spatial pattern (15 to 20 ha of area). This high density of small mines causes a vast amount of deforestation and forest fragmentation [35]. Mining impacts the natural dynamics of vegetation and soil degradation, transforming the landscape into disturbed material without well-developed soil horizons and stony substrates that limit the rate and form of natural recolonization of abandoned sites by plants and soil biota [2,4]. The mines in the San Jacinto Native Community are generally abandoned after exploitation, and no restoration or rehabilitation actions are applied.
Prior to mining activities in the study area, the San Jacinto Native Community area consisted of low-terrace rainforest. The canopy reached a height of 30–35 m above the forest floor, with some emergent trees reaching up to 45 m. These forests represented common low-terrace forest types in the Amazonia of Madre de Dios, which are dominated by Bertholletia excelsa, Pseudolmedia laevis, Iriartea deltoidea, Poulsenia armata, Quararibea wittii, Astrocaryum murumuru and Euterpe precatoria.

2.2. Sampling and Vegetation Structure

Vegetation was sampled in 20 plots, each 10 m × 25 m. All individuals with a diameter at breast height (DBH) bigger than 1 cm were inventoried. Total height (TH) and DBH were measured for each individual. Botanical material was collected and stored for identification in the Alwyn Gentry herbarium (HAG) of Amazon National University of Madre de Dios.
Woody vegetation was classified according to the state of development of the individuals [36], considering the diameter, seedling (1 cm to <5 cm DBH), sapling (5 cm to <10 cm DBH), and trees (>10 cm DBH). Scientific names were revised and corrected using the TNRS application (https://tnrs.biendata.org).
The structural and vertical characteristics of vegetation were categorized according to diameter classes (5 cm range), and then average height was obtained for each diameter class. This characterization was carried out for each of the four categories of abandonment time.

2.3. Species Importance and Diversity Index

The Importance Index (IIE), a simplified version of the Importance Value Index, was calculated as the sum of relative dominance and relative abundance [37]. The importance value index is a measure of how dominant a species is at a growth level [38].
Abun ( % ) = Number   of   individuals   belong   to   one   species Total   number   of   individuals   × 100
Dom % = Basal   area   belong   to   one   species Basal   area   of   all   species × 100
IIE = Abun ( % ) + Dom ( % )
where IIE is the Importance Index, Abun (%) is the relative abundance, and Dom (%) is the relative dominance.
Floristic attributes for each plot were analyzed considering the richness of species and richness of genera and families. In order to characterize and compare the biodiversity of our samples, Shannon-Weaver (Equation (4)), Margalef (Equation (5)), and α-Fisher (Equation (6)) diversity indices were calculated. Calculations were performed using the Paleontological Statistics v4.11 Statistical package.
Shannon   index = i n i n ln n i n
Margalef s   richness   index = S 1 ln ( n )
S = α ln 1 + n α
where n is the total number of individuals, ni is the number of individuals of species i, S is the number of species, and α is Fisher’s alpha.
The species accumulation curve was generated considering the species richness values in the evaluated plots. Likewise, tree species richness established after natural regeneration was extrapolated for up to 100 plots using the program EstimateS 9.1 [39].

2.4. Response of the Species to the Time of Abandonment and Distance to the Forest Edge

Huisman-Olff-Fresco (HOF) models were used to analyze the influence of abandonment time and distance to the forest edge in species establishment [40]. These models provided a hierarchical set of five models based on the increasing complexity of biological information [41,42]. According to Huisman et al. [41], models are classified as: Model I, no significant trend in space or time; Model II, an increasing or decreasing trend where the maximum is equal to the upper bound M; Model III: an increasing or decreasing trend where the maximum is below the upper bound M; Model IV: increase and decrease by the same rate: symmetrical response curve; Model V: increase and decrease by different rates: skewed data. Only the HOF response curves of the species that were found in more than 50% of the evaluated plots were modeled.

2.5. Data Analysis

Average basal area, abundance, species richness, and vegetation diversity were evaluated according to abandonment time category with the Student–Newman–Keuls post-hoc test (SNK).
To analyze the relationship between abandonment time and distance to the forest edge on the floristic attributes of natural regeneration, correlation analysis, and multiple linear regression were performed. The Spearman’s rank correlation coefficient was used because the parametric assumptions were not met. Regarding the multiple linear regression analysis, the floristic diversity attributes were considered as response variables, and the distance to the forest edge and the abandonment time of the plots as predictor variables. Prior to the analysis, the square root transformation was performed for each of the variables to comply with the parametric assumptions. The hierarchical partition of the variance was performed using the hier.part package in R [43] to analyze the importance of each predictor in the response variable of the multiple regression analysis.
To evaluate and represent the floristic affinity between the evaluated plots, the non-metric multidimensional scaling (nMDS) analysis was used, and stress was used as a quantitative measure of the nMDS ordination fit [44]. To identify the grouping of plots based on their floristic composition, a Similarity Profile Analysis (SIMPROF) was carried out. These analyzes were performed in Primer v7 statistical package.
To analyze the influence of the distance to the forest edge and the abandonment time on the floristic composition, the Distance-based Redundancy Analysis (dbRDA), based on the Bray–Curtis distance, was performed. Species abundance transformed matrix was used considering the square root transformation and excluding the species that were only present in three plots. To determine the individual effect of the predictor variables (distance to the forest edge and abandonment time), the variance was partitioned using the “rdacca.hp” package [45].
Finally, the analyses mentioned before were all performed at a significance level of 5% for type 1 errors. The figures were generated using the R statistical packages in the R-Studio environment [43], SigmaPlot 15 (Inpixon Inc., Palo Alto, CA, USA), and Primer Permanova+ v7 (PRIMER-E Ltd., Auckland, New Zealand).

3. Results

3.1. Structure, Diversity, and Floristic Composition

The abandonment time of the evaluated plots varied between 2 and 23 years, and the distance to the forest edge ranged between 35 and 560 m (Table 1). In the 20 evaluated plots, 931 individuals were recorded, distributed in 79 species and 30 families. Species richness per plot ranged from 4 to 23, while abundance per plot ranged from 12 to 73. Species richness and diversity indices (Shannon, Margalef, and α-Fisher) were higher in plots with longer abandonment time and less distance to the forest edge.
Families with the highest species richness were Fabaceae (20), Malvaceae (8), and Moraceae (6). Fabaceae, Malvaceae, and Urticaceae presented the highest values of the importance index (>18%), and they represented 49% of the abundance and 70% of the total relative dominance of the individuals found. On the other hand, Asteraceae had the highest number of individuals (17.72% of the total) but represented a very low dominance (2.6%) (Table 2). Regarding the relation to the time of abandonment and distance to the forest edge, plots showed variable results. The majority (75%) of the plots belonged to 10 years of abandonment time (Table 1).
Figure 3 shows the comparison of the species accumulation curve produced by the analytical formula and extrapolation by randomizing the samples with estimates. At least 90% of naturally regenerating species had been sampled in the study area, as shown in the accumulation curve (Figure 3).
A higher density of individuals was found in the lower diameter category (DBH < 5 cm), independent of the abandonment time. Towards higher diameter categories, a decreasing trend appeared in relation to the density, showing an inverted-J distribution pattern in the chronosequence (Figure 4). On the other hand, the proportion of individuals in the <5 cm DBH category decreased throughout the chronosequence, from 79.6% in plots with 1–5 years of abandonment to 64.8% in those with more than 10 years of abandonment. This decrease is paired with an increase in the proportion of individuals (between 4.5% to 5%) in the diameter categories between 5–20 cm. Regarding the total height, a gradual increase was found according to diameter categories (Figure 4), and the tallest individuals were found in the plots with the longest abandonment time (Figure 4D).

3.2. Species according to Abandonment Time Categories

In areas with shorter abandonment time (1–5 years), a greater abundance and dominance of pioneer species were observed, such as Ochroma pyramidale and Cecropia membranacea. The longer the abandonment time, the greater presence of early succession species was observed. In the period of 5–10 years of abandonment, species of Ficus and Alchornea were found. In the plots with more than 10 years of abandonment, several species of the genera Inga, Croton, and Ficus were found (Figure 5).

3.3. Species Occurrence according to the Gradient of Distance to the Forest Edge and Abandonment Time

Figure 6 and Figure 7 show the HOF response curves of the 12 most frequent species found in the study area, where it is apparent that the other remaining species do not intensively colonize degraded areas. In most species modeled (Cecropia membranacea, Ochroma pyramidale, Piper aduncum, Lantana camara, Psidium guajava, Vernonanthura patens, Apeiba tibourbou y Vismia gracilis), HOF response curves were obtained. Different trends were found depending on the variable analyzed (abandonment time and distance to the forest edge) (Figure 6 and Figure 7). Thus, C. membranacea and O. pyramidale showed a biased response along the gradient of distance to the forest edge. Both species increased in abundance up to distances between 100–200 m and then decreased along the gradient. However, the response of these two species was different in relation to abandonment time. A decreasing trend in abundance was found for C. membranacea. Meanwhile, for O. pyramidale, it was relatively abundant in most of the plots in the abandonment time gradient. Moreover, P. aduncum, L. camara, and A. tibourbou abundance showed a tendency to decrease with greater distance from the forest edge but increased with the longer abandonment time gradient.

3.4. Time and Distance Relationship

Variability was found in the plots according to abandonment time and distance to the forest edge. According to categories of abandonment time, a significant increase (ANOVA, p-value < 0.05) was found in the species richness, diversity, and basal area of the vegetation in the degraded areas evaluated throughout the chronosequence; however, this pattern varied according to floristic attribute (Figure 8).
Abandonment time was found to be directly related to the basal area, richness, and species diversity (rho > 0.3; p-value < 0.05). On the other hand, distance to the forest edge was inversely related to the same vegetation attributes (rho < −0.4; p-value < 0.05). This suggests that plots with a longer period of abandonment have greater development of natural regeneration and that the plots closest to the reference forest have a greater recovery of the vegetation cover (Table 3A).
However, the observed pattern changes slightly when we analyze the relationships between the floristic attributes with the distance of the forest edge and abandonment time according to size categories (seedling, sapling, and tree) of the evaluated individuals. The diversity of seedling species was inversely and significantly related to the distance to the forest edge. At the same time, the lowest and non-significant correlation was found between the time of abandonment and the abundance of the same category (Table 3B). Regarding the tree category, a significant relationship between abandonment time and the number of individuals was found (rho = 0.55 p-value < 0.05) (Table 3D).
Significant multiple time-distance regressions were fitted for basal area, species richness, number of individuals, and diversity indices (Shannon, Margalef, and α-Fisher). Most of the floristic attributes showed a direct relationship (partial correlation) with the abandonment time and an inverse relationship with the distance to the forest edge (Table 4). Models for species richness and abundance were the ones with higher adjusted R-squared values (R2 > 0.6). That is, more than 60% of the variability in species richness and abundance could be explained by the abandonment time and the distance to the forest edge. In variance partitioning of the independent effects, we found that distance to the forest edge contributes more to the variance of species richness and abundance than the abandonment time. Nevertheless, the difference in the individual effect was the highest in abundance (Table 4).

3.5. Ordination Analysis of Floristic Composition

The non-metric multidimensional scaling (nMDS) analysis diagram showed reduced-dimensional representations of the plots evaluated according to their floristic composition (Figure 9). These representations vary according to the matrix of the abundance used, either considering all registered individuals (Figure 9A) or according to size categories: seedlings (Figure 9B), saplings (Figure 9C), and trees (Figure 9D). Stress found in all the representations was acceptable (<0.20) [44]. Regarding the nMDS of all the individuals and in the seedlings category, a distribution gradient of the plots was found according to the distance to the forest edge. Taking into consideration all the individuals (Figure 9A), low values in the nMDS2 axis are related to plots with a greater distance from the forest edge. On the other hand, in the seedlings category, high values of the nMDS2 axis were found for the plots with a greater distance from the forest edge (Figure 9B).

3.6. Abandonment Time and Distance to the Forest Edge in the Structuring of Plant Communities

The distance-based redundancy analysis (dbRDA) showed that the adjusted model, with abandonment time and distance to the forest edge, significantly explained variation in the floristic composition of the communities (adj-R2 = 0.15, p-value = 0.002). By partitioning the variance, it was found that distance to the forest edge (p-value = 0.001) and abandonment time (p-value = 0.013) significantly influence the floristic composition. However, distance to the forest edge had a greater individual effect than the abandonment time, 11.9% compared to 5.6% of the total variation of the communities (Figure 10).

4. Discussion

Recovery of tropical forests after the removal of vegetation cover varies between regions and depends on local conditions [30,48]. Variability can also be influenced by a series of possible environmental and ecological factors [2,49,50]. It is known that in areas severely degraded by mining, the heterogeneity of the habitats generated and a long distance from a propagule source are the main factors affecting the dispersal and establishment of vegetation [27,51]. In this study, we found differences in structure, abundance, species diversity, and floristic composition of spontaneous vegetation according to abandonment time and distance to the reference forest edge in areas abandoned by mining activity in the San Jacinto native community, Peruvian Amazonia. Our analysis showed that the influence of distance to the forest edge was significantly higher (p-value = 0.001) than abandonment time (p-value = 0.013) on the variation of floristic attributes and composition of the vegetation.

4.1. Species according to Abandonment Time Category

In terms of species richness, tropical forests are highly resilient to disturbances, p.e. Rozendaal et al. [52] found that tree species richness increased very rapidly during secondary succession, with 80% recovery of old-growth values after only 20 years. The values of richness and diversity of species found from natural regeneration in the study areas are much lower than the averages reported in neotropical secondary forests [52] and in the forests of Madre de Dios [46]. For example, on average, the richness and diversity of α-Fisher were found to represent only 15% and 12%, respectively, of the average values in the natural forests of Madre de Dios (Table 1). In comparison with early secondary forests in the Amazon (5 years after abandonment) [47], our study revealed that the natural regeneration following the abandonment of gold mining activities was rather slow. On average, the species richness found in the present study represents only 30% of the average values in early secondary forests in the Amazon [47] (Table 1). This low species richness in the early secondary succession is due to the fact that the first colonizers of abandoned areas are pioneer and herbaceous plants [18]. However, our values of richness and diversity are higher than those reported in a study of natural regeneration in reforested areas of 20 years of abandonment due to mining activity in Madre de Dios [53].
According to the results of the HOF response curves, C. membranacea and O. pyramidale clearly dominate these successional forests in plots severely degraded by mining activity. The greater abundance and dominance of pioneer tree species (for example, species of the genus Cecropia, Ochroma, and Vernonanthura) in plots with shorter abandonment times (1–5 years) would facilitate the recruitment of old-growth specialists that become dominant in late stages of succession [4,30]. Since they can accumulate organic matter in the soil and improve its structure, creating microsites, reducing runoff, attracting dispersers, and promoting the colonization of species, they can function as nurse plants [49,54].
The diameter distribution pattern showed changes throughout the different abandonment times. The highest density was found in the first diameter class (<5 cm), with a strong decrease in the following classes. This inverted J pattern suggests a good recruitment potential [55], and it is typical in primary forests [56], secondary succession forests [33], and reforested areas in the Amazon [53,57]. The average height values according to diameter class followed the pattern expected for a successional chronosequence, that is, an increase in the average height of the largest diameter classes in areas with a longer abandonment time [33].

4.2. Abandonment Time and Distance to the Forest Edge

The abundance, richness, and diversity of natural regeneration were inversely correlated with distance to the forest edge, as reported by previous studies [50,53,58]. This would suggest that closer proximity to the remaining reference forest could accelerate the recovery of the vegetation [15]. Because the recovery of biodiversity in tropical forests depends on the recruitment of native species and their accumulation over time [59], the fragmentation of Amazonian forests significantly changes the abundance and richness of species, mainly at distances of less than 500 m [60]. However, our results showed different responses between floristic attributes and distance to the forest edge in a recent study of lands degraded by gold mining in Madre de Dios. Alarcón-Aguirre et al. [4] found no significant inverse relationship between distance to the forest edge with abundance, species richness, and basal area. This difference in the results could be explained by the high degree of landscape fragmentation in our study, compared to Alarcón-Aguirre et al. [4].
The structure and diversity of secondary forests can be recovered over time [22,29]. In this study, we found that species richness increased throughout chronosequence, a typical pattern in successional forests [59,61]. The increase of diversity in natural regeneration would be associated with the probability of the coexistence of fast-growing pioneer species that would favor the establishment of shade-tolerant species throughout the succession [30]. Abundance, species richness, and diversity of tree vegetation are directly related to abandonment time and inversely related to distance to the forest edge. A slower recovery of natural regeneration was evidenced for plots distant from the forest edges. This can be explained by the remoteness of the remaining forest due to the high degree of fragmentation and landscape degradation, reduced seed input, and the potential for natural seed dispersal from nearby remaining habitats [20,21,27]. Mi et al. [23] and Mesquita et al. [9] found significant interactions between disturbance regimes and distance from habitat conditions on floristic composition for most of the sites studied. According to Mi et al. [23] and Mesquita et al. [9], the explanation is that stochastic processes dominate forest succession in post-disturbance restoration areas in tropical forests.
Regarding the natural regeneration of forests, although it increases biomass and biodiversity, it has an uncertain path for recovery because it depends on the specific impact generated in the past on these areas [62]. Therefore, the passive restoration of the evaluated areas would be ineffective due to the forest fragmentation [63] and the landscape and ecological conditions of the study area [15], as they could limit the supply of seeds. Slower natural regeneration hinders the process of ecological succession and the recovery of the forests [2]. However, when the distance to the remaining forest edges is not too great, natural regeneration, which is a passive restoration, could be considered a valuable option for biodiversity restoration [20]. Moreover, in late succession, seed sources and their dispersal are the most important biotic factors as they are more limited by distance [49]. In addition, passive restoration is considered a cost-effective restoration strategy in comparison with active restoration [22]. However, passive restoration is a slow process, and it may take decades or longer to achieve desired ecosystem functions or species compositions without active restoration [64]. Previous studies in areas degraded by mining in Madre de Dios have reported that the initial cost of reforestation ranged between 3464 and 9250 US$ ha−1 [53,65]. Because of the high degree of fragmentation and landscape degradation, active restoration should be considered for the recovery of degraded areas [63] by gold mining in the study area.
Even though various studies show, that abandonment time explains the greatest variability in the recovery of vegetation communities in a secondary succession [9,22,26,29,30]. Our study shows that the distance to the forest edge has more influence on the abundance, species diversity, and composition of tree communities after abandonment by mining activities. A low variance explanation of abandonment time in the recovery of the vegetation was demonstrated by previous studies [29,47]. An explanation would be that the recovery rate of the diversity and composition of secondary forest species are determined by a complex interaction of specific local and historical factors and landscape structure [22,29].

4.3. Abandonment Time and Distance to the Forest Edge in the Structuring of Forest Communities

In the nMDS, we found a gradient in the floristic similarity between the evaluated plots with respect to abandonment time, mainly in all the individuals (DBH > 1 cm). In the dbRDA, we found that the distance to the forest edge had a greater influence on floristic similarity than the time of abandonment. In addition, we found a greater Bray–Curtis similarity between plots near the edge of the forest (47% ± 0.1) than between the plots furthest away (13.3% ± 14.9). A heterogeneity was revealed in the floristic composition of the vegetation that was established in these areas abandoned by mining activity. The reason is that distance to the forest edge causes a significant effect on forest communities that are established under these conditions [3,22], and it could take centuries for their species composition to reach the levels of a reference forest [30]. Moreover, in most cases where the recovery of vegetation cover depends on the structure and spatial distribution of primary forests, it would directly affect the diversity of tree species [64]. On the other hand, Goosem et al. [48] found an influence of fragmentation on species richness and composition, where a low level of dispersion is related to limited reference forest seed dispersers [50], mainly birds in the case of large fruits [31]. This was demonstrated by an experimental study in Costa Rica, in which fragmentation strongly affected the presence of forest-dependent birds, the abundance of late-successional seedling recruitment, and species richness in forest restoration plantations [50].
Several studies found a strong impact of the distance to the forest edges on seed rain, which would justify the patterns of diversity and floristic composition found in our study [3,15]. In addition, Nolasco et al. [58] found that abandonment time in successional forests in the northern Brazilian Amazon is one of the variables that best explain the variation in floristic composition, contrary to what was reported in the present study. These differences might be explained due to higher fragmentation in our study area. In contrast, in the study of Nolasco et al. [58], dispersal by distance was less significant because successional forests are dispersed within a continuous forest matrix. Therefore, proximity to forest fragments is crucial for the success of restoration because it can increase the success of restoration and reduce costs [59].

4.4. Natural Regeneration Outlook for Forest Recovery

Our study provides evidence of natural regeneration in areas degraded by ASGM, as well as proof that passive restoration is not an adequate tool for the recovery of vegetation cover in highly fragmented landscapes. Thus, 79 species and 30 botanical families were identified with abandonment time after mining activity that varies between 2 and 23 years. Since the natural regeneration of woody vegetation is very slow, passive restoration should not be considered as an alternative to the recovery of degraded areas in Madre de Dios [2]. Among the main reasons for the slowness of natural recolonization would be the remoteness of existing forest fragments combined with reduced seed input caused by a high level of fragmentation. In general, 95% of some studies about biodiversity stated a direct relationship between diversity and ecosystem functioning, that only 20–50% of species are needed to maintain most biogeochemical ecosystem processes [66]. In this way, we found that a greater floristic composition (greater biodiversity) would allow directing the environmental recovery of natural regeneration towards the restoration of ecological processes. We also found that there are key species that would allow the maintenance of ecological processes, as would be the case of an assisted restoration with P. aduncum, L. camara, and A. tibourbou. This would improve the ecological integrity (complexity of biological assemblages, including species composition and representation of all functional groups) needed for restoration [67]. It is important to acknowledge the processes and factors that influence natural regeneration since an inadequate restoration plan can cause negative impacts on the process, such as the establishment of invasive species or alterations in successional trajectories [15,68].
Studies of recovery of areas degraded by gold mining, whether by anthropogenic action or spontaneously, have practical implications for subsequent management depending on the type of mining (small and semi-mechanized), the level of fragmentation of the landscape, soil quality, rivers, and residual water disposal from mining (seasonal flooding). These implications were confirmed in the study where unassisted succession processes can lead to the establishment of woody vegetation with greater or lesser demand of time. These results could be further supported by soil quality data through the physical-chemical analysis of the study. Finally, the results lay the groundwork for further studies that should consider the evaluation of natural vegetation dynamics in areas degraded by gold mining and be compared with processes assisted by the level of disturbance from gold mining.

4.5. Limitations and Future Research Directions

This study has certain limitations. First, the study focused solely on degraded areas in a native community of Madre de Dios, which affects the generalizability of the results. The sector or type of mining activity was not considered. Therefore, more studies are needed at a regional level to enhance the findings of the study. Second, the current study used a chronosequence approach (cross-sectional data), and future studies need to be longitudinal to confirm the recovery of the vegetation over time. In addition to these limitations, future studies can incorporate the other variables that may affect the establishment of natural regeneration in areas degraded by mining activity in Madre de Dios, i.e., functional traits, level of landscape fragmentation, soil invertebrates, soil quality, measuring wood density and rivers (seasonal flooding) should be considered. Despite these limitations, this study provides new insights for a deeper understanding of natural regeneration in areas degraded by ASGM in the Peruvian Amazon.

5. Conclusions

A strong dominance of pioneer species was found in plots with less abandonment time in the areas affected by the mining of the native community of San Jacinto in comparison to plots with longer abandonment times. Our study revealed that the natural regeneration following the abandonment of gold mining activities was rather slow. The recovery of natural regeneration is significantly correlated with the time of abandonment and the distance to the reference forest. Based on our results and due to the high degree of fragmentation of the study area by mining activity, we suggest that passive restoration is not an alternative for the recovery of these degraded areas. Tree species such as O. pyramidale and species of the genera Ficus, Cecropia, and Inga are key. All of them could allow an active process of integral ecological restoration in case an assisted restoration takes place in more than 90,000 ha degraded by ASMG in Madre de Dios [35].

Author Contributions

Conceptualization, J.G.-Q., M.V.R. and D.d.C.T.; methodology, J.G.-Q., M.V.R. and S.B.-Q.; validation, E.B.-L. and L.H.V.; formal analysis, J.G.-Q. and Y.F.-M.; investigation, J.G.-Q., E.B.-L., S.B.-Q., Y.F.-M. and M.H.-M.; writing—original draft preparation, J.G.-Q.; writing—review and editing, M.V.R., M.A.-S., L.R.-A., P.N.H., L.H.V., R.C.G., G.A.-A. and D.d.C.T.; visualization, M.V.R., G.A.-A. and M.A.-S.; resources, S.B.-Q., P.N.H. and R.C.G.; data curation, A.M.-U. and M.H.-M.; funding acquisition, M.V.R. and. D.d.C.T.; project administration, R.C.G. All authors have read and agreed to the published version of the manuscript.

Funding

This research was funded by Consejo Nacional de Ciencia y Tecnología (CONCYTEC) and Fondo Nacional de Desarrollo Científico y Tecnológico (FONDECYT), grant number CONTRATO-LORETO-IIAP-122-2018-FONDECYT-BM-E041.

Institutional Review Board Statement

Not applicable.

Data Availability Statement

The data presented in this study are available on request from the corresponding author.

Acknowledgments

This study is made possible by funding provided by the Consejo Nacional de Ciencia y Tecnología (CONCYTEC) and Fondo Nacional de Desarrollo Científico y Tecnológico (FONDECYT) (Proyecto CONTRATO—LORETO-IIAP-122-2018-FONDECYT-BM- E041), the Peruvian National Protected Areas Service (Servicio Nacional de Áreas Naturales Protegidas—SERNANP), KU Leuven University in Belgium, under the terms of cooperative scientific agreement with the Peruvian Amazon Research Institute (Instituto de Investigaciones de la Amazonía Peruana—IIAP). Additional funding was provided by the NGO Solidaridad Network South America through its “Responsible Gold in Madre de Dios” project, Franco Arista, the project leader, and his collaborators William Moreno, Jhonatan Jaramillo, and Diana Wu; and the Vice-Rectorate for Research of the Universidad Nacional Amazónica de Madre de Dios. This research is dedicated to the Community of Fortuna and the Native Community of San Jacinto. The community in Peru might use this research as a tool to manage their land restoration. We are grateful for the support of specialists from the Research Institute of the Peruvian Amazon (IIAP), Biodiversity International, Centro de Innovación Científica Amazónica (CINCIA), Universidad Nacional Amazónica de Madre de Dios (UNAMAD), Universidad Nacional de Piura (UNP) and the National Agrarian University La Molina (UNALM). We would also like to thank Foster Brown for checking the English version of the manuscript.

Conflicts of Interest

The authors declare no conflict of interest.

References

  1. Cherlet, M.; Hutchinson, C.; Reynolds, J.; Hill, J.; Sommer, S.; von Maltitz, G. World Atlas of Desertification, Mapping Land Degradation and Sustainable Land Management Opportunities, 3rd ed.; Publication Office of the European Union: Luxembourg, 2018. [Google Scholar]
  2. Timsina, S.; Hardy, N.G.; Woodbury, D.J.; Ashton, M.S.; Cook-Patton, S.C.; Pasternack, R.; Martin, M.P. Tropical surface gold mining: A review of ecological impacts and restoration strategies. Land Degrad. Dev. 2022, 33, 3661–3674. [Google Scholar] [CrossRef]
  3. Reitschmiedová, E.; Dvorščík, P.; Mudrák, O.; Šimáňová, D.; Frouz, J. Differences in colonization strategies of three common pioneer woody species in post mining heaps. J. Environ. Manag. 2022, 319, 115668. [Google Scholar] [CrossRef]
  4. Alarcón-Aguirre, G.; Sajami Quispe, E.; Vásquez Zavaleta, T.; Ponce Tejada, L.V.; Ramos Enciso, D.; Rodríguez Achata, L.; Garate-Quispe, J. Vegetation dynamics in lands degraded by gold mining in the southeastern Peruvian Amazon. Trees For. People 2023, 11, 100369. [Google Scholar] [CrossRef]
  5. Prach, K.; Walker, L.R. Differences between primary and secondary plant succession among biomes of the world. J. Ecol. 2019, 107, 510–516. [Google Scholar] [CrossRef]
  6. Rocha-Nicoleite, E.; Campos, M.L.; Colombo, G.T.; Overbeck, G.E.; Müller, S.C. Forest restoration after severe degradation by coal mining: Lessons from the first years of monitoring. Braz. J. Bot. 2018, 41, 653–664. [Google Scholar] [CrossRef]
  7. Leiva, J.D. Appropriate technologies and the geosocial evolution of informal, small-scale gold mining in Madre de Dios, Peru. Extr. Ind. Soc. 2022, 12, 101165. [Google Scholar] [CrossRef]
  8. Stoll, E.; Roopsind, A.; Maharaj, G.; Velazco, S.; Caughlin, T.T. Detecting gold mining impacts on insect biodiversity in a tropical mining frontier with SmallSat imagery. Remote Sens. Ecol. Conserv. 2022, 8, 379–390. [Google Scholar] [CrossRef]
  9. Mesquita, R.; Massoca, P.; Jakovac, C.C.; Bentos, T.; Williamson, G. Amazon Rain Forest Succession: Stochasticity or Land-Use Legacy? Bioscience 2015, 65, 849–861. [Google Scholar] [CrossRef] [Green Version]
  10. Tito, R.; Salinas, N.; Cosio, E.G.; Boza Espinoza, T.E.; Muñiz, J.G.; Aragón, S.; Nina, A.; Roman-Cuesta, R.M. Secondary forests in Peru: Differential provision of ecosystem services compared to other post-deforestation forest transitions. Ecol. Soc. 2022, 27, 12. [Google Scholar] [CrossRef]
  11. Zapata-Carbonell, J.; Bégeot, C.; Carry, N.; Choulet, F.; Delhautal, P.; Gillet, F.; Girardclos, O.; Mouly, A.; Chalot, M. Spontaneous ecological recovery of vegetation in a red gypsum landfill: Betula pendula dominates after 10 years of inactivity. Ecol. Eng. 2019, 132, 31–40. [Google Scholar] [CrossRef]
  12. Lenart, J.; Schuchová, K.; Kašing, M.; Falteisek, L.; Cimalová, Š.; Bílá, J.; Ličbinská, M.; Kupka, J. The abandoned underground mine as a semi-natural ecosystem: The story of Flaschar’s Mine (Czechia). CATENA 2022, 213, 106178. [Google Scholar] [CrossRef]
  13. Velásquez-Ramírez, M.; del Castillo Torres, D.; Guerrero Barrantes, J.; Vásquez Bardales, J.; Thomas, E.; Cusi Auca, E.; Chinen Gushiken, M.; Muñoz Diaz, B.; Russo, R.; Corvera Gomringer, R. Soil recovery of alluvial gold mine spoils in the Peruvian Amazon using Stylosanthes guianensis, a promising cover crop. Land Degrad. Dev. 2021, 32, 5143–5153. [Google Scholar] [CrossRef]
  14. Soto-Benavente, M.; Rodriguez-Achata, L.; Olivera, M.; Arostegui, V.; Colina, C.; Garate, J. Health risks due to the presence of heavy metals in agricultural products cultivated in areas abandoned by gold mining in the Peruvian Amazon. Sci. Agropecu. 2020, 11, 49–59. [Google Scholar] [CrossRef] [Green Version]
  15. Conrado, D.; Rey-Benayas, J.; Costa, G.; Santos, S. Tree Communities in Three-Year-Old Post-Mining Sites Under Different Forest Restoration Techniques in the Brazilian Amazon. Forests 2020, 11, 527. [Google Scholar] [CrossRef]
  16. Ribeiro, S.; Cerveira, A.; Soares, P.; Fonseca, T. Natural Regeneration of Maritime Pine: A Review of the Influencing Factors and Proposals for Management. Forests 2022, 13, 386. [Google Scholar] [CrossRef]
  17. Hariharan, P.; Raman, T.R.S. Active restoration fosters better recovery of tropical rainforest birds than natural regeneration in degraded forest fragments. J. Appl. Ecol. 2022, 59, 274–285. [Google Scholar] [CrossRef]
  18. Moyo, B.; Ravhuhali, K.E. Abandoned Croplands: Drivers and Secondary Succession Trajectories under Livestock Grazing in Communal Areas of South Africa. Sustainability 2022, 14, 6168. [Google Scholar] [CrossRef]
  19. Brasil, A.B.; Schwartz, G.; Noronha, N.C.; Gama, M.A.P.; Ferreira, G.C. Natural regeneration for restoration of degraded areas after bauxite mining: A case study in the Eastern Amazon. Ecol. Eng. 2021, 171, 106392. [Google Scholar] [CrossRef]
  20. Günter, S.; Weber, M.; Erreis, R.; Aguirre, N. Influence of distance to forest edges on natural regeneration of abandoned pastures: A case study in the tropical mountain rain forest of Southern Ecuador. Eur. J. For. Res. 2007, 126, 67–75. [Google Scholar] [CrossRef] [Green Version]
  21. Cubiña, A.; Aide, T.M. The Effect of Distance from Forest Edge on Seed Rain and Soil Seed Bank in a Tropical Pasture. Biotropica 2001, 33, 260–267. [Google Scholar] [CrossRef]
  22. Barros, T.C.; Elias, F.; Romano, L.L.; Ferreira, J. Natural recovery of plant species diversity in secondary forests in Eastern Amazonia: Contributions to passive forest restoration. Rev. Bras. Bot. 2020, 43, 165–175. [Google Scholar] [CrossRef]
  23. Mi, X.; Swenson, N.G.; Jia, Q.; Rao, M.; Feng, G.; Ren, H.; Bebber, D.P.; Ma, K. Stochastic assembly in a subtropical forest chronosequence: Evidence from contrasting changes of species, phylogenetic and functional dissimilarity over succession. Sci. Rep. 2016, 6, 32596. [Google Scholar] [CrossRef]
  24. Quintana, J.R.; Martín-Sanz, J.P.; Valverde-Asenjo, I.; Molina, J.A. Drought differently destabilizes soil structure in a chronosequence of abandoned agricultural lands. CATENA 2023, 222, 106871. [Google Scholar] [CrossRef]
  25. O’Brien, S.A.; Dehling, D.M.; Tylianakis, J.M. The recovery of functional diversity with restoration. Ecology 2022, 103, e3618. [Google Scholar] [CrossRef] [PubMed]
  26. Rocha, G.P.E.; Vieira, D.L.M.; Simon, M.F. Fast natural regeneration in abandoned pastures in southern Amazonia. For. Ecol. Manag. 2016, 370, 93–101. [Google Scholar] [CrossRef]
  27. Li, T.; Yang, H.; Yang, X.; Guo, Z.; Fu, D.; Liu, C.; Li, S.; Pan, Y.; Zhao, Y.; Xu, F.; et al. Community assembly during vegetation succession after metal mining is driven by multiple processes with temporal variation. Ecol. Evol. 2022, 12, e8882. [Google Scholar] [CrossRef] [PubMed]
  28. van der Sande, M.T.; Powers, J.S.; Kuyper, T.W.; Norden, N.; Salgado-Negret, B.; Silva de Almeida, J.; Bongers, F.; Delgado, D.; Dent, D.H.; Derroire, G.; et al. Soil resistance and recovery during neotropical forest succession. Philos. Trans. R. Soc. B Biol. Sci. 2023, 378, 20210074. [Google Scholar] [CrossRef]
  29. Matsuo, T.; Martínez-Ramos, M.; Bongers, F.; van der Sande, M.T.; Poorter, L. Forest structure drives changes in light heterogeneity during tropical secondary forest succession. J. Ecol. 2021, 109, 2871–2884. [Google Scholar] [CrossRef]
  30. Villa, P.M.; Martins, S.V.; de Oliveira Neto, S.N.; Rodrigues, A.C.; Safar, N.V.H.; Monsanto, L.D.; Cancio, N.M.; Ali, A. Woody species diversity as an indicator of the forest recovery after shifting cultivation disturbance in the northern Amazon. Ecol. Indic. 2018, 95, 687–694. [Google Scholar] [CrossRef]
  31. Martins, W.B.R.; de Matos Rodrigues, J.I.; de Oliveira, V.P.; Ribeiro, S.S.; dos Santos Barros, W.; Schwartz, G. Mining in the Amazon: Importance, impacts, and challenges to restore degraded ecosystems. Are we on the right way? Ecol. Eng. 2022, 174, 106468. [Google Scholar] [CrossRef]
  32. Velasquez-Ramirez, M.; Corvera, R.; Guerrero, J.; Thomas, E.; Russo, R.; Cusi, E.; Becerra, E.; Nascimiento, P.; Muñoz, A.; Vasquez, J.; et al. Guía Práctica: Recuperación de la Salud del Suelo para la Restauración de Áreas Degradadas por la Minería Aurífera Aluvial en la Amazonia Peruana, 1st ed.; Instituto de Investigaciones de la Amazonia Peruana (IIAP): Iquitos, Peru, 2022; ISBN 9786120065365. [Google Scholar]
  33. de Jesus Silva, C.V.; dos Santos, J.R.; Galvao, L.S.; da Silva, R.D.; Moura, Y.M. Floristic and structure of an Amazonian primary forest and a chronosequence of secondary succession. Acta Amaz. 2016, 46, 133–150. [Google Scholar] [CrossRef] [Green Version]
  34. Velásquez-Ramírez, M.; Vega Ruiz, C.; Gomringer, R.; Pillaca, M.; Thomas, E.; Stewart, P.M.; Gamarra Miranda, L.A.; Dañobeytia, F.R.; Guerrero Barrantes, J.A.; Gushiken, M.C.; et al. Mercury in soils impacted by alluvial gold mining in the Peruvian Amazon. J. Environ. Manag. 2021, 288, 112364. [Google Scholar] [CrossRef] [PubMed]
  35. Caballero, J.; Messinger, M.; Román-Dañobeytia, F.; Ascorra, C.; Fernandez, L.; Silman, M. Deforestation and Forest Degradation Due to Gold Mining in the Peruvian Amazon: A 34-Year Perspective. Remote Sens. 2018, 10, 1903. [Google Scholar] [CrossRef] [Green Version]
  36. Sáenz, G.; Finegan, B. Monitoreo de la Regeneración Natural con Fines de Manejo Forestal. Manejo Forestal Tropical No 15; CATIE: Turrialba, Costa Rica, 2000. [Google Scholar]
  37. Lozada, J. Consideraciones metodológicas sobre los estudios de comunidades forestales. Rev. For. Venez. 2010, 54, 77–88. [Google Scholar]
  38. Sugianto, S.; Muslih, A.M.; Ar-Rasyid, U.H.; Anhar, A. Vegetation analysis of rawa singkil wildlife reserve in Rantau Gedang Village, Singkil Distric, Aceh Singkil Regency, Aceh Province. IOP Conf. Ser. Earth Environ. Sci. 2021, 667, 012068. [Google Scholar] [CrossRef]
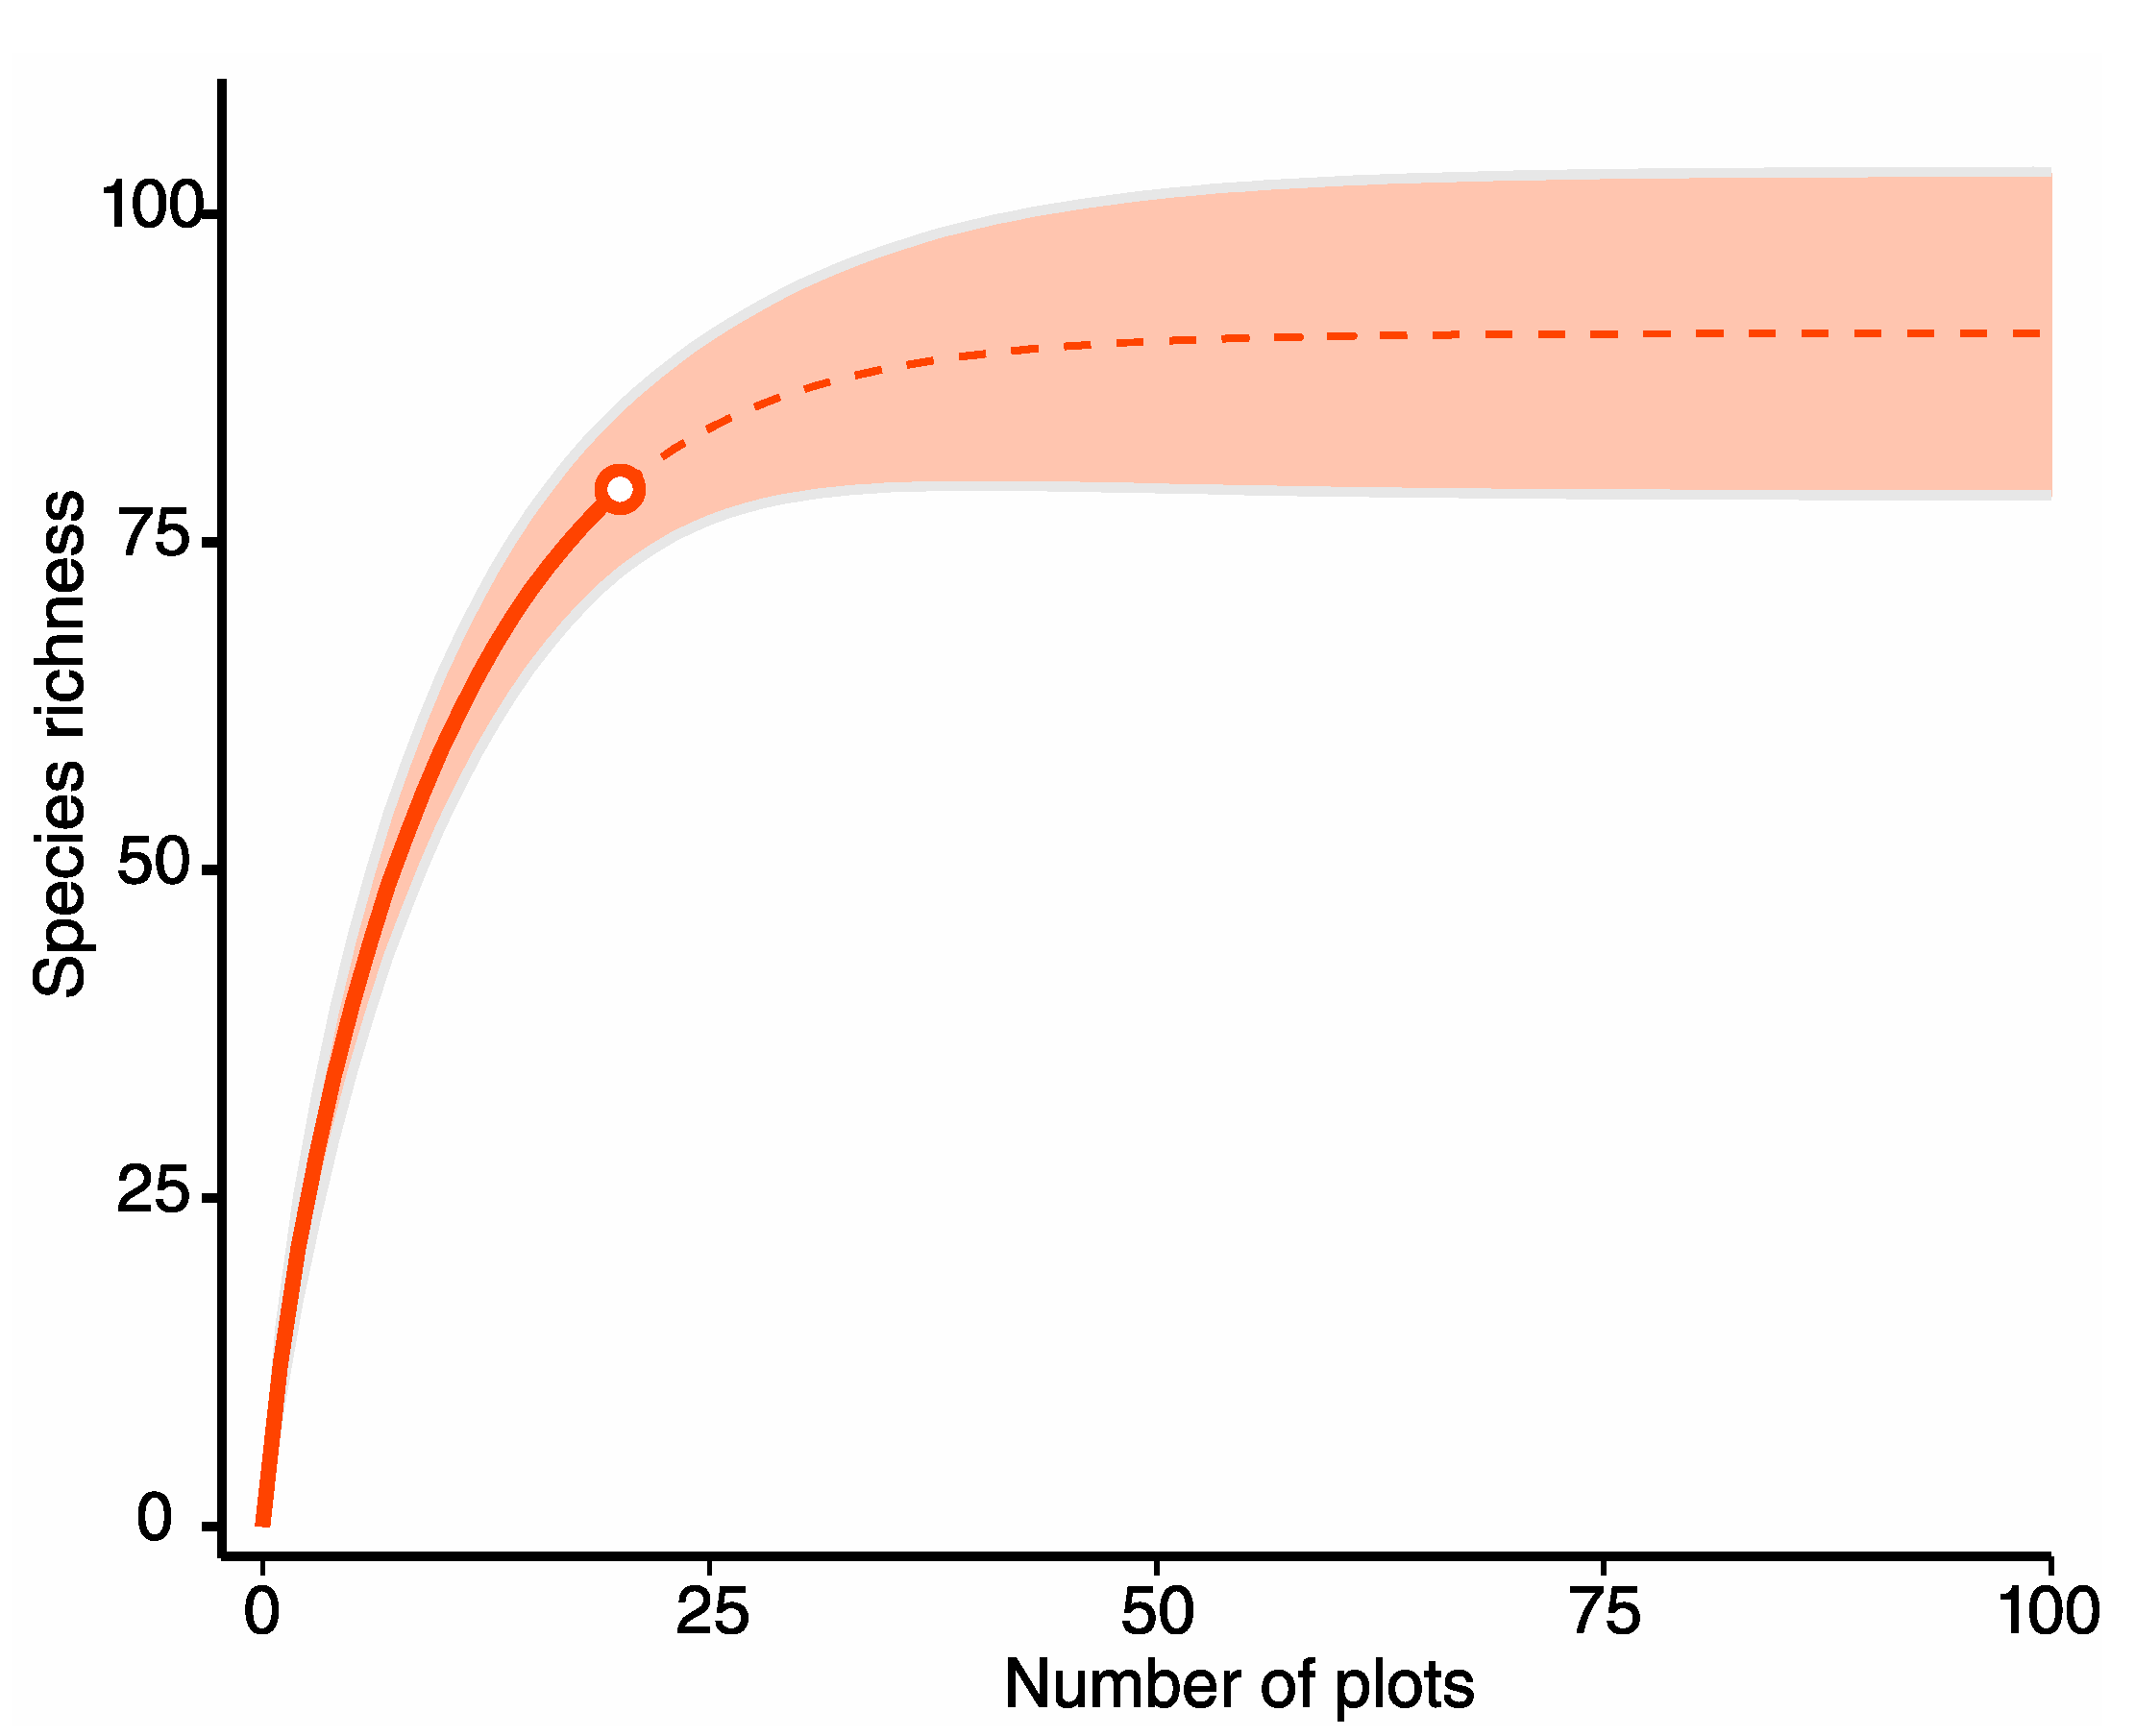
  39. Zhao, J.; Chen, J.; Chen, C.; Lu, S.; Song, C.; Liu, S.; Li, J.; Zhuang, C. Is it sufficient? Assessment of two sampling methods for urban plant species richness investigations. Urban For. Urban Green. 2023, 79, 127824. [Google Scholar] [CrossRef]
  40. Oksanen, J.; Minchin, P.R. Continuum theory revisited: What shape are species responses along ecological gradients? Ecol. Model. 2002, 157, 119–129. [Google Scholar] [CrossRef]
  41. Huisman, J.; Olff, H.; Fresco, L.F.M. A hierarchical set of models for species response analysis. J. Veg. Sci. 1993, 4, 37–46. [Google Scholar] [CrossRef] [Green Version]
  42. Ahmadi, K.; Alavi, S.J.; Hosseini, S.M. Modeling response curves of European yew (Taxus baccata L.) using HOF models along the environmental gradient in north of Iran. Acta Ecol. Sin. 2022, 42, 383–391. [Google Scholar] [CrossRef]
  43. R Core Team. R: A Language and Environment for Statistical Computing; R Foundation for Statistical Computing: Vienna, Austria, 2022. [Google Scholar]
  44. Dexter, E.; Rollwagen-Bollens, G.; Bollens, S.M. The trouble with stress: A flexible method for the evaluation of nonmetric multidimensional scaling. Limnol. Oceanogr. Methods 2018, 16, 434–443. [Google Scholar] [CrossRef]
  45. Lai, J.; Zou, Y.; Zhang, J.; Peres-Neto, P.R. Generalizing hierarchical and variation partitioning in multiple regression and canonical analyses using the rdacca.hp R package. Methods Ecol. Evol. 2022, 13, 782–788. [Google Scholar] [CrossRef]
  46. Dueñas, H.; Peña, J.; Báez, S.; Bejar, N.; Berrocal, S.; Garate, J. Influencia de la conservación de bosques en la diversidad y composición florística arbórea en el sureste de la Amazonía peruana. Cienc. Amaz. 2019, 7, 111–125. [Google Scholar] [CrossRef]
  47. Jakovac, C.C.; Peña-Claros, M.; Kuyper, T.W.; Bongers, F. Loss of secondary-forest resilience by land-use intensification in the Amazon. J. Ecol. 2015, 103, 67–77. [Google Scholar] [CrossRef]
  48. Goosem, M.; Paz, C.; Fensham, R.; Preece, N.; Goosem, S.; Laurance, S.G.W. Forest age and isolation affect the rate of recovery of plant species diversity and community composition in secondary rain forests in tropical Australia. J. Veg. Sci. 2016, 27, 504–514. [Google Scholar] [CrossRef]
  49. Banin, L.F.; Raine, E.H.; Rowland, L.M.; Chazdon, R.L.; Smith, S.W.; Rahman, N.E.B.; Butler, A.; Philipson, C.; Applegate, G.G.; Axelsson, E.P.; et al. The road to recovery: A synthesis of outcomes from ecosystem restoration in tropical and sub-tropical Asian forests. Philos. Trans. R. Soc. B Biol. Sci. 2023, 378, 20210090. [Google Scholar] [CrossRef]
  50. San-José, M.; Werden, L.; Joyce, F.H.; Reid, J.L.; Holl, K.D.; Zahawi, R.A. Effects of landscape structure on restoration success in tropical premontane forest. Sci. Rep. 2022, 12, 13452. [Google Scholar] [CrossRef] [PubMed]
  51. van Breugel, M.; Craven, D.; Lai, H.R.; Baillon, M.; Turner, B.L.; Hall, J.S. Soil nutrients and dispersal limitation shape compositional variation in secondary tropical forests across multiple scales. J. Ecol. 2019, 107, 566–581. [Google Scholar] [CrossRef]
  52. Rozendaal, D.M.A.; Bongers, F.; Aide, T.M.; Alvarez-Dávila, E.; Ascarrunz, N.; Balvanera, P.; Becknell, J.M.; Bentos, T.V.; Brancalion, P.H.S.; Cabral, G.A.L.; et al. Biodiversity recovery of Neotropical secondary forests. Sci. Adv. 2019, 5, eaau3114. [Google Scholar] [CrossRef] [Green Version]
  53. Garate-Quispe, J.S.; Canahuire-Robles, R.; Surco-Huacachi, O.; Alarcón-Aguirre, G. Desarrollo estructural y composición florística arbórea en áreas afectadas por minería aurífera en la Amazonía peruana: A 20 años de su reforestación. Rev. Mex. Biodivers. 2021, 92, e923437. [Google Scholar] [CrossRef]
  54. Fagundes, M.V.; Oliveira, R.S.; Fonseca, C.R.; Ganade, G. Nurse-target functional match explains plant facilitation strength. Flora Morphol. Distrib. Funct. Ecol. Plants 2022, 292, 152061. [Google Scholar] [CrossRef]
  55. Astudillo-Sánchez, E.; Pérez, J.; Troccoli, L.; Aponte, H. Composición, estructura y diversidad vegetal de la Reserva Ecológica Comunal Loma Alta, Santa Elena, Ecuador. Rev. Mex. Biodivers. 2019, 90, e902871. [Google Scholar] [CrossRef]
  56. Bonilla-Mata, R.; Acosta-Vargas, L.G. Dynamic and growth of the forests of the Isla del Coco National Park, Costa Rica. Rev. Biol. Trop. 2020, 68, S89–S102. [Google Scholar] [CrossRef]
  57. Vacek, Z.; Cukor, J.; Vacek, S.; Podrázský, V.; Linda, R.; Kovařík, J. Forest biodiversity and production potential of post-mining landscape: Opting for afforestation or leaving it to spontaneous development? For. J. 2018, 64, 116–126. [Google Scholar] [CrossRef]
  58. Villa, P.M.; Martins, S.V.; Diniz, É.S.; Nolasco de Oliveira Neto, S.; Neri, A.V.; Pinto-Junior, H.; Nunes, J.A.; Bueno, M.L.; Ali, A. Taxonomic and functional beta diversity of woody communities along Amazon forest succession: The relative importance of stand age, soil properties and spatial factor. For. Ecol. Manag. 2021, 482, 118885. [Google Scholar] [CrossRef]
  59. König, L.A.; Medina-Vega, J.A.; Longo, R.M.; Zuidema, P.A.; Jakovac, C.C. Restoration success in former Amazonian mines is driven by soil amendment and forest proximity. Philos. Trans. R. Soc. B Biol. Sci. 2023, 378, 20210086. [Google Scholar] [CrossRef]
  60. Hendy, A.; Hernandez-Acosta, E.; Valério, D.; Ferreira, N.; Reis, C.; Rodrigues, E.; Silva, E.; Andes, J.; Prado, F.; Margarete, V.; et al. Where boundaries become bridges: Mosquito community composition, key vectors, and environmental associations at forest edges in the central Brazilian Amazon. PLoS Negl. Trop. Dis. 2023, 17, e0011296. [Google Scholar] [CrossRef] [PubMed]
  61. Liu, W.; Fu, S.; Yan, S.; Ren, C.; Wu, S.; Deng, J.; Li, B.; Han, X.; Yang, G. Responses of plant community to the linkages in plant-soil C:N:P stoichiometry during secondary succession of abandoned farmlands, China. J. Arid Land 2020, 12, 215–226. [Google Scholar] [CrossRef]
  62. de Paula, F.R.; Ruschel, A.R.; Felizzola, J.F.; Frauendorf, T.C.; de Barros Ferraz, S.F.; Richardson, J.S. Seizing resilience windows to foster passive recovery in the forest-water interface in Amazonian lands. Sci. Total Environ. 2022, 828, 154425. [Google Scholar] [CrossRef] [PubMed]
  63. Longworth, J.B.; Williamson, G.B. Composition and Diversity of Woody Plants in Tree Plantations Versus Secondary Forests in Costa Rican Lowlands. Trop. Conserv. Sci. 2018, 11, 194008291877329. [Google Scholar] [CrossRef] [Green Version]
  64. Rocchini, D.; Bacaro, G.; Chirici, G.; Da Re, D.; Feilhauer, H.; Foody, G.M.; Galluzzi, M.; Garzon-Lopez, C.X.; Gillespie, T.W.; He, K.S.; et al. Remotely sensed spatial heterogeneity as an exploratory tool for taxonomic and functional diversity study. Ecol. Indic. 2018, 85, 983–990. [Google Scholar] [CrossRef] [Green Version]
  65. Román-Dañobeytia, F.; Huayllani, M.; Michi, A.; Ibarra, F.; Loayza-Muro, R.; Vázquez, T.; Rodríguez, L.; García, M. Reforestation with four native tree species after abandoned gold mining in the Peruvian Amazon. Ecol. Eng. 2015, 85, 39–46. [Google Scholar] [CrossRef]
  66. Purvis, A.; Hector, A. Getting the measure of biodiversity. Nature 2000, 405, 212–219. [Google Scholar] [CrossRef] [PubMed]
  67. Suding, K.; Higgs, E.; Palmer, M.; Callicott, J.B.; Anderson, C.B.; Baker, M.; Gutrich, J.J.; Hondula, K.L.; LaFevor, M.C.; Larson, B.M.H.; et al. Committing to ecological restoration. Science 2015, 348, 638–640. [Google Scholar] [CrossRef] [PubMed] [Green Version]
  68. Yunanto, T.; Amanah, F.; Siregar, I.Z. The influence of fast-growing species composition on natural regeneration of coal mine reclamation. IOP Conf. Ser. Earth Environ. Sci. 2021, 918, 012048. [Google Scholar] [CrossRef]
Figure 2. The geographic location of the study area at San Jacinto Native Community, Madre de Dios (B), Perú (A). (C) Landsat-8 image (June 2021) over San Jacinto Native Community (D) Spatial distribution of sampling plots. (E) Sampling plots in images from drone flight integrated into an orthomosaic photo (July 2021).
Diversity 15 00793 g002
Figure 3. Species accumulation curve of natural regeneration in study areas. Reference samples are indicated by a solid white dot. Dashed lines: extrapolation curves. Shaded area for each solid line: 95% confidence interval for the expected richness of rarefied classes. Shaded area for each dashed line: 95% confidence interval for the expected extrapolated class richness up to a sample size of 80 based on a bootstrap method with 9999 replicates.
Diversity 15 00793 g003
Figure 4. The density and average height of individuals according to diameter categories of the vegetation in study areas. DBH = diameter at breast height.
Diversity 15 00793 g004
Figure 5. Relative abundance and relative dominance of the first ten species according to different abandonment time categories.
Diversity 15 00793 g005
Figure 6. Response curves derived from HOF models of the most common species in relation to the gradient of distance to the forest edge of plots in the study area.
Diversity 15 00793 g006
Figure 7. Response curves derived from HOF models of the most common species in relation to the abandonment time gradient in the study area.
Diversity 15 00793 g007
Figure 8. Boxplots of the abundance, species richness, Shannon diversity, and basal area of woody vegetation according to categories of abandonment time. The gray line represents the mean. Different letters indicate that the difference between the groups is significant by Student–Newman–Keuls post hoc testing (p-value < 0.05).
Diversity 15 00793 g008
Figure 9. Non-metric multidimensional scaling (nMDS) analysis diagram of floristic similarity between the 20 naturally regenerated plots evaluated. All individuals (A) and according to size categories: (B) seedlings, (C) saplings, and (D) trees. Groups (different colors) represent statistically significant clusters of plots (p-value < 0.05) according to the SIMPROF test, and the shape of the symbols represents the category of abandonment time.
Diversity 15 00793 g009
Figure 10. Graphic representation of the dbRDA (A) floristic similarity between the plots evaluated in the study area. (B) Venn diagram of the variance partition according to distance to the forest edge and abandonment time and (C) individual effects of distance to the forest edge and abandonment time in the floristic composition.
Diversity 15 00793 g010
Table 1. Characteristics of the plots and abundance, species richness, and diversity indices of natural regeneration found in the study area and reference values for primary forests of Madre de Dios.
NAbandonment TimeDistance to the Forest EdgeSpecies RichnessAbundanceShannon-HMargalefα-Fisher
1106013731.762.804.60
2311010651.772.163.30
3412511681.992.373.72
4204015612.203.416.35
5233520662.414.549.76
61111021662.734.7710.63
7147023552.695.4914.86
8515010282.012.705.57
922608431.411.862.90
1062505121.421.613.22
11713916502.163.838.14
1272279411.602.153.56
1335604211.120.991.47
14612015731.743.265.72
1543188191.782.385.21
16419512481.742.845.14
17517511451.692.634.64
18517111421.592.684.85
19825013202.324.0116.10
20615012352.113.096.45
Reference values for the old-growth forest in Madre de Dios [46]82.7 ± 13
(61–125)
215 ± 51
(129–323)
3.9 ± 0.4
(2.4–4.5)
-53.3 ± 16
(24.5–90.8)
Reference values for early secondary forests (5 years after abandonment) in the Amazon [47]41.7 ± 10.4 (26–70)-2.8 ± 0.4
(1.8–3.7
--
Table 2. Abundance, species richness, and family importance index of tree vegetation for the study area.
FamilySpecies Richness AbundanceRelative Abundance (%)Basal Area (m2)Relative
Dominance (%)
Importance Index (%)
Fabaceae2014115.150.736928.7621.95
Malvaceae815516.650.549821.4619.05
Urticaceae316117.290.513920.0518.67
Asteraceae416517.720.06582.5710.15
Piperaceae1788.380.06442.515.45
Moraceae6151.610.21218.284.94
Euphorbiaceae5222.360.13165.143.75
Verbenaceae2606.440.02250.883.66
Cannabaceae4171.830.05302.071.95
Rubiaceae2161.720.05522.161.94
Myrtaceae1131.400.01340.520.96
Hypericaceae2141.500.00860.330.92
Muntingiaceae1101.070.01190.460.77
Bixaceae180.860.01210.470.67
Primulaceae130.320.02400.930.63
Salicaceae380.860.00750.290.58
Caryophyllaceae140.430.01790.700.56
Meliaceae110.110.02190.850.48
Poaceae180.860.00250.100.48
Solanaceae260.640.00370.140.39
Melastomataceae460.640.00340.130.39
Polygonaceae140.430.00820.320.38
Peraceae140.430.00460.180.30
Rutaceae120.210.00990.390.30
Malpighiaceae140.430.00340.130.28
Boraginaceae420.210.00070.030.12
Araliaceae110.110.00210.080.10
Phyllanthaceae110.110.00070.030.07
Simaroubaceae110.110.00060.020.06
Gentianaceae110.110.00020.010.06
Table 3. Correlation between abandonment time and distance to the forest edge with floristic attributes in the study area. Spearman’s correlation coefficient, * p-value < 0.05; ** p-value < 0.01; *** p-value < 0.001; ns = not significant. The letter “a” after the correlation coefficient means that the Pearson correlation was used.
Basal AreaSpecies RichnessIndividualsDiversity Index
ShannonMargalefα-Fisher
(A) All individuals
  Abandonment time0.48 *0.76 ***0.31 ns0.67 **0.75 ***0.71 ***
  Distance to the forest edge−0.58 **−0.77 ***−0.81 ***−0.63 **−0.63 **−0.45 *
(B) Seedling category
  Abandonment time0.48 *0.52 *0.09 ns0.42 ns0.56 *0.43 ns
  Distance to the forest edge−0.58 **−0.86 ***−0.63 ***−0.80 ***−0.77 ***−0.69 ***
(C) Sapling category
  Abandonment time0.49 *0.61 **0.30 ns0.58 *0.61 **0.41 ns
  Distance to the forest edge−0.46 ns−0.54 *−0.51a *−0.33a (ns)−0.30a (ns)−0.20 ns
(D) Tree category
  Abandonment time0.45 ns0.59 *0.55 *0.62 **0.59 *0.52 *
  Distance to the forest edge−0.50 *−0.36 ns−0.48 *−0.33a (ns)−0.35 ns−0.37 ns
Table 4. Multiple regression between abandonment time and distance to the forest edge, with the basal area, abundance, species richness, and species diversity in study areas.
VariablePredictorsPartial
Correlation
Hierarchical Partitioningp-ValueModel Adjusted R2
IndependentJointIndependent Effect (%)
Basal AreaAbandonment time0.1750.1340.11340.810.0340.25
Distance to the forest edge−0.3290.19559.19
Species richnessAbandonment time0.3410.2740.23140.91<0.0010.631
Distance to the forest edge−0.5780.39659.09
AbundanceAbandonment time−0.3780.0990.03915.47<0.0010.642
Distance to the forest edge−0.7640.54384.53
Shannon diversity indexAbandonment time0.380.270.19349.890.0010.488
Distance to the forest edge−0.3820.27250.11
Margalef diversity indexAbandonment time0.4210.2970.20651.29<0.0010.53
Distance to the forest edge−0.3910.28248.71
α-Fisher diversity indexAbandonment time0.4690.2770.10372.790.0170.308
Distance to the forest edge−0.0270.10427.21
Disclaimer/Publisher’s Note: The statements, opinions and data contained in all publications are solely those of the individual author(s) and contributor(s) and not of MDPI and/or the editor(s). MDPI and/or the editor(s) disclaim responsibility for any injury to people or property resulting from any ideas, methods, instructions or products referred to in the content.

