Article

Faunistic and Structural Changes in Shallow Coastal Benthic Communities of the Ebre Delta (NW Mediterranean Sea)

1
Institut de Ciències del Mar (CSIC), Passeig Marítim de la Barceloneta, 37–49, 08003 Barcelona, Spain
2
Instituto Español de Oceanografía (IEO-CSIC), Centro Oceanográfico de Murcia, Varadero, 1, 30740 San Pedro del Pinatar, Spain
*
Author to whom correspondence should be addressed.
Diversity 2023, 15(5), 623; https://doi.org/10.3390/d15050623
Submission received: 14 March 2023 / Revised: 27 April 2023 / Accepted: 28 April 2023 / Published: 3 May 2023
(This article belongs to the Special Issue Diversity and Ecology of Marine Benthic Communities)

Abstract

:
The Ebre Delta (NW Mediterranean), which is considered a highly vulnerable ecosystem, is one of the most important European wetlands and belongs to the Natura 2000 network. The present study aims to characterize the benthic megainvertebrate communities inhabiting the Ebre Delta soft-bottom infralittoral to acquire faunistic and biological knowledge for two periods of time, 23 years apart. Experimental trawls were conducted during the two periods (1992–1993 and 2016–2017) in three depth strata, between 5 and 25 m. A total of 139 and 170 taxa were collected at each period, respectively. Our results showed that community species composition and structure varied between periods and among depth strata. Overall, a large decrease in density and biomass was detected for most species in all three depth strata examined (0–5, 15–20, and 20–25 m) in 2016–2017, especially in the shallowest stratum. Species richness was higher in 2016–2017 than in 1992–1993, and the lowest values were found at the shallowest stratum in both periods. The significant biomass losses herein reported highlight the need to increase, in time and effort, the monitoring of large marine invertebrates in coastal areas, where many taxa provide important ecosystem functions and services.

1. Introduction

Coastal ecosystems are among the most productive marine zones and provide important services related to human well-being, including food supply, recreation, and biodiversity. However, the coastal zone is extremely sensitive to the impact of human activities and natural disturbances. Pollution, impoverishment of water quality, erosion, habitat loss and degradation, overexploitation, alien species establishment, and climate change are considered the most important threats to the Mediterranean biodiversity [1]. In this changing context, faunistic studies are essential to assess diversity patterns to detect the effects of disturbances in marine soft-bottom benthos, especially concerning species and habitat resilience [2,3,4]. According to the European Water Framework Directive (WFD; 2000/60/EC), studies on macrofauna (250 µm–1 cm) can be highly valuable to assess the ecological status for all European water bodies, and several benthic biotic indices have been developed to that end [5,6]. However, this type of study requires meticulous procedures, i.e., sampling with grabs or corers, sieving on 0.5–1 mm mesh screens, and longtime sorting, missing most vagile megafauna in the sampling process. Thus, studies on megafauna (from one to several centimeters) can provide an accurate alternative to macrofauna sampling, as it is significantly quicker to collect and analyze them, and their communities respond to the same environmental drivers as macrofauna [7].
Studies on species abundance and distribution along the time axis are essential to study and analyze ecosystem responses to natural and anthropogenic effects. Thus, historical quantitative records are required to set a reference to an earlier state [8,9,10] because the comparison between a historical baseline and recent surveys may be the only proxy to detect changes in species abundance and distribution [11]. In the Mediterranean, coastal soft-bottom macrobenthos data series in shallow sandy/muddy bottoms are scarce, with some exceptions [12,13]. To increase data collection, the megafauna obtained from scientific fish surveys may offer the opportunity to obtain relevant ecological information [14]. However, bottom trawl fishery surveys, e.g., the MEDITS program in the Mediterranean Sea [15], tend to focus on benthic-demersal species from 50 to 800 m depth [15,16]. Thus, there is an information gap in shallow water habitats despite the recruitment of many fishery target species that takes places in these areas. To fill this lack of information, megainvertebrate faunistic studies from scientific shellfish stock surveys can be used [7,17,18].
The Ebre Delta, with its 320 km2, is one the largest deltas in the W Mediterranean, which contains numerous wetland habitats that host diverse and abundant wildlife. The delta is protected by the European Union and the Ebre Delta Natural Park, and it is cataloged as a Biosphere Reserve (Natura 2000 site of UNESCO) (http://natura2000.eea.europa.eu/ (accessed on 13 March 2023)). Its coastline is considered a highly vulnerable ecosystem [19,20] because it is frequently affected by both storms and flooding, resulting in coastal erosion [19]. Fisheries are important sources of economic activity in this productive area with fish, mollusks, and crustaceans being relevant in the fish market. The gastropod Bolinus brandaris (Linnaeus, 1758), the bivalve Chamelea gallina (Linnaeus, 1758), and the caramote prawn Penaeus kerathurus (Forskål, 1775) are the main commercial species captured by the artisanal dredge fleet that operates on the coastal line, along the 5–30 m depth strip.
Quantifying benthos biomass and density is necessary to evaluate the severity of the threats affecting coastal communities [20]. Over time, the composition of the benthic community may change as disturbance events alter the interactions between species, e.g., losing sensitive species or new ones appearing in the community [21]. Information on the infralittoral communities of the Ebre Delta helps to implement adequate conservation and management strategies within the framework of the current European Directives [22,23]. To that end, we studied the community patterns under the hypothesis that the benthic invertebrate communities in that area have changed over time, decreasing in diversity and biomass owing to the loss of species sensitive to disturbances. This study provides a comparison of the structure (species composition, richness, and diversity), abundance, and biomass of benthic assemblages using qualitative and quantitative data collected on shallow waters, 23 years apart (1992–1993 and 2016–2017).

2. Materials and Methods

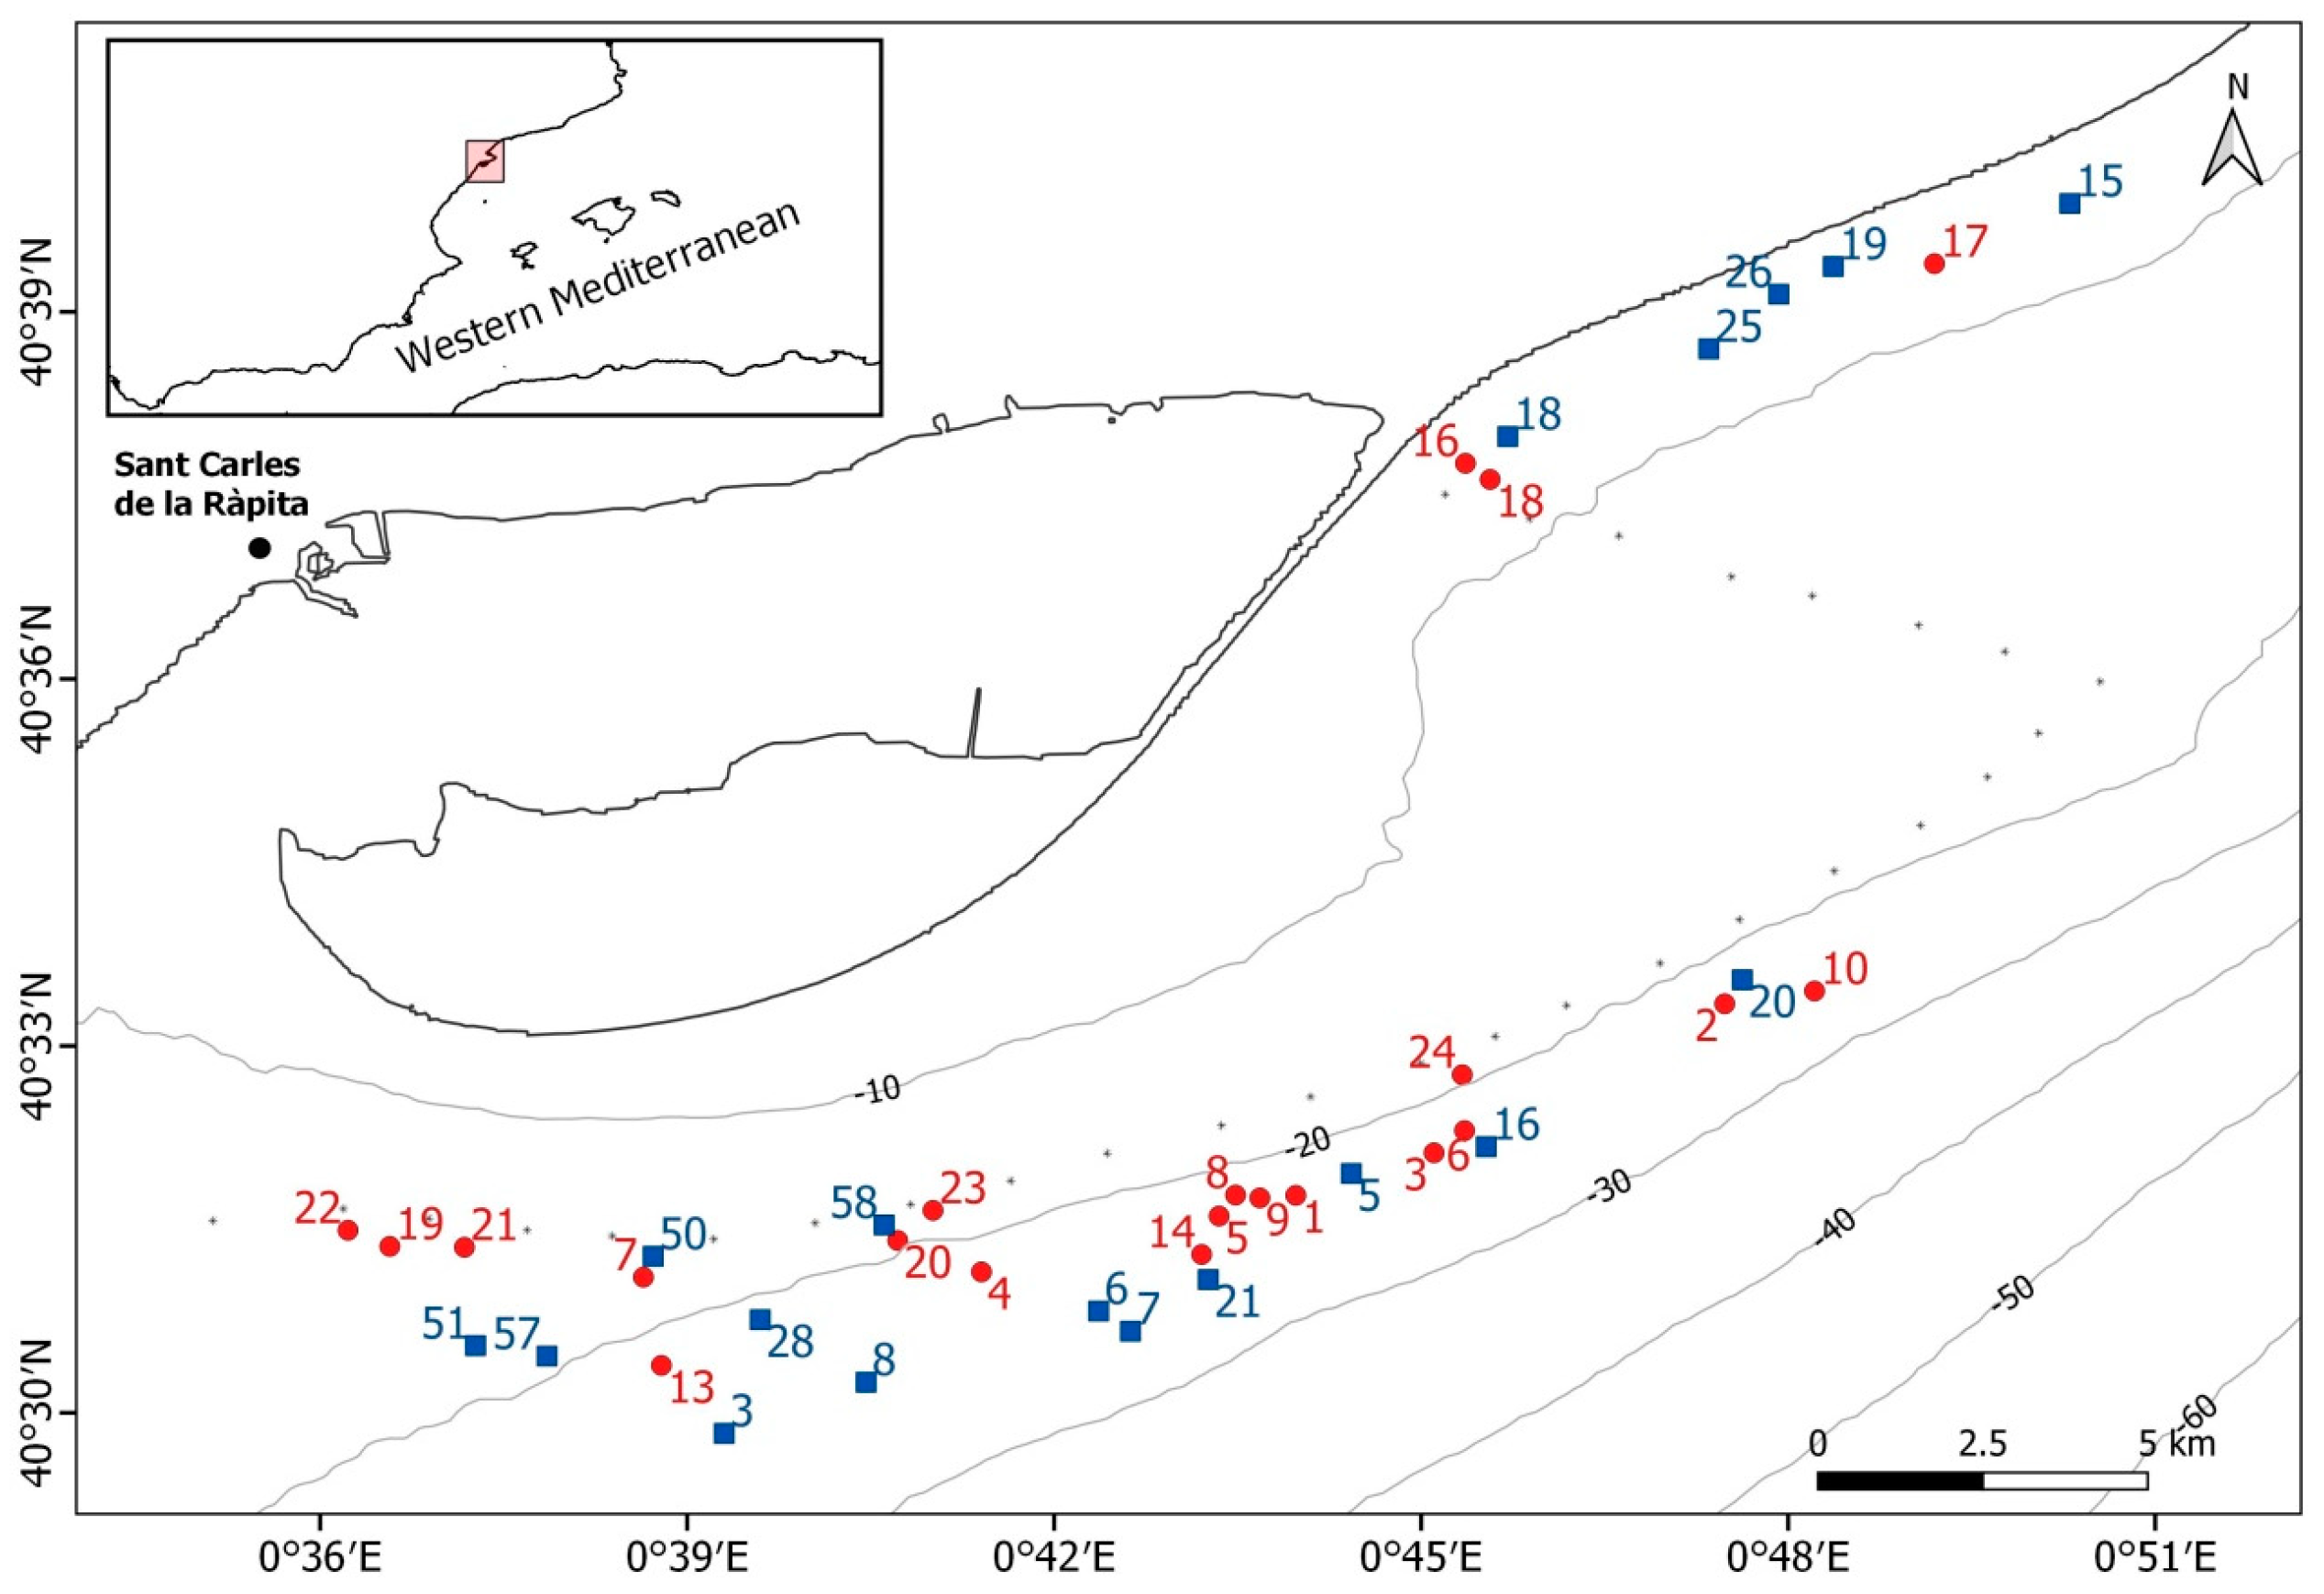
2.1. Study Area and Sampling Methods

The study was carried out in the south of the Ebre Delta (Catalan coast, NW Mediterranean Sea, Figure 1). This coast presents a microtidal environment with a maximum tidal range below 0.3 m [24]. A cross-shore distribution of the sediment grain size shows a trend toward offshore, with medium and fine sands at the shoreline (<6 m depth) but silt in areas deeper than 20 m [24]. The mean slope varies in depth. It is high (>0.005) between the shoreline and down to 4–6 m in depth; intermediate (from 0.002 to 0.005) between 6 and 11 m in depth; and <0.002 in discontinuous patches of the deepest littoral zone (>11 m depth) [25]. The shore face, which is shallower than 4 m in depth, is a high energy zone affected by continuous sediment transport caused by waves [26].
The study covered an area of 36 km2 (22.5 km length by 1.6 km width), ranging from 5 to 25 m in depth. Sampling took place in two periods, one from November 1992 to October 1993, and another from October 2016 to September 2017. The same gear and techniques were used in both studied periods. In all, 18 and 21 sampling hauls were performed in the first and second periods, respectively, at the fishing grounds operated by the epibenthic dredge fleet of Sant Carles de la Ràpita. Epibenthic and demersal species were collected from a fishing boat using a commercial dredge, locally called “rastell”, to harvest mollusks and crustaceans. This gear consisted of a bag mounted on a rigid rectangular metal frame, with a total length of 10 m. The metal frame measured 2 m wide and 40 cm high. The upper part of the bag had netting, whereas the lower part had about 18 metal chains with each extreme tied to a side of the bag. The cod-end (40 mm diamond mesh size) measured 1.5–3 m [27]. Experimental hauls were conducted with the same methodology used by the fishers, towing two dredges simultaneously side by side from the stern. Haul depth and speed of the boat were recorded. Average speed during fishing was 5.5 knots (~10.5 km h−1) with a duration of 30 min. The position of the hauls in 1992–1993 was established based on triangulation of visual landmarks on the coast. In 2016–2017, the track and geographical coordinates of the start and end points by haul were registered with a portable GPS (Magellan Explorist). The total catch was transported to the laboratory at the Institute of Marine Sciences (ICM-CSIC), where each specimen was identified to the lowest possible taxonomic level. Annelida, Ascidiacea, Cnidaria, and Porifera were excluded from quantitative analyses because of the lack of experts in the taxonomy of these groups. The specimens of each species were counted and weighed (g). Every scientific name follows the nomenclature of the World Register of Marine Species (WoRMS; http://www.marinespecies.org/ (accessed on 13 March 2023)).

2.2. Data Analysis

The density and biomass per species in each haul were standardized to 1 km2 using the start and end points of the haul. Multivariate and univariate analyses were applied using the PRIMER 6.0 software package [28], including the PERMANOVA+ add-on [29]. The matrix of standardized species density (number of individuals km−2) was fourth-root transformed to reduce the influence of very abundant species, and a resemblance matrix was constructed using the Bray-Curtis similarity index. Two-way permutational multivariate analysis-of-variance (PERMANOVA) was used to test the null hypothesis of no difference in assemblage structure with each of the three depth strata (5–10, 15–20, and 20–25 m) and to determine whether there was any pattern of temporal variation (1992–1993 and 2016–2017). The statistical significance of terms and interactions was assessed running 9.999 permutations. When PERMANOVA showed significant differences (p < 0.05), a pairwise comparison test was conducted to explore the differences among all pairs of levels of the selected factors. Non-metric multidimensional scaling (nMDS) ordination was used to visually depict the multivariate patterns. The SIMPER procedure was used to determine the species most responsible for differences in assemblages when PERMANOVA revealed a statistically significant result.
Univariate diversity measures, namely, species richness (S), Shannon–Wiener index (H’, using loge), and Pielou’s evenness (J’) were also calculated. A two-way ANOVA was carried out to test for differences in each biodiversity index between year and depth strata. Analyses to test for normality (Shapiro–Wilk) and to verify the homogeneity of variances were executed prior to the ANOVA analyses. When the normality or the homogeneity of variances did not adjust to ANOVA conditions, a log (x) transformation and a Welch test were applied, respectively. A post hoc Tukey test was used for posterior multiple comparisons. These statistical procedures were performed using the software SPSS Statistics v29.

3. Results

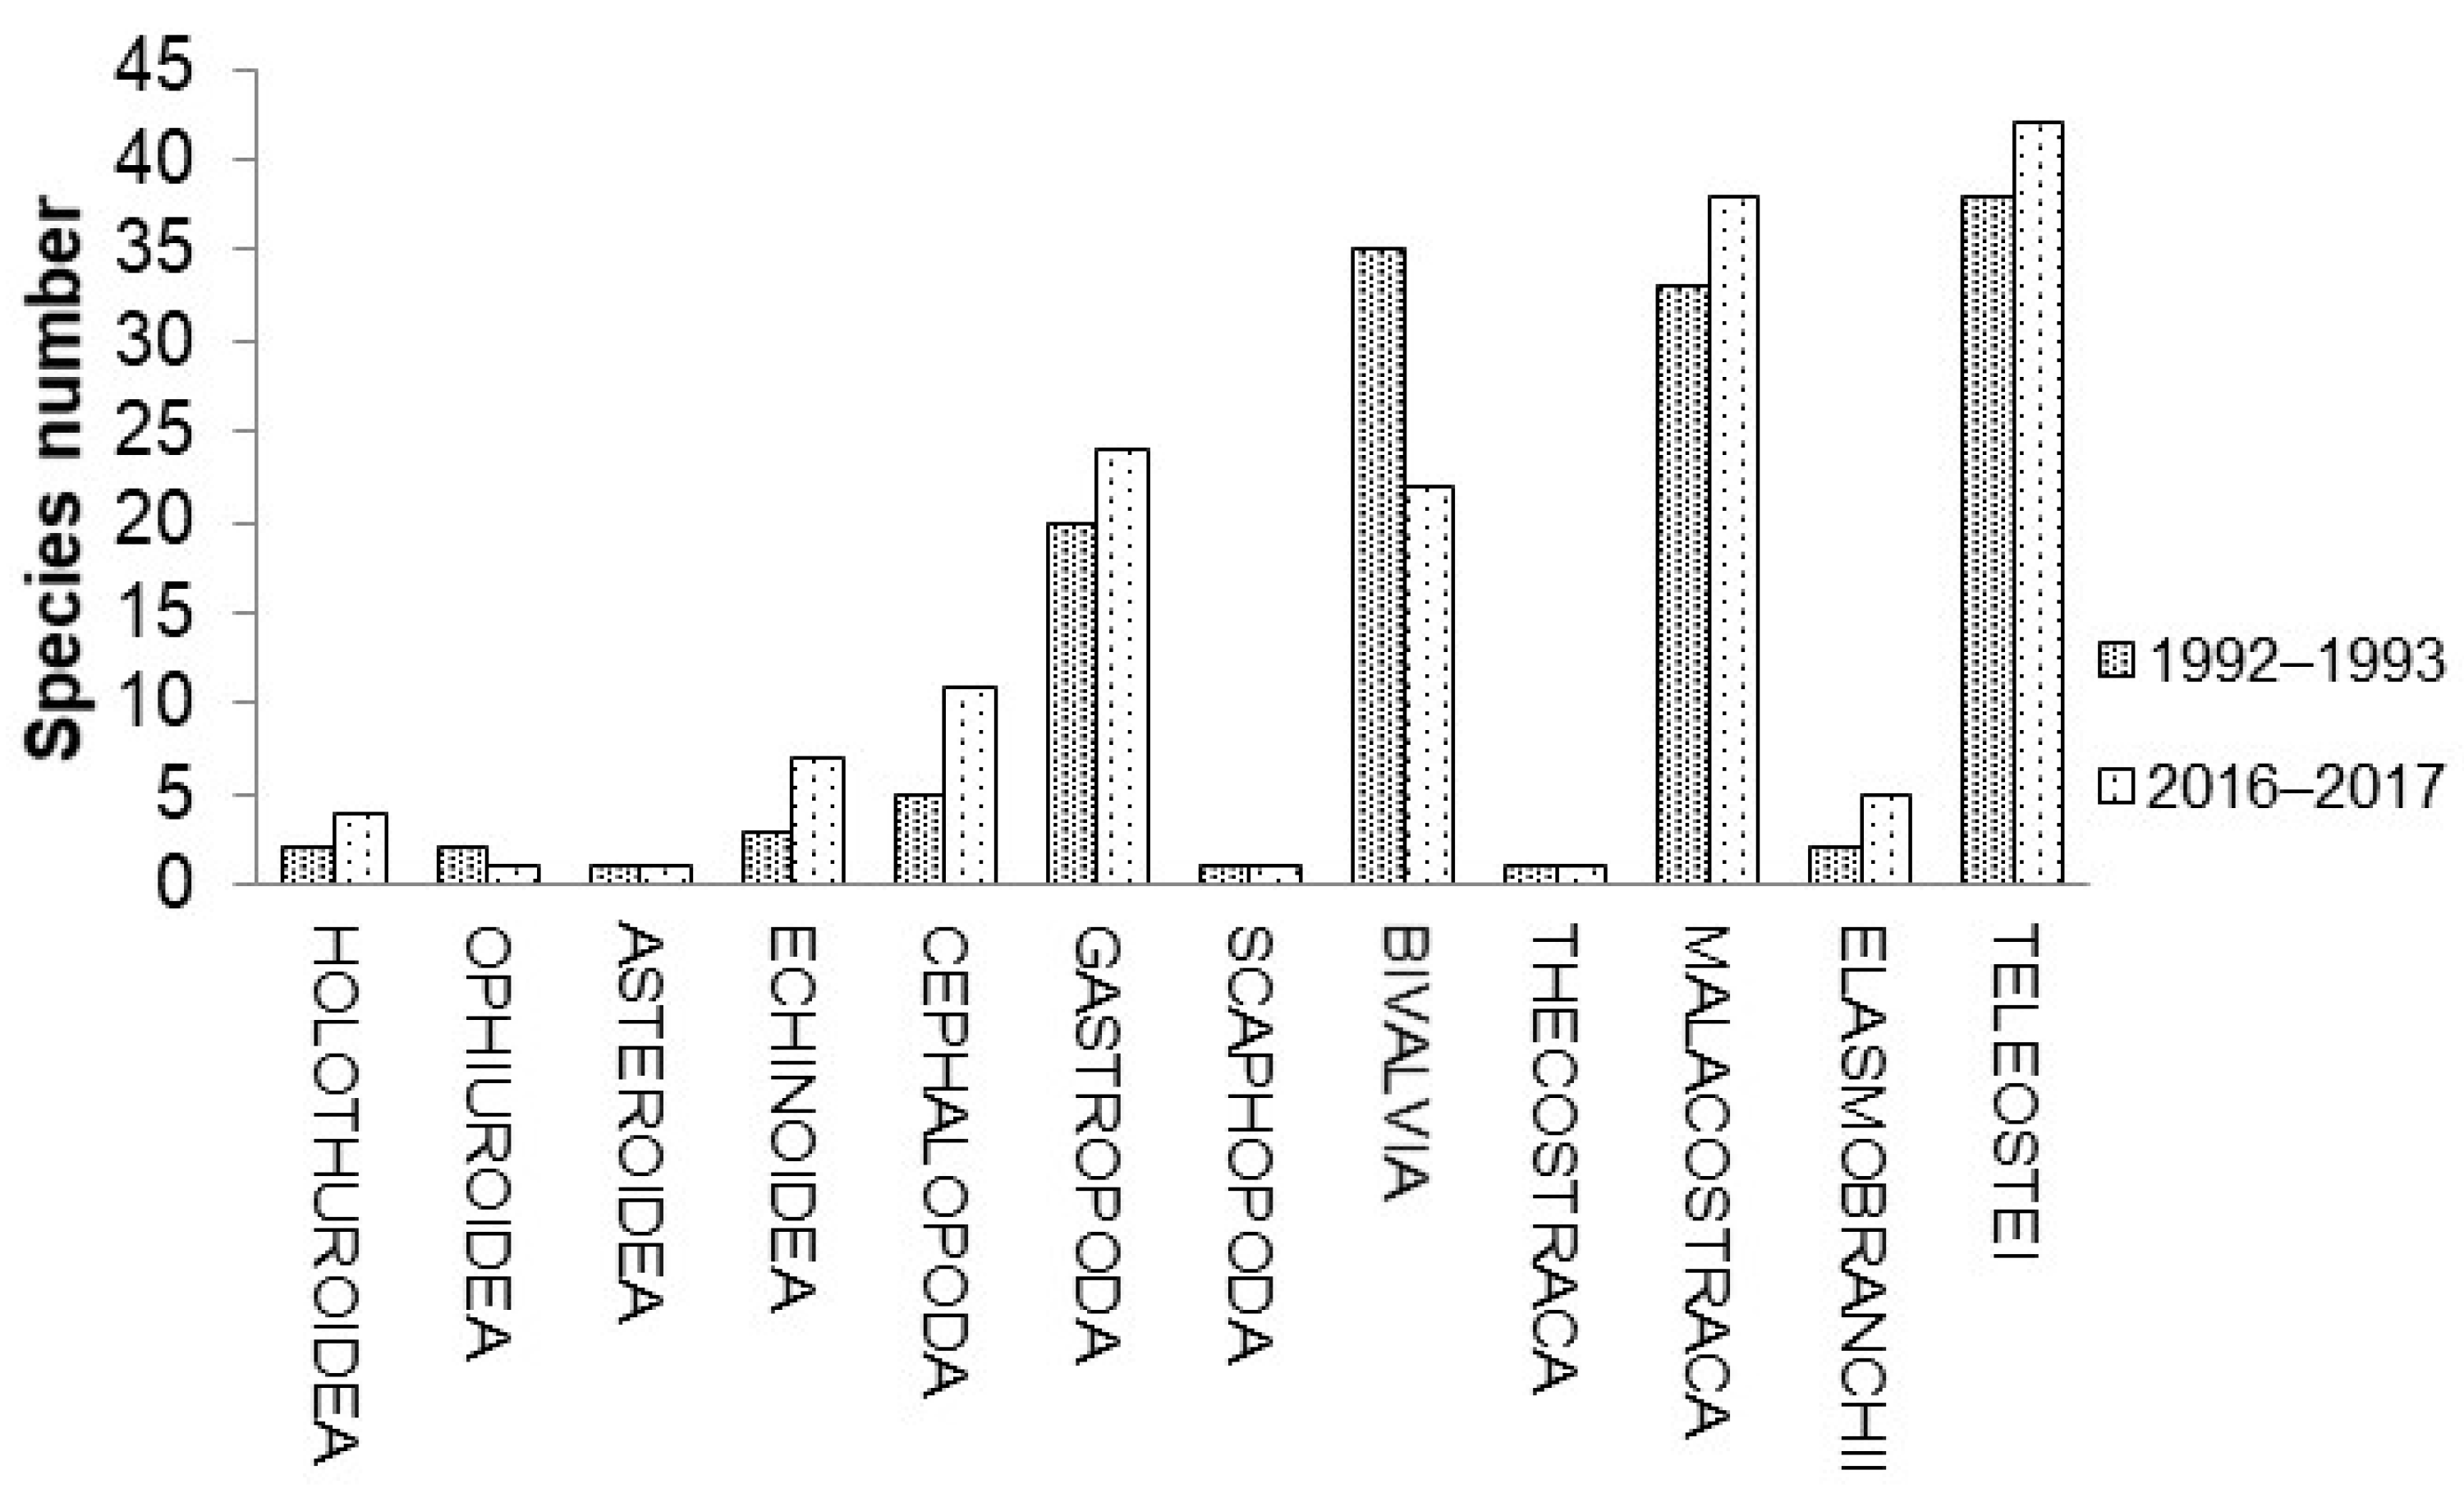
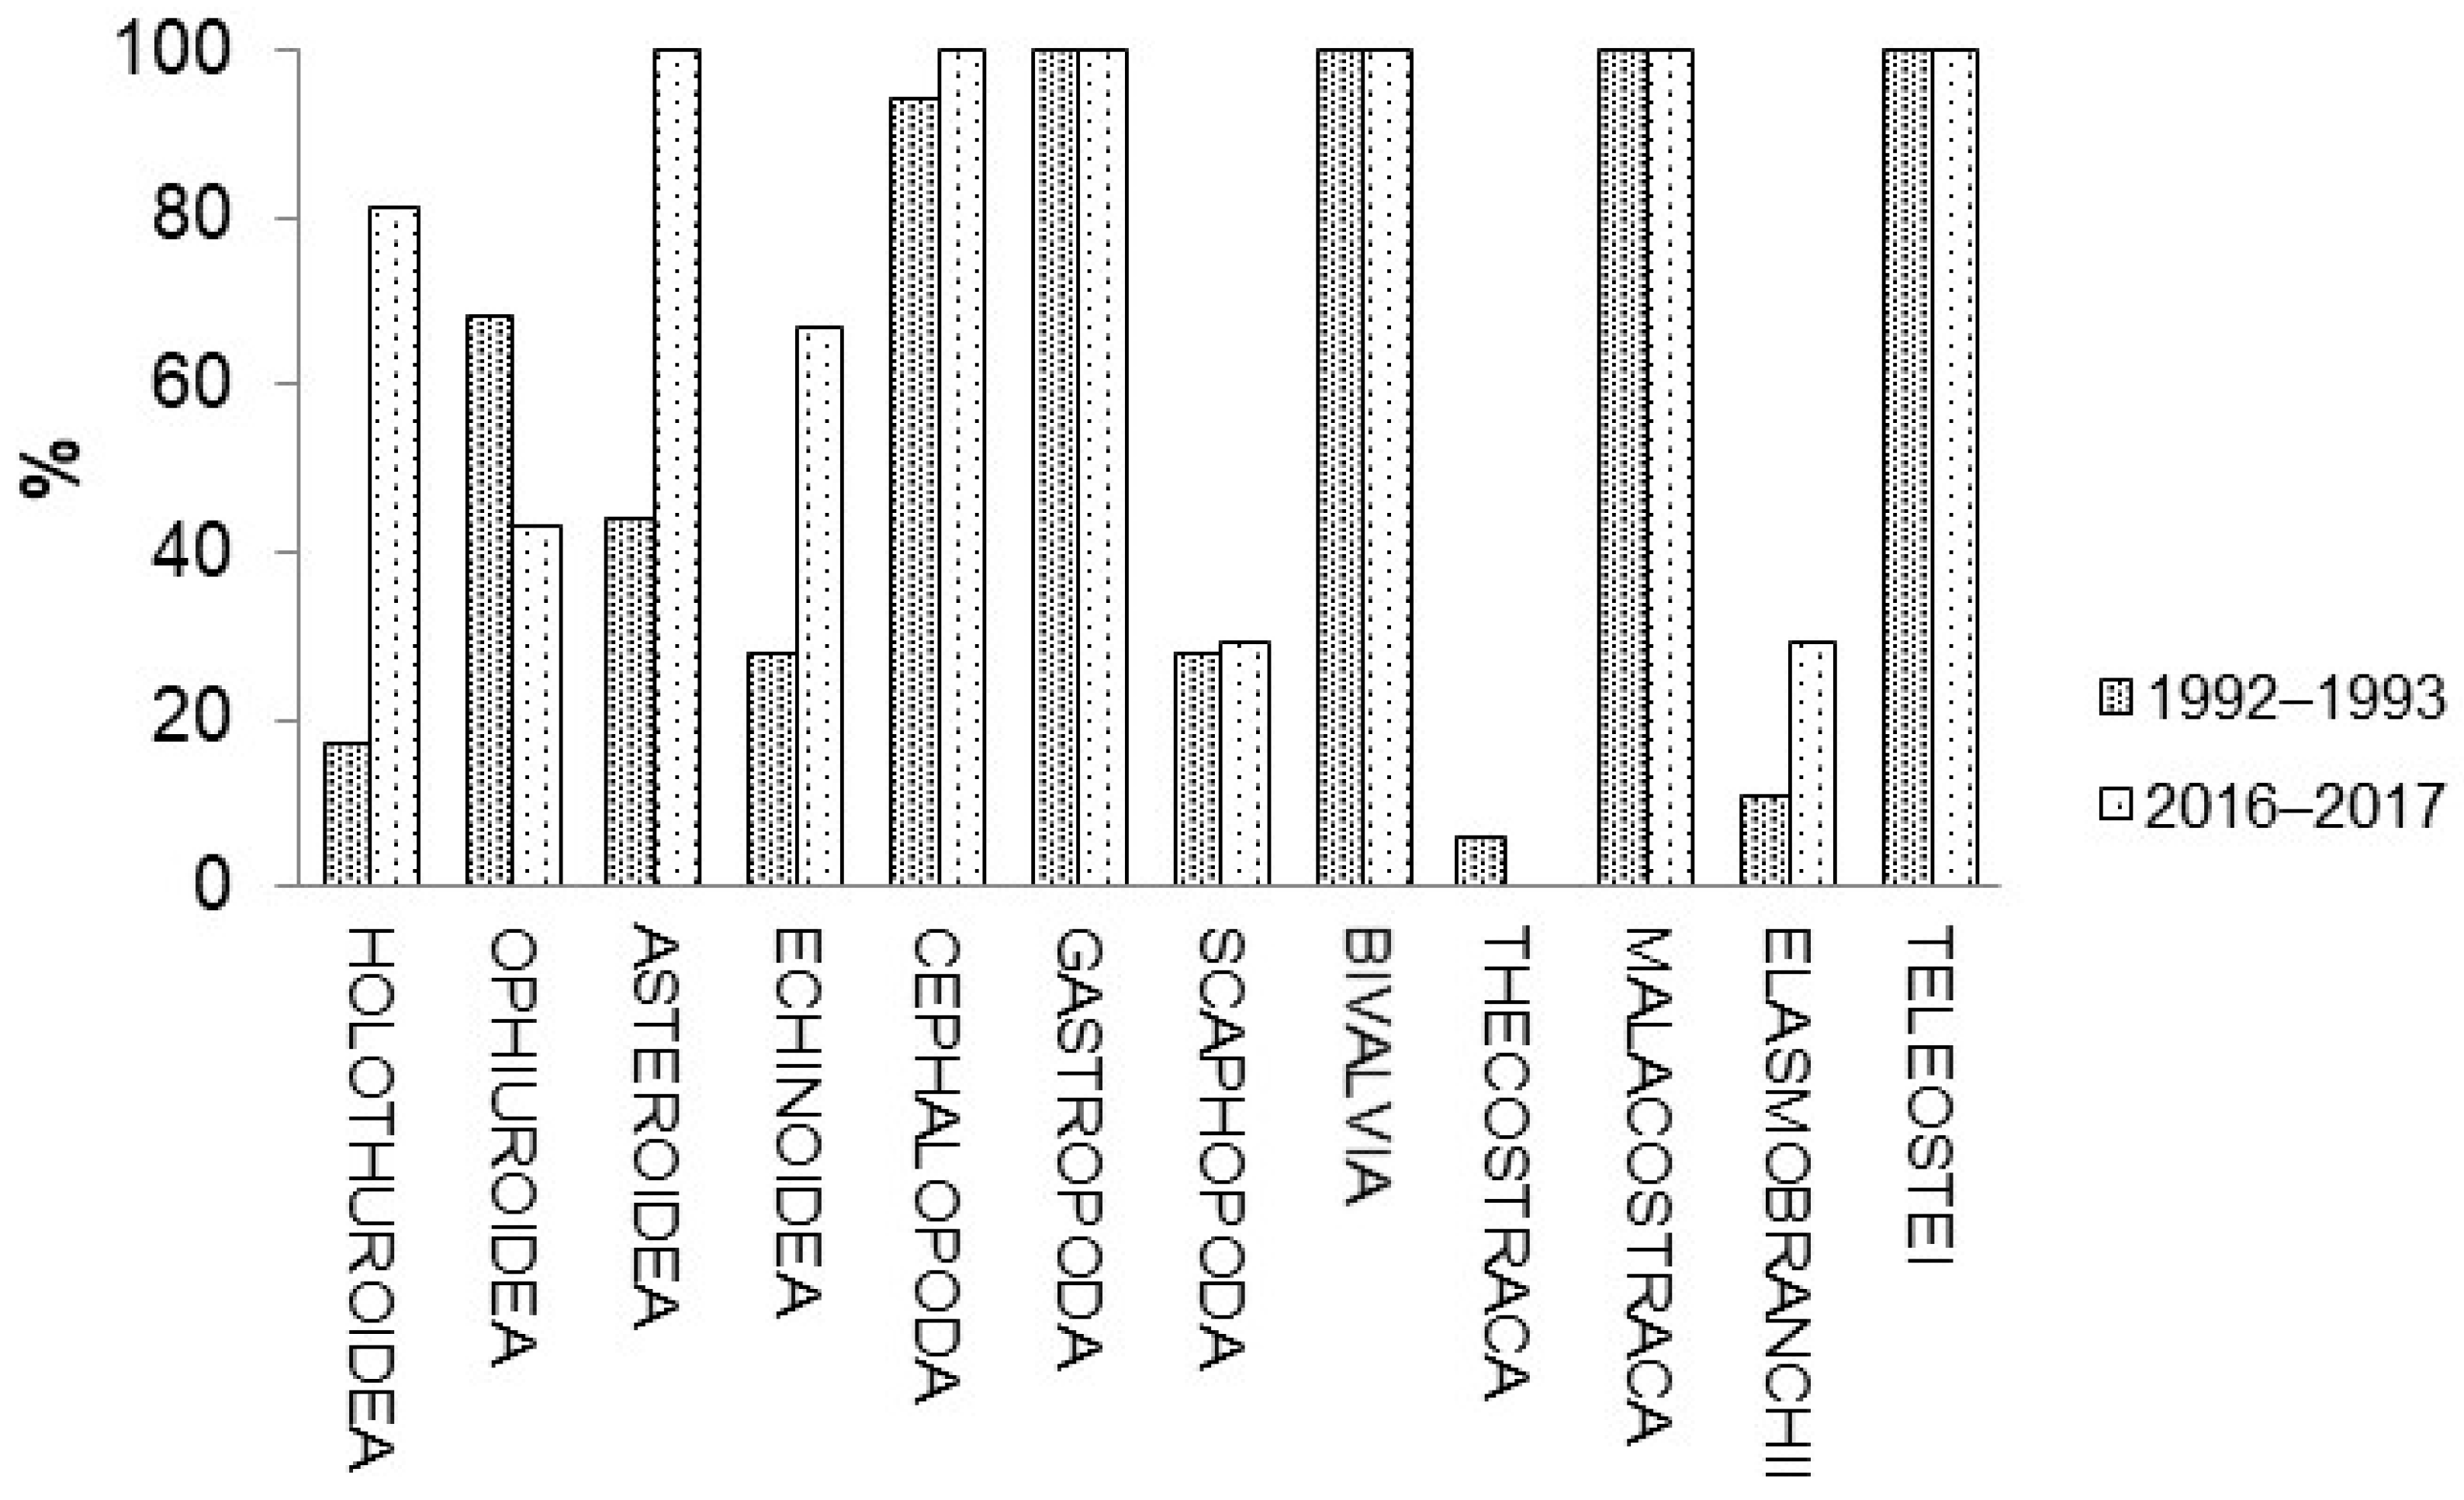
3.1. Faunistic Composition

A total of 139 taxa were collected during the 1992–1993 sampling surveys, of which 123 were identified to species level. The most diverse groups were Teleostei and Bivalvia, with a total of 37 and 34 taxa, respectively, followed by Malacostraca with 32 species (Figure 2). Gastropoda were represented by 19 species. All other groups had five or fewer species. In the 2016–2017 period, a total of 170 taxa were collected, of which 151 were identified to species level. The most diverse group was Teleostei, with a total of 42 taxa. Malacostraca was the second most diverse group, with 38 species. Gastropoda and Bivalvia were represented by 24 and 20 species, respectively. All other groups had seven or fewer species. Only Bivalvia showed a high decrease from 1992–1993 to 2016–2017. The faunistic lists, percentage of occurrence, and depth range of all species collected are shown in Table S1 (Supplementary Material).
Teleostei, together with Bivalvia, Gastropoda, and Malacostraca, appeared in all hauls performed in both periods (Figure 3). Asteroidea and Cephalopoda had a 100% occurrence during 2016–2017 but not in 1992–1993 (44% and 94%, respectively). Elasmobrachii, Echinoidea, Holothuroidea, and Scaphopoda had higher occurrences in 2016–2017 than in 1992–1993, whereas the opposite occurred with Ophiuroidea and Thecostraca (Cirripedia) (Figure 3).

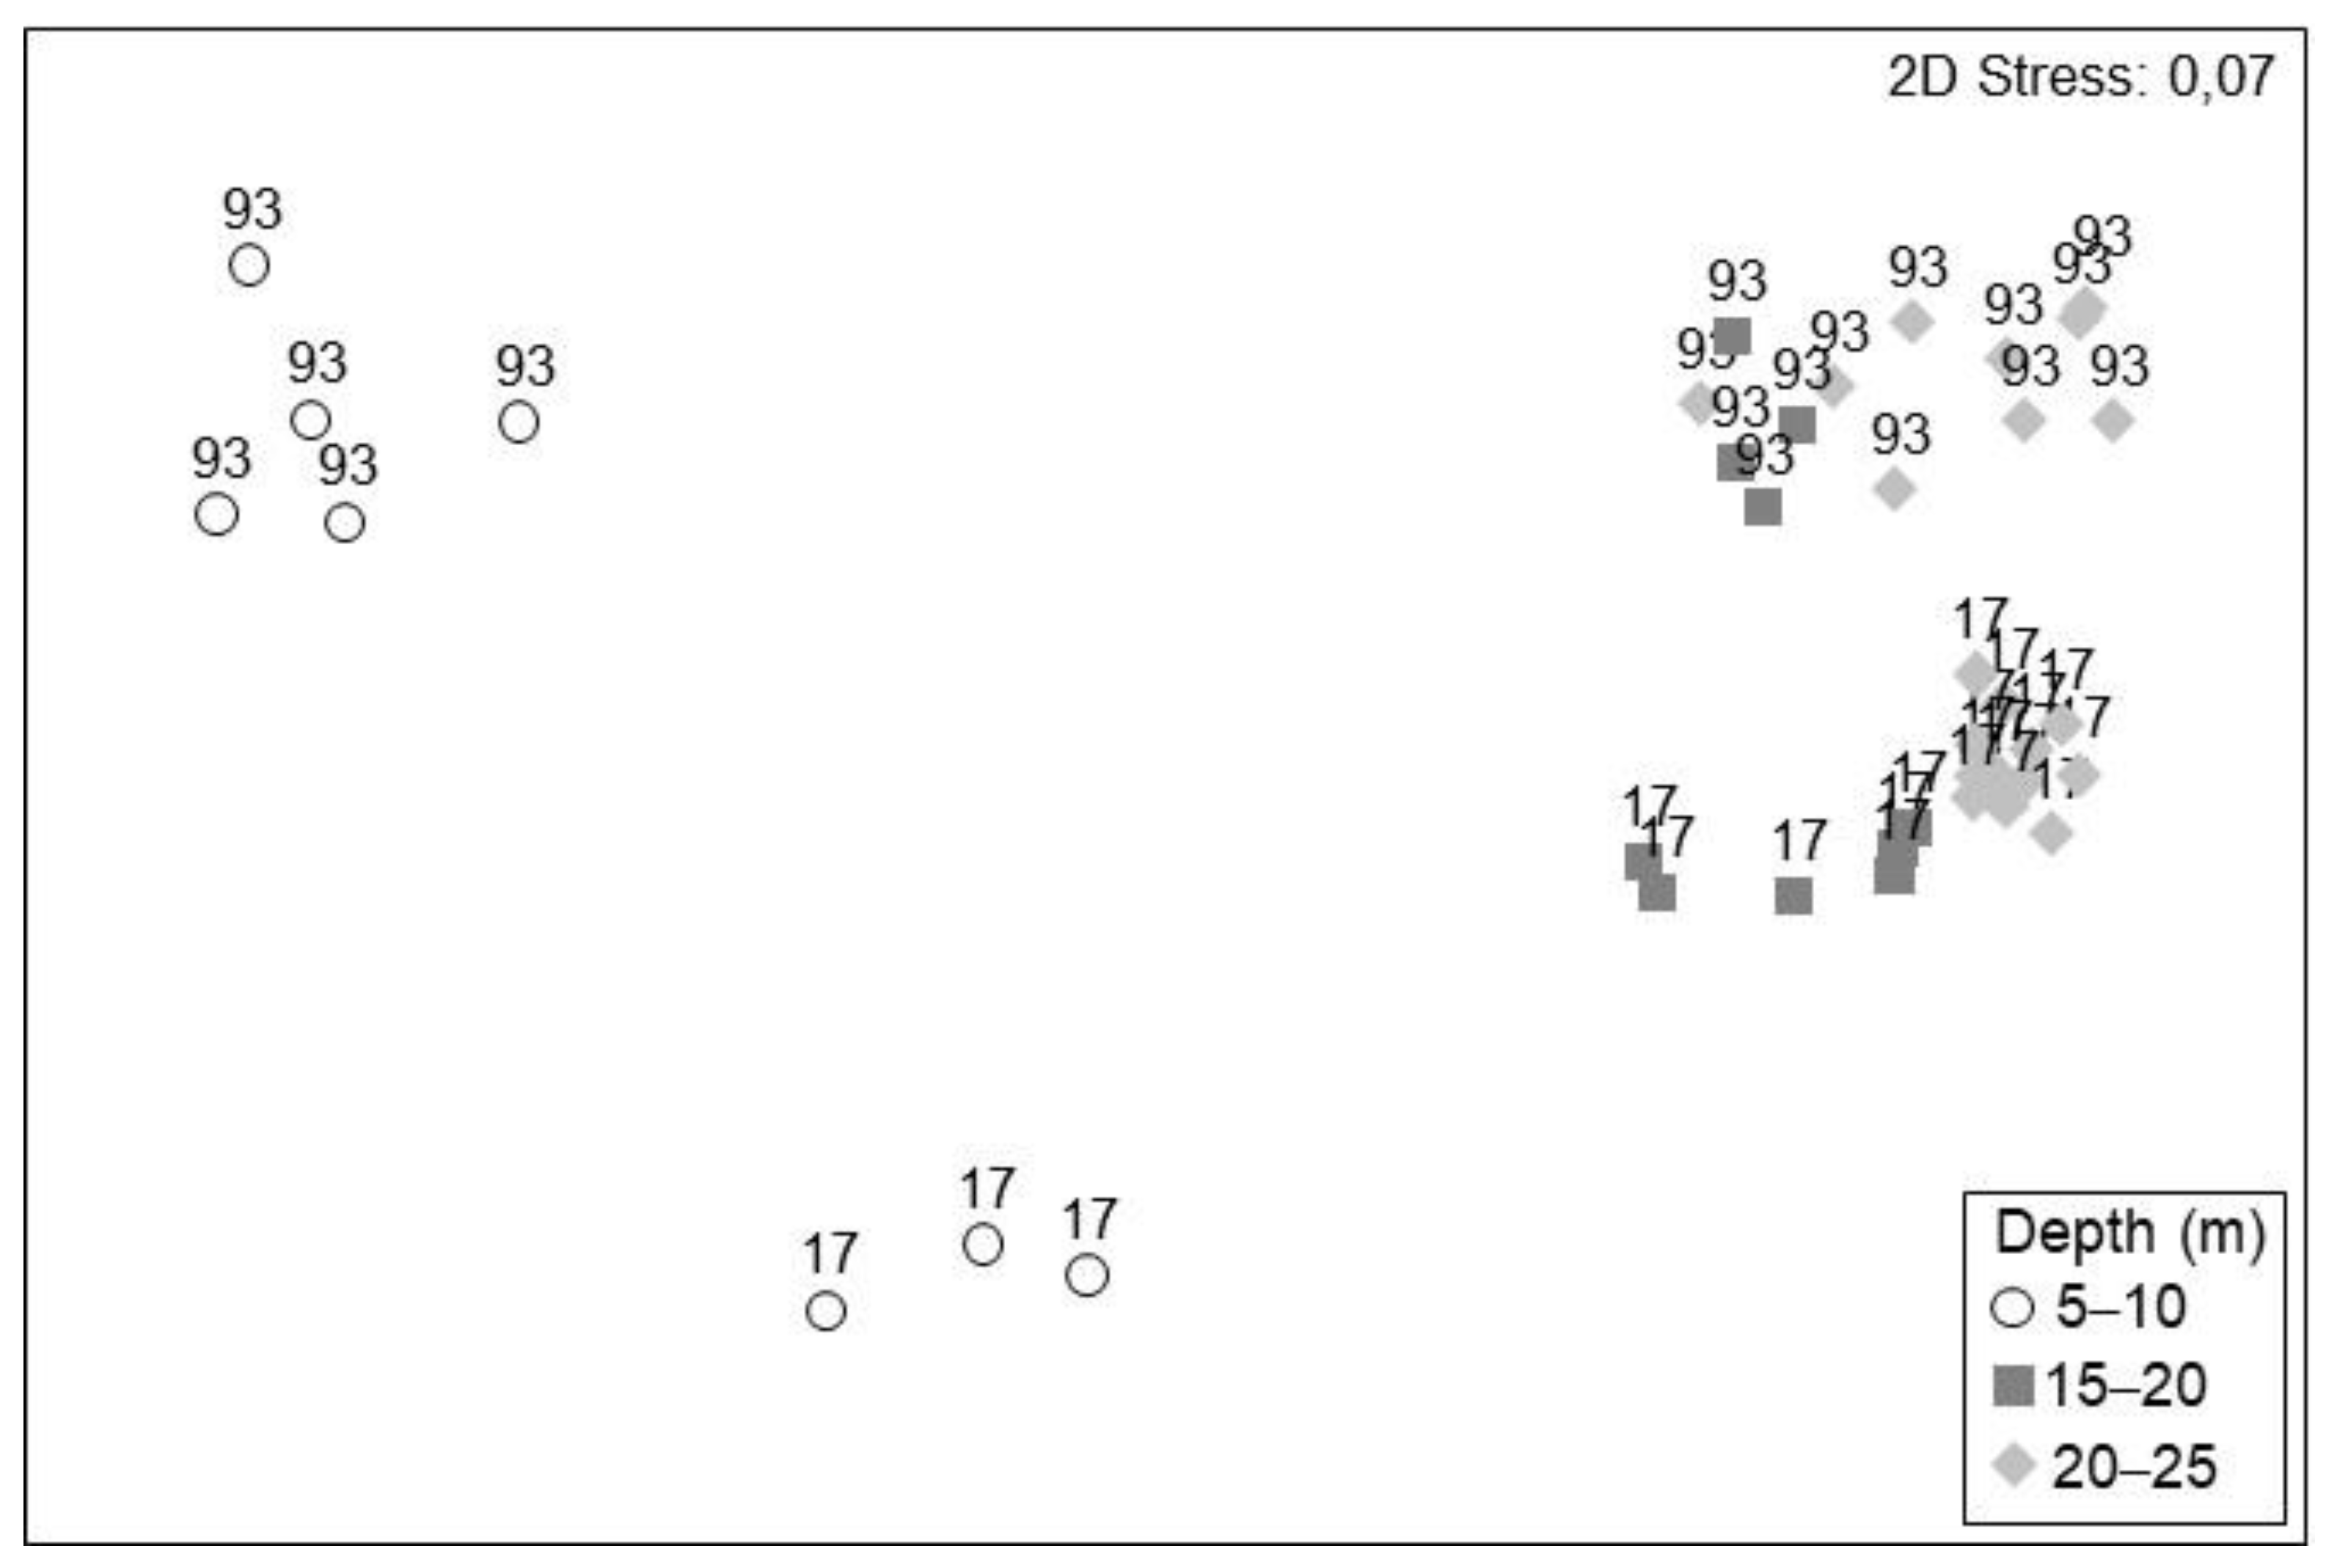
3.2. Characterization of Assemblages

PERMANOVA results (Table 1) showed that the multivariate structure of microbenthic assemblages differed significantly among depth strata (F1 = 22.387, p < 0.001) and year (F1 = 15.848, p < 0.001), with a significant interaction term (p < 0.001). Pairwise comparisons of the interaction depth strata x year revealed significant differences between depth strata at each year and significant year differences in communities at each depth stratum.
The documented multivariate pattern was visualized as a clear gradient in community structure with depth and year in the nMDS ordination (Figure 4). The greatest separation occurred by depth, with samples from 5–10 m grouping to the left of the plot, while those from 15–20 and 20–25 m grouped to the right. In addition, there was a separation between sampling years, with 1992–1993 at the top and 2016–2017 at the bottom of the plot. The distance between years is more evident in the 5–10 m depth stratum.
SIMPER analysis identified which species were the main ones responsible for differences and similarities in the assemblage structure. Average similarity was higher in 2016–2017 samples in comparison to 1992–1993, especially at the two extreme depth strata (Table 2). Seven species accounted for 83% and 68% of the assemblage characterization at the shallowest depth. However, the species and/or their contributions differed depending on the sampling period. Most of these species characterized this stratum (Chamelea gallina, Donax semistriatus, Liocarcinus vernalis, Diogenes pugilator, Acanthocardia tuberculata, Tritia mutabilis, and Mactra stultorum), except Spisula subtruncata and Penaeus kerathurus, which also characterized the 15–20 m stratum. Table 2 shows how most of the dominant species found in the 15–20 m stratum were also abundant at 20–25 m depth (Turritellinella tricarinata, Bolinus brandaris, Aporrhais pespelecani, Bivetiella cancellata, Goneplax rhomboides, Astropecten irregularis, Liocarcinus depurator, and Medorippe lanata). The average dissimilarity between time periods was the highest at the 5–10 m stratum and decreased with depth (Table 3). Seventeen species were found to be important discriminators considering all the strata. Some of these species accounted for 56–77% of the assemblage differences between years; thus, abundances of these species were explored further.
The mean densities of these discriminator species showed different trends, with a tendency for higher densities in the first sampling period (see Figure 5 for trends and Table 4 for density numbers). Most species (T. tricarinata, A. pespelecani, T. mutabilis, L. vernalis, Ophiura ophiura, and M. stultorum) did not show changes in their bathymetric distribution between periods. In detail, the gastropod T. tricarinata increased its density with depth, being less abundant in 2016–2017. The gastropod A. pespelecani was absent at 0–5 m depth but was more abundant at 15–20 m than at 20–25 m depth, showing the lowest densities in 2016–2017. Densities of T. mutabilis, L. vernalis, and O. ophiura decreased with depth, showing higher abundances in 1992–1993 (except L. vernalis in the 15–20 stratum). The bivalves M. stultorum, S. subtruncata, and the hermit crab D. pugilator decreased their density with depth. Mactra stultorum was absent at the 20–25 m stratum, whereas S. subtruncata and D. pugilator were absent at this depth only in 2016–2017. Acanthocardia tuberculata density decreased with depth in 1992–1993, but no specimen was found in 2016–2017.
Other species, e.g., B. brandaris, L. depurator, A. irregularis, G. rhomboides, and B. cancellata, changed their bathymetric distribution pattern between sampling periods (Figure 5). Highest densities of B. brandaris were found at 15–20 m in 1992–1993, but in 2016–2017, the highest densities were found at the deepest stratum. The crab L. depurator was more abundant at 5–10 and 20–25 m than at 15–20 m depth in 1992–1993, whereas during the second sampling period its densities were much lower, except for the 15–20 m stratum. The seastar A. irregularis decreased its density with depth in 1992–1993 but showed a similar density by stratum in 2016–2017. The crab G. rhomboides increased its density with depth, except at 20–25 m, in 2016–2017, but in 1992–1993 it was absent at 5–10 m depth. A similar pattern of increasing density with depth was found in B. cancellata, except for its higher abundance at 20–25 m than at 15–20 m in 2016–2017. Finally, some species were barely present in the second studied period, especially those whose distribution was mainly restricted to the 5–10 m depth stratum, such as C. gallina and D. semistriatus.

3.3. Biodiversity

Average values and standard deviations for the three indices of the univariate diversity measures within each depth strata and period sample are shown in Figure 6. In detail, species richness (S) ranged between 30 and 48; Shannon–Wiener (H’) between 0.2 and 1.8, and Pielou’s evenness (J’) between 0.3 and 0.6. Species richness was significantly lower (p < 0.05) in 1992–93. Differences in S were also significant according to depth, with the lowest value found at 5–10 m (Table 5, Figure 6). The Shannon–Wiener index (H’) showed significant differences between years and among depth strata, with the interaction factor also being significant. H’ was higher in 2016–2017 than in 1992–1993 at all the different depths except for 20–25 m. In more detail, H’ was the highest at 15–20 m, especially in 2016–2017. Evenness showed significant differences between 15–20 m and 20–25 m, with higher values at the highest depth, but no differences were found between years.

3.4. Biomass

An important biomass (kg km−2) decrease was observed between 1992–93 and 2016–2017, representing losses of 99.3%, 66.6%, and 52.7% in the depth strata 5–10, 15–20 and 20–25 m, respectively (Table 4). The large biomass declines at 5–10 m depth affected all the main taxa, with the exception of Asteroidea (specifically A. irregularis, which was the only species belonging to this group in the samples), with a much lower reduction (38.3%). At 15–20 m depth, seven of the main ten taxa reduced their biomass (62.5–94.8%) in 2016–2017, with the exception of Asteroidea, Echinoidea, and, to a lesser extent, Malacostraca, which showed a biomass increase (10.8–101.6%). At 20–25 m depth, only Asteroidea (mainly A. irregularis) increased its biomass (152.3%), whereas the rest of the taxa decreased between 2.2% and 93.6%. The 5–10 m bathymetric stratum in 1992–1993 held the highest overall mean biomass (121,672 kg km−2), with a main contribution from bivalves and ophiuroids (specifically O. ophiura, the only species belonging to this group in the samples). The other strata also showed a higher biomass in 1992–1993.

4. Discussion

The benthic megainvertebrate assemblages of the Ebre Delta coastal waters changed in composition and structure in two time periods. The diversity indexes did not show remarkable variations, but there was a decrease in density and biomass for most species and in all three depth strata, evidenced at the shallowest stratum (5–10 m depth) for bivalve mollusks, which characterize this type of bottom [17,30,31]. Within mollusks, bivalves have been used as indicators of ecosystem disturbance and instability [32,33,34], and most species are considered very sensitive to stress [35]. Bivalve populations have declined to the point that there are no profitable exploitations left in some areas of the Catalan coast; nonetheless, in the Ebre Delta, some populations had remained productive for longer [36,37,38]. It is worth highlighting the disappearance of the bivalve Acanthocardia tuberculata and the huge biomass decrease in the brittle star Ophiura ophiura in the shallowest stratum, both species collected as bycatch in the Chamelea gallina fishery in Spain [17,39,40,41]. It is difficult to establish a direct cause to explain the biomass changes obtained in this study, but the influence of fishing pressure and/or environmental conditions have been described as the main factors altering the benthic communities [36,42,43,44].
Towed bottom fishing gears have variable effects on species richness and biomass, depending on the characteristics of the gear, fishing effort, and habitat [45]. The effects of fishing gears are usually lower in areas where natural disturbance is high [43,44,46], such as estuaries and shallow waters, e.g., the Ebre Delta. Some effects of natural disturbances include erosion of the seabed sediment, resuspension, and alteration of settlement/recruitment success [47,48,49]. Such effects favor highly resilient species able to withstand high levels of environmental variability and natural disturbance [50,51]. Long-living, sessile, and suspension-feeding organisms show the greatest declines in response to trawling disturbance, which, in turn, affect the structure and function of the community [52]. In the study area, fisheries might be considered as a potential cause that reduced the biomass of commercial species, such as C. gallina and co-occurring species (i.e., A. tuberculata and O. ophiura). It is noteworthy that the intensity of fishing with “rastell” in the studied area was progressively reduced from 64 vessels in 1992–1993 to 21 in 2016–2017 [53].
The Ebre Delta coastal area is a dynamic ecosystem subject to flooding, erosion, extreme events, and changes in its morphological configuration, which have made this area very vulnerable to the threats of global change [54]. The increase in water temperature is already causing changes in species composition and abundance in the Mediterranean [55], giving an advantage to tropical invasive species over the native ones [56]. For instance, the blue crab (Callinectes sapidus), an invasive species in the Mediterranean, has the potential to exert a large effect in the benthic communities of the Ebre Delta because of its high predation on bivalves [57]. The increasing frequency and intensity of storms is also considered a main problem of climate change in coastal zones because their effects on the biota can be severe, especially on shallow depths <25 m [58].
Depth is a well-known driving force structuring biological communities in coastal [7,17,30], continental shelf and slope [59,60,61], and deep waters [62,63]. It is difficult to ascertain whether depth is a prime cause determining the differences in the benthic assemblages observed or other related factors may influence them as well, such as hydrodynamics, sediment grain size, or temperature. In the Ebre Delta, waves and coastal currents, also linked to seasonal and interannual variability in river discharges and large-scale regeneration in sandy littoral areas, are the most important forcing agents to mobilize and transport coastal sediments [64]. The transition in granulometry from the nearshore sand to the prodeltaic mud occurring at water depths from 6 to 20 m [24] could explain the main differences among fauna communities at 5–10 m depth, more characteristic of sandy bottoms [17]. The differences in the megafauna community between 15–20 and 20–25 m could also be related to sediment composition and texture. Species such as the gastropod T. tricarinata, which characterized the highest depth communities in 1992–1993, are known to be associated with unstable environments having transitional characteristics from coarse to muddy detritic bottoms [30].
The soft bottoms of the infralittoral Ebre Delta examined in the present work harbored a total of 144 taxa. Mollusks and crustaceans are known to be the most species-rich groups in shallow soft bottoms [30,31,65], although our results showed that bony fishes were the most species-rich zoological group, followed by bivalves. The relatively high fish species richness can be attributed to the dredge used in our study, which had larger dimensions (width and mesh size) and was towed at a higher boat speed, allowing the collection of both slow-moving fish and invertebrates, which were not collected by the dredges used in other studies [30,31,65]. In general, our hypothesis of a general loss of sensitive species with time was not supported by the results since a decrease in diversity was not found, with the exception of the disappearance of A. tuberculata.
The reduction in biodiversity increasingly observed worldwide has been emphasized as a global environmental concern for conservation and management strategies [66]. Even though our study did not show a loss of diversity, it did quantify a great decrease in invertebrate biomass. There is a huge knowledge gap in marine ecosystems related to declines in the occurrence and abundance of invertebrates, but their disappearance may have dramatic consequences for the ecosystems [67,68,69], as reported for terrestrial vertebrate species [70]. The near shore biota contributes to both structural diversity and trophic base, and invertebrate communities are a key part of these assemblages, having an important input to ecological services [71]. As an example, bivalve beds provide nutrient remediation and carbon sequestration, coastal defense, and food provision [72,73]. The IPBES regional assessment report on biodiversity and ecosystem services for Europe and Central Asia stated that 59% of the benthic shallow habitats in the Mediterranean Sea are too data deficient to make informed decisions regarding the conservation and sustainable use of biodiversity [74], highlighting the importance of the present study. In environments such as the Ebre Delta, a vulnerable habitat with international and state protection, scientific studies of temporal changes in megainvertebrate communities are of great importance to overseeing the health of the ecosystem. Further efforts are needed to increase monitoring of megainvertebrates in coastal areas and relate spatiotemporal trends with environmental data to improve management and conservation measures.

5. Conclusions

The collection, identification, and quantification of the benthic invertebrates from the shallow soft bottoms of the Ebre Delta resulted in significant differences in the community composition and structure between 1992–1993 and 2016–2017 and between depth strata (5–10, 15–20, and 20–25 m). A great and worrying decrease in the density and biomass of most species was detected in all the depth strata examined, but especially at the shallowest stratum. We evidenced that the megafauna collected by scientific shellfish surveys provided complementary and useful information to evaluate the state and health of benthic ecosystems. Our results set a reference point for future studies and aim to encourage the establishment of monitoring systems in coastal areas based on larger invertebrates that, together with environmental surveys, will help management decision making and implement biodiversity conservation policies.

Supplementary Materials

The following supporting information can be downloaded at: https://www.mdpi.com/article/10.3390/d15050623/s1, Table S1: Faunistic lists, percentage of occurrence (% OCC) and depth range (min, max) of all species collected.

Author Contributions

Conceptualization, M.R.; investigation, E.M.-H., E.G. and L.R.; formal analysis, M.R. and P.A.; writing—original draft preparation, M.R.; writing—review and editing, E.M.-H., E.G. and P.A.; funding acquisition, M.R. All authors have read and agreed to the published version of the manuscript.

Funding

This study is part of the research projects “Análisis del impacto de la pesca con ’rastell’ sobre las poblaciones de organismos marinos” and “Evaluación y seguimiento del Plan de Gestión de Dragas para Embarcación”, ref. AG-2016-233, funded by the Department d’Agricultura, Ramaderia i Pesca (Generalitat de Catalunya, Spain).

Institutional Review Board Statement

Not applicable.

Data Availability Statement

The data that support the findings of this study are available from the corresponding author, upon request.

Acknowledgments

We gratefully acknowledge the boat captain and sailor of the fishing vessels “Germans Cabré” and “Polit” from Sant Carles de la Ràpita. We also thank all the participants from the 1992–1993 surveys, especially its PI, P. Sánchez. Toni Lombarte helped in the identification of fishes and Sara Soto helped with mapping.

Conflicts of Interest

The authors declare no conflict of interest.

References

  1. Coll, M.; Piroddi, C.; Steenbeek, J.; Kaschner, K.; Ben Rais Lasram, F.; Aguzzi, J.; Ballesteros, E.; Bianchi, C.N.; Corbera, J.; Dailianis, T.; et al. The biodiversity of the Mediterranean Sea: Estimates, patterns, and threats. PLoS ONE 2010, 5, e11842. [Google Scholar] [CrossRef] [PubMed]
  2. Dauvin, J.C. Paradox of estuarine quality: Benthic indicators and indices, consensus or debate for the future. Mar. Pollut. Bull. 2007, 55, 271–281. [Google Scholar] [CrossRef]
  3. Dauvin, J.C.; Gomez Gesteira, J.L.; Salvande Fraga, M. Taxonomic sufficiency: An overview of its use in the monitoring of sublittoral benthic communities after oil spills. Mar. Pollut. Bull. 2003, 46, 552–555. [Google Scholar] [CrossRef]
  4. Labrune, C.; Grémare, A.; Amouroux, J.M.; Sardá, R.; Gil, J.; Taboada, S. Structure and diversity of shallow soft bottom benthic macrofauna in the Gulf of Lions (NW Mediterranean). Helgol. Mar. Res. 2008, 62, 201–214. [Google Scholar] [CrossRef]
  5. Labrune, C.; Gauthier, O.; Conde, A.; Grall, J.; Blomqvist, M.; Bernard, G.; Gallon, G.; Dannheim, J.; van Hoey, G.; Grémare, A. A general-purpose biotic index to measure changes in benthic habitat quality across several pressure gradients. J. Mar. Sci. Eng. 2021, 9, 654. [Google Scholar] [CrossRef]
  6. Pinedo, S.; Jordana, E.; Manzanera, M.; Ballesteros, E. Using MEDOCC (MEDiterranean OCCidental) index to evaluate the ecological status of Catalan coastal waters (Northwestern Mediterranean Sea) over time and depths. Handb. Environ. Chem. 2016, 43, 201–225. [Google Scholar]
  7. Rufino, M.M.; Pereira, A.M.; Pereira, F.; Moura, P.; Vasconcelos, P.; Gaspar, M.B. Habitat structure shaping megabenthic communities inhabiting subtidal soft bottoms along the Algarve coast (Portugal). Hydrobiologia 2017, 784, 249–264. [Google Scholar] [CrossRef]
  8. Beukema, J.J.; Dekker, R.; Drent, J. Parallel changes of Limecola (Macoma) balthica populations in the Dutch Wadden Sea. Mar. Ecol. Prog. Ser. 2017, 585, 71–79. [Google Scholar] [CrossRef]
  9. Kröncke, I.; Zeiss, B.; Rensing, C. Long-term variability in macrofauna species composition off the island of Norderney (East Frisia, Germany) in relation to changes in climatic and environmental conditions. Senckenb. Marit. 2001, 31, 65–82. [Google Scholar] [CrossRef]
  10. Sagarin, R.D.; Barry, J.P.; Gilman, S.E.; Baxter, C.H. Climate related changes in an intertidal community over short and long time scales. Ecol. Monogr. 1999, 69, 465–490. [Google Scholar] [CrossRef]
  11. Lamela-Silvarrey, C.; Fernández, C.; Anadón, R.; Arrontes, J. Fucoid assemblages on the north coast of Spain: Past and present (1977–2007). Bot. Mar. 2012, 55, 199–207. [Google Scholar] [CrossRef]
  12. Grémare, A.; Amouroux, J.M.; Vétion, G. Long-term comparison of macrobenthos within the soft bottoms of the Bay of Banyuls-sur-mer (northwestern Mediterranean Sea). J. Sea Res. 1998, 40, 281–302. [Google Scholar] [CrossRef]
  13. Labrune, C.; Grémare, A.; Guizien, K.; Amouroux, J.M. Long-term comparison of soft bottom macrobenthos in the Bay of Banyuls-sur-Mer (north-western Mediterranean Sea): A reappraisal. J. Sea Res. 2007, 58, 125–143. [Google Scholar] [CrossRef]
  14. Brind’Amour, A.; Laffargue, P.; Morin, J.; Vaz, S.; Foveau, A.; Le Bris, H. Morphospecies and taxonomic sufficiency of benthic megafauna in scientific bottom trawl surveys. Cont. Shelf Res. 2014, 72, 1–9. [Google Scholar] [CrossRef]
  15. Bertrand, J.A.; De Sola, L.G.; Papaconstantinou, C.; Relini, G.; Souplet, A. The general specifications of the MEDITS surveys. Sci. Mar. 2002, 66, 9–17. [Google Scholar] [CrossRef]
  16. Spedicato, M.T.; Massutí, E.; Mérigot, B.; Tserpes, G.; Jadaud, A.; Relini, G. The MEDITS trawl survey specifications in an ecosystem approach to fishery management. Sci. Mar. 2019, 83, 9–20. [Google Scholar] [CrossRef]
  17. Pubill, E.; Abelló, P.; Ramón, M.; Baeta, M. Faunistic assemblages of a sublittoral coarse sand habitat of the northwestern Mediterranean. Sci. Mar. 2011, 75, 189–196. [Google Scholar]
  18. Santelli, A.; Cvitković, I.; Despalatović, M.; Fabi, G.; Grati, F.; Marčeta, B.; Punzo, E.; Raicevich, S.; Strafella, P.; Spagnolo, A.; et al. Spatial persistence of megazoobenthic assemblages in the Adriatic Sea. Mar. Ecol. Prog. Ser. 2017, 566, 31–48. [Google Scholar] [CrossRef]
  19. Raaijmakers, R.; Krywkow, J.; Van der Veen, A. Flood risk perceptions and spatial multi-criteria analysis: An exploratory research for hazard mitigation. Nat. Hazards 2008, 46, 307–322. [Google Scholar] [CrossRef]
  20. Stratmann, T.; van Oevelen, D.; Martínez Arbizu, P.; Wei, C.-L.; Liao, J.-X.; Cusson, M.; Scrosati, R.A.; Archambault, P.; Snelgrove, P.V.R.; Ramey-Balci, P.A.; et al. The BenBioDen database, a global database for meio-, macro- and megabenthic biomass and densities. Sci. Data 2020, 7, 206. [Google Scholar] [CrossRef]
  21. Lyons, D.A.; Benedetti-Cecchi, L.; Frid, C.L.J.; Vinebrooke, R.D. Modifiers of impacts on marine ecosystems: Disturbance regimes, multiple stressors and receiving environments. In Marine Ecosystems: Human Impacts on Biodiversity, Functioning and Services; Crowe, T.P., Frid, C.L.J., Eds.; Cambridge University Press: Cambridge, UK, 2015; pp. 73–110. [Google Scholar]
  22. Borja, A.; Elliott, M.; Carstensen, J.; Heiskanen, A.-S.; Bund, W. Marine management—Towards an integrated implementation of the European Marine Strategy Framework and the Water Framework Directives. Mar. Pollut. Bull. 2010, 60, 2175–2186. [Google Scholar] [CrossRef] [PubMed]
  23. Jennings, S.; Smith, A.D.; Fulton, E.A.; Smith, D.C. The ecosystem approach to fisheries: Management at the dynamic interface between biodiversity conservation and sustainable use. Ann. N. Y. Acad. Sci. 2014, 1322, 48–60. [Google Scholar] [CrossRef]
  24. Palanques, A.; Puig, P.; Guillén, J.; Jiménez, J.; Gracia, V.; Sánchez-Arcilla, A.; Madsen, O. Near-bottom suspended sediment fluxes on the microtidal low-energy Ebro continental shelf (NW Mediterranean). Cont. Shelf Res. 2002, 22, 285–303. [Google Scholar] [CrossRef]
  25. Guillen, J.; Palanques, A. A shoreface zonation in the Ebro Delta based on grain size distribution. J. Coast. Res. 1997, 13, 867–878. [Google Scholar]
  26. Palanques, A.; Guillén, J. Coastal changes in the Ebro delta: Natural and human factors. J. Coast. Conserv. 1998, 4, 17–26. [Google Scholar]
  27. Martín, P.; Sánchez, P.; Ramón, M. Population structure and exploitation of Bolinus brandaris (Mollusca: Gastropoda) off the Catalan coast (northwestern Mediterranean). Fish. Res. 1995, 23, 319–331. [Google Scholar] [CrossRef]
  28. Clarke, K.R.; Warwick, R.M. Change in Marine Communities: An Approach to Statistical Analysis and Interpretation; PRIMER-E, Ed.; Plymouth Marine Laboratory: Plymouth, UK, 2001. [Google Scholar]
  29. Anderson, M.J.; Gorley, R.N.; Clarke, K.R. PERMANOVA+for PRIMER: Guide to Software and Statistical Methods; PRIMER-E: Plymouth, UK, 2008; p. 218. [Google Scholar]
  30. Marina, P.; Rueda, J.L.; Urra, J.; Salas, C.; Gofas, S.; García Raso, J.E.; Moya, F.; García, T.; López-González, N.; Laiz-Carrión, R.; et al. Sublittoral soft bottom assemblages within a Marine Protected Area of the northern Alboran Sea. J. Mar. Biolog. Assoc. UK 2015, 95, 871–884. [Google Scholar] [CrossRef]
  31. Urra, J.; Gofas, S.; Rueda, J.L.; Marina, P. Molluskan assemblages in littoral soft bottoms of the Alboran Sea (Western Mediterranean Sea). Mar. Biol. Res. 2011, 7, 27–42. [Google Scholar] [CrossRef]
  32. Bedulli, D.; Bassignani, F.; Bruschi, A. Use of biodiversity hotspots for conservation of marine molluscs: A regional approach. Med. Mar. Sci. 2002, 3, 113–121. [Google Scholar] [CrossRef]
  33. Gladstone, W. The potential value of indicator groups in the selection of marine reserves. Biol. Conserv. 2002, 104, 211–220. [Google Scholar] [CrossRef]
  34. Nerlović, V.; Doğan, A.; Hrs-Brenko, M. Response to oxygen deficiency (depletion): Bivalve assemblages as an indicator of ecosystem instability in the northern Adriatic Sea. Biologia 2011, 66, 1114–1126. [Google Scholar] [CrossRef]
  35. Borja, A.; Franco, J.; Pérez, V. A marine biotic index to establish the ecological quality of soft-bottom benthos within European estuarine and coastal environments. Mar. Pollut. Bull. 2000, 40, 1100–1114. [Google Scholar] [CrossRef]
  36. Baeta, M.; Ramón, M.; Galimany, E. Decline of a Callista chione (Bivalvia: Veneridae) bed in the Maresme coast (northwestern Mediterranean Sea). Ocean Coast. Manag. 2014, 93, 15–25. [Google Scholar] [CrossRef]
  37. Dang, C.; de Montaudouin, X.; Gam, M.; Paroissin, C.; Bru, N.; Caill-Milly, N. The Manila clam population in Arcachon Bay (SW France): Can it be kept sustainable? J. Shellfish Res. 2010, 63, 108–118. [Google Scholar] [CrossRef]
  38. Delgado, M.; Silva, L.; Gómez, S.; Masferrer, E.; Cojan, M.; Gaspar, M.B. Population and production parameters of the wedge clam Donax trunculus (Linnaeus, 1758) in intertidal areas on the southwest Spanish coast: Considerations in relation to protected areas. Fish. Res. 2017, 193, 232–241. [Google Scholar] [CrossRef]
  39. Peharda, M.; Ezgeta Balic, D.; Radman, M.; Sinjkević, N. Age, growth and population structure of Acanthocardia tuberculata (Bivalvia: Cardiidae) in the eastern Adriatic Sea. Sci. Mar. 2012, 76, 59–66. [Google Scholar]
  40. Ramón, M.; Cano, J.; Peña, J.B.; Campos, M.J. Current status and perspectives of mollusc (bivalves and gastropods) culture in the Spanish Mediterranean. Bol. Inst. Esp. Oceanogr. 2005, 21, 361–373. [Google Scholar]
  41. Demestre, M.; Sartor, P.; Garcia-de-Vinuesa, A. Ecological importance of survival of unwanted invertebrates discarded in different NW Mediterranean trawl fisheries. Sci. Mar. 2018, 82, 189–198. [Google Scholar] [CrossRef]
  42. Cloern, J.E.; Abreu, P.C.; Carstensen, J.; Chauvaud, L.; Elmgren, R.; Grall, J.; Greening, H.; Johansson, J.O.R.; Kahru, M.; Sherwood, E.T.; et al. Human activities and climate variability drive fast-paced change across the world’s estuarine–coastal ecosystems. Glob. Chang. Biol. 2016, 22, 513–529. [Google Scholar] [CrossRef]
  43. Collie, J.S.; Hall, S.J.; Kaiser, M.J.; Poiner, I.R. A quantitative analysis of fishing impacts on shelf-sea benthos. J. Anim. Ecol. 2000, 69, 785–798. [Google Scholar] [CrossRef]
  44. Kaiser, M.J.; Clarke, K.R.; Hinz, H.; Austen, M.C.V.; Somerfield, P.J.; Karakassis, I. Global analysis and prediction of the response of benthic biota and habitats to fishing. Mar. Ecol. Prog. Ser. 2006, 311, 1–14. [Google Scholar] [CrossRef]
  45. Thrush, S.F.; Dayton, P.K. Disturbance to marine benthic habitats by trawling and dredging; implications for marine biodiversity. Annu. Rev. Ecol. Evol. Syst. 2002, 33, 449–473. [Google Scholar] [CrossRef]
  46. Lambert, G.I.; Jennings, S.; Kaiser, M.J.; Hinz, H.; Hiddink, J.G. Quantification and prediction of the impact of fishing on epifaunal communities. Mar. Ecol. Prog. Ser. 2011, 430, 71–86. [Google Scholar] [CrossRef]
  47. Hunt, H.L.; Scheibling, R.E. Role of early post-settlement mortality in recruitment of benthic marine invertebrates. Mar. Ecol. Prog. Ser. 1997, 155, 269–301. [Google Scholar] [CrossRef]
  48. Morris, A.W.; Howarth, M.J. Bed stress induced sediment resuspension. Cont. Shelf Res. 1998, 18, 1203–1213. [Google Scholar] [CrossRef]
  49. Thistle, D. Natural physical disturbances and communities of marine soft bottoms. Mar. Ecol. Prog. Ser. 1981, 6, 223–228. [Google Scholar] [CrossRef]
  50. Jennings, S.; Kaiser, M.J. The effects of fishing on marine ecosystems. Adv. Mar. Biol. 1998, 34, 201–352. [Google Scholar]
  51. Kaiser, M.J. Significance of bottom-fishing disturbance. Conserv. Biol. 1998, 12, 1230–1235. [Google Scholar] [CrossRef]
  52. De Juan, S.; Thrush, S.F.; Demestre, M. Functional changes as indicators of trawling disturbance on a benthic community located in a fishing ground (NW Mediterranean Sea). Mar. Ecol. Prog. Ser. 2007, 334, 117–129. [Google Scholar] [CrossRef]
  53. DARP. ORDRE ARP/114/2018, de 6 de Juliol, per la Qual S’aprova el Pla de Gestió per a les Embarcacions de Marisqueig Amb Dragues per a Embarcació; Departament d’Agricultura, Ramaderia, Pesca i Alimentació, Diari Oficial de la Generalitat de Catalunya: Barcelona, Spain, 2018; p. 7. [Google Scholar]
  54. Rodríguez-Santalla, I.; Navarro, N. Main threats in Mediterranean coastal wetlands. The Ebro Delta case. J. Mar. Sci. Eng. 2021, 9, 1190. [Google Scholar] [CrossRef]
  55. MedECC. Climate and Environmental Change in the Mediterranean Basin—Current Situation and Risks for the Future. First Mediterranean Assessment report; Cramer, W., Guiot, J., Marini, K., Eds.; Union for the Mediterranean, Plan Bleu, UNEP/MAP: Marseille, France, 2020; p. 632. [Google Scholar]
  56. Anadón, R.A.; Danovaro, R.; Dippner, J.W.; Drinkwater, K.F.; Hawkins, S.J.; O’Sullivan, G.; Oguz, T.; Reid, P.C. Impacts of Climate Change on the European Marine and Coastal Environment; European Science Foundation: Strasbourg, France, 2007; pp. 1–84. [Google Scholar]
  57. Prado, P.; Peñas, A.; Ibáñez, C.; Cabanes, P.; Jornet, L.; Álvarez, N.; Caiola, N. Prey size and species preferences in the invasive blue crab, Callinectes sapidus: Potential effects in marine and freshwater ecosystems. Estuar. Coast. Shelf Sci. 2020, 245, 106997. [Google Scholar] [CrossRef]
  58. Amores, A.; Marcos, M.; Carrió, D.S.; Gómez-Pujol, L. Coastal impacts of Storm Gloria (January 2020) over the north-western Mediterranean. Nat. Hazards Earth Syst. Sci. 2020, 20, 1955–1968. [Google Scholar] [CrossRef]
  59. Abelló, P.; Carbonell, A.; Torres, P. Biogeography of epibenthic crustaceans on the shelf and upper slope off the Iberian Peninsula Mediterranean coasts: Implications for the establishment of natural management areas. Sci. Mar. 2002, 66, 183–198. [Google Scholar] [CrossRef]
  60. Abelló, P.; Valladares, F.J.; Castellón, A. Analysis of the structure of decapod crustacean assemblages off the Catalan coast (North West Mediterranean). Mar. Biol. 1988, 98, 39–49. [Google Scholar] [CrossRef]
  61. DeLaHoz, M.V.; Sardà, F.; Coll, M.; Sáez, R.; Mechó, A.; Oliva, F.; Ballesteros, M.; Palomera, I. Biodiversity patterns of megabenthic non-crustacean invertebrates from an exploited ecosystem of the Northwestern Mediterranean Sea. Reg. Stud. Mar. Sci. 2018, 19, 47–68. [Google Scholar] [CrossRef]
  62. Cartes, J.; Sardà, F. Zonation of deep-sea decapod fauna in the Catalan Sea (Western Mediterranean). Mar. Ecol. Prog. Ser. 1993, 94, 27–34. [Google Scholar] [CrossRef]
  63. Ramón, M.; Abelló, P.; Ordines, F.; Massutí, E. Deep epibenthic communities in two contrasting areas of the Balearic Islands (western Mediterranean). J. Mar. Syst. 2014, 138, 182–193. [Google Scholar] [CrossRef]
  64. Jiménez, J.A.; Sánchez-Arcilla, A.; Bou, J.; Ortiz, M.A. Analysing short-term shoreline changes along the Ebro Delta (Spain) using aerial photographs. J. Coast. Res. 1997, 13, 1256–1266. [Google Scholar]
  65. Rufino, M.M.; Gaspar, M.B.; Pereira, A.M.; Maynou, F.; Monteiro, C.C. Ecology of megabenthic bivalve communities from sandy beaches on the south coast of Portugal. Sci. Mar. 2010, 74, 163–178. [Google Scholar] [CrossRef]
  66. Collen, B.; Böhm, M.; Kemp, R.; Baillie, J. Spineless: Status and Trends of the World’s Invertebrates; Zoological Society of London: London, UK, 2012; p. 86. [Google Scholar]
  67. Dirzo, R.; Young, H.S.; Galetti, M.; Ceballos, G.; Isaac, N.J.B.; Collen, B. Defaunation in the Anthropocene. Science 2014, 345, 401–406. [Google Scholar] [CrossRef]
  68. Eisenhauer, N.; Bonn, A.; Guerra, C.A. Recognizing the quiet extinction of invertebrates. Nat. Commun. 2019, 10, 50. [Google Scholar] [CrossRef] [PubMed]
  69. Hallmann, C.A.; Sorg, M.; Jongejans, E.; Siepel, H.; Hofland, N.; Schwan, H.; Stenmans, W.; Müller, A.; Sumser, H.; Hörren, T.; et al. More than 75 percent decline over 27 years in total flying insect biomass in protected areas. PLoS ONE 2017, 12, e0185809. [Google Scholar] [CrossRef]
  70. Ceballos, G.; Ehrlich, P.R.; Dirzo, R. Biological annihilation via the ongoing sixth mass extinction signaled by vertebrate population losses and declines. Proc. Natl. Acad. Sci. USA 2017, 114, E6089–E6096. [Google Scholar] [CrossRef] [PubMed]
  71. Rife, G.S. Ecosystem services provided by benthic macroinvertebrate assemblages in marine coastal zones. In Ecosystem Services and Global Ecology; Hufnagel, L., Ed.; InTech Open: Rijeka, Croatia, 2018; pp. 61–79. [Google Scholar]
  72. Dame, R.F. Ecology of Marine Bivalves: An Ecosystem Approach; CRC Press: Boca Raton, FL, USA, 1996; p. 272. [Google Scholar]
  73. Newell, R.I.E. Ecosystem influences of natural and cultivated populations of suspension-feeding bivalve molluscs: A review. J. Shellfish Res. 2004, 23, 51–61. [Google Scholar]
  74. IPBES. Regional Assessment Report on Biodiversity and Ecosystem Services for Europe and Central Asia; IPBES: Bonn, Germany, 2018; p. 48. [Google Scholar]
Figure 1. Map detailing the location of the hauls. Blue squares correspond to the November 1992–October 1993 and red circles to the October 2016–September 2017 samplings. Small gray points limit a coastal protected area where bottom trawling is not allowed.
Diversity 15 00623 g001
Figure 2. Species number of the taxa collected by sampling period.
Diversity 15 00623 g002
Figure 3. Frequency of occurrence of the taxa collected by sampling period.
Diversity 15 00623 g003
Figure 4. nMDS ordination of benthic assemblages. Codes for sampling periods 1992–1993 and 2016–2017 are 93 and 17, respectively.
Diversity 15 00623 g004
Figure 5. Mean density (Log10 number km−2) of species determined by SIMPER as being main contributors to differences in assemblage structure between both sampled periods. The period 2016–2017 is represented by triangles and a continuous line while the 1992–1993 is represented by circles and a discontinuous line. Values of density equal or near 0 that log-logged negative are represented in the graph as a zero value.
Diversity 15 00623 g005
Figure 6. Univariate diversity measures: Total number of species (S ± SE), Shannon diversity (H’ ± SE), and evenness (J’ ± SE) calculated for each sampling year and depth stratum.
Diversity 15 00623 g006
Table 1. Summary of the PERMANOVA results for the analysis of differences in assemblage structure across the different factors and post hoc pairwise contrasts for the interaction term. Significant results (p < 0.05) are indicated by *.
Overall PERMANOVA
Source of VariationdfSSMSPseudo-F p (Perm)
Depth strata228,46914,23422.3870.0001 *
Year110,07710,07715.8480.0001 *
Depth strata x Year29805.84902.97.7110.0001 *
Residual3320,983635.8--
Pairwise test for pairs of levels of factor ‘Depth strata’
p (Perm)p (Perm)
Contrast1992–19332016–2017
0–5 m vs. 15–20 m0.0078 *0.0122 *
0–5 m vs. 20–25 m0.0004 *0.002 *
15–20 m vs. 20–25 m0.0014 *0.0001 *
Pairwise test for pairs of levels of factor ‘Year’
p (Perm)p (Perm)p (Perm)
Contrast0–5 m 15–20 m20–25 m
93 vs. 170.0177 *0.005 *0.0001 *
Table 2. Summary of SIMPER similarity analysis for each significant group according to PERMANOVA results. Av. D: normalized average density (n km−2), Contr%: percentage contribution to the similarity, Cum%: cumulative percentage.
5–10 m 5–10 m
1992–1993 2016–2017
Average similarity: 51.10 Average similarity: 64.20
Species Av. DContr% Species Av. DContr%
Chamelea gallina 3252.1127.67 Liocarcinus vernalis 285.6522.29
Spisula subtruncata 5624.1118.19 Mactra stultorum 214.612.05
Donax semistriatus 1183.838.16 Diogenes pugilator 145.89.09
Liocarcinus vernalis 916.457.7 Chamelea gallina 100.276.43
Diogenes pugilator 849.587.66 Penaeus kerathurus 75.176.41
Acanthocardia tuberculata 758.67.33 Spisula subtruncata 112.736.19
Tritia mutabilis 711.236.05 Tritia mutabilis 78.915.95
Cum% 82.75 Cum% 68.41
15–20 m 15–20 m
1992–1993 2016–2017
Average similarity: 59.40 Average similarity: 61.72
Species Av. DContr% Species Av. DContr%
Turritellinella tricarinata 533.5423.66 Liocarcinus depurator 136.2513.61
Spisula subtruncata 333.816.07 Bolinus brandaris 97.049.8
Bolinus brandaris 277.2713.35 Astropecten irregularis 69.137.5
Aporrhais pespelecani 130.586.26 Goneplax rhomboides 57.76.77
Bivetiella cancellata 124.175.99 Aporrhais pespelecani 65.836.09
Goneplax rhomboides 83.474.4 Penaeus kerathurus 465.87
Astropecten irregularis 684.23 Medorippe lanata 34.244.4
Cum% 73.96 Cum% 54.04
20–25 m 20–25 m
1992–1993 2016–2017
Average similarity: 51.58 Average similarity: 70.66
Species Av. DContr%SpeciesAv. DContr%
Turritellinella tricarinata 748.0728.07 Bolinus brandaris 35433.5
Bolinus brandaris 145.4614.29 Turritellinella tricarinata 148.9610.89
Goneplax rhomboides 94.787.85 Astropecten irregularis 78.487.84
Medorippe lanata 63.385.95 Medorippe lanata 43.44.59
Liocarcinus depurator 75.155.33 Arnoglossus laterna 36.983.75
Bivetiella cancellata 64.144.98 Alpheus glaber 38.823.3
Aporrhais pespelecani 54.853.48 Goneplax rhomboides 37.623.24
Cum% 69.94 Cum% 67.12
Table 3. Summary of SIMPER dissimilarity analysis for each significant group according to PERMANOVA results. Av. D: normalized average density (n km−2), Contr%: percentage contribution to the dissimilarity, Cum%: cumulative percentage.
Groups 5–10 m
Average dissimilarity = 98.30
1992–1993 2016–2017
Species Av. DAv. DContr%
Spisula subtruncata 5624.11112.7322.21
Chamelea gallina 3252.11100.2720.36
Donax semistriatus 1183.839.618.27
Acanthocardia tuberculata 758.605.2
Ophiura ophiura 1326.3888.785.17
Tritia mutabilis 711.2378.914.47
Diogenes pugilator 849.58145.84.38
Liocarcinus vernalis 916.45285.653.77
Mactra stultorum 609.88214.62.92
Cum.% 76.76
Groups 15–20 m
Average dissimilarity = 80.10
1992–19932016–2017
Species Av. DAv. DContr%
Turritellinella tricarinata 533.5451.6819.55
Spisula subtruncata 333.844.6512.54
Bolinus brandaris 277.2797.047.84
Liocarcinus depurator 23.98136.254.81
Bivetiella cancellata 124.1710.44.63
Liocarcinus vernalis 4.887.923.38
Aporrhais pespelecani 130.5865.833
Paguristes eremita 48.141.062.16
Cum.% 57.91
Groups 20–25 m
Average dissimilarity = 59.95
1992–19932016–2017
Species Av. DAv. DContr%
Turritellinella tricarinata 748.07148.9629.84
Bolinus brandaris 145.4635411.49
Astropecten irregularis 9.3178.483.81
Goneplax rhomboides 94.7837.623.48
Liocarcinus depurator 75.1514.013.45
Bivetiella cancellata 64.1416.782.75
Aporrhais pespelecani 54.8541.232.21
Cum.% 55.75
Table 4. Average biomass (kg km−2) of the main taxa by depth stratum and sampling period. Percentage (%) values correspond to the increase (+) or decrease (−) or each taxon comparing the first (1992–1993) with the second (2016–2017) sampling period.
5–10 m 15–20 m 20–25 m
CLASS1992–19932016–2017%1992–19932016–2017%1992–19932016–2017%
Holothuroidea 2.2 4.40.2−94.82.60.2−93.6
Ophiuroidea7912.711.7−99.92.20.8−62.50.30.1−73.1
Asteroidea46.328.6−38.310.718.270.48.722152.3
Echinoidea 1.12.3101.62.60.5−81.6
Cephalopoda999.57.4−99.316.22.9−828.68.4−2.2
Gastropoda392.25.9−98.591.516.4−82.117777.4−56.3
Bivalvia11,692.922.7−99.89.22−78.31.71.1−36.3
Malacostraca799.645−94.413.615.110.812.83.3−74.2
Elasmobranchii140.45−96.5 0.1 0.60.1−82.4
Teleostei178.82.7−98.56.62.3−65.23.71.8−50.5
Total 121,672856.4−99.31238.0413.5−66.61607.4759.9−52.7
Table 5. Two-factor ANOVA testing for differences in species richness (S), Shannon–Wiener diversity (H’), and evenness (J’) index in relation to year (1992–1993, 2016–2017) and depth strata (0–5, 15–20, 20–25).
Source of VariationdfSSMSFp
Species richness
Year1530.93530.9312.105<0.05
Depth2500.103250.055.701<0.05
Year x Depth2132.6866.341.513>0.05
Error331447.4543.86
Shannon–Wiener
Year11.4881.4885.203< 0.05
Depth22.8301.4154.948< 0.05
Year x Depth21.7790.8903.110<0.05
Error339.4370.286
Evenness
Year10.0710.0713.519> 0.05
Depth20.1990.0994.941< 0.05
Year x Depth20.1140.0572.830> 0.05
Error330.6630.020
Disclaimer/Publisher’s Note: The statements, opinions and data contained in all publications are solely those of the individual author(s) and contributor(s) and not of MDPI and/or the editor(s). MDPI and/or the editor(s) disclaim responsibility for any injury to people or property resulting from any ideas, methods, instructions or products referred to in the content.

