Article

Potential Effects of Habitat Change on Migratory Bird Movements and Avian Influenza Transmission in the East Asian-Australasian Flyway

1
Suisun Resource Conservation District, Suisun City, CA 94585, USA
2
U.S. Geological Survey, San Francisco Bay Estuary Field Station, Vallejo, CA 94592, USA
3
School of Biological Sciences, University of Oklahoma, Norman, OK 73019, USA
4
U.S. Geological Survey, Eastern Ecological Science Center, Laurel, MD 20708, USA
5
College of Life Sciences, Nanjing Normal University, Nanjing 210097, China
6
Ministry of Education Key Laboratory for Biodiversity Science and Ecological Engineering, School of Life Sciences, Fudan University, Shanghai 200438, China
7
College of Land Science and Technology, China Agricultural University, Beijing 100083, China
*
Author to whom correspondence should be addressed.
Diversity 2023, 15(5), 601; https://doi.org/10.3390/d15050601
Submission received: 6 March 2023 / Revised: 10 April 2023 / Accepted: 25 April 2023 / Published: 28 April 2023
(This article belongs to the Special Issue Spatiotemporal Bird Distribution and Conservation)

Abstract

:
Wild waterbirds, and especially wild waterfowl, are considered to be a reservoir for avian influenza viruses, with transmission likely occurring at the agricultural-wildlife interface. In the past few decades, avian influenza has repeatedly emerged in China along the East Asian-Australasian Flyway (EAAF), where extensive habitat conversion has occurred. Rapid environmental changes in the EAAF, especially distributional changes in rice paddy agriculture, have the potential to affect both the movements of wild migratory birds and the likelihood of spillover at the agricultural-wildlife interface. To begin to understand the potential implications such changes may have on waterfowl and disease transmission risk, we created dynamic Brownian Bridge Movement Models (dBBMM) based on waterfowl telemetry data. We used these dBBMM models to create hypothetical scenarios that would predict likely changes in waterfowl distribution relative to recent changes in rice distribution quantified through remote sensing. Our models examined a range of responses in which increased availability of rice paddies would drive increased use by waterfowl and decreased availability would result in decreased use, predicted from empirical data. Results from our scenarios suggested that in southeast China, relatively small decreases in rice agriculture could lead to dramatic loss of stopover habitat, and in northeast China, increases in rice paddies should provide new areas that can be used by waterfowl. Finally, we explored the implications of how such scenarios of changing waterfowl distribution may affect the potential for avian influenza transmission. Our results provide advance understanding of changing disease transmission threats by incorporating real-world data that predicts differences in habitat utilization by migratory birds over time.

1. Introduction

Highly pathogenic avian influenza (HPAI) viruses are a worldwide concern with major conservation, economic, and public health implications [1,2]. These viruses present an especially high risk in East Asia, where multiple subtypes have surfaced [3] and become endemic [4,5]. Previous research has shown that wild waterbirds, especially waterfowl, not only serve as reservoirs for avian influenza but may also travel long distances while infected [6,7,8,9] and maintain infections without displaying clinical signs [6,10,11,12]. In fact, concurrent outbreaks in domestic poultry and wild waterfowl [13,14] suggest that wild birds are potential vectors for HPAI [14,15,16] and may be driving global transmission [9,13,14,17,18]. The risks to agriculture and humans are greatest following transmission from wild to domestic birds. Transmission from wild birds to domestic poultry likely occurs at the agricultural-wildlife interface [19], where there is frequent contact between these groups. Although there is a risk of transmission anywhere poultry and wild birds coexist, some agricultural practices, such as backyard farming of mixed poultry species (chickens, geese, ducks, and pigeons) and live bird markets that sell domestic birds alongside captured wild birds [20], particularly increase the risk of transmission.
Due to the role of wild birds in the spread and persistence of HPAI, understanding the spatiotemporal distribution and movement patterns of these individuals is critical to any transmission modeling effort. Many waterbirds in the northern hemisphere take part in annual north-south migratory movements from northern breeding areas to southern wintering areas, driven by breeding instincts, food availability, and weather patterns [21]. Most migrants stop over and congregate in areas enroute for short-term refueling [22], although the distance of migration of species or populations may vary, and some do not migrate [23]. When the extent of natural wetlands decreases, many wild waterfowl species feed in agricultural areas, increasing the chances of intermixing between domestic and wild birds [24]. Very large numbers of waterbirds now use rice paddies for foraging, but their use varies in both time and space [25].
Understanding broad trends in waterfowl density may not be sufficient, as infection prevalence and viral strains vary both between [26,27,28] and within species [27,29]. Fortunately, there is a growing database of telemetry movement studies of migratory birds from this region [30]. Such data allow researchers to understand the spatiotemporal distribution of wild waterfowl and incorporate this information into transmission risk models [31,32], although the inclusion of such data is often neglected [33]. Additionally, although the spatiotemporal distribution of waterfowl serves as a primary driver for trends in the agricultural-wildlife interface, it should be noted that there has also been extensive work on understanding spatiotemporal trends in poultry production (e.g., [34]), including efforts to account for seasonal demand and market chain patterns [35,36].
While previous efforts have provided valuable insights into the spatiotemporal trends of disease transmission risk, they do rely on the assumption that the processes driving waterfowl movement patterns, and the resulting movements, have remained unchanged since underlying data were collected. However, East Asia represents one of the fastest areas of growth in the world [37]. Extensive regions encompassing Thailand’s eastern seaboard, the Yellow Sea, and the eastern Chinese coast are experiencing dramatic land-use conversions that drive socioeconomic as well as ecosystem changes [38,39]. The urbanization rate in China has reached nearly 60% in less than half a century, compared to a much more modest rate of 20% estimated in 1978 [40]. Such rapid and extensive urbanization has resulted in major land use changes throughout the region, many of which may have large effects on the agricultural-wildlife interface [41,42,43].
One of the primary impacts of the recent boom in urbanization and industrialization in China has been the substantial decrease in agricultural croplands [44,45]. For instance, work by Zhang et al. [46] indicated that across the country, rice production levels reached historic highs in 2006 (45.9 M ha) but declined steadily through 2015 (33.1 M ha), with a loss of ~28% of the rice paddy habitats. The Yangtze River floodplain in southeast China accounted for ~86% of the total observed decrease in rice area [46]. Conversely, the demands of feeding a growing population, as well as adjusting to climate change effects, has resulted in expansion of rice paddy agriculture in northeast China, primarily on the Sanjiang Plain [45,47,48], where Xin et al. [49] reported the addition of 3.6 M ha from 2000 to 2017. Extensive shifts in production have already been observed, but these trends are expected to be amplified in the coming years as developmental pressures in southeast China are amplified and climate change effects necessitate the use of cooler agricultural regions [48].
The effects of climate change are expected to result in reduced yields [50], prompting additional changes in agricultural distribution. Changes in the distribution of rice paddy habitats are likely to have marked impacts on wild waterbirds, and especially waterfowl, [51] that utilize them heavily during their seasonal migration along the East Asian-Australasian Flyway (EAAF) [52]. However, there have been few efforts aimed at considering the impacts of these shifts in rice paddy habitats in China on the migratory patterns of wild birds.
Determining where and when wild birds and poultry overlap and interact is a key factor in understanding the potential for disease transmission in regions where viruses circulate endemically [5,53] and where poultry act as a permanent source of infection for wild birds, or vice versa [33,54,55,56]. Understanding how the agricultural-wildlife interface may shift as the distribution of rice paddies changes is of critical importance in identifying potential areas of enhanced disease transmission risk. The objective of this study was to build scenarios to evaluate how landscape changes in eastern China may affect the migration of wild waterfowl in the EAAF, and to discuss implications for HPAI H5N1 spillover risk. We used movements of waterfowl determined by satellite telemetry to develop maps of migration routes and conducted a spatiotemporal analysis of waterfowl distribution in relation to their changing habitats. The specific aims of our study were to: (1) characterize the migratory movements of wild birds in this region; (2) summarize the level of environmental change in their habitats; and (3) develop scenarios to examine the potential effects of the environmental change on wild bird movements and the potential transmission of avian influenza.

2. Materials and Methods

2.1. Study Area

Our scenarios were focused within the extent of the EAAF. The EAAF generally describes a region along the east coast of Asia that includes migratory waterbirds (shorebirds, ducks, geese, swans, cranes, and seabirds) totaling over 50 million individuals following pathways moving between northern breeding areas and southern wintering areas [57]. The EAAF encompasses 22 countries, extending in the north from the Taimyr Peninsula across Russia to Alaska through East Asia, and in the south to Australia and New Zealand [58]. Our efforts specifically focus on the primary region for migrating waterfowl, which extends from breeding grounds in Siberia to wintering areas in southern China along the Yangtze River Basin lowlands [59]. This study area includes regions of historically high rice and poultry production (i.e., southeast China; [34,46]), as well as regions with an emerging rice industry (i.e., northeast China; [49]). Additionally, this region contains the Yellow Sea, which serves as an important stopover area for migratory waterfowl and other waterbirds [16,60,61,62], despite recent challenges from habitat loss and degradation [63,64,65].

2.2. Waterfowl Capture and Marking

The majority of migratory waterfowl wintering in southeastern China appear to migrate in a generally northeasterly direction during spring migration, moving through the Yellow Sea region and into northern breeding grounds [16,66]. This portion of individuals was represented in this study by various dabbling duck species (Eurasian Wigeon Mareca penelope, Northern Pintail Anas acuta, Garganey Anas querquedula, Common Teal Anas crecca, and Falcated Teal Mareca falcata) marked in the Mai Po Nature Reserve in Hong Kong, China (hereafter “Hong Kong”) and at Poyang Lake, China (in the Yangtze River Basin lowlands). However, some species and populations have a different pattern and migrate to more inland breeding grounds, such as the grasslands of the Mongolian-Manchurian Steppe [67], or follow a more inland route to western portions of the Russian Arctic [68]. The waterfowl used to build the scenarios in this study were represented by Swan Geese (Anser cygnoides) marked on the Mongol Daguur wetlands in northeast Mongolia prior to their fall migration to the southeastern wintering grounds in the Yangtze River Basin lowlands, which they share with the previously described dabbling ducks.
We captured birds using a variety of methods including monofilament leg nooses, drive traps, dip nets, mist nets, whoosh nets, and net launchers [16,69]. Timing of capture varied by species and site (Table 1). Upon capture, we placed birds in individual cloth bags and fitted them with solar powered Argos (12 g or 18 g), Argos-GPS (22 g, 26 g, or 30 g), or GSM (45 g; Microwave Telemetry, Inc., Columbia, MD, USA) transmitters. All transmitters were secured with a teflon ribbon harness (Bally Ribbon Mills, Bally, PA, USA) weighing < 3% of the bird’s body mass prior to marking [70]. After processing, we released the birds near capture locations as soon as possible, usually within 1–4 h.

2.3. Telemetry Data Filtering

Prior to analysis, we used the Douglas Argos-Filter Algorithm hybrid filter [71], available from Movebank (www.movebank.org (accessed on 1 July 2022)), to filter data for erroneous fixes. Additionally, data were manually inspected in ArcGIS 10 (Environmental Systems Research Institute, Inc., Redlands, CA, USA) to determine the biological end dates for each animal to ensure only data collected while the transmitter was attached to a live bird were used. Tracks were manually examined to determine completeness of migration, with only individuals that completed spring migration (birds marked in Poyang or Hong Kong) or either reached the northern edge of the Yellow Sea or completed fall migration (birds marked in Mongolia) being retained for this study. Finally, to ensure that data were comparable between the two separate deployments on Swan Geese (2008 and 2014), we resampled data from GSM marked birds (fixes collected up to once per minute) to match the temporal resolution of GPS marked birds (fix collected every 2 h). This was done by finding the fix closest in time to the programmed GPS schedule, disregarding any fix > 30 min outside of that scheduled fix time.

2.4. Movement Models

To develop our scenarios, we followed previously established methods [60,72] to create dynamic Brownian Bridge Movement Models (dBBMM) using the “move” package in R (R Core Team, Vienna, Austria), which estimated a utilization distribution (UD) for each bird. The 50, 75, and 99% contours of the resulting models were defined as stopover sites, core movement areas, and flight corridors, respectively [60]. To identify flight corridors and important habitats at a broader species level, we constructed 3 cumulative UDs consisting of birds marked at (1) Hong Kong and Poyang Lake, (2) Mongolia in 2008, and (3) Mongolia in 2014. Analyzing tracking datasets for the Swan Geese in both 2008 and 2014 allowed us to examine changes in movements and distribution in different years during the period when rice agriculture was rapidly changing in China [73]. Cumulative UDs were created by summing the UDs generated for individuals. To account for variation in migration duration between individuals when summing dBBMMs, we weighted each model by the duration of the migration, multiplying all pixel values in each UD by the number of days. We then summed the pixel values of all weighted UDs and rescaled cumulative pixel values such that they summed to 1. This resulted in a UD that represented the relative use of each pixel during migration.

2.5. Habitat Change Layers

To represent the availability of rice in different years of our scenarios, we used the layers generated for 2000 and 2015 as reported in Zhang et al. [73]. These layers provide the spatial distribution of rice paddy habitats across monsoon Asia at a 500 m resolution. We then resampled these rice layers to match the same resolution as our waterfowl UDs described above, providing the area of rice in km2 per UD raster cell (100 km2). To find the change in rice distribution from 2000 to 2015 we subtracted the resampled 2000 layer from the resampled 2015 layer, resulting in the change in available rice habitat per cell. All changes less than 5 km2 were reclassified as no change (value = 0) due to (1) the potential for small-scale errors in the generation of the original rice layers, and (2) the likely limited biological implications of changes below this threshold at the spatial scale of the resampled layers. All computations were performed in R 3.3.3 or ArcMap 10.6.
Table 1. Total number of marked individuals used in this study reported by species and capture site. Additional information regarding capture and marking, including data from individuals not included in this study, can be found in Sullivan et al. ([74]; birds marked in Mai Po marsh), Takekawa et al. ([16]; birds marked at Poyang Lake), and Batbayer et al. ([69]; birds marked in Mongolia).
SpeciesCapture AreaMarking DatesData TypeTransmitter Weights (g)nFixes for dBBMM
Eurasian WigeonMai Po (Hong Kong)8 December, 9 DecemberArgos, GPS12, 2251087
Northern PintailMai Po (Hong Kong)8 December, 9 DecemberArgos, GPS12, 18, 2293238
Common TealPoyang Lake7 MarchArgos123187
Falcated TealPoyang Lake7 MarchArgos12, 184249
GarganeyPoyang Lake7 MarchArgos12169
Swan Goose 1Mongol Daguur Complex8 July, 14 JulyGPS, GSM30, 451810,277
1 GPS transmitters were deployed in 2008; GSM transmitters were deployed in 2014.

2.6. Forecasting Effects of Changing Rice Production

To develop scenarios for examining the potential effects of spatial change in rice paddy habitat on the distribution of migratory waterfowl, we multiplied each bird’s individual UD such that the cells experienced a 5% or 10% change per km2 change in rice paddy habitat. For example, if the given cell experienced a 1 km2 loss of rice paddy habitat, the value would decrease by 5% in one model run and 10% in the subsequent run. Individual bird rasters were summed and rescaled to provide a cumulative UD at each percentage change threshold as described previously.
The 5% and 10% per km2 thresholds were selected for the scenarios following an investigation into differences between Swan Geese UDs in 2008 and 2014. While birds marked in 2008 had a slightly more easterly migration route, there was still some overlap, especially along the northern portions of the Yellow Sea, which birds used as a migratory stopover site in both years. To understand how rice change impacted space use, we created subsets of these UDs to include cells that were within the top 99% of use probabilities and remained present in both UDs. This allowed inclusion of cells that, had there been no change in habitat, would have likely been used equally between years despite the slightly different migratory patterns. We then found the percent change from the 2008 to 2014 UDs and divided the percent change by the change in rice paddy habitat, resulting in a final percent change in UD per km2 change in rice paddy habitat. We found that while other factors aside from rice (i.e., not included in this analysis) clearly affect the utility of a given area for migrating Swan Geese, changes in rice paddy coverage were often positively related with use by Swan Geese. Specifically, 50% of all dBBMM pixels that overlapped between 2008 and 2014 showed a positive relationship, and cell value generally changed between 0 and 10% per km2 change in rice coverage (Figure 1). While we recognize that applying this approach to developing our scenarios does not account for other potential landscape changes, we believe it is a reasonable technique for providing quantitative insights into projections of changes in habitat utilization across years.

3. Results

3.1. Transmitter Performance and Movement Paths

Following data processing, we retained 14 ducks marked in Hong Kong, 8 ducks marked in Poyang, and 18 Swan Geese marked in Mongolia for our scenarios (Table 1). A description of the other birds marked but not included in these analyses due to incomplete migration paths or other issues may be found in Takekawa et al. [16] (Poyang), Sullivan et al. [74] (Hong Kong), and Batbayer et al. [69] (Mongolia). As expected, the temporal resolution of fixes collected by the GSM transmitters was far greater than those collected by Argos or GPS transmitters, although this was addressed through data filtering (see Methods) to leave us with comparable fix rates between individual Swan Geese regardless of capture year.
Waterfowl marked at Hong Kong and Poyang Lake generally migrated northeast through China before splitting off to breeding areas in Mongolia or the Russian Arctic. There was a large stopover site in southeast China near Nanchang that followed the Yangtze River to the Yellow Sea (Figure 2). This region was an area of extensive rice production when these data were collected, but has seen dramatic loss of rice paddies in recent years (see below). The migratory paths developed in this analysis were consistent with results from other analyses of these data (e.g., [16,60], which provided more detailed descriptions of individual movements and migratory timing.
The movement paths of Swan Geese marked in northeast Mongolia in 2008 were similar to those found in previously published analyses of these data (see [69,75,76]. The Yalu River estuary on the border between China and North Korea and the region around Hulun Nur along the borders between Russia, China, and Mongolia were key staging areas for Swan Geese as they migrated from breeding grounds in Mongolia to wintering grounds in east China (Figure 3). However, despite the similar usage of regions at the beginning and end of migratory paths, we did observe some minor differences between birds marked in 2008 and 2014. The migration paths of Swan Geese in 2014 were further to the east than those observed in 2008.

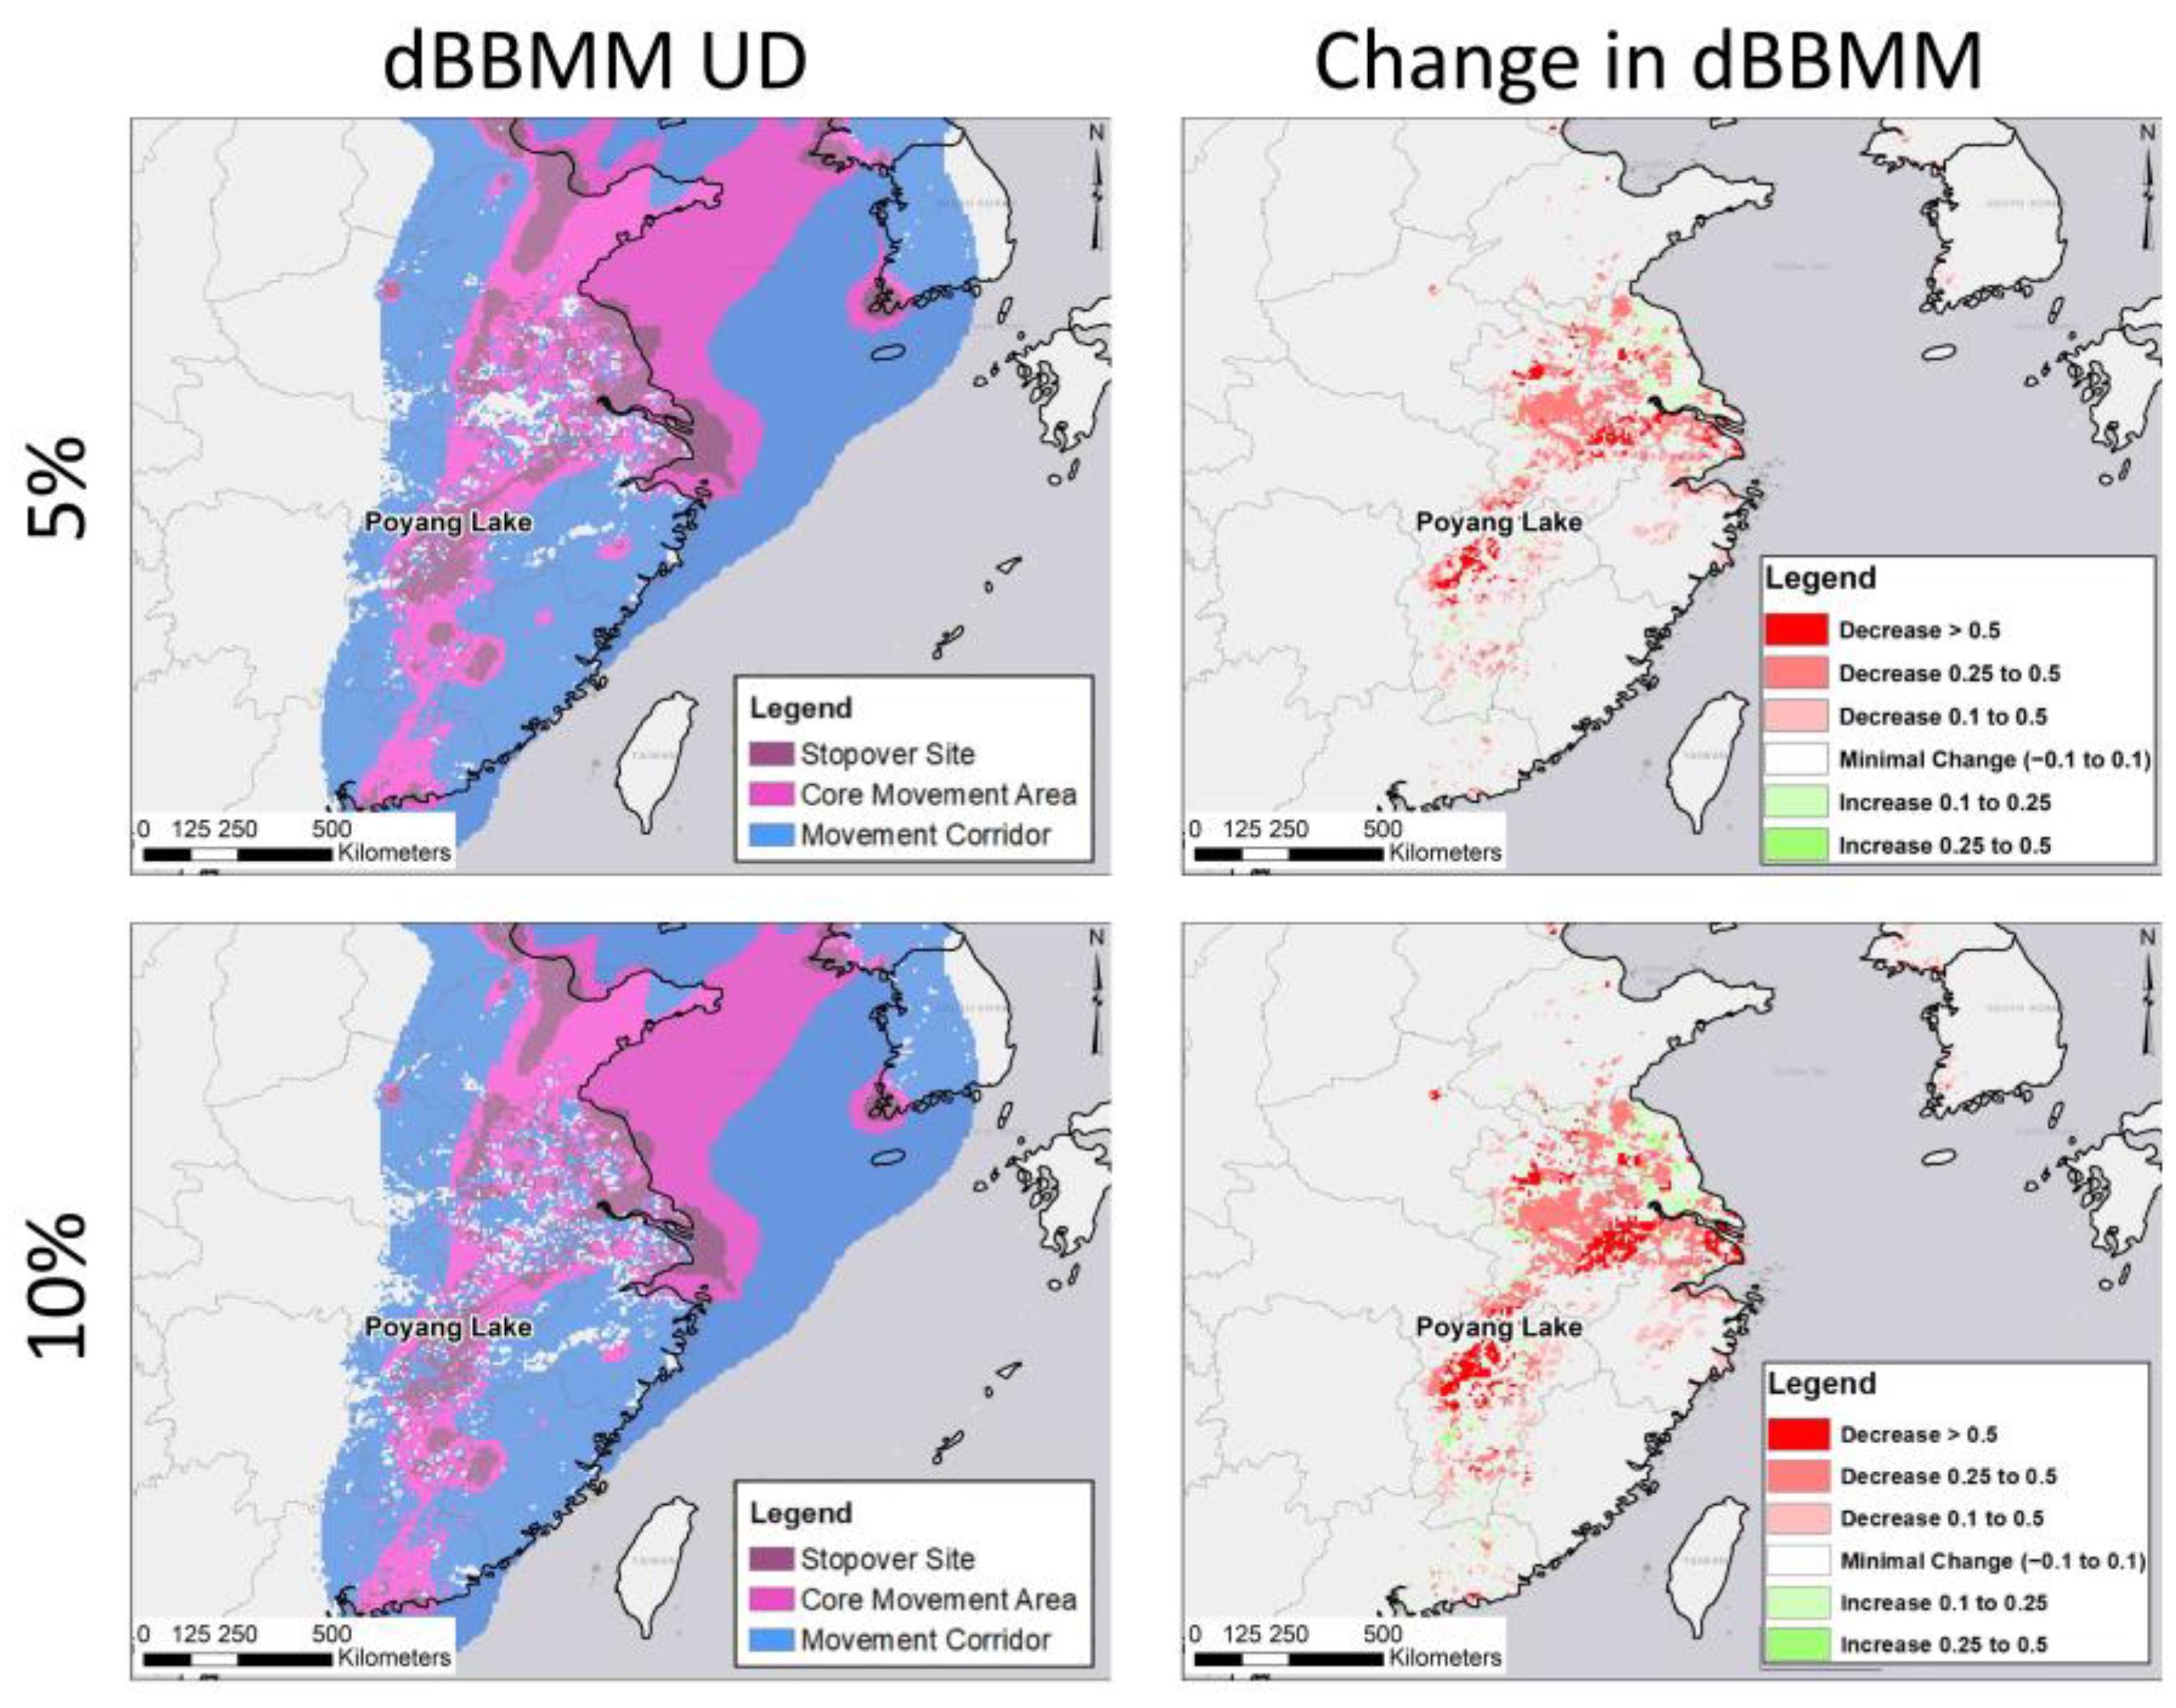
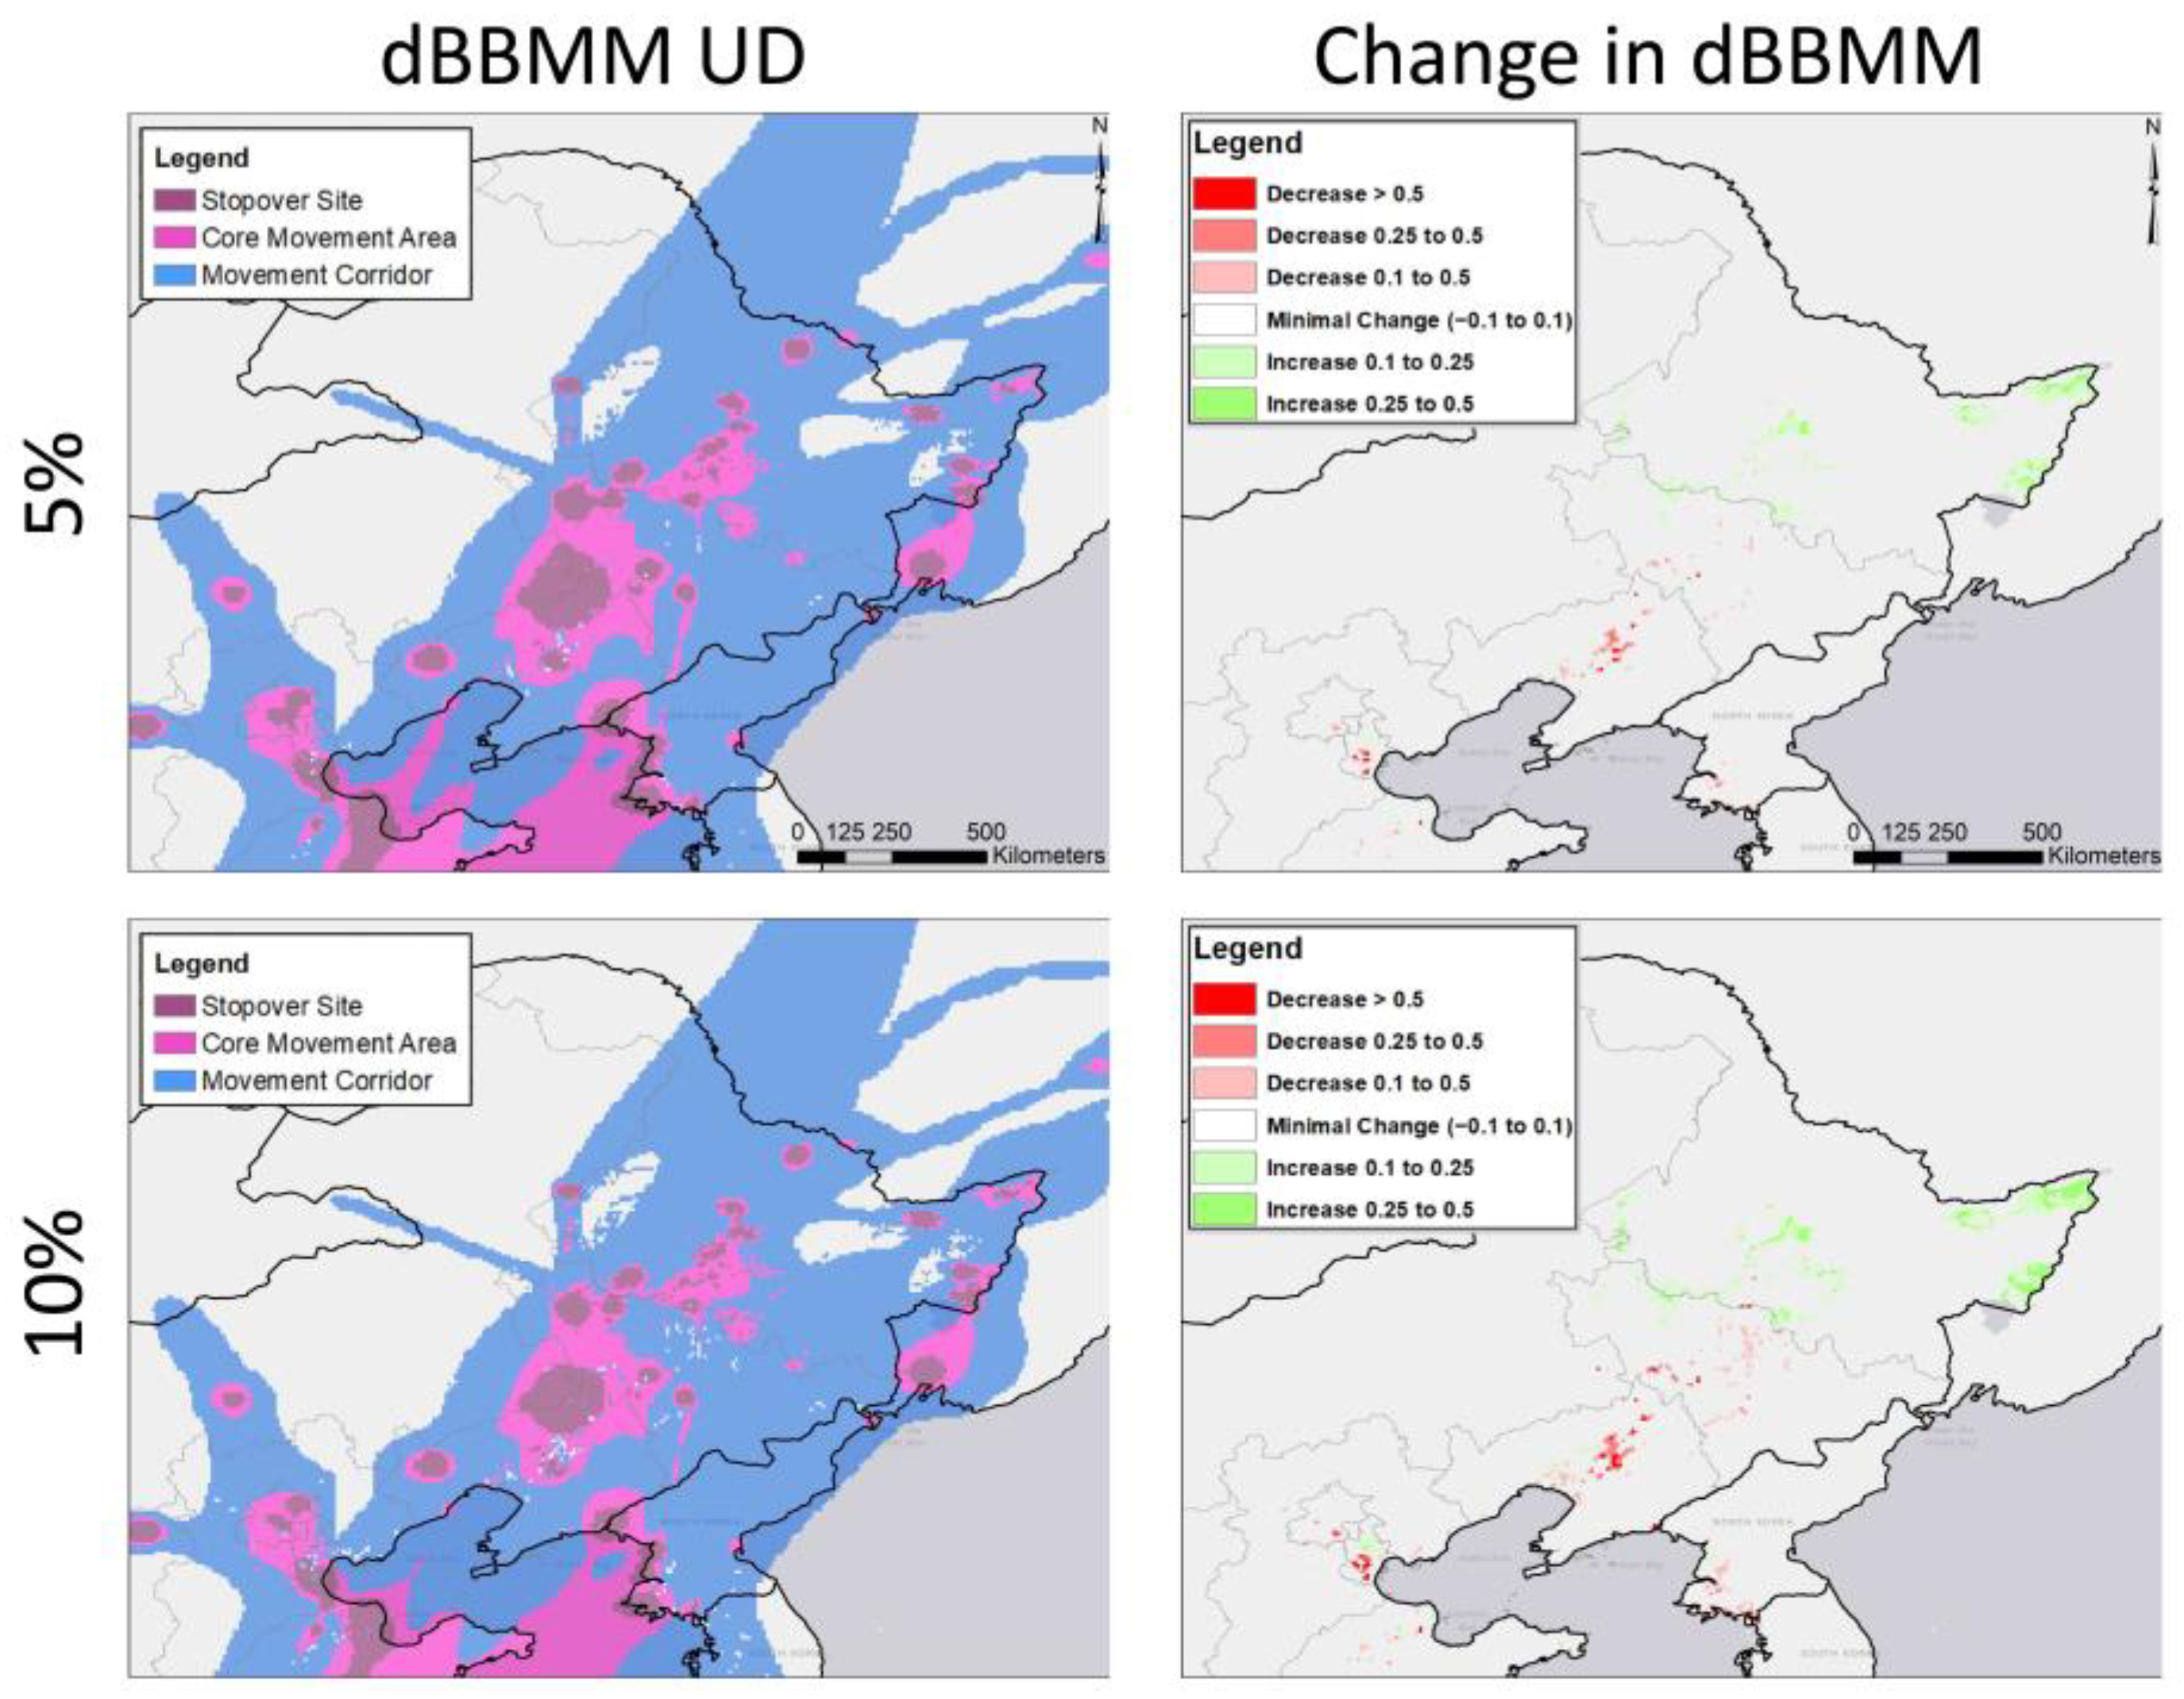
3.2. Potential Effects of Agricultural Shifts

A review of rice paddy data demonstrates that significant shifts in rice paddy agriculture have occurred throughout China in the past 20 years. There have been marked declines in rice paddy agriculture in southeast China, especially along the Yangtze River near Nanjing (Figure 4), and rapid increases in rice paddy agriculture in northeast China, especially along the Songhua River near the border with Russia. More detailed analysis of trends in rice habitat change is available in previous studies [46,73].
Our scenarios suggested that waterfowl on their spring migrations from southeastern China, represented by our birds marked at Poyang and Hong Kong, were likely to experience changes in habitat availability as the result of shifts in rice paddy agriculture. In light of the extreme reduction in rice paddy habitat available in southeast China since 2000, even small declines in habitat value resulting from a loss of rice would likely result in substantial reductions in previously important stopover areas (Figure 5). For instance, stopover sites to the west of Jiangsu are almost completely lost at just a 5% reduction per 1 km2 loss of rice paddy habitat. Furthermore, as negative response levels increase, we see potential narrowing of the core movement areas. It also appears that stopover areas unaffected by changes in rice agriculture habitat become more fragmented and skewed toward coastal regions facing the threat of land reclamation. While declines in rice paddy agriculture in southeast China seem likely to result in reduced habitat availability for migratory waterfowl, northeast China is experiencing increases in rice paddy agriculture that are presenting new habitat for these species. Prime examples of rice paddy expansion in northeast China improving habitat value for migratory waterfowl include the Amur River at the border of China and Russia (near Fuyuan), where our scenarios suggest a possible increase in stopover habitat (Figure 6). However, this expansion is occurring in a much more localized manner than the large-scale habitat loss observed in the southeast.
While birds marked in southeast China face drastic changes in the migratory landscape along their northward spring migrations, it appears as though Swan Geese, which migrate southeast from Mongolia during fall migration, are less likely to be affected by the current shifts in agricultural production. The migratory corridors of the marked Swan Geese used in this study had little overlap with areas that were experiencing large changes in rice paddy agriculture. The shifting rice paddy distribution north of the Yellow Sea may have little effect on the distribution of Swan Geese unless they expand outside the current areas of growth in northeast China. Despite the lack of major changes in the migratory pathways of Swan Geese at the flyway scale, there was still some change in rice paddy coverage, especially near the Yalu River Estuary. However, migratory Swan Geese may be affected by landscape changes south of the Yellow Sea later in the fall migration or during the initial stages of spring migration.

4. Discussion

We developed scenarios to examine the potential changes in the distribution of migratory waterbirds in the EAAF subject to recent large changes in habitat availability of rice paddies. Our results suggested that even relatively minor decreases of habitats in their migratory pathways driven by a loss of rice paddies could result in dramatic reduction of stopover habitats in areas such as the Yangtze River Basin. Conversely, although the expansion of rice habitat in northeast China appears to provide additional high value habitats, this is occurring at a much more localized scale than the large losses of agricultural habitat in southeast China.
In southeast China, waterfowl may respond to the loss of rice paddies by accelerating migration from their wintering grounds to more northerly stopover sites such as the Yellow Sea or the expanded rice habitats in northeast China. If the waterfowl move more rapidly through the early stages of migration, we could see a decrease in overlap with poultry production, as overlap primarily occurs in these lower latitudes [31,77,78]. However, increased migratory speed would also present the opportunity for infected waterfowl to travel farther during the asymptomatic period [6] and directly transmit HPAI from wintering grounds to higher latitudes. For instance, the dispersal rates of 19 waterfowl species marked with satellite transmitters showed that the Common Teal had the greatest potential to carry HPAI more than 500 km during the asymptomatic period of infection, although the likelihood of this event was restricted to 5–15 days during spring or fall migration [79]. However, if waterfowl migrations occur earlier, the resulting change in viral mobility could be dramatic, as a result of the differing strains and prevalence expressed across the range of species in this region [80]. Similarly, an earlier fall migration could allow additional strains of AIV to be introduced to wintering grounds, although a high viral diversity is already observed during this stage of the year [29,81,82].
Faster or earlier migration is not the only possible outcome of the observed habitat loss from our scenario. A second potential response would be that the waterfowl would congregate at increased densities in the remaining rice paddies throughout the movement corridor. Such a response would increase the risk of viral mixing between separate wintering populations, potentially exposing individuals to different subtypes [79]. Although AIV prevalence in wild birds is known to decline during spring migration [29,81,82], transmission at stopover sites may play an important role in facilitating transmission of viruses to the breeding grounds via relay transmission [79,83,84,85]. Also, increasing the density of wild waterfowl at stopovers increases the risk of direct and indirect transmission among wild populations as well as between wild and domestic birds in these areas. These stopover sites are where the majority of genomic reshuffling and cross-species transmission may occur [29].
While rice paddies have been demonstrated as important habitats for migratory waterfowl [52,74], the potential outcomes resulting from landscape changes rely on waterfowl being forced to use this habitat type. It is possible that waterfowl could simply use alternative habitats, newly protected areas [86], or restored natural wetlands [87]; furthermore, high levels of disturbance in agricultural lands may make them unsuitable for waterfowl use [88,89] (but see [90]). The effects of changes in habitat use by wild waterfowl on the agricultural-wildlife interface would depend on the type of habitats. As the habitats change, the response of the different migratory bird species and populations will likely differ [51]; thus, the realized outcomes may be a combination of two or more of the proposed scenarios. Additionally, changes in habitat often result in altered population levels, as species with low adaptability suffer population declines and species with higher adaptability expand to take advantage of newly available resources [91]. Potential changes in disease transmission could be heavily influenced by the resulting species composition, especially if remaining species have higher or lower prevalence, viral shedding, or migratory rates [92,93].
Although the decrease in rice paddy habitat throughout southeast China has notable potential ramifications for disease transmission, increases in rice production in northeast China may also drive change in the agriculture-wildlife interface. Increased rice agriculture in the northeast could lead to greater stopover duration and increased concentration of waterfowl at these locations. Conversely, it is also possible that decreased concentration of food resources could reduce the intermixing of large populations. Furthermore, climate change effects may alter the timing of rice production, creating a mismatch between food availability and waterfowl migration or forcing waterfowl to alter their migration timing or destination [94]. Perhaps most importantly, recent years have seen an increase in domestic poultry production in northeastern China, likely driven by increased consumer demand [95,96]. This change in both wild and domestic poultry distribution would present new opportunities for spatiotemporal overlap. Monitoring such changes will be crucial for disease outbreak preparedness [52,97].
In addition to shifts in agricultural production, waterbirds migrating through the EAAF also face significant disruption to coastal habitats. Upwards of 65% of intertidal wetlands within the coastal zone of the Yellow Sea has been reclaimed in the past 50 years to accommodate the nearly 60 million people currently occupying this region [63,98]. As could be expected, this loss of intertidal wetlands presents a serious threat to waterbirds [98,99,100,101]. Delany and Scott [102] reported that 62% of waterbird species in this region have declining populations. Changes in habitat surrounding the Yellow Sea also have significant implications for the spread of AIVs, as this is an important stopover site allowing for intermixing of birds from separate wintering grounds. Additionally, due to the relatively low latitude of this stopover region, infected birds may still shed viruses from wintering areas upon arrival [6,7]. Thus, while conservation measures have been proposed to protect the Yellow Sea from rapid urban expansion and habitat loss [63], degradation from damming of major rivers, pollution, wind and tidal power plants, and aquaculture [99,103], the region also may require increased surveillance and control measures because it is at higher risk of disease outbreaks. However, as with loss of rice habitat, the effects that the loss of tidal mudflats will have on spatiotemporal trends in the distribution of wild waterbirds has not been sufficiently examined, and implications for disease transmission are unclear.
The scenarios that we developed to examine the potential effects of changes in rice agriculture are dependent on the availability of empirical data during the same decade. Although marked birds are typically observed with unmarked birds [104], the behavior of the marked birds, either in movement or general ecology, may still be affected by the tracking devices. However, their movement paths were similar to movement patterns observed in previous analyses of transmitter data [16,69,74,75,76]. Also, availability of rice paddy habitats is not the only factor driving waterfowl distribution and habitat use differences among years. However, the approach we developed allowed us to use historical data to construct scenarios suggesting potential changes in migratory bird movements due to landscape change, and to discuss the possible implications for disease transmission. Agent-based modeling paired with susceptible-exposed-infected-recovered (SEIR) models may provide the best means of incorporating information on known habitat preferences, disease ecology parameters, and known movement characteristics to predict outcomes in changing environments. While the theoretical foundations are being built to allow such work [105], we believe our scenario approach provides an important first step for advancing understanding of changing disease transmission threats by incorporating real-world data to predict differences in habitat utilization by migratory birds over time.

Author Contributions

J.Y.T., D.J.P. and J.D.S. conceived and designed the study, J.D.S., X.W. and G.Z. analyzed the data, and J.Y.T., J.D.S., S.Y. and D.J.P. wrote the paper with contributions from X.W. and X.X. All authors have read and agreed to the published version of the manuscript.

Funding

This work was supported by the National Science Foundation (NSF) (“US-China Collaboration: Harnessing big data to understand and predict diversity and transmission of human- and animal-infected avian influenza viruses in China,” the US group under NSF grant number #1911955 and the China group under NSFC grant number #81961128002), the University of Oklahoma, the U. S. Geological Survey, the Food and Agriculture Organization of the United Nations, the Suisun Resource Conservation District, and the NSF (PIPP Phase 1: International Center for Avian Influenza Pandemic Prediction and Prevention, #2200310).

Institutional Review Board Statement

The animal study protocol was approved by the U. S. Geological Survey, the Eastern Ecological Science Center Animal Care and Use Committee (2007-01), and the University of Maryland Baltimore County Institutional Animal Care and Use Committee (Protocol EE070200710). All capture, handling, and marking procedures were conducted in accordance with the methodology outlined by the Food and Agriculture Organization of the United Nations [106].

Data Availability Statement

The tracking datasets analyzed for this study can be found in the Movebank Data Repository (https://www.movebank.org/cms/movebank-main (accessed on 1 July 2022)), and the habitat datasets are available from Zheng et al. [73].

Acknowledgments

We thank J. Allcock, N. Batbayar, L. Cao, C. Choi, C. Ely, A. Fox, W. Jeong, I. Kim, P. Leader, H. Lee, K. Leung, O. Moon, S. Bin Muzaffar, S. Newman, E. Palm, M. Peiris, B. Smith, L. Smith, W. Xin, and many field assistants for conducting the original fieldwork. The authors thank internal and anonymous peer reviewers for providing helpful comments to strengthen earlier versions of this manuscript. Any use of trade, firm, or product names is for descriptive purposes only and does not imply endorsement by the U.S. Government.

Conflicts of Interest

The authors declare no conflict of interest. The funders had no role in the design of the study, in the collection, analyses, or interpretation of data, in the writing of the manuscript, or in the decision to publish the results.

References

  1. OIE. Update on Highly Pathogenic Avian Influenza in Animals (Type H5 and H7); OIE: Paris, France, 2017. [Google Scholar]
  2. Webster, R.G.; Peiris, M.; Chen, H.; Guan, Y. H5N1 Outbreaks and Enzootic Influenza. Emerg Infect Dis. 2006, 12, 3–8. [Google Scholar] [CrossRef] [PubMed]
  3. Nguyen, D.T.; Bryant, J.E.; Davis, C.T.; Nguyen, L.V.; Pham, L.T.; Loth, L.; Inui, K.; Nguyen, T.; Jang, Y.; To, T.L.; et al. Prevalence and Distribution of Avian Influenza A(H5N1) Virus Clade Variants in Live Bird Markets of Vietnam, 2011–2013. Avian Dis. 2014, 58, 599–608. [Google Scholar] [CrossRef]
  4. Chen, H.; Li, Y.; Li, Z.; Shi, J.; Shinya, K.; Deng, G.; Qi, Q.; Tian, G.; Fan, S.; Zhao, H.; et al. Properties and Dissemination of H5N1 Viruses Isolated during an Influenza Outbreak in Migratory Waterfowl in Western China. J. Virol. 2006, 80, 5976–5983. [Google Scholar] [CrossRef] [Green Version]
  5. Peiris, M.; Cowling, B.J.; Wu, J.T.; Feng, L.; Guan, Y.; Yu, H.; Leung, G.M. Interventions to Reduce Zoonotic and Pandemic Risks from Avian Influenza in Asia. Lancet Infect. Dis. 2016, 16, 252–258. [Google Scholar] [CrossRef] [Green Version]
  6. Gaidet, N.; Cattoli, G.; Hammoumi, S.; Newman, S.H.; Hagemeijer, W.; Takekawa, J.Y.; Cappelle, J.; Dodman, T.; Joannis, T.; Gil, P.; et al. Evidence of Infection by H5N2 Highly Pathogenic Avian Influenza Viruses in Healthy Wild Waterfowl. PLoS Pathog. 2008, 4, e1000127. [Google Scholar] [CrossRef] [Green Version]
  7. Gilbert, M.; Newman, S.H.; Takekawa, J.Y.; Loth, L.; Biradar, C.; Prosser, D.J.; Balachandran, S.; Subba Rao, M.V.; Mundkur, T.; Yan, B.; et al. Flying over an Infected Landscape: Distribution of Highly Pathogenic Avian Influenza H5N1 Risk in South Asia and Satellite Tracking of Wild Waterfowl. Ecohealth 2010, 7, 448–458. [Google Scholar] [CrossRef] [Green Version]
  8. Jeong, J.; Kang, H.-M.; Lee, E.-K.; Song, B.-M.; Kwon, Y.-K.; Kim, H.-R.; Choi, K.-S.; Kim, J.-Y.; Lee, H.-J.; Moon, O.-K.; et al. Highly Pathogenic Avian Influenza Virus (H5N8) in Domestic Poultry and Its Relationship with Migratory Birds in South Korea during 2014. Vet. Microbiol. 2014, 173, 249–257. [Google Scholar] [CrossRef] [PubMed]
  9. Tian, H.; Zhou, S.; Dong, L.; Van Boeckel, T.P.; Cui, Y.; Newman, S.H.; Takekawa, J.Y.; Prosser, D.J.; Xiao, X.; Wu, Y.; et al. Avian Influenza H5N1 Viral and Bird Migration Networks in Asia. PNAS2 2015, 112, 172–177. [Google Scholar] [CrossRef] [PubMed] [Green Version]
  10. Nemeth, N.M.; Brown, J.D.; Stallknecht, D.E.; Howerth, E.W.; Newman, S.H.; Swayne, D.E. Experimental Infection of Bar-Headed Geese (Anser Indicus) and Ruddy Shelducks (Tadorna Ferruginea) with a Clade 2.3.2 H5N1 Highly Pathogenic Avian Influenza Virus. Vet. Pathol. 2013, 50, 961–970. [Google Scholar] [CrossRef]
  11. Spackman, E.; Prosser, D.J.; Pantin-Jackwood, M.J.; Berlin, A.M.; Stephens, C.B. The Pathogenesis of Clade 2.3.4.4 H5 Highly Pathogenic Avian Influenza Viruses in Ruddy Duck (Oxyura Jamaicensis) and Lesser Scaup (Aythya Affinis). J. Wildl. Dis. 2017, 53, 832–842. [Google Scholar] [CrossRef] [Green Version]
  12. Van Den Brand, J.M.A.; Verhagen, J.H.; Veldhuis Kroeze, E.J.B.; Van De Bildt, M.W.G.; Bodewes, R.; Herfst, S.; Richard, M.; Lexmond, P.; Bestebroer, T.M.; Fouchier, R.A.M.; et al. Wild Ducks Excrete Highly Pathogenic Avian Influenza Virus H5N8 (2014–2015) without Clinical or Pathological Evidence of Disease Article. Emerg. Microbes Infect. 2018, 7, 1–10. [Google Scholar] [CrossRef] [PubMed] [Green Version]
  13. Lycett, S.J.; Bodewes, R.; Pohlmann, A.; Banks, J.; Bányai, K.; Boni, M.F.; Bouwstra, R.; Breed, A.C.; Brown, I.H.; Chen, H.; et al. Role for Migratory Wild Birds in the Global Spread of Avian Influenza H5N8. Science 2016, 354, 213–217. [Google Scholar] [CrossRef] [Green Version]
  14. Lee, D.H.; Bertran, K.; Kwon, J.H.; Swayne, D.E. Evolution, Global Spread, and Pathogenicity of Highly Pathogenic Avian Influenza H5Nx Clade 2.3.4.4. J. Vet. Sci. 2017, 18, 269–280. [Google Scholar] [CrossRef]
  15. Saito, T.; Tanikawa, T.; Uchida, Y.; Takemae, N.; Kanehira, K.; Tsunekuni, R. Intracontinental and Intercontinental Dissemination of Asian H5 Highly Pathogenic Avian Influenza Virus (Clade 2.3.4.4) in the Winter of 2014–2015. Rev. Med. Viorolgy 2015, 25, 388–405. [Google Scholar] [CrossRef]
  16. Takekawa, J.Y.; Newman, S.H.; Xiao, X.; Prosser, D.J.; Spragens, K.A.; Palm, E.C.; Yan, B.; Li, T.; Lei, F.; Zhao, D.; et al. Migration of Waterfowl in the East Asian Flyway and Spatial Relationship to HPAI H5N1 Outbreaks. Avian Dis. 2010, 54, 466–476. [Google Scholar] [CrossRef] [PubMed] [Green Version]
  17. Si, Y.; Skidmore, A.K.; Wang, T.; De Boer, W.F.; Debba, P.; Toxopeus, A.G.; Li, L.; Prins, H.H.T. Spatio-Temporal Dynamics of Global H5N1 Outbreaks Match Bird Migration Patterns. Geospat. Health 2009, 4, 65–78. [Google Scholar] [CrossRef] [Green Version]
  18. Bahl, J.; Pham, T.T.; Hill, N.J.; Hussein, I.T.M.; Ma, E.J.; Easterday, B.C.; Halpin, R.A.; Stockwell, T.B.; Wentworth, D.E.; Kayali, G.; et al. Ecosystem Interactions Underlie the Spread of Avian Influenza A Viruses with Pandemic Potential. PLoS Pathog. 2016, 12, e1005620. [Google Scholar] [CrossRef] [Green Version]
  19. Alexander, D.J. An Overview of the Eipdemiology of Avian Influenza. Vaccine 2007, 25, 5637–5644. [Google Scholar] [CrossRef]
  20. Tian, H.; Xu, B. Persistence and Transmission of Avian Influenza A (H5N1): Virus Movement, Risk Factors and Pandemic Potential. Ann. GIS 2015, 21, 55–68. [Google Scholar] [CrossRef]
  21. Berthold, P.; Gwinner, E. Sonnenschein Avian Migration; Springer: Berlin, Germany, 2003. [Google Scholar]
  22. Warnock, N.; Takekawa, J.Y.; Bishop, M.A. Migration and Stopover Strategies of Individual Dunlin along the Pacific Coast of North America. Can. J. Zool. 2004, 82, 1687–1697. [Google Scholar] [CrossRef]
  23. Hill, N.J.; Takekawa, J.Y.; Ackerman, J.T.; Hobson, K.A.; Herring, G.; Cardona, C.J.; Runstadler, J.A.; Boyce, W.M. Migration Strategy Affects Avian Influenza Dynamics in Mallards (Anas Platyrhynchos). Mol. Ecol. 2012, 21, 5986–5999. [Google Scholar] [CrossRef] [PubMed]
  24. Boere, G.; Galbraith, C.; Stroud, D. Waterbirds around the World; The Stationary Office: Edingburgh, UK, 2006. [Google Scholar]
  25. Elphick, C.S. Why Study Birds in Rice Fields? Waterbirds 2010, 33, 1–7. [Google Scholar] [CrossRef] [Green Version]
  26. Hill, N.J.; Takekawa, J.Y.; Cardona, C.J.; Ackerman, J.T.; Schultz, A.K.; Spragens, K.A.; Boyce, W.M. Waterfowl Ecology and Avian Influenza in California: Do Host Traits Inform Us about Viral Occurrence? Avian Dis. 2010, 54, 426–432. [Google Scholar] [CrossRef] [PubMed]
  27. Hill, N.J.; Takekawa, J.Y.; Cardona, C.J.; Meixell, B.W.; Ackerman, J.T.; Runstadler, J.A.; Boyce, W.M. Cross-Seasonal Patterns of Avian Influenza Virus in Breeding and Wintering Migratory Birds: A Flyway Perspective. Vector-Borne Zoonotic Dis. 2012, 12, 243–253. [Google Scholar] [CrossRef] [Green Version]
  28. Gonzalez-Reiche, A.S.; Müller, M.L.; Ortiz, L.; Cordón-Rosales, C.; Perez, D.R. Prevalence and Diversity of Low Pathogenicity Avian Influenza Viruses in Wild Birds in Guatemala, 2010–2013. Avian. Dis. 2016, 60, 359–364. [Google Scholar] [CrossRef] [Green Version]
  29. Hill, N.J.; Ma, E.J.; Meixell, B.W.; Lindberg, M.S.; Boyce, W.M.; Runstadler, J.A. Transmission of Influenza Reflects Seasonality of Wild Birds across the Annual Cycle. Ecol. Lett. 2016, 19, 915–925. [Google Scholar] [CrossRef]
  30. Cao, L.E.I.; Meng, F.; Zhang, J.; Deng, X. Moving Forward: How Best to Use the Results of Waterbird Monitoring and Telemetry Studies to Safeguard the Future of Far East Asian Anatidae Species. Wildfowl 2020, 6, 293–319. [Google Scholar]
  31. Prosser, D.J.; Hungerford, L.L.; Erwin, R.M.; Ottinger, M.A.; Takekaw, J.Y.; Ellis, E.C. Mapping Avian Influenza Transmission Risk at the Interface of Domestic Poultry and Wild Birds. Front. Public Health 2013, 1, 28. [Google Scholar] [CrossRef] [Green Version]
  32. Artois, J.; Lai, S.; Feng, L.; Jiang, H.; Zhou, H.; Li, X.; Dhingra, M.S.; Linard, C.; Nicolas, G.; Xiao, X.; et al. H7N9 and H5N1 Avian Influenza Suitability Models for China: Accounting for New Poultry and Live-Poultry Markets Distribution Data. Stoch. Environ. Res. Risk Assess. 2017, 31, 393–402. [Google Scholar] [CrossRef] [PubMed] [Green Version]
  33. Gilbert, M.; Pfeiffer, D.U. Risk Factor Modelling of the Spatio-Temporal Patterns of Highly Pathogenic Avian Influenza (HPAIV) H5N1: A Review. Spat. Spatio-Temporal Epidemiol. 2012, 3, 173–183. [Google Scholar] [CrossRef] [Green Version]
  34. Prosser, D.J.; Wu, J.; Ellis, E.C.; Gale, F.; Van Boeckel, T.P.; Wint, W.; Robinson, T.; Xiao, X.; Gilbert, M. Modelling the Distribution of Chickens, Ducks, and Geese in China. Agric. Ecosyst Environ. 2011, 141, 381–389. [Google Scholar] [CrossRef] [Green Version]
  35. Choi, C.; Takekawa, J.Y.; Yue, X.; Ying, L.I.U.; Wikelski, M.; Heine, G.; Prosser, D.J.; Newman, S.H.; Edwards, J.; Guo, F.; et al. Tracking Domestic Ducks: A Novel Approach for Documenting Poultry Market Chains in the Context of Avian Influenza Transmission. J. Integr. Agric. 2016, 15, 1584–1594. [Google Scholar] [CrossRef] [Green Version]
  36. Gilbert, M.; Xiao, X.; Robinson, T.P. Intensifying Poultry Production Systems and the Emergence of Avian Influenza in China: A “One Health/Ecohealth” Epitome. Arch. Public Health 2017, 75, 1–7. [Google Scholar] [CrossRef] [Green Version]
  37. Bai, X.; Shi, P.; Liu, Y. Realizing China’s Urban Dream. Nature 2014, 509, 158–160. [Google Scholar] [CrossRef] [PubMed] [Green Version]
  38. Nelson, G.C.; Bennett, E.; Berhe, A.A.; Cassman, K.; DeFries, R.; Dietz, T.; Dobermann, A.; Dobson, A.; Janetos, A.; Levy, M.; et al. Anthropogenic Drivers of Ecosystem Change: An Overview. Ecol. Soc. 2006, 11, 29. [Google Scholar] [CrossRef]
  39. Wang, J.; Lin, Y.; Glendinning, A.; Xu, Y. Land-Use Changes and Land Policies Evolution in China’s Urbanization Processes. Land Use Policy 2018, 75, 375–387. [Google Scholar] [CrossRef]
  40. Guan, X.; Wei, H.; Lu, S.; Dai, Q.; Su, H. Assessment on the Urbanization Strategy in China: Achievements, Challenges and Reflections. Habitat Int. 2018, 71, 97–109. [Google Scholar] [CrossRef]
  41. Kamaruddin, M.A.; Yusoff, M.S.; Rui, L.M.; Isa, A.M.; Zawawi, M.H.; Alrozi, R. An Overview of Municipal Solid Waste Management and Landfill Leachate Treatment: Malaysia and Asian Perspectives. Environ. Sci. Pollut. Res. 2017, 24, 26988–27020. [Google Scholar] [CrossRef]
  42. Shah, H.A.; Huxley, P.; Elmes, J.; Murray, K.A. Agricultural Land-Uses Consistently Exacerbate Infectious Disease Risks in Southeast Asia. Nat. Commun. 2019, 10, 4229. [Google Scholar] [CrossRef] [Green Version]
  43. Gibb, R.; Redding, D.W.; Chin, K.Q.; Donnelly, C.A.; Blackburn, T.M.; Newbold, T.; Jones, K.E. Zoonotic Host Diversity Increases in Human-Dominated Ecosystems. Nature 2020, 584, 398–402. [Google Scholar] [CrossRef]
  44. Jiang, L.; Deng, X.; Seto, K.C. The Impact of Urban Expansion on Agricultural Land Use Intensity in China. Land Use Policy 2013, 35, 33–39. [Google Scholar] [CrossRef]
  45. Liu, Z.; Li, Z.; Tang, P.; Li, Z.; Wu, W.; Yang, P.; You, L.; Tang, H. Change Analysis of Rice Area and Production in China during the Past Three Decades. J. Geogr. Sci. 2013, 23, 1005–1018. [Google Scholar] [CrossRef]
  46. Zhang, G.; Xiao, X.; Biradar, C.M.; Dong, J.; Qin, Y.; Menarguez, M.A.; Zhou, Y.; Zhang, Y.; Jin, C.; Wang, J.; et al. Spatiotemporal Patterns of Paddy Rice Croplands in China and India from 2000 to 2015. Sci. Total Environ. 2017, 579, 82–92. [Google Scholar] [CrossRef] [PubMed]
  47. Zhang, Y.; Hao, M.; Takekawa, J.Y.; Lei, F.; Yan, B.; Prosser, D.J.; Douglas, D.C.; Xing, Z.; Newman, S.H. Tracking the Autumn Migration of the Bar-Headed Goose (Anser Indicus) with Satellite Telemetry and Relationship to Environmental Conditions. Int. J. Zool. 2011, 2011, 323847. [Google Scholar] [CrossRef] [Green Version]
  48. Dong, J.; Xiao, X.; Kou, W.; Qin, Y.; Zhang, G.; Li, L.; Jin, C.; Zhou, Y.; Wang, J.; Biradar, C.; et al. Tracking the Dynamics of Paddy Rice Planting Area in 1986–2010 through Time Series Landsat Images and Phenology-Based Algorithms. Remote Sens. Env. 2015, 160, 99–113. [Google Scholar] [CrossRef]
  49. Xin, F.; Xiao, X.; Dong, J.; Zhang, G.; Zhang, Y.; Wu, X.; Li, X.; Zou, Z.; Ma, J.; Du, G.; et al. Large Increases of Paddy Rice Area, Gross Primary Production, and Grain Production in Northeast China during 2000–2017. Sci. Total Environ. 2020, 711, 135183. [Google Scholar] [CrossRef]
  50. Chen, X.; Wang, L.; Niu, Z.; Zhang, M.; Li, C.; Li, J. The Effects of Projected Climate Change and Extreme Climate on Maize and Rice in the Yangtze River Basin, China. Agric For. Meteorol. 2020, 282–283, 107867. [Google Scholar] [CrossRef]
  51. Xu, Y.; Si, Y.; Yin, S.; Zhang, W.; Grishchenko, M.; Prins, H.H.T.; Gong, P.; de Boer, W.F. Species-Dependent Effects of Habitat Degradation in Relation to Seasonal Distribution of Migratory Waterfowl in the East Asian–Australasian Flyway. Landsc. Ecol. 2019, 34, 243–257. [Google Scholar] [CrossRef] [Green Version]
  52. Muzaffar, S.B.; Takekawa, J.Y.; Prosser, D.J.; Newman, S.H.; Xiao, X. Rice Production Systems and Avian Influenza: Interactions between Mixed-Farming Systems, Poultry and Wild Birds. Waterbirds 2010, 33, 219–230. [Google Scholar] [CrossRef]
  53. Chen, H.; Smith, G.J.D.; Li, K.S.; Wang, J.; Fan, X.H.; Rayner, J.M.; Vijaykrishna, D.; Zhang, J.X.; Zhang, L.J.; Guo, C.T.; et al. Establishment of Multiple Sublineages of H5N1 Influenza Virus in Asia: Implications for Pandemic Control. Proc. Natl. Acad. Sci. USA 2006, 103, 2845–2850. [Google Scholar] [CrossRef] [Green Version]
  54. Cecchi, G.; Ilemobade, A.; Le Brun, Y.; Hogerwerf, L.; Slingenbergh, J. Agro-Ecological Features of the Introduction and Spread of the Highly Pathogenic Avian Influenza (HPAI) H5N1 in Northern Nigeria. Geospat. Health 2008, 3, 7–16. [Google Scholar] [CrossRef] [PubMed] [Green Version]
  55. Caron, A.; Cumming, G.S.; Mundava, J.; Chiweshe, N.; Mundy, P.; de Garine-Wichatitsky, M. Report on a Five-Year Avian Influenza Survey in the Manyame Catchment. Honeyguide 2012, 58, 113–120. [Google Scholar]
  56. Caron, A.; Cappelle, J.; Cumming, G.S.; de Garine-Wichatitsky, M.; Gaidet, N. Bridge Hosts, a Missing Link for Disease Ecology in Multi-Host Systems. Vet. Res. 2015, 46, 11. [Google Scholar] [CrossRef] [PubMed] [Green Version]
  57. Partnership, E.A.-A.F. What Is a Flyway? Available online: https://www.eaaflyway.net/the-flyway/ (accessed on 1 January 2023).
  58. Yong, D.L.; Jain, A.; Liu, Y.; Iqbal, M.; Choi, C.Y.; Crockford, N.J.; Millington, S.; Provencher, J. Challenges and Opportunities for Transboundary Conservation of Migratory Birds in the East Asian-Australasian Flyway. Conserv. Biol. 2018, 32, 740–743. [Google Scholar] [CrossRef] [PubMed]
  59. Billerman, S.M.; Keeney, B.K.; Rodewald, P.G.; Schulenberg, T.S. Birds of the World. Available online: https://birdsoftheworld.org/bow/home (accessed on 1 January 2023).
  60. Palm, E.C.; Newman, S.H.; Prosser, D.J.; Xiao, X.; Ze, L.; Batbayar, N.; Balachandran, S.; Takekawa, J.Y. Mapping Migratory Flyways in Asia Using Dynamic Brownian Bridge Movement Models. Mov. Ecol. 2015, 3, 3. [Google Scholar] [CrossRef] [Green Version]
  61. Peng, H.B.; Anderson, G.Q.A.; Chang, Q.; Choi, C.-Y.; Chowdhury, S.U.; Clark, N.A.; Gan, X.; Hearn, R.D.; Li, J.; Lappo, E.G.; et al. The Intertidal Wetlands of Southern Jiangsu Province, China—Globally Important for Spoon-Billed Sandpipers and Other Threatened Waterbirds, but Facing Multiple Serious Threats. Bird Conserv. Int. 2017, 27, 305–322. [Google Scholar] [CrossRef] [Green Version]
  62. Xia, S.; Yu, X.; Millington, S.; Liu, Y.; Jia, Y.; Wang, L.; Hou, X.; Jiang, L. Identifying Priority Sites and Gaps for the Conservation of Migratory Waterbirds in China’s Coastal Wetlands. Biol. Conserv. 2016, 210, 72–82. [Google Scholar] [CrossRef]
  63. Murray, N.J.; Clemens, R.S.; Phinn, S.R.; Possingham, H.P.; Fuller, R.A. Tracking the Rapid Loss of Tidal Wetlands in the Yellow Sea. Front. Ecol. Envion. 2014, 12, 267–272. [Google Scholar] [CrossRef] [Green Version]
  64. Melville, D.S.; Chen, Y.; Ma, Z. Shorebirds along the Yellow Sea Coast of China Face an Uncertain Future—A Review of Threats. Emu 2016, 116, 100–110. [Google Scholar] [CrossRef] [Green Version]
  65. Szabo, J.K.; Battley, P.F.; Buchanan, K.L.; Rogers, D.I. What Does the Future Hold for Shorebirds in the East Asian-Australasian Flyway? Emu 2016, 116, 95–99. [Google Scholar] [CrossRef]
  66. Wang, X.; Cao, L.; Fox, A.D.; Fuller, R.; Griffin, L.; Mitchell, C.; Zhao, Y.; Moon, O.K.; Cabot, D.; Xu, Z.; et al. Stochastic Simulations Reveal Few Green Wave Surfing Populations among Spring Migrating Herbivorous Waterfowl. Nat. Commun. 2019, 10, 3893. [Google Scholar] [CrossRef] [Green Version]
  67. Zhu, Q.; Hobson, K.A.; Zhao, Q.; Zhou, Y.; Damba, I.; Batbayar, N.; Natsagdorj, T.; Davaasuren, B.; Antonov, A.; Guan, J.; et al. Migratory Connectivity of Swan Geese Based on Species’ Distribution Models, Feather Stable Isotope Assignment and Satellite Tracking. Divers. Distrib. 2020, 26, 944–957. [Google Scholar] [CrossRef]
  68. Fang, L.; Zhang, J.; Zhao, Q.; Solovyeva, D.; Vangeluwe, D.; Rozenfeld, S.B.; Lameris, T.; Xu, Z.; Bysykatova-harmey, I. Two Distinct Flyways with Different Population Trends of Bewick’s Swan Cygnus Columbianus Bewickii in East Asia. Wildfowl 2020, Special Issue 6, 13–42. [Google Scholar]
  69. Batbayar, N.; Takekawa, J.Y.; Newman, S.H.; Prosser, D.J.; Natsagdorj, T.; Xiao, X. Migration Strategies of Swan Geese Anser Cygnoides from Northeast Mongolia. Wildfowl 2011, 61, 90–109. [Google Scholar]
  70. Kenward, R.E. Wildlife Radio Tagging: Equipment, Field Techniques and Data Analysis; Academic Press: London, UK, 1987. [Google Scholar]
  71. Douglas, D.C.; Weinzierl, R.; Davidson, S.C.; Kays, R.; Wikelski, M.; Bohrer, G. Moderating Argos Location Errors in Animal Tracking Data. Methods Ecol. Evol. 2012, 3, 999–1007. [Google Scholar] [CrossRef]
  72. Kranstauber, B.; Kays, R.; Lapoint, S.D.; Wikelski, M.; Safi, K. A Dynamic Brownian Bridge Movement Model to Estimate Utilization Distributions for Heterogeneous Animal Movement. J. Anim. Ecol. 2012, 81, 738–746. [Google Scholar] [CrossRef]
  73. Zhang, G.; Xiao, X.; Dong, J.; Xin, F.; Zhang, Y.; Qin, Y.; Doughty, R.B.; Moore, B. Fingerprint of Rice Paddies in Spatial–Temporal Dynamics of Atmospheric Methane Concentration in Monsoon Asia. Nat. Commun. 2020, 11, 1–11. [Google Scholar] [CrossRef] [PubMed] [Green Version]
  74. Sullivan, J.D.; Takekawa, J.Y.; Spragens, K.A.; Newman, S.H.; Xiao, X.; Leader, P.J.; Smith, B.; Prosser, D.J. Waterfowl Spring Migratory Behavior and Avian Influenza Transmission Risk in the Changing Landscape of the East Asian-Australasian Flyway. Front. Ecol. Evol. 2018, 6, 1–14. [Google Scholar] [CrossRef] [Green Version]
  75. Choi, C.; Lee, K.-S.; Poyarkov, N.D.; Lee, H.; Takekawa, J.Y.; Smith, L.M.; Ely, C.R.; Wang, X.; Cao, L.; Fox, A.D.; et al. Low Survival Rates of Swan Geese (Anser Cygnoides) Estimated from Neck-Collar Resighting and Telemetry. Waterbirds 2016, 39, 277–286. [Google Scholar] [CrossRef]
  76. Yin, S.; Yanjie, X.; Batbayar, N.; Takakawa, J.Y.; Si, Y.; Prosser, D.; Newman, S.H.; Prins, H.H.T.; de Boer, W.F. Do Contrasting Patterns of Migration Movements and Disease Outbreaks between Congeneric Waterfowl Species Reflect Differing Immunity. Geospat. Health 2021, 16, 909. [Google Scholar] [CrossRef]
  77. Martin, V.; Pfeiffer, D.U.; Zhou, X.; Xiao, X.; Prosser, D.J.; Guo, F.; Gilbert, M. Spatial Distribution and Risk Factors of Highly Pathogenic Avian Influenza (HPAI) H5N1 in China. PLoS Pathog. 2011, 7, e1001308. [Google Scholar] [CrossRef] [PubMed]
  78. Gilbert, M.; Prosser, D.J.; Zhang, G.; Artois, J.; Dhingra, M.S.; Tildesley, M.; Newman, S.H.; Guo, F.; Black, P.; Claes, F.; et al. Could Changes in the Agricultural Landscape of Northeastern China Have Influenced the Long-Distance Transmission of Highly Pathogenic Avian Influenza H5Nx Viruses? Front. Vet. Sci. 2017, 4, 225. [Google Scholar] [CrossRef] [PubMed] [Green Version]
  79. Gaidet, N.; Cappelle, J.; Takekawa, J.Y.; Prosser, D.J.; Iverson, S.A.; Douglas, D.C.; Perry, W.M.; Mundkur, T.; Newman, S.H. Potential Spread of Highly Pathogenic Avian Influenza H5N1 by Wildfowl: Dispersal Ranges and Rates Determined from Large-Scale Satellite Telemetry. J. Appl. Ecol. 2010, 47, 1147–1157. [Google Scholar] [CrossRef]
  80. Chen, X.; Li, C.; Sun, H.T.; Ma, J.; Qi, Y.; Qin, S.Y. Prevalence of Avian Influenza Viruses and Their Associated Antibodies in Wild Birds in China: A Systematic Review and Meta-Analysis. Microb. Pathog. 2019, 135, 103613. [Google Scholar] [CrossRef]
  81. Bevins, S.N.; Pedersen, K.; Lutman, M.W.; Baroch, J.A.; Schmit, B.S.; Kohler, D.; Gidlewski, T.; Nolte, D.L.; Swafford, S.R.; DeLiberto, T.J. Large-Scale Avian Influenza Surveillance in Wild Birds throughout the United States. PLoS ONE 2014, 9, e104360. [Google Scholar] [CrossRef] [Green Version]
  82. Van Dijk, J.G.B.; Hoye, B.J.; Verhagen, J.H.; Nolet, B.A.; Fouchier, R.A.M.; Klaassen, M. Juveniles and Migrants as Drivers for Seasonal Epizootics of Avian Influenza Virus. J. Anim. Ecol. 2014, 83, 266–275. [Google Scholar] [CrossRef] [Green Version]
  83. Anisfeld, S.C.; Hill, T.D. Fertilization Effects on Elevation Change and Belowground Carbon Balance in a Long Island Sound Tidal Marsh. Estuaries Coasts 2012, 35, 201–211. [Google Scholar] [CrossRef]
  84. Li, R.; Jiang, Z.; Xu, B. Global Spatiotemporal and Genetic Footprint of the H5N1 Avian Influenza Virus. Int. J. Health. Geogr. 2014, 13, 1–10. [Google Scholar] [CrossRef] [Green Version]
  85. Yin, S.; de Knegt, H.J.; de Jong, M.C.M.; Si, Y.; Prins, H.H.T.; Huang, Z.Y.X.; de Boer, W.F. Effects of Migration Network Configuration and Migration Synchrony on Infection Prevalence in Geese. J. Theor. Biol. 2020, 502, 110315. [Google Scholar] [CrossRef]
  86. Wu, T.; Perrings, C.; Shang, C.; Collins, J.P.; Daszak, P.; Kinzig, A.; Minteer, B.A. Protection of Wetlands as a Strategy for Reducing the Spread of Avian Influenza from Migratory Waterfowl. Ambio 2020, 49, 939–949. [Google Scholar] [CrossRef]
  87. An, S.; Zhang, X.; Song, S.; Zhao, H.; Jeelani, N. Wetlands: Ecosystem Services, Restoration and Wise Use; Springer: Berlin/Heidelberg, Germany, 2019; pp. 187–218. [Google Scholar]
  88. Si, Y.; Wei, J.; Wu, W.; Zhang, W.; Hou, L.; Yu, L.; Wielstra, B. Reducing Human Pressure on Farmland Could Rescue China’s Declining Wintering Geese. Mov. Ecol. 2020, 8, 35. [Google Scholar] [CrossRef]
  89. Yu, H.; Wang, X.; Cao, L.; Zhang, L.; Jia, Q.; Lee, H.; Xu, Z.; Liu, G.; Xu, W.; Hu, B.; et al. Are Declining Populations of Wild Geese in China ‘Prisoners’ of Their Natural Habitats? Curr. Biol. 2017, 27, R376–R377. [Google Scholar] [CrossRef] [PubMed]
  90. Ackerman, J.T.; Takekawa, J.Y.; Orthmyer, D.L.; Fleskes, J.P.; Yee, J.L.; Kruse, K.L. Spatial Use by Wintering Greater White-Fronted Geese Relative to a Decade of Habitat Change in California’s Central Valley. J. Wildl. Manag. 2006, 70, 965–976. [Google Scholar] [CrossRef]
  91. Foden, W.B.; Butchart, S.H.M.; Stuart, S.N.; Vié, J.C.; Akçakaya, H.R.; Angulo, A.; DeVantier, L.M.; Gutsche, A.; Turak, E.; Cao, L.; et al. Identifying the World’s Most Climate Change Vulnerable Species: A Systematic Trait-Based Assessment of All Birds, Amphibians and Corals. PLoS ONE 2013, 8, e65427. [Google Scholar] [CrossRef] [Green Version]
  92. Morin, C.W.; Stoner-Duncan, B.; Winker, K.; Scotch, M.; Hess, J.J.; Meschke, J.S.; Ebi, K.L.; Rabinowitz, P.M. Avian Influenza Virus Ecology and Evolution through a Climatic Lens. Environ. Int. 2018, 119, 241–249. [Google Scholar] [CrossRef] [PubMed]
  93. Vandegrift, K.J.; Sokolow, S.H.; Daszak, P.; Kilpatrick, A.M. Ecology of Avian Influenza Viruses in a Changing World. Ann. N. Y. Acad Sci. 2010, 1195, 113–128. [Google Scholar] [CrossRef]
  94. van Wijk, R.E.; Kölzsch, A.; Kruckenberg, H.; Ebbinge, B.S.; Müskens, G.J.D.M.; Nolet, B.A. Individually Tracked Geese Follow Peaks of Temperature Acceleration during Spring Migration. Oikos 2012, 121, 655–664. [Google Scholar] [CrossRef] [Green Version]
  95. Fei, Y.; ShiQi, Y.; YunQiang, Z.; JuanLe, W. Analysis on Livestock and Poultry Production and Nitrogen Pollution Load of Cultivated Land during Last 30 Years in China. Trans. Chin. Soc. Agric. Eng. 2013, 29, 1–11. [Google Scholar]
  96. Gilbert, M.; Conchedda, G.; Van Boeckel, T.P.; Cinardi, G.; Linard, C.; Nicolas, G.; Thanapongtharm, W.; D’Aietti, L.; Wint, W.; Newman, S.H.; et al. Income Disparities and the Global Distribution of Intensively Farmed Chicken and Pigs. PLoS ONE 2015, 10, 1–14. [Google Scholar] [CrossRef] [Green Version]
  97. Wood, C.; Qiao, Y.; Li, P.; Ding, P.; Lu, B.; Xi, Y. Implications of Rice Agriculture for Wild Birds in China. Waterbirds 2010, 33, 30–43. [Google Scholar] [CrossRef]
  98. Studds, C.E.; Kendall, B.E.; Murray, N.J.; Wilson, H.B.; Rogers, D.I.; Clemens, R.S.; Gosbell, K.; Hassell, C.J.; Jessop, R.; Melville, D.S.; et al. Rapid Population Decline in Migratory Shorebirds Relying on Yellow Sea Tidal Mudflats as Stopover Sites. Nat. Commun. 2017, 8, 14895. [Google Scholar] [CrossRef] [PubMed] [Green Version]
  99. Mackinnon, J.; Verkuil, Y.I.; Murray, N. IUCN Situation Analysis on East and Southeast Asian Intertidal Habitats, with Particular Reference to the Yellow Sea (Including the Bohai Sea); IUCN: Gland, Switzerland; Cambridge, UK, 2012. [Google Scholar]
  100. Melville, D.S.; Peng, H.-B.; Chan, Y.-C.; Bai, Q.; He, P.; Tan, K.; Chen, Y.; Zhang, S.; Ma, Z. Gaizhou, Liaodong Bay, Liaoning Province, China—A Site of International Importance for Great Knot Calidris Tenuirostris and Other Shorebirds. Stilt 2016, 69–70, 57–61. [Google Scholar]
  101. Li, Y.; Mao, D.; Wang, Z.; Wang, X.; Tan, X.; Jia, M.; Ren, C. Identifying Variable Changes in Wetlands and Their Anthropogenic Threats Bordering the Yellow Sea for Water Bird Conservation. Glob. Ecol. Conserv. 2021, 27, e01613. [Google Scholar] [CrossRef]
  102. Delany, S.; Scott, D. Waterbird Population Estimates; Wetlands International: Wageningen, The Netherlands, 2006. [Google Scholar]
  103. Murray, N.J.; Ma, Z.; Fuller, R.A. Tidal Flats of the Yellow Sea: A Review of Ecosystem Status and Anthropogenic Threats. Austral. Ecol. 2015, 40, 472–481. [Google Scholar] [CrossRef] [Green Version]
  104. Lameris, T.K.; Müskens, G.J.D.M.; Kölzsch, A.; Dokter, A.M.; van der Jeugd, H.P.; Nolet, B.A. Effects of Harness-Attached Tracking Devices on Survival, Migration, and Reproduction in Three Species of Migratory Waterfowl. Anim. Biotelemetry 2018, 6, 4–11. [Google Scholar] [CrossRef] [Green Version]
  105. Yin, S.; Xu, Y.; de Jong, M.C.M.; Huisman, M.R.S.; Contina, A.; Prins, H.H.T.; Huang, Z.Y.X.; de Boer, W. Habitat Loss Exacerbates Pathogen Spread: An Agent-Based Model of Avian Influenza Infection in Migratory Waterfowl. bioRxiv 2021, 18, e1009577. [Google Scholar] [CrossRef] [PubMed]
  106. Whitworth, D.; Newman, S.; Mundkur, T.; Harris, P. Wild Birds and Avian Influenza: An Introduction to Applied Field Research and Disease Sampling Techniques; The Food and Agriculture Organization of the United Nations: Rome, Italy, 2017. [Google Scholar]
Figure 1. Percent change in Swan Goose utilization distribution (UD) cell values (10 km resolution) per 1 km2 change in rice paddy habitat area (0.1 = 10% change in cell value per 1 km2 change in rice). Percent changes in UD values were calculated by comparing changes in migration distribution from 2008 and 2014 to changes in rice distribution from 2000 to 2015. Positive values indicate that change in UD values matched the directional change in rice (both increased or both decreased), while negative values indicate opposing trends. Changes in rice paddy habitat of less than 5 km2 were not included in the analysis.
Diversity 15 00601 g001
Figure 2. Spring migration utilization distributions in the East Asian-Australasian Flyway determined via dynamic Brownian Bridge Movement Models for Eurasian Wigeon (n = 5) and Northern Pintail (n = 9) marked on the Mai Po Nature Reserve in Hong Kong (2008–2010), and Garganey (n = 1), Common Teal (n = 3) and Falcated Teal (n = 4) marked on Poyang Lake (2007–2008). Flight corridors (blue, 99%), core movement areas (pink: 75%), and stopover locations (dark purple: 50%) are indicated.
Diversity 15 00601 g002
Figure 3. Fall migration utilization distributions in the East Asian-Australasian Flyway determined via dynamic Brownian Bridge Movement Models for Swan Geese marked in northeastern Mongolia in 2008 (n = 9) and 2014 (n = 9). Flight corridors (blue: 99%), core movement areas (pink: 75%), and stopover locations (purple: 50%) are indicated.
Diversity 15 00601 g003
Figure 4. Distribution and change in rice paddy habitats across southeast and northeast China from 2000 to 2015. Panels A and B show rice distribution in 2000 while panels C and D show distribution in 2015. The change from 2000 to 2015 is illustrated in panels E and F. Rice distribution is provided at 500 m resolution and taken from Zhang et al. [7]. Change in rice is calculated for 100 km2 cells. Only changes > 5 km2 were included to conservatively report area changes that are likely biologically meaningful for waterfowl response.
Diversity 15 00601 g004
Figure 5. Changes in spring migration utilization distributions determined via dynamic Brownian Bridge Movement Model for Eurasian Wigeon (n = 5) and Northern Pintail (n = 9) marked on the Mai Po Nature Reserve in Hong Kong (2008–2010), and Garganey (n = 1), Common Teal (n = 3) and Falcated Teal (n = 4) marked on Poyang Lake (2007–2008), based on changes in rice paddy habitat across southeastern China. Values of each cell within the original utilization distribution (10 km2 resolution) were increased or decreased by 5% (Panels A and B) and 10% (Panels C and D) per km2 change in rice paddy habitat within that cell. Cell values were then rescaled such that all cell values would fall between 0 and 1. Changes in rice paddy habitats were only included in the analyses if they were ≥5 km2 to conservatively estimate the biological effects of the change in area at this scale.
Diversity 15 00601 g005
Figure 6. Changes in spring migration utilization distributions determined via dynamic Brownian Bridge Movement Models for Eurasian Wigeon (n = 5) and Northern Pintail (n = 9) marked on the Mai Po Nature Reserve in Hong Kong (2008–2010), and Garganey (n = 1), Common Teal (n = 3) and Falcated Teal (n = 4) marked on Poyang Lake (2007–2008), based on changes in rice paddy habitat across northeastern China. Values of each cell within the original utilization distribution (10-km2 resolution) were increased or decreased by 5% and 10% per km2 change in rice paddy habitat within that cell. Change values were then rescaled such that all cell values would fall between 0 and 1. Changes in rice paddy habitats were only included in the analyses if they were ≥5 km2 to conservatively estimate the biological effects of the change in area at this scale.
Diversity 15 00601 g006
Disclaimer/Publisher’s Note: The statements, opinions and data contained in all publications are solely those of the individual author(s) and contributor(s) and not of MDPI and/or the editor(s). MDPI and/or the editor(s) disclaim responsibility for any injury to people or property resulting from any ideas, methods, instructions or products referred to in the content.

