Article

Major Cuban Green Turtle Rookeries: Identification of Management Units and Their Genetic Relationships with Other Greater Caribbean Populations

by
Julia Azanza-Ricardo
1,*,
F. Alberto Abreu-Grobois
2,
Ken Oyama
3,
Omar Chassin-Noria
4,
Georgina Espinosa-López
5 and
Gaspar González-Sansón
6
1
Instituto Superior de Tecnologías y Ciencias Aplicadas, Universidad de La Habana, Quinta de los Molinos, Municipio Plaza de la Revolución, Ciudad Habana 10400, Cuba
2
Laboratorio de Genética, Unidad Académica Mazatlán, Instituto de Ciencias del Mar y Limnología, Universidad Nacional, Autónoma de México, Mazatlán 82040, Sinaloa, Mexico
3
Escuela Nacional de Estudios Superiores (ENES) Unidad Morelia, UNAM, Morelia 58190, Michoacán, Mexico
4
Facultad de Biología, CMEB, Universidad Michoacana de San Nicolás de Hidalgo, Morelia 58004, Michoacán, Mexico
5
Facultad de Biología, Universidad de La Habana, Plaza de la Revolución, Ciudad Habana 10400, Cuba
6
Departamento de Estudios para el Desarrollo Sustentable de Zonas Costeras, Universidad de Guadalajara, Guadalajara 48980, Jalisco, Mexico
*
Author to whom correspondence should be addressed.
Diversity 2023, 15(5), 586; https://doi.org/10.3390/d15050586
Submission received: 4 March 2023 / Revised: 16 April 2023 / Accepted: 17 April 2023 / Published: 23 April 2023

Abstract

:
Genetic monitoring of highly migratory endangered species is fundamental for effective management, particularly when they are shared internationally, and their populations need to be identified. A prime example is the green turtle, Chelonia mydas, whose genetic structure has been extensively studied in the Western Atlantic. Nevertheless, the identification of Cuban management units has remained uncertain, despite representing regionally significant nesting assemblages and occurring within a strategically central position. Compared to previous work, the current study used 800 bp mtDNA control region sequences and larger sample sizes (n = 189 from four nesting sites in SW Cuba). Of the 23 resolved haplotypes, nine were novel, fourteen were reported in Cuba for the first time, and eleven were endemic. Even though the distribution of nesting grounds barely spans 300 km, three management units were identified: Guanahacabibes-San Felipe (GUCB; with most of the endemic haplotypes), Isla de la Juventud (IJCB; with a predominance of haplotype CM-A13.1), and Cayo Largo (CLCB; with a haplotype profile closely related to Southern Caribbean rookeries). We discuss how the geographic distribution of mtDNA variation has likely been shaped by local and regional oceanic current patterns or derived from formerly hyperabundant regional populations. Genetic characterization of Cuban management units represents a significant contribution, filling critical knowledge gaps that have hampered the comprehensive mixed-stock analyses required to guide effective regional conservation strategies.

1. Introduction

Conservation genetics is crucial for developing and evaluating strategies to preserve endangered species. Reliable monitoring begins with identifying individual breeding assemblages or management units (MUs) and evaluating their spatial dimension and geographic distribution. This is fundamental for monitoring and understanding population dynamics, growth, and microevolutionary changes [1]. One of the most successful ways to distinguish MUs in reproduction, foraging, and developmental habitats is by combining tag–recapture programs with genetic markers [2,3,4,5]. Genetic monitoring allows us to track the distribution of MUs while providing insight into effective population size and genetic changes over time. Furthermore, population bottlenecks may occur without being detected by traditional tag–recapture [3], while genetic approaches can detect past bottlenecks to distinguish long-term evolutionary effects from recent human-induced changes [1].
Species such as sea turtles are challenging to study because of complex life cycles and extensive migrations. Genetics has provided an insight into sea turtles’ life cycles in relation to their conservation, helping to clarify the natal homing behavior, multiple paternity, connectivity between foraging areas and rookeries of origin, determining population genetic structure, and detecting hybridization [6]. Nevertheless, identifying MUs in these species can be problematic as, in some regions, they are composed of a single rookery and, in others, by a group of neighboring rookeries. Additionally, feeding and developmental areas may contain a mixture of different MUs, often originating from distant sources [7]. Accurate assessment of population structure and stock distribution in sea turtles depends on molecular markers with sufficient diversity to detect and resolve differentiation between populations and a comprehensive and representative sampling of individuals and rookeries to provide precise estimates of the fine-scale genetic differentiation among breeding assemblages [8].
In the case of the green sea turtle (Chelonia mydas), despite carrying out extensive migrations, high levels of genetic differentiation have been found among rookeries using mitochondrial DNA markers (mtDNA) [9,10]. These result from characteristic philopatry, nest-site fidelity, and stock-specific migration circuits between particular nesting and feeding grounds. Hence, reliable genetic characterization of each rookery is essential in a regional context to distinguish the geographic distribution and sources of observed diversity [11].
Within the Greater Caribbean, the highest nesting abundance for green turtles occurs in mainland habitats. For example, more than 120,000 nests/year (estimated from [12]) are deposited in Tortuguero, Costa Rica, and more than 18,000 in Quintana Roo, Mexico (estimated from [13]). Large nesting colonies in island habitats are rare. The only sites with more than 500 nests per year are in Aves Island, Venezuela (nearly 3000) [13], and in Cuba [14]. In the latter, the major nesting sites are concentrated on the southwestern coast [15]: the Guanahacabibes Peninsula [15], Cayos de San Felipe, and Isla de la Juventud (each hosting approximately 100–500 nests per season), and Cayo Largo (more than 1000 nests per season; Figure 1A) [16]. Cuban habitats have a strategic position due to being located at a central position within the major regional migratory corridors of at least two Caribbean sea turtle species, Eretmochelys imbricata and Chelonia mydas [15,17], and close to oceanic currents such as the Yucatan/Loop Current, which may have a significant influence on the regional dispersion of early life-history stages [18].
Despite the regional relevance of Cuban rookeries, only two published genetic surveys are available to date, for Caretta caretta [19] and for Chelonia mydas [20], both of which analyzed small sample sizes (<30) and used a short sequence of mtDNA control region (<500 bp), which may have underestimated the actual variability [21,22]. To overcome such limitations, our study used longer mtDNA sequences (>800 bp), larger sample sizes (n = 189), and broader geographic coverage compared to previous work [19] to identify Cuban management units and evaluate their evolutionary relationships with regional rookeries.
Figure 1. Sampled green turtle nesting sites in Southwestern Cuba (A) and Guanahacabibes Peninsula (B). The size of the circles indicates relative magnitudes of average annual nest counts (data from [23]). Arrows indicate the directions of ocean currents off the southwestern Cuban platform during the summer period (Blue = Yucatan Current flowing northwards, red = Cuban Countercurrent, and green = coastal currents flowing inside Batabanó Gulf). Map was modified from Maptool output (seaturtle.org, Maptool 2002).
Diversity 15 00586 g001

2. Materials and Methods

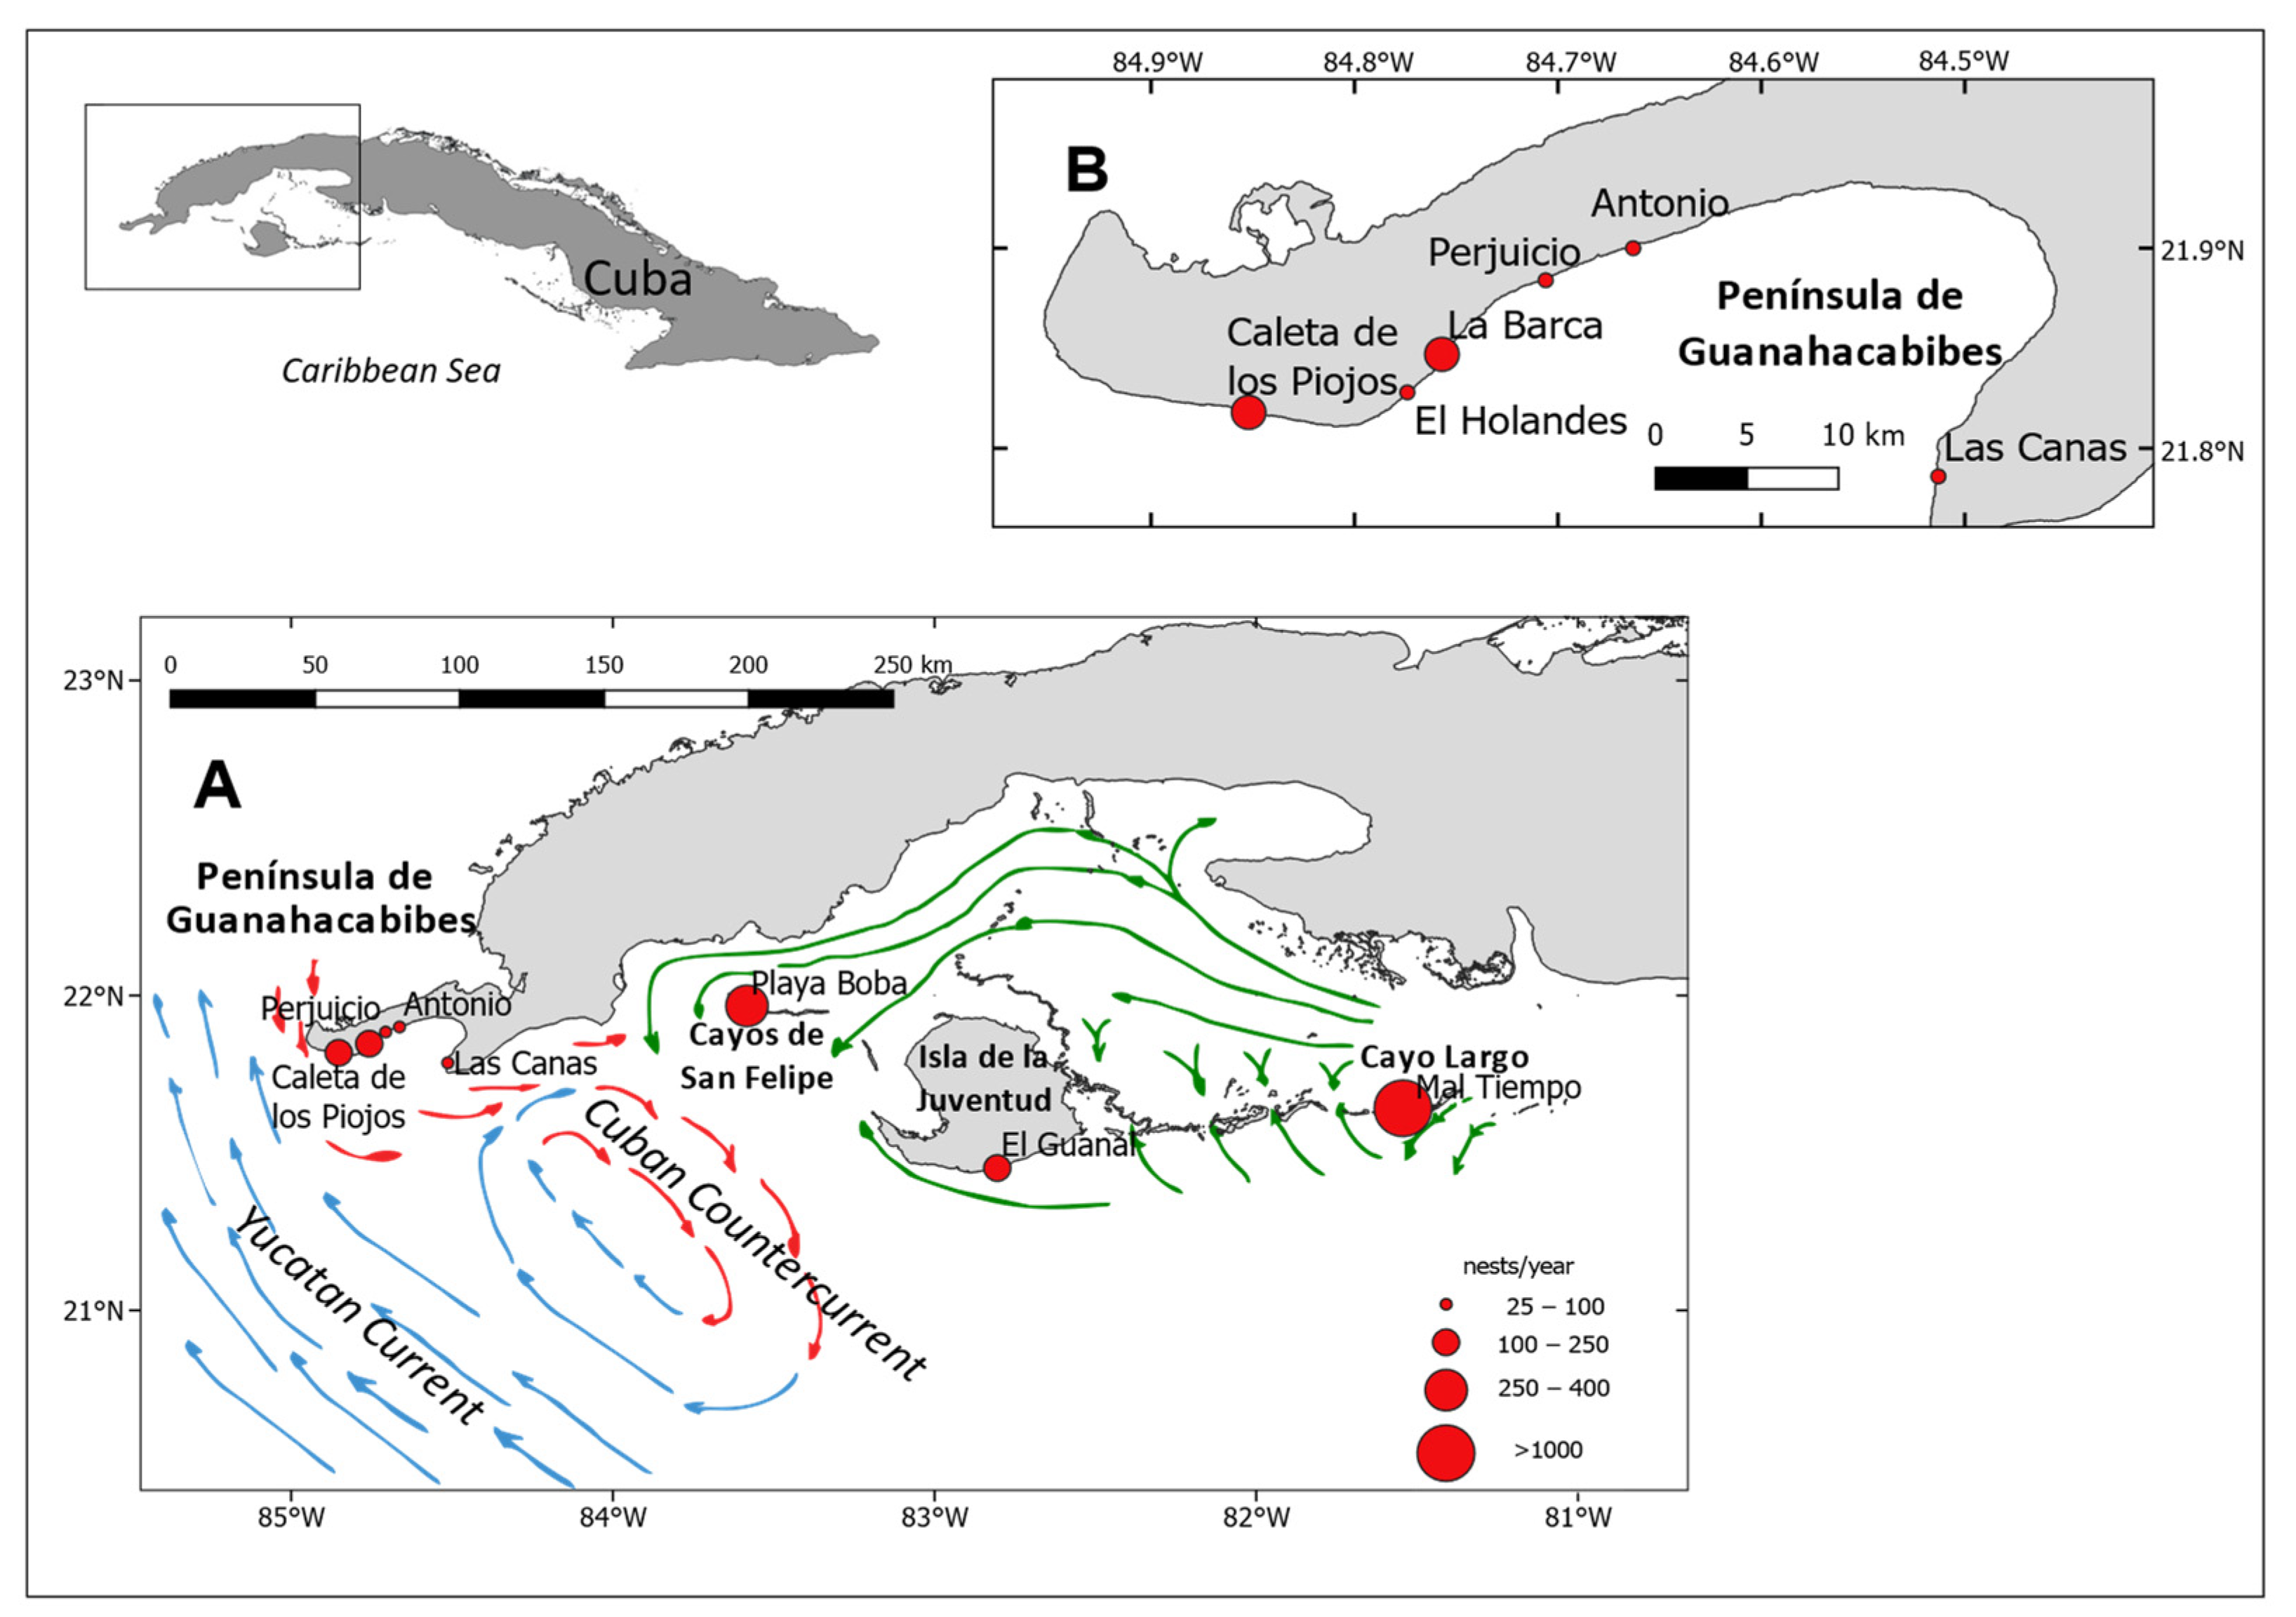
2.1. Sampling and Study Site

In total, 189 samples were collected from four nesting areas in Southwestern Cuba, between 1998 and 2007 (Figure 1). Six rookeries were sampled from the Guanahacabibes Peninsula (Figure 1B; 21.818° N, 84.852° W, to 21.786° N, 84.513° W): Caleta de los Piojos (n = 44), El Holandés (5), La Barca (21), Perjuicio (18), Antonio (43), and Las Canas (4). We added samples from El Guanal beach (9) in the southern end of Isla de la Juventud (21.452° N, 82.805° W) and from Mal Tiempo, Cayo Largo (81.557° W, 97 21.59° N) (34). We also reanalyzed previously reported samples [19] from playa Boba, San Felipe (21.967° N, 95 83.583° W) (11) (Figure 1A) (34). All samples came from dead embryos collected from nests of different tagged females or within a ten-day nesting interval to avoid resampling offspring from the same females.

2.2. Laboratory Analyses

Genomic DNA was extracted from 30 to 40 mg of muscle tissue following [24]. Amplification of an approximately 860 bp fragment from the mtDNA control region was carried out using primers LCM15382 (GCTTAACCCTAAAGCATTGG) and H950g (GTCTCGGATTTAGGGGTTT) [22]. The reaction mixture consisted of 1.0 mM MgCl2, 10 X PCR buffer (500 mM KCl, 100 mM Tris-HCl pH 9.0, and 1% Triton X-100), 0.136 mM each dNTP, 0.4 mM each primer, 1.0 U Taq, 1 μL template DNA (20–100 ng) and H2O for a total volume of 25 μL. PCR was performed using a Perkin-Elmer Inc. thermal cycler with the following protocol: initial denaturing at 95 °C for 5 min, 35 cycles of denaturation at 95 °C for 30 s, primer annealing at 50 °C for 1 min, and extension at 72 °C for 1 min, followed by a final extension at 72 °C for 5 min. The resultant products were purified using ethanol precipitation. Sequencing was performed by Macrogen, Inc. (Seoul, Republic of Korea) in an Applied Biosystems DNA Analyzer 3730 xl.
The sequences were aligned and visually corroborated with BioEdit Sequence Alignment Editor ver. 7.0.5.3 [25] and polymorphic sites numbered from the start of the mtDNA control region [26]. In sequences with indels of more than one base pair, the position of the first nucleotide identified the site, and the rest of the numbering was assigned as if there had only been a single base change. For further genetic analyses, the six-bp insert found in two haplotypes was coded as a single base change. Control region haplotypes were identified by comparing them against the reference catalog (http://sites.clas.ufl.edu/accstr/files/cmlongmtdna.pdf accessed on 13 May 2020) in the Archie Carr Center for Sea Turtle Research (ACCSTR). Short haplotypes were identified using the first 490 bp of the sequence (equivalent to using previous primer pairs) [27] and long versions using the entire 860 bp sequence. Haplotype profiles for nesting rookeries outside of Cuba used for comparisons were obtained from the following sources: Florida (Central Eastern Florida, CEFL, and South of Florida, FL, USA) [18,27]; Northern Range Limit for the species in USA, NUSA [28]; QRMX: Quintana Roo ([29]; modified according to [18]) and RNMX [18]; TORT: Tortuguero, Costa Rica [30,31]; BUCK: Buck Island, USVI, AVES: Aves Island, Venezuela, and SURN: Galibi, Surinam [31]; GUAD: Guadeloupe, FGU: French Guiana [32]; CAYM: Cayman Islands [33]; Haplotypes from Quintana Roo were each converted to the most common long sequence haplotypes using the criteria employed by Shamblin et al. [27] to avoid loss of the resolution for the rookeries in this study. For the Cayman Islands, haplotype profiles for wild animals were used exclusively to avoid bias from extraneous haplotypes in farmed turtles.

2.3. Data Analysis

Haplotype (h) and nucleotide (π) diversities were calculated using dnaSP 5.0 [34] and Arlequin v. 3.5.2.2 [35]. Spatial differentiation among rookeries was examined using pairwise frequency-based Fst comparisons and the exact test of differentiation using Arlequin v. 3.5.2.2, as well as a Chi-square test (only for Cuban rookeries). Groupings of local and regional rookeries were tested using haplotype frequency-based AMOVA with Arlequin [35] and the software Barrier [36]. Optimal groupings under AMOVA were identified using the highest Fct values while minimizing the Fsc value. Following these comparisons, proximal sample sites that were not significantly different using both tests were pooled for further analyses. Dendrograms based on the Fst distance matrix were constructed using MEGA X [37]. Relationships between genetic and geographic distances were determined with Pearson’s correlation using STATISTICA 7.0. TCS v. 1.21 [38] was used to estimate the most parsimonious genealogy between haplotypes and resulting networks finished with the web-based TCS Beautifier [39]. For all statistical analyses, p-values less than 0.05 were considered significant.

3. Results

3.1. Genetic Diversity

Based on the shorter 490 bp mtDNA sequenced fragment, 12 haplotypes were identified with no new sequences. Some haplotypes were only found in single rookeries (CM-A5, CM-A16, CM-A57 in Caleta de los Piojos; CM-A17 in Isla de la Juventud), while the rest were present in at least three different rookeries. Using the longer 860 bp segment, an additional four polymorphic sites were found, increasing the number of haplotypes in the Cuban nesting populations to 23, of which 11 were new records for the species).
The novel haplotypes resulted from splitting the two most common and widespread in the North Atlantic green turtle mtDNA short haplotypes (CM-A1 and CM-A3), into 5 and 4 new long variants, respectively, most of which appear to be endemic (Table S1). Four additional short haplotypes (CM-A13, CM-A18, CM-A27, and CM-A48) were split into two each, using the longer sequence. Polymorphisms in the new sites consisted of two transitions, one transversion, and two indels present in at least one of the variants of all the divided haplotypes. CM-A48 contains a six-bp indel and has an additional indel in both new haplotypes (CM-A48.2 and CM-A48.3), distinct from the previously described long sequence CM-A48.1. One of the other three polymorphic sites was found only in CM-A5 haplotype, and the other two were found only in the CM-A1 and CM-A3 haplotypes.

3.2. Identification of Cuban Management Units

Because samples from the El Holandés and Las Canas rookeries (Figure 1B) were less than five (Table S1), they were excluded from further analyses. All genetic differentiation tests with C Piojos were significant (Table 1), while all others, except Isla de la Juventud and Cayo Largo, were non-significant in the Fst test. In the X2 test, at least one was non-significant. Notably, the highest differentiation estimates were for comparisons involving the Isla de la Juventud and Cayo Largo rookeries.
Although AMOVA results (Table S2) indicated the maximal Fct value (0.168, p < 0.05) when clustering San Felipe and all Guanahacabibes rookeries while keeping the remaining two rookeries (I Juventud and Cayo Largo) separate, both Barrier (Figure S1) and genetic differentiation analysis (Table 1) split C. Piojos from the rest of Guanahacabibes, thus reflecting its contrasting composition with a significant genetic difference and a distinct proportion of CM-A1 haplotypes. However, as (1) the nesting beaches in the Guanahacabibes Peninsula are very close to each other (the greatest distance between Guanahacabibes rookeries is less than 15 km), (2) our 20-year tag–recapture data indicate nesting at Piojos by females tagged elsewhere in the Peninsula, and vice versa, and (3) with relatively frequent exchange of females among all Guanahacabibes rookeries (7% of tagged females failed to nest in the same beach, and of these, 37% nested in more than one beach in the Peninsula), we grouped the entire Guanahacabibes rookeries with San Felipe as a single breeding assemblage. Thus, three demographically independent breeding clusters were identified: Guanahacabibes rookeries + San Felipe (GUCB), Isla de la Juventud (IJCB), and Cayo Largo (CLCB).

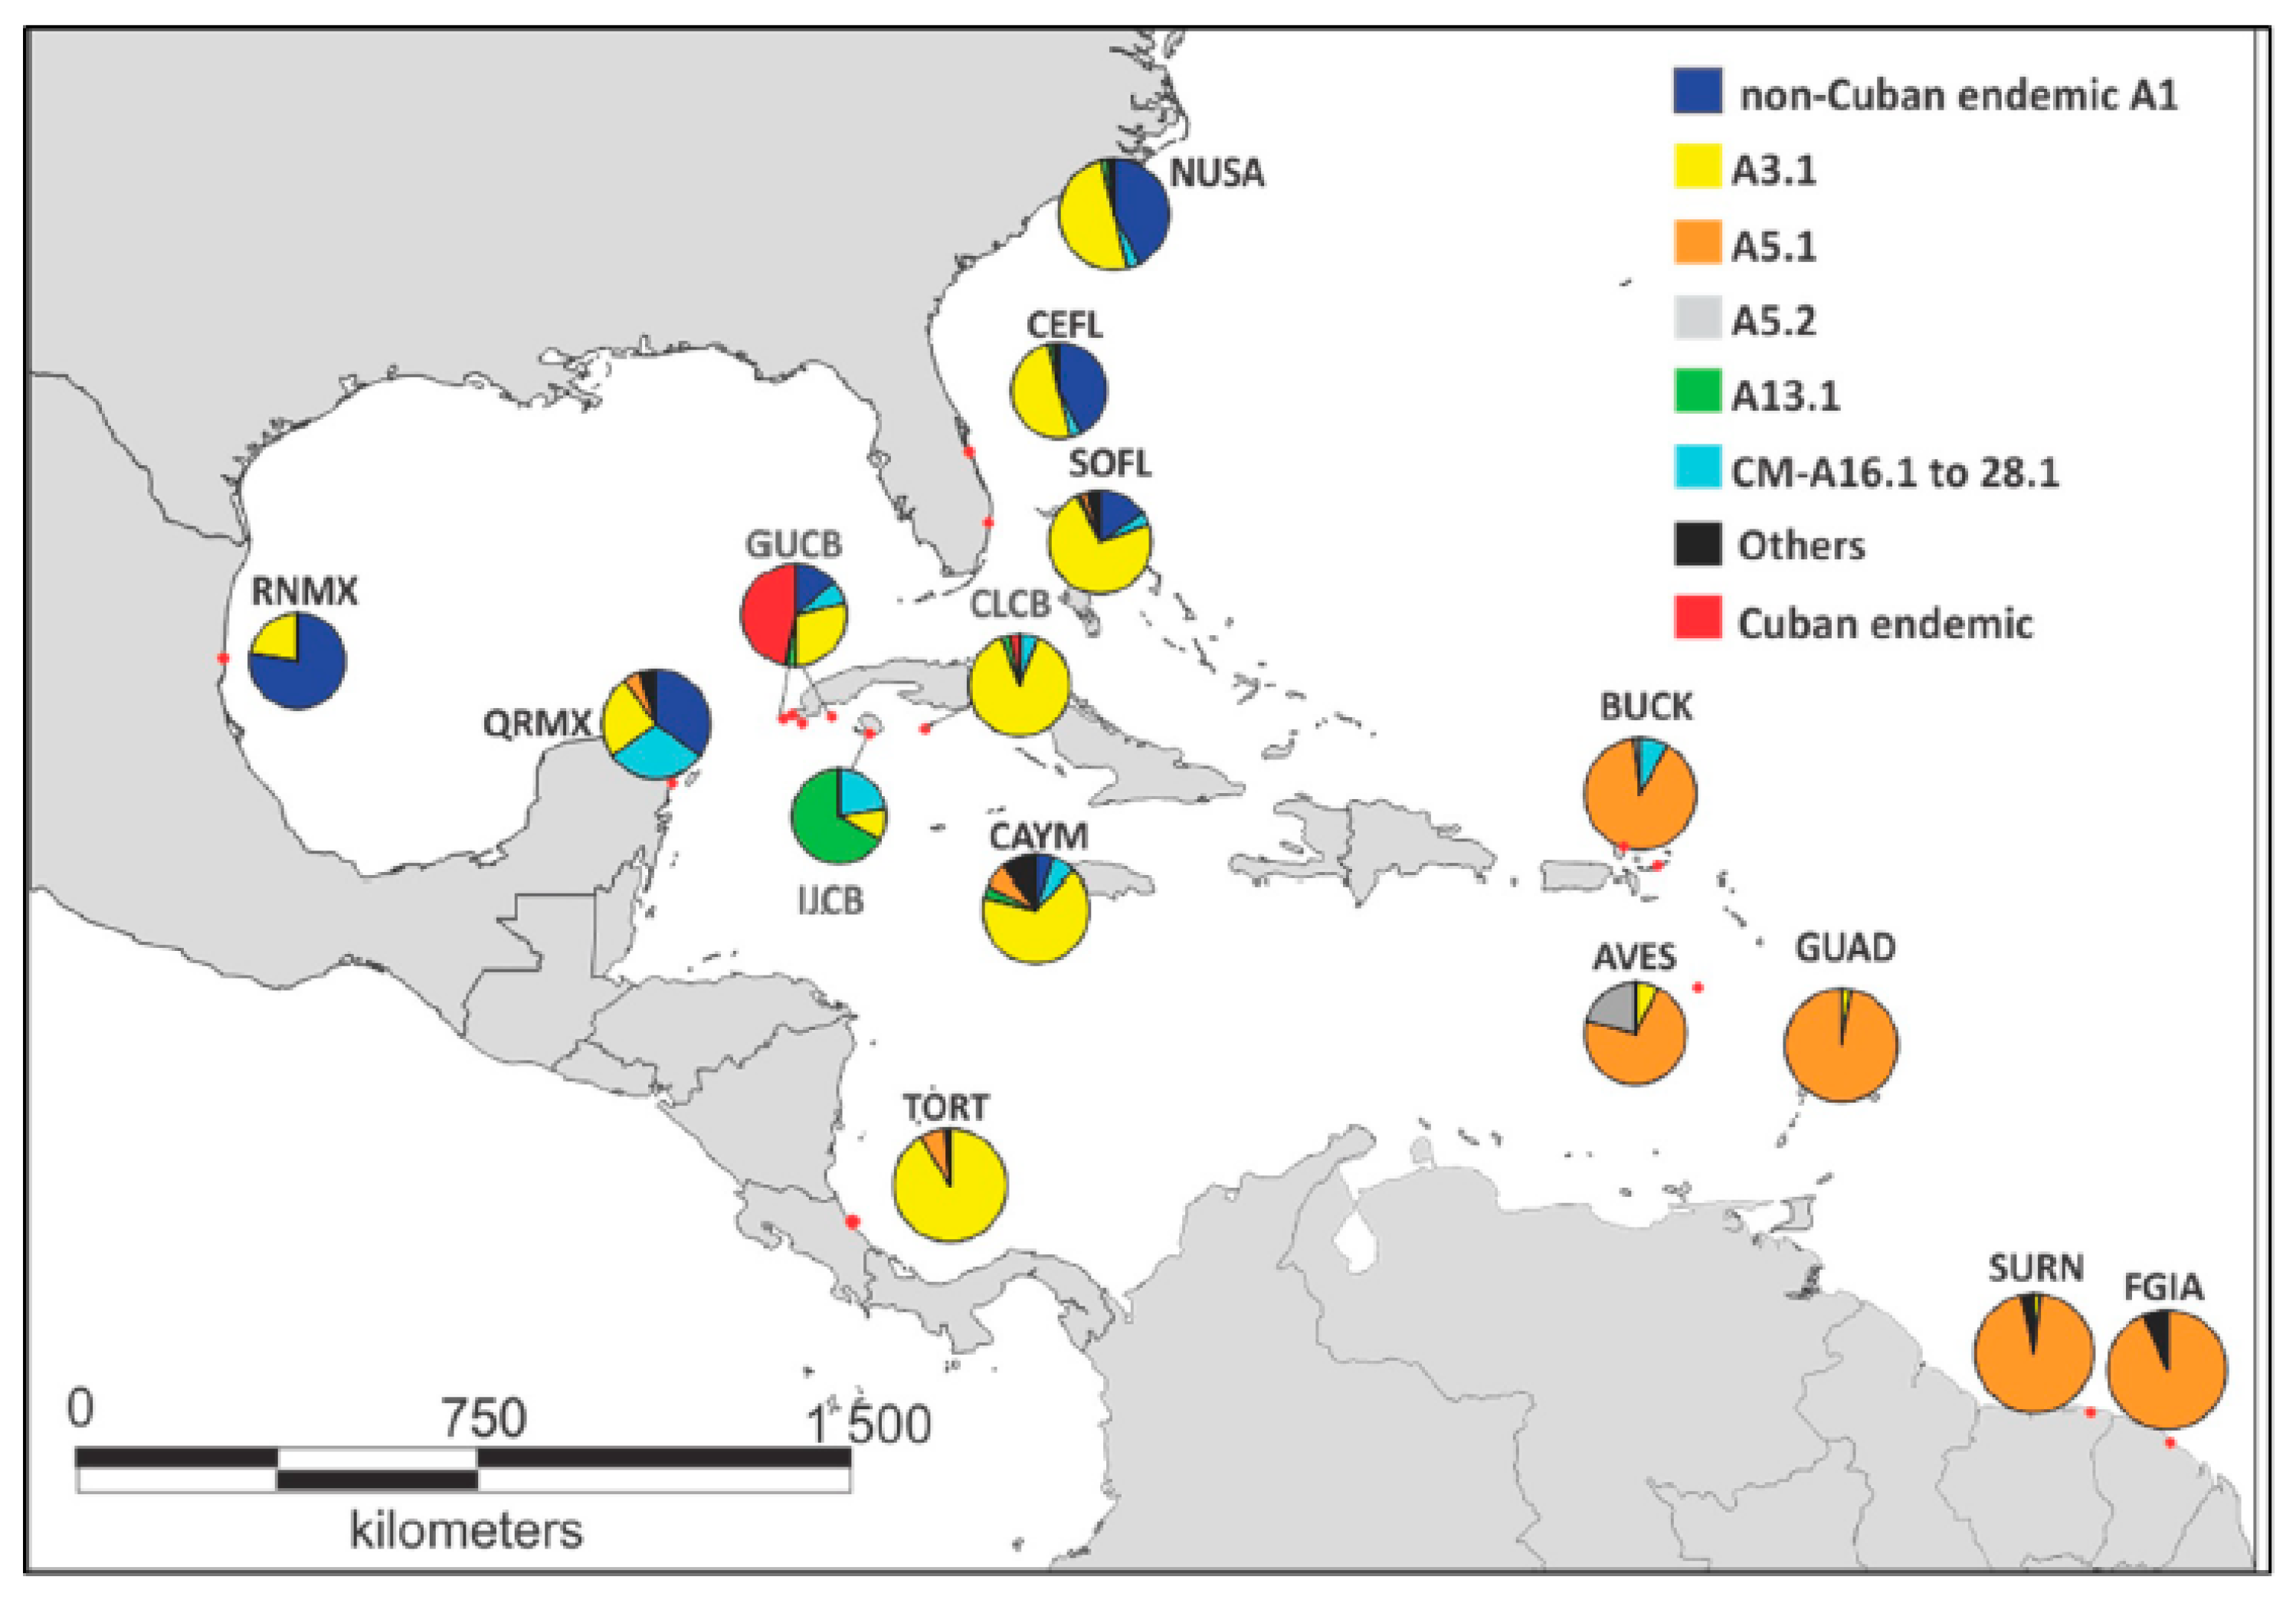
3.3. Cuban Rookeries in the Wider Caribbean Context

Pairwise comparisons between Cuban MUs and previously surveyed regional rookeries using frequency-based Fst for both long and short sequences (Table 2) indicated significant genetic differentiation for two of the three Cuban MUs in all tests. The exception was CLCB which exhibited close genetic relationships with TORT and SOFL (Fst = 0.02, n.s) using long and short sequences.
Table 2. Pairwise genetic differentiation between regional green turtle management units, including Cuban representatives (highlighted in bold), based on 860 bp (A) and 490 bp (B) haplotypes. Pairwise FST values are below the diagonal, and non-differentiation exact p-values above the diagonal. Benjamini and Yekutieli [40] significance with FDR = 0.05 was used. Non-significant comparisons are indicated by gray shading.
ANUSASOFLCEFLRNMXQRMXGUCBIJCBCLCBCAYMTORTBUCKAVESGUADSURNFGU
NUSA 0.0040.0060.0050.0120.0000.0000.0000.0070.0000.0000.0000.0000.0000.000
SOFL0.043 0.0000.0000.0010.0000.0000.0550.0200.0000.0000.0000.0000.0000.000
CEFL0.0380.181 0.3270.0050.0000.0000.0000.0000.0000.0000.0000.0000.0000.000
RNMX0.1000.2070.001 0.0090.0000.0000.0000.0000.0000.0000.0000.0000.0000.000
QRMX0.0720.1570.0990.072 0.0010.0000.0000.0070.0040.0000.0000.0000.0000.000
GUCB0.0910.1550.1710.1150.060 0.0000.0000.0000.0000.0000.0000.0000.0000.000
IJCB0.6340.5990.6620.7600.2990.362 0.0000.0000.0000.0000.0000.0000.0000.000
CLCB0.1930.0220.3300.5690.2710.2000.800 0.0000.1130.0000.0000.0000.0000.000
CAYM0.0490.0280.1910.1480.0370.1040.3700.059 0.0070.0200.0000.0000.0070.000
TORT0.1120.0350.2520.2390.1880.2250.5470.0220.003 0.0000.0000.0000.0000.000
BUCK0.8710.8660.9090.8780.7810.7890.8340.8870.7770.820 0.1700.2050.0950.255
AVES0.8570.8580.9040.8600.7780.7880.8260.8690.7740.8160.015 0.1790.0300.098
GUAD0.9250.8930.9240.9500.8540.8190.9300.9510.8240.8390.0080.025 0.7710.754
SURN0.9300.9000.9260.9500.8800.8340.9370.9520.8480.8450.0260.044−0.015 0.642
FGU0.9210.8930.9230.9540.8580.8210.9220.9440.8290.8390.0010.018−0.018−0.009
BNUSASOFLCEFLRNMXQRMXGUCBIJCBCLCBCAYMTORTBUCKAVESGUADSURNFGU
NUSA 0.0040.0060.00080.0120.0010.0000.0000.0070.0000.0000.0000.0000.0000.000
SOFL0.050 0.0000.0000.0010.0000.0000.0740.1240.0000.0000.0000.0000.0000.000
CEFL0.0430.198 0.3270.0050.0000.0000.0000.0000.0000.0000.0000.0000.0000.000
RNMX0.1090.2250.000 0.0130.0000.0000.0000.0000.0000.0000.0000.0000.0000.000
QRMX0.0810.1760.1070.071 0.0040.0000.0000.0020.0040.0000.0000.0000.0000.000
GUCB0.0540.1390.0890.0740.040 0.0000.0000.0000.0000.0000.0000.0000.0000.000
IJCB0.6600.6290.6850.7600.3120.448 0.0000.0000.0000.0000.0000.0000.0000.000
CLCB0.2140.0200.3540.5890.2850.2170.814 0.0600.1170.0000.0000.0000.0000.000
CAYM0.0560.0100.2220.1920.0700.1010.4540.037 0.0780.0000.0000.0000.0000.000
TORT0.1120.0320.2580.2390.1860.1850.5480.0220.0192 0.0000.0000.0000.0000.000
BUCK0.8780.8770.9160.8800.7890.8410.8370.8910.8140.820 0.2960.1940.1040.235
AVES0.8650.8680.9110.8650.7780.8330.8290.8760.8030.811−0.002 0.3970.1390.226
GUAD0.9310.9040.9310.9500.8600.8720.9300.9540.8630.8390.0090.007 0.7690.748
SURN0.9350.9090.9320.9500.8840.8820.9360.9540.8810.8450.02680.027−0.016 0.599
FGU0.9260.9030.9300.9400.8620.8720.9200.9450.8640.8390.0110.011−0.018−0.008
The relationship between long-sequence genetic differentiation and geographic distances indicates three rookery clusters (Figure 2). The first includes differences between relatively close areas <2000 km (except for GUCB and IJCB), which increased with geographic distance (group I; r = 0.33, p = 0.04). The second group (II) included comparisons between GUCB and IJCB and between those two and the rest of the Western Caribbean populations. In this case, a steep rise in genetic differences with geographic distances was found despite the short distances involved. The third (III) involves comparisons between Western and Eastern Caribbean rookeries. The relationship between genetic and geographic distances was insignificant in this case. Nevertheless, these results indicate that the genetic differentiation of GUCB and IJCB does not conform to the general isolation by distance pattern observed for the regional rookeries.
Well-differentiated haplotype profiles for the Cuban MUs become evident when the geographic distribution of green turtle mtDNA haplotypes is compared within the Wider Caribbean (Figure 3). The most distinctive profile is for GUCB rookeries, where although the CM-A3.1 is the single most abundant haplotype (30%), the group of Cuban endemic haplotypes makes up 47% of the total. IJCB, on the other hand, is the only rookery in the region with a predominance of haplotype CM-A13.1. In contrast, CLCB contains mainly regionally shared haplotypes, primarily CM-A3.1.
Region-wide patterns are also evident. For example, there is a north-to-south reduction in the most common CM-A1 haplotypes, a predominance of CM-A3.1 in the Central Caribbean, and CM-A5 variants in the southeastern portion of the range.

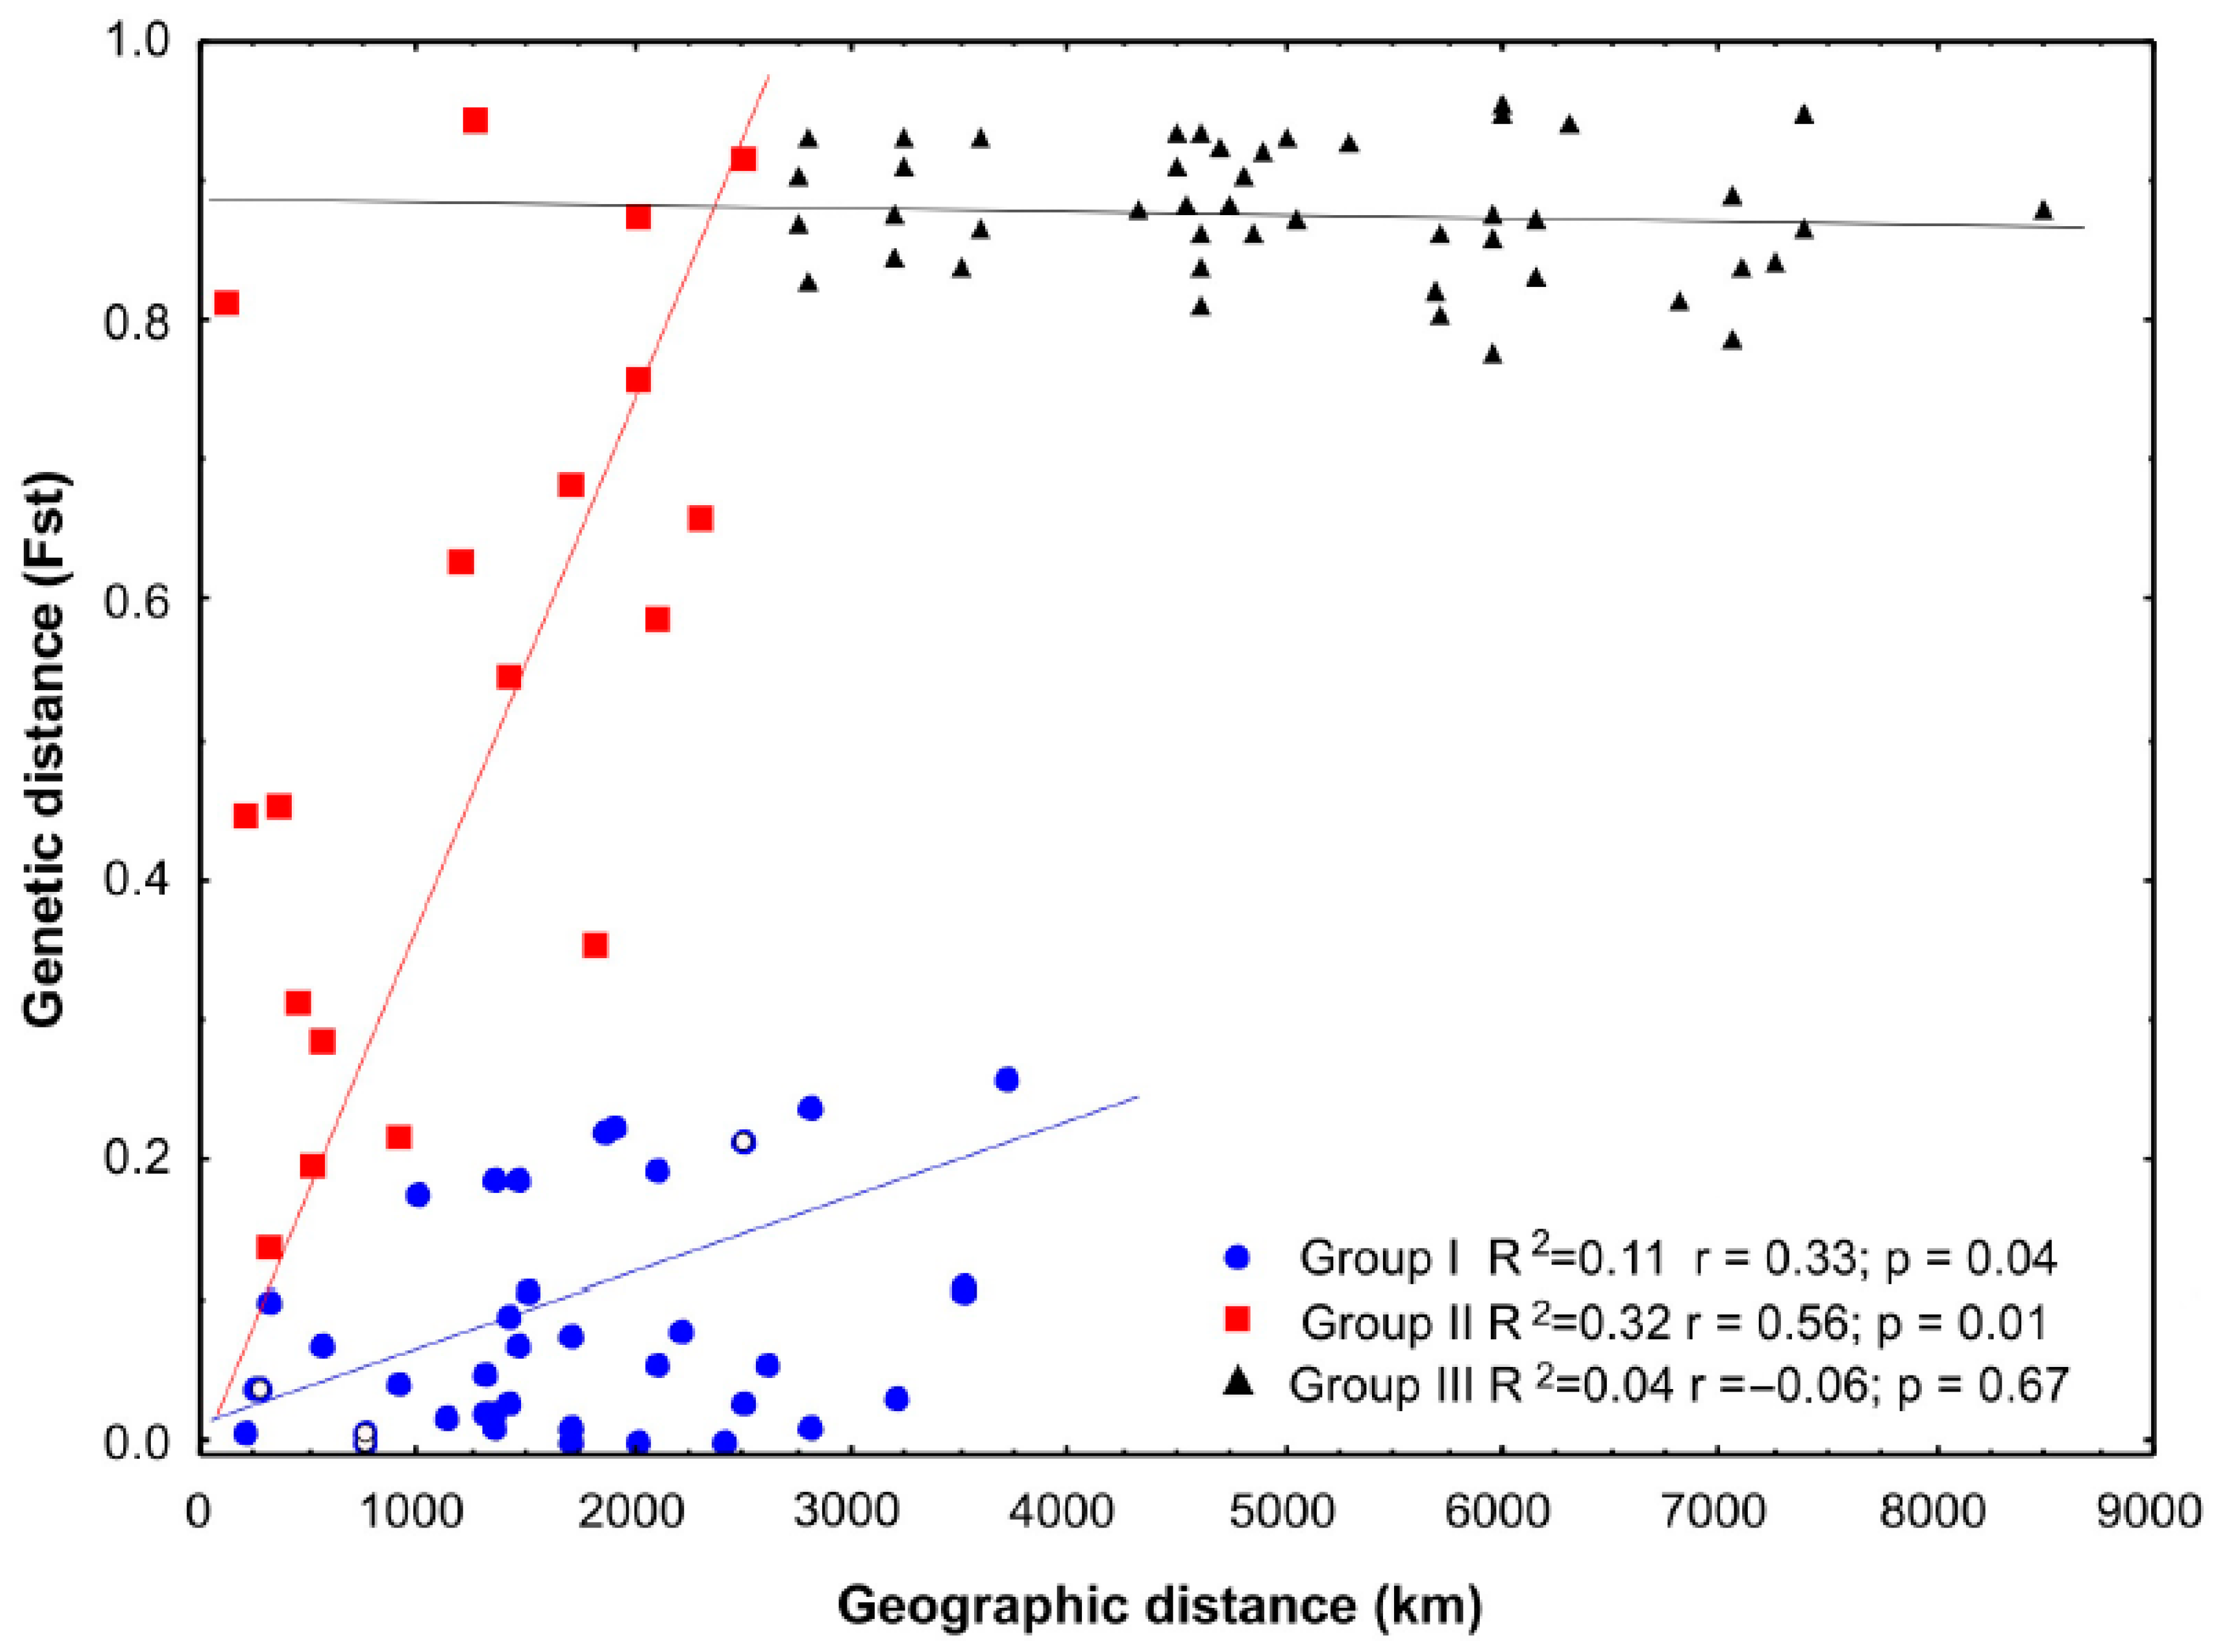
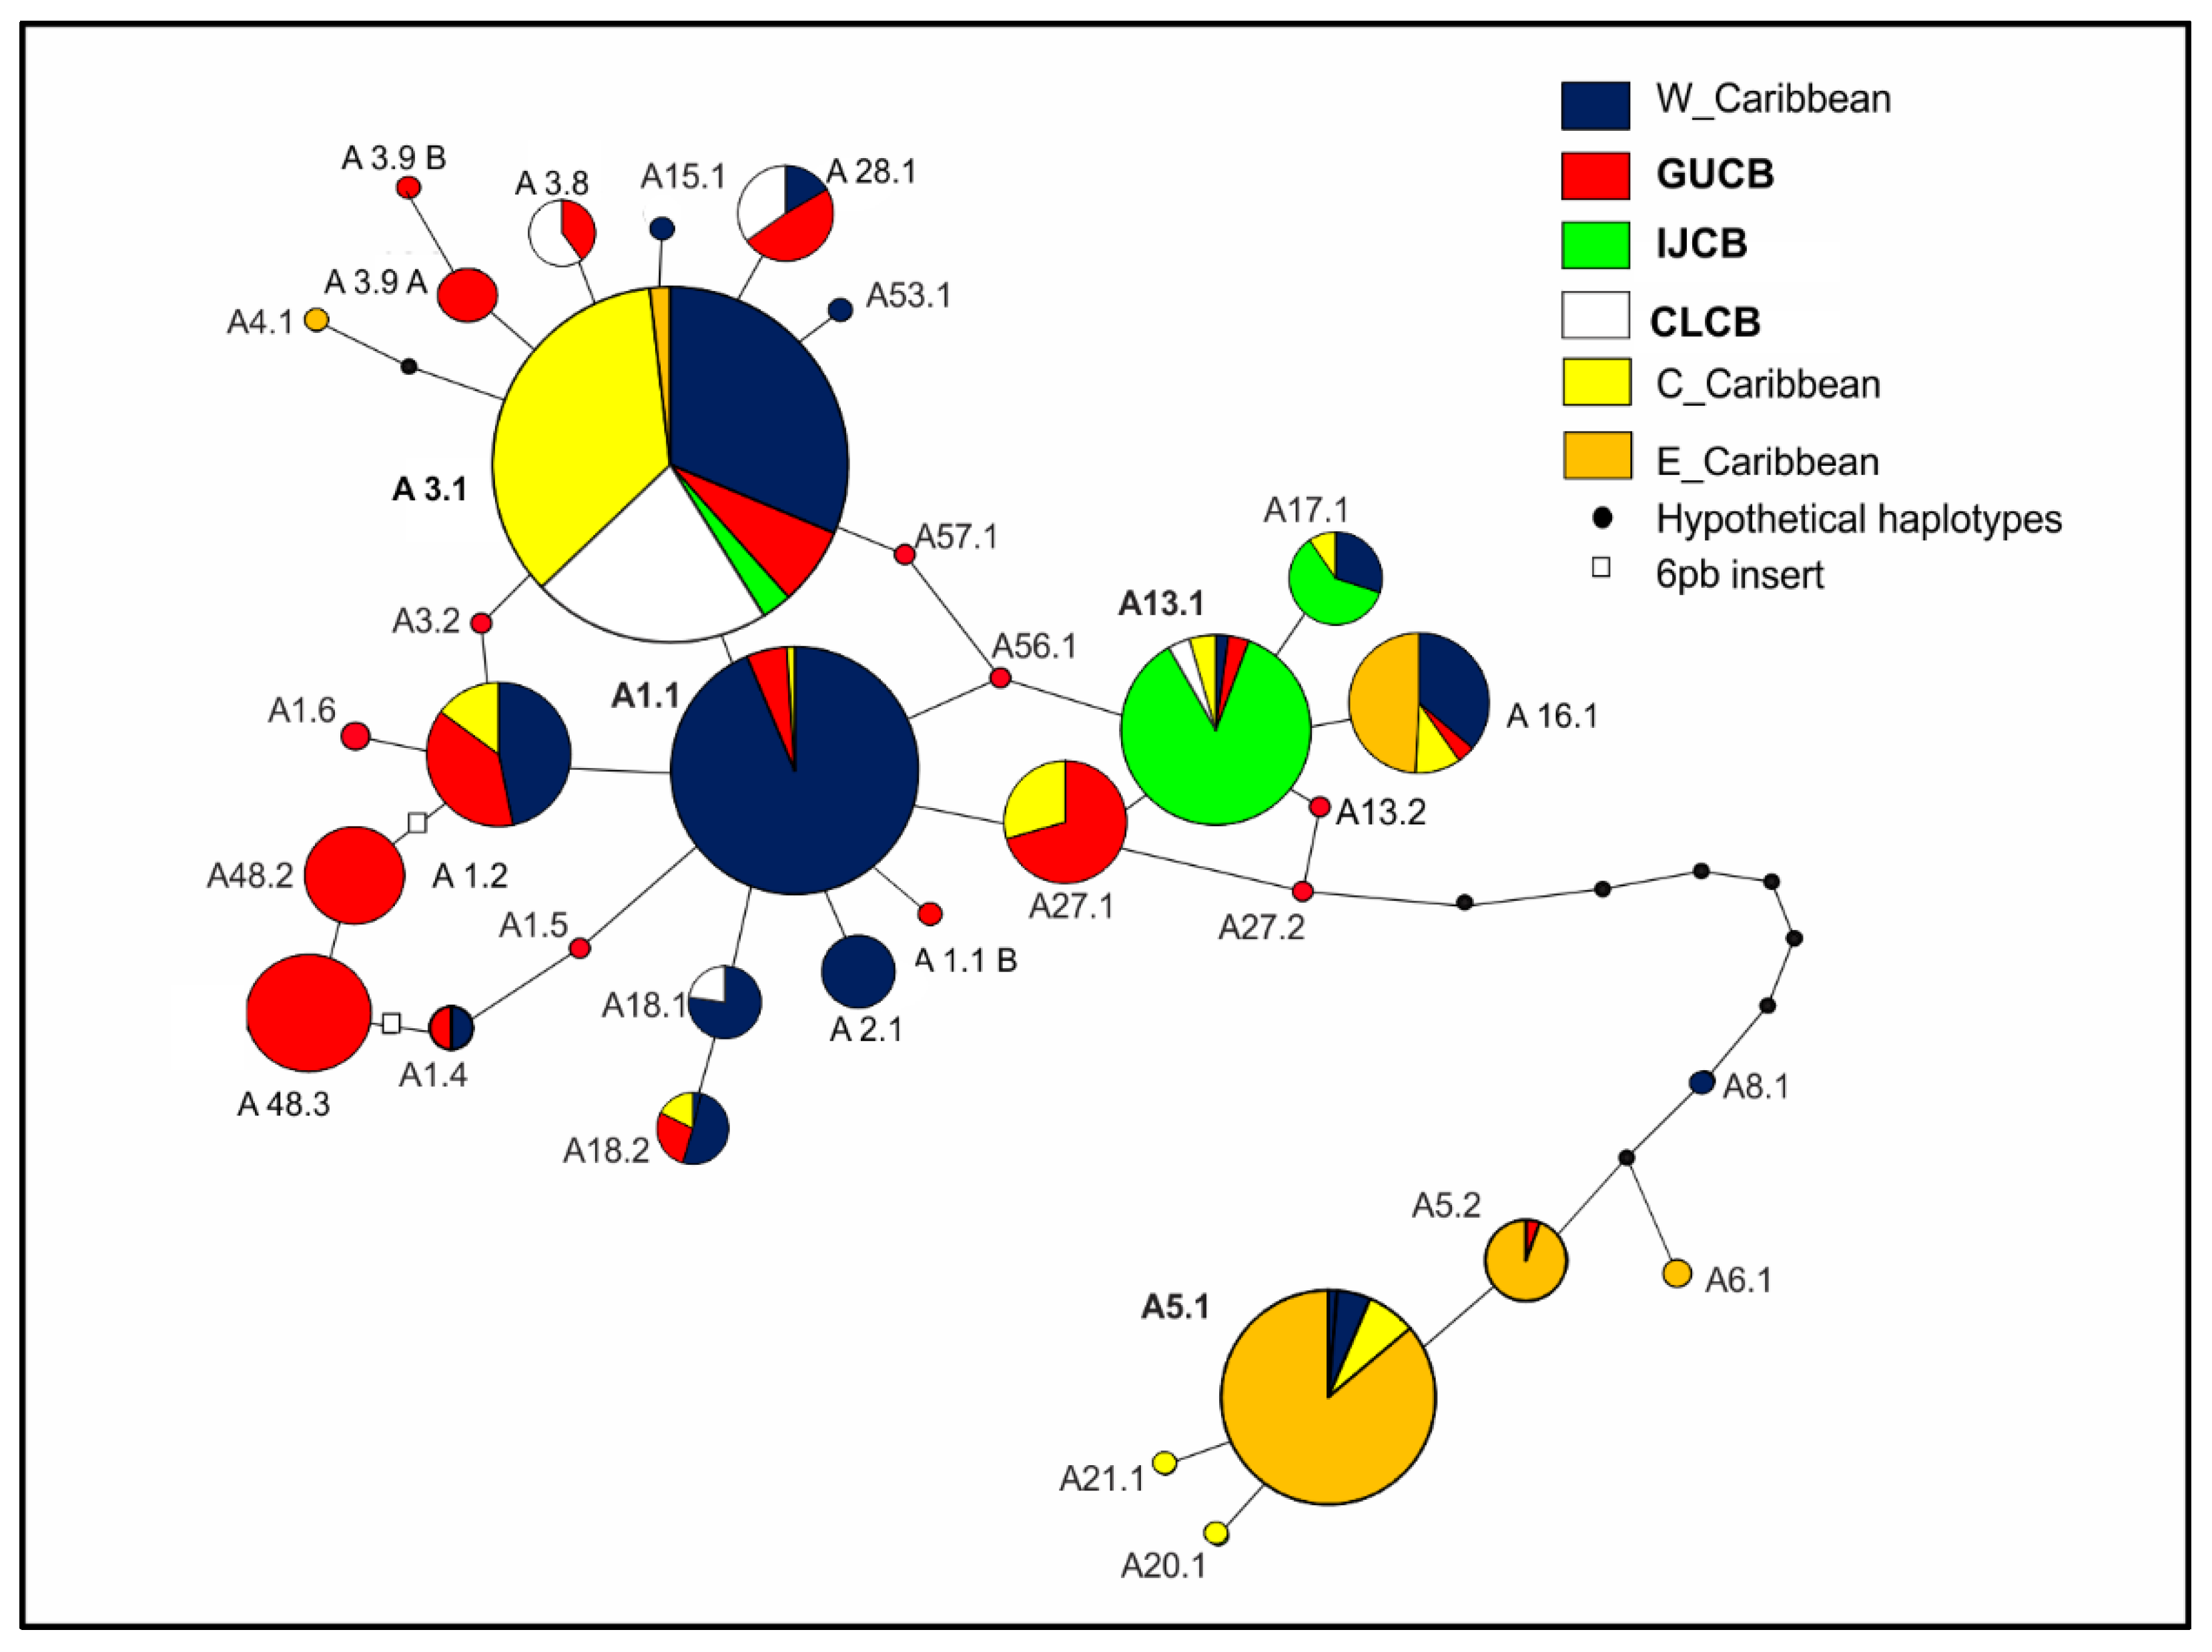
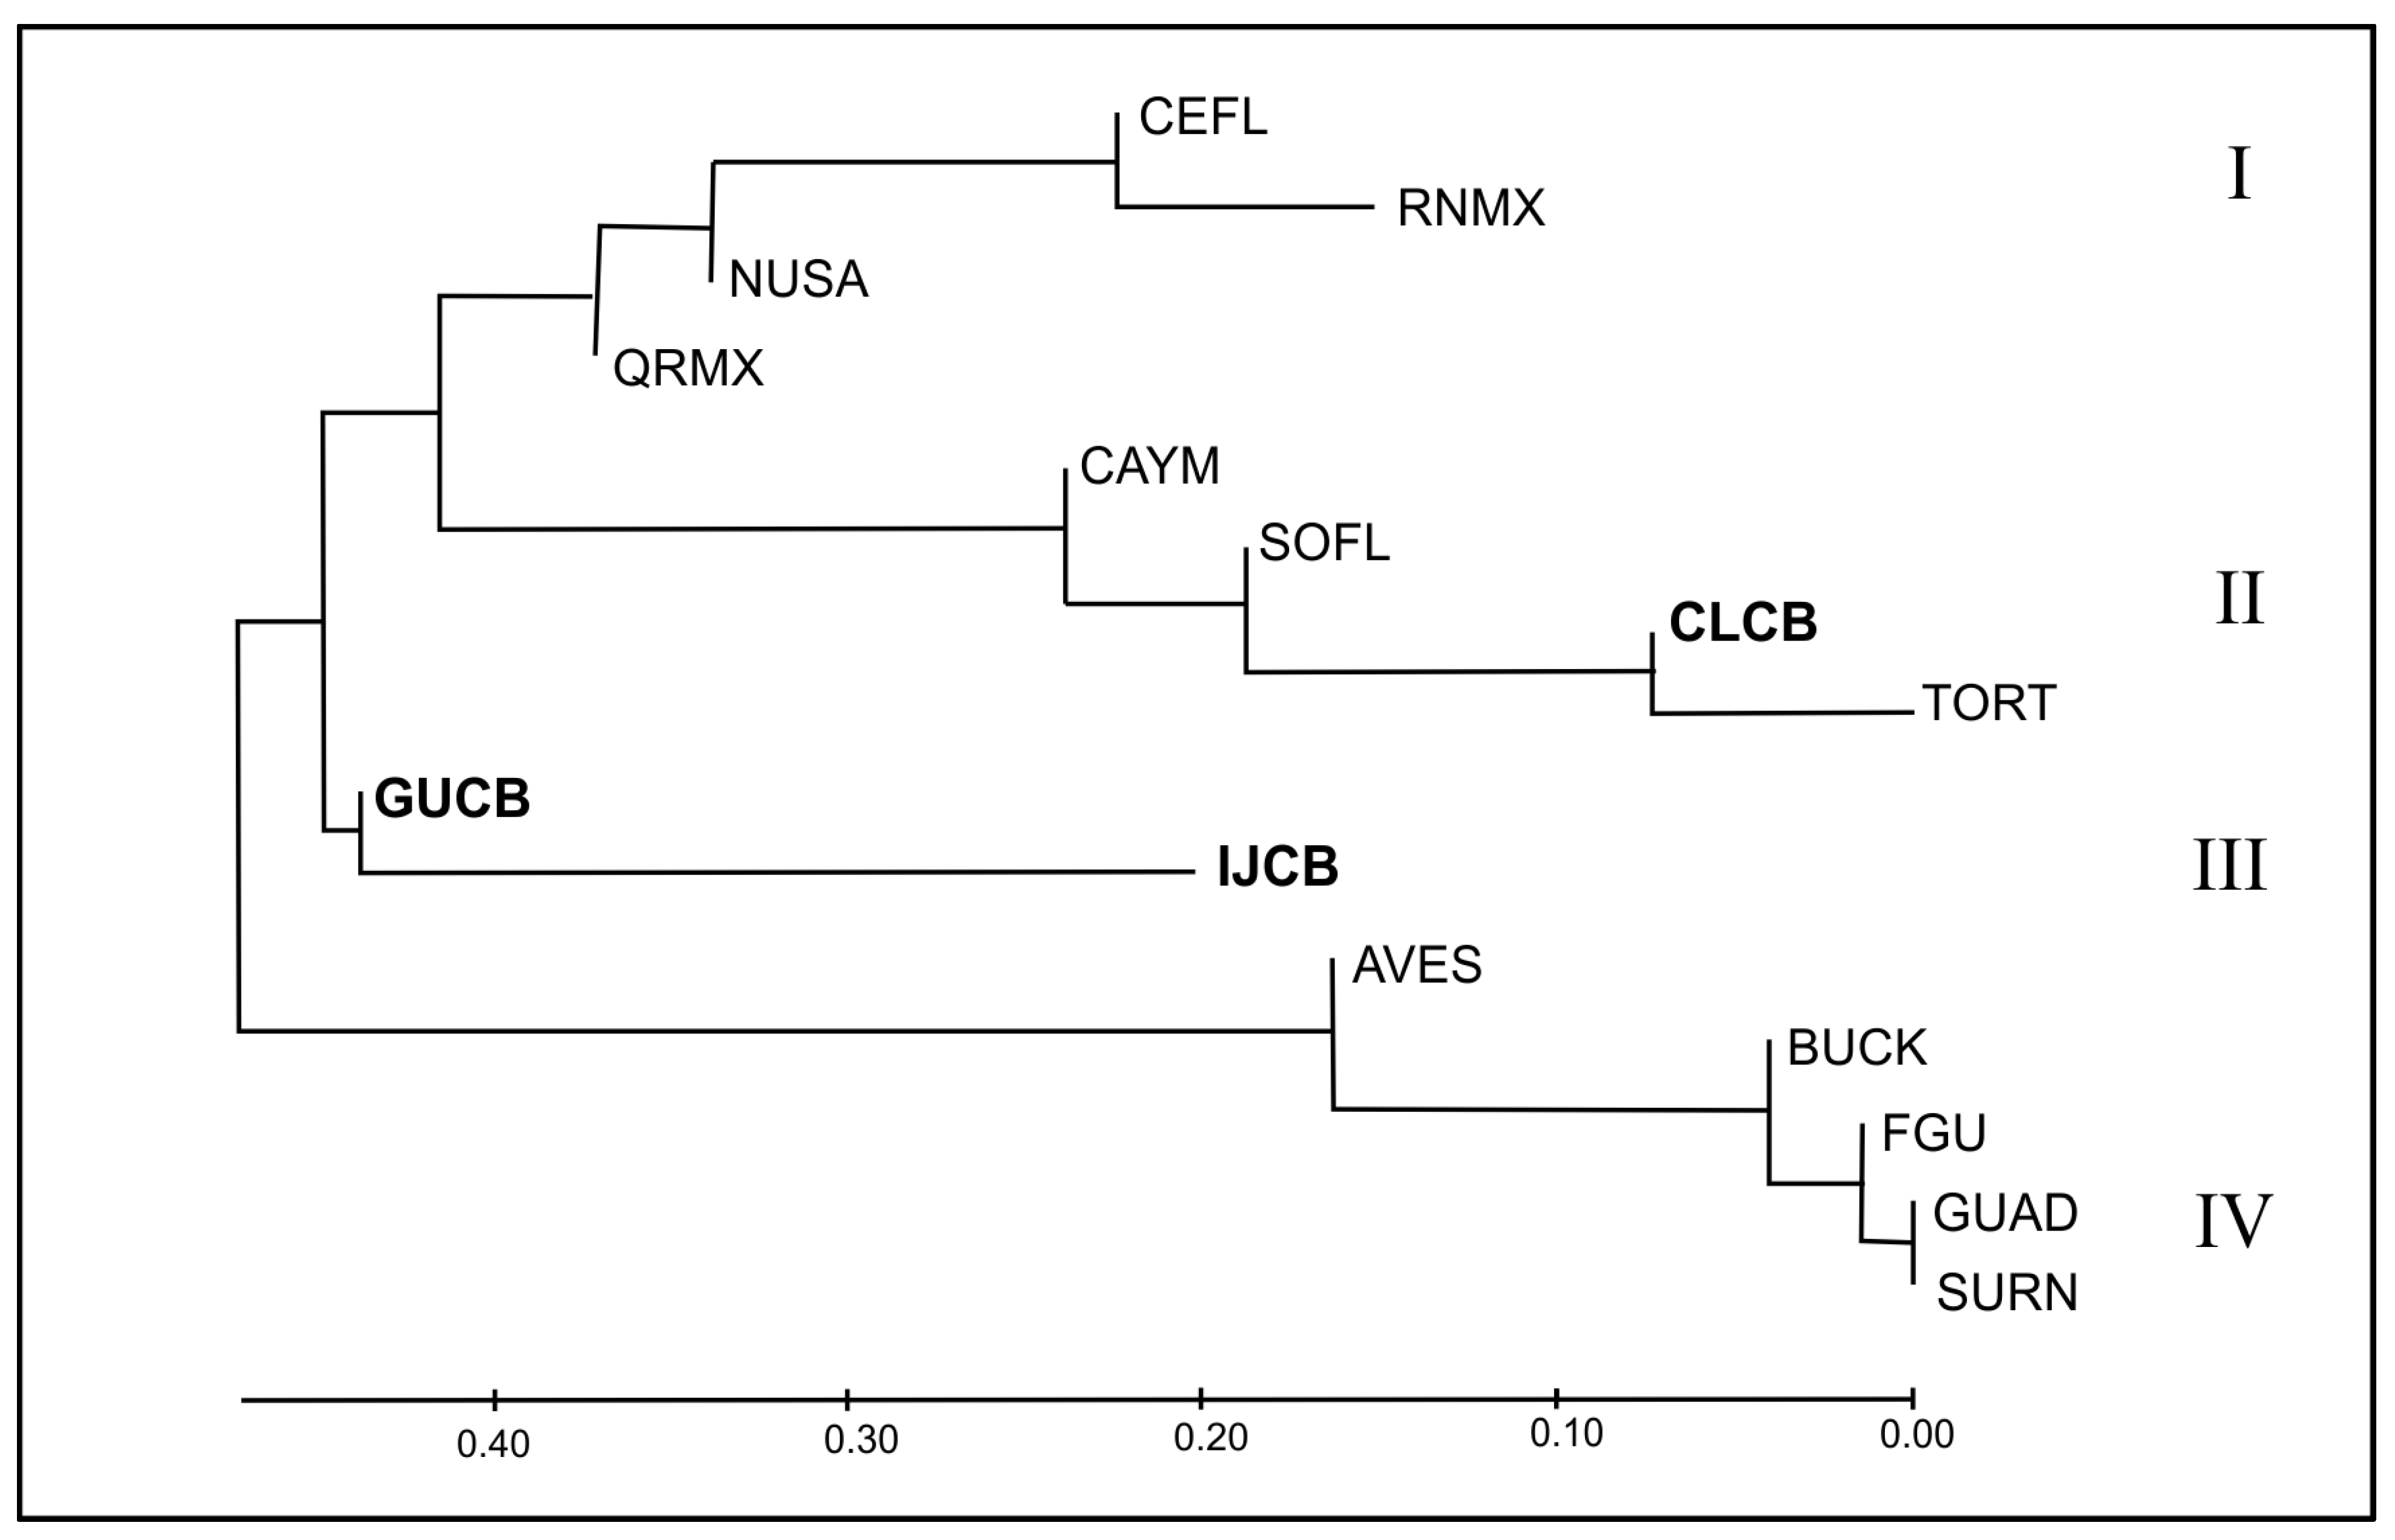
3.4. Evolutionary Relationships

The network for the entire haplotype dataset, including Cuban and regional rookery information (Figure 4; except for CM-A5 variants), illustrates very close evolutionary relationships between all regional haplotypes involving mostly single-step substitutions. Notably, the Cuban endemic haplotypes (red), found exclusively in GUCB, are widely dispersed in the network instead of clustering around a single haplotype. Haplotypes characteristic for IJCB, although also found in many regional MUs, occur at relatively high frequencies. In contrast, most haplotypes found in CLCB cluster around CM-A3.1, the major Central Caribbean haplotype.
The Fst-based dendrogram (Figure 5) highlights four distinctive mtDNA clades in the Wider Caribbean. Two Cuban MUs (GUCB and IJCB) are highly divergent and reside in a separate clade (III). This is expected for CUGB, characterized by high frequencies of endemic haplotypes, and for IJCB because of the CM-A13.1 predominance, which, although present in other regional rookeries, tends to be relatively rare elsewhere (Table S2). On the other hand, CLCB was closely related to TORT, SOFL, and CAYM within a common clade. These phylogenetic clades closely reflect the distribution and proportions of the major haplotypes in the region: in clade II (SOFL, CAYM, CLCB, and TORT), CM-A3.1 predominates; in clade IV (BUCK, GUAD, AVES, SURN, and FGU), CM-A5.1 is the dominant haplotype; while in clade I (NUSA, CEFL, RNMX, and QRMX), rookeries have CM-A1.1 as the major haplotype.
Corroborating the general pattern in the tree, the best AMOVA grouping for the regional MUs (Table S3) indicates four differentiated clusters: (I): all Mexican and United States rookeries except SOFL (Western Caribbean); (II): SOFL, CLCB, CAYM, and TORT (Central Caribbean); (III) GBCB and IJCB separated; (IV): BUCK, AVES, GUAD, SURN, and FGIA (Eastern Caribbean) (Fct = 0.711, p < 0.01; Fsc = 0.06; p < 0.01).

4. Discussion

4.1. Genetic Diversity in Cuban Rookeries

A more accurate genetic characterization of Cuban rookeries was possible by expanding the geographic scope, sample sizes, and extending the length of the DNA sequences analyzed compared to previous studies [20]. Using the longer sequences, we found 23 different haplotypes in Cuba, eleven more than when using the shorter readings. This value is the highest for all the breeding assemblages in the Atlantic. Among Cuban rookeries, the Guanahacabibes Peninsula hosts the largest portion of the estimated haplotype diversity, with all the nesting beaches exhibiting values above 0.70, one of the highest in the Atlantic (Table S1) [10,21,29]. Mexico is the only rookery with higher haplotype diversity (h = 0.86), although individual beaches such as Caleta de los Piojos and La Barca have similar or even higher values (0.90 and 0.86, resp.). Interestingly, the nucleotide diversity in Guanahacabibes and San Felipe rookeries, together with Quintana Roo, Mexico, have the highest values (Table S1).
Several haplotypes found had previously been reported in Atlantic rookeries [29], including in Cuba [20]. However, haplotypes families CM-A5, CM-A13, CM-A16, CM-A17, and CM-A18 are reported from Cuban populations for the first time, although they are shared with rookeries in Florida, Mexico (except CM-A13.2) and the Cayman Islands. Haplotypes CM-A16 to CM-A18 were found for the first time in Mexico [29] and, more recently, in Florida [31] and Cayman Island [33]. Haplotype CM-A13.1 is found in all Cuban rookeries but at low frequencies, similarly to Florida and Cayman Islands; the exception is Isla de la Juventud, where it is the most abundant haplotype.
While some of the long variants of CM-A1 are found in other Caribbean rookeries, especially in Florida and even in Guanahacabibes, novel haplotypes CM-A1.5 and CM-A1.6 are exclusive to Cuba, found at single rookeries with low frequencies. In the case of CM-A3, of the four long variants found (Table 2), two are endemic (CM-A3.8 and CM-A3.9), while haplotype A3.2 has been reported in Cayman Island [33]. Finding haplotype A18.1 in Cayo Largo is significant as, until now, it had remained as an orphan haplotype reported only at Texan feeding grounds [18]. The extended sequence versions of haplotype CM-A48 can help distinguish Cuban MUs since both are only present in GUCB. CM-A27.1 has been found only in Cuba and the Cayman Islands [33], while CM-A27.2, CM-A56.1, and CM-A57.1 [20] are exclusive to Guanahacabibes. Recent studies have already reported Cuban haplotypes in northern Caribbean foraging grounds. Such is the case for CM-A27 and CM-A48, found in southern Florida [27] and the Gulf of Mexico [18], though only CM-A27 was reported in the Bahamas [41] and Puerto Rico [42] foraging aggregations. Novel Cuban haplotype identification will enhance future mixed-stock analysis to identify contributions from Cuban rookeries at feeding grounds.

4.2. Evolutionary Perspectives and Management Units

One of the distinctive genetic features of Cuban rookeries highlighted by this study is the very high haplotype and nucleotide diversity values and a large number of endemic haplotypes. These constitute a classic genetic signature of refugial areas [43]. Indeed, based on such characteristics, previous studies [44] have proposed that Cuban and Mexican green turtle habitats acted as glacial refugia. However, older reports were used, which did not include the Guanahacabibes rookeries that contain the highest portion of the genetic variability in Cuba. A combination of high haplotype and nucleotide diversity is also considered a characteristic of either large and stable populations or the result of recent immigration from differentiated lineages [45,46,47]. The former likely applies to Cuba as historical records reflect a vast green turtle population in the central and northern Caribbean, spanning across from the Cayman Islands to Bermuda and evidently including Cuba [48]. By the 18th century, this population was decimated by overharvesting [48], but nothing is known about the extent or fate of individual stocks. Thus, the haplotypes found for Cuba, particularly the large number of endemic haplotypes with evolutionary relationships with multiple clades in the network (Figure 5), are likely surviving remnants from a formerly substantial Cuban rookery or, more likely, from the once vast Central Caribbean green turtle population.
Contrary to what was previously known for Cuba and what was expected because the green turtle nesting region in southwestern Cuba barely spans 300 km, at least three MUs were found. Commonly, differentiation among sea turtle populations is associated with greater distances (>500 km) [44,49,50,51], although a few exceptions exist with separations of <20 km (e.g., [52] for hawksbills, and [21] for green turtles). Furthermore, the three Cuban MUs had highly differentiated haplotype compositions while exhibiting varying proportions of the regionally dominant haplotypes (CM-A1 and CM-A3). As previously observed [32,47,53], the longer sequence facilitates greater discrimination between rookeries.
Of the three Cuban MUs, GUGB has the highest proportion of haplotype and nucleotide diversity and contains all Cuban endemic haplotypes, consistent with what would be expected for a glacial refugia hotspot [43]. It is unclear how this set of rookeries would have retained a unique genetic signature despite representing a relatively small breeding assemblage. Possibly, over time, the rest of the Cuban rookeries experienced cycles of haplotype extinction and colonization that have all but erased most traces of the basal genetic profile of the ancestral regional population. Indeed, GUCB is the most exposed of the three Cuban MUs to regionally significant oceanic currents because of its location, and it is thus subjected to changes over the seasons and cross-currents impacting the inner beaches [54]. The west-to-east haplotype clines found in GUCB may result from these differences in beach accessibility and reflect recent immigration from regional sources, intermixing with surviving ancestral haplotypes. An influence by oceanic currents on immigration by adults would generally be unlikely, as nesting sea turtle females are predominantly philopatric and retain fidelity to their breeding sites. However, over evolutionary time scales, even a small proportion of females will mistakenly lay their eggs on beaches other than at their natal origins [55]. Particular sites where these philopatric mistakes occur may be those most impacted by major currents shaping the oceanic dispersal of juveniles [56,57] or in the vicinity of suitable foraging grounds for juveniles and adults [58]. Poor natal homing may then lead to the colonization of emerging nesting habitats [59]. The location of the Guanahacabibes Peninsula, adjacent to some of the fastest Caribbean currents, would facilitate this colonization through philopatric errors [60,61,62]. Scenarios incorporating both the survival of ancestral haplotypes and the immigration from regional rookeries would additionally explain the widely dispersed positions of the GUCB haplotypes in the network. Furthermore, the complex oceanic currents surrounding the Guanahacabibes Peninsula (Figure 1B) could play a central role in the immigration process [63,64,65], reflected in the east-to-west increase in the number of haplotypes, the haplotype and nucleotide diversity (Table S1), and the concomitant decrease in the regionally dominant CM-A3 (Table 2 and Figure 2).
To what extent the pattern and influence of regional oceanic currents have shaped the distribution of genetic diversity over evolutionary time is impossible to ascertain. Numerical simulations of dispersal by oceanic currents of leatherback juveniles [56] not only demonstrated that major regional currents in the Western Atlantic have contrasting influences on the displacement of the regional stocks but, interestingly, that the pattern of the Caribbean Current closest to the western Cuban rookeries (the Yucatan and the Loop Currents) has changed over the last twenty years. This could imply that the selection and proportion of regional stocks that can sporadically enter into Cuban green turtle breeding habitats may differ over short and long time frames.
The particular shape of the Guanahacabibes peninsula also offers different levels of accessibility to nesting beaches from the dominant ocean currents, potentially leading to the relative isolation and retention of novel haplotypes inside the Peninsula. This would also explain why endemic haplotypes are more frequent in the inner Guanahacabibes rookeries, particularly in the central zone (La Barca), rather than those closest to the Yucatan Current (Figure 1B). Contrary to that, immigration events would appear more frequently on the outer beach Los Piojos (Table 2), the only site with several regional haplotypes such as CM-A1.4, CM-A16.1, and CM-A5.2.
The east-to-west cline for CMA3.1 haplotypes found over the entire set of rookeries and individual MUs suggests immigration from more abundant Caribbean rookeries upstream, where this is the dominant haplotype. The source would most likely be Tortuguero, located up-current from Cuba and, by far, the most abundant rookery in the region, where this is the dominant haplotype [31,66]. A colonization route to the MU with the most significant proportion of CMA3.1 in Cuba, CLCB, could be explained by the regional Caribbean current slowing down and veering northward as it nears the Cayman Islands and from there towards Cayo Largo [67]. The east-to-west direction of local current systems (Figure 1B) could further aid the dispersal of CMA3 migrants to San Felipe and Guanahacabibes, explaining the haplotype frequency cline found in that area [67]. However, other alternative sources cannot be ruled out. Finding a green turtle nesting in Cayo Largo, Cuba, and Juno Beach, Florida [68], implies that other regional rookeries may act as sources, not necessarily the most abundant, nor from those located upstream. On the other hand, the west-to-east reduction in CMA1.1 frequencies suggests a historical connection with Mexican or Florida rookeries, where it is the dominant haplotype [18]. Current systems mediating this link include a gyre that veers off the Gulf Stream and hits the westernmost part of Guanahacabibes.
Finally, IJCB management unit exhibits the most contrasting haplotype profile, whose dominant haplotypes (CMA13.1 and CMA17.1; Figure 4) are only present at low frequencies in other regional rookeries. Verifying haplotype CMA13.1 in a Cuban nesting habitat is significant. It substantiates the hypothesis suggested earlier [21] that the green turtle colonization of the Mediterranean originated in the Caribbean, but as the haplotype had only been identified in juveniles on foraging grounds, its natal source remained unknown. With these results, the origin can now be explicitly associated with a Cuban rookery. Multiple haplotypes in Cuban rookeries (CMA13.2, CMA16.1, CMA17.1, CM-A27.1, CM-A27.2 A56.1, and CMA57.1) cluster around CMA13.1 (Figure 5) suggests local and prolonged evolutionary history processes, instead of merely a founder event. Ecological boundaries could explain the maintenance of genetic isolation for IJCB rather than allopatric mechanisms [44]. This would be similar to that proposed by Dutton et al. [47] for oceanic islands, such as the Revillagigedos in the Pacific, acting as radiation centers for haplotype evolution.
Interestingly, currents around Isla de la Juventud are not connected to this internal oceanic current system and may help to explain its distinct haplotype composition [67,69]. Regarding genetic differentiation in the Cuban platform, [54] established three general patterns: a north–south break, an east–west split in the south, and local genetic differentiation. The size of the island, current patterns, the lack of suitable habitats for reproduction, larval recruitment, and foraging behaviors are possible causes for this particular structure [70,71,72].
Figure 5. Genetic relationships using frequency-based Fst values between Cuban (highlighted in boldface) and Wider Caribbean green turtle management units were inferred using the Neighbor-Joining method [72] (Table 2). The tree is drawn to scale, with branch lengths in the same units as those of the genetic distance statistic used to infer the phylogenetic tree. Clades I–IV were supported by the AMOVA analysis for regional MUs.
Diversity 15 00586 g005

4.3. Cuban Rookeries in the Caribbean Context

Though genetic relationships between Caribbean green turtle rookeries have been estimated [13,43,44], the geographic coverage in this study allowed us to conduct a robust analysis of the degree of genetic differentiation between Cuban and regional MUs, which was impossible with the previously limited information. For example, after incorporating CAYM and CLCB into phylogenetic analyses, Northwestern and Central Caribbean rookeries separate into two clades, each dominated by one of the two main regional haplotypes (CM-A1 and CM-A3, respectively; Figure 5). In this scenario, CLCB would be grouped in the same clade with CAYM, TORT, and SOFL, separated from RNMX, QRMX, NUSA, and CEFL.
The remaining two MUs, GUCB and IJCB, retain a unique haplotype profile that does not align with any clades. Interestingly, these two MUs retain the haplotypes that are presumed vestiges from an ancestral Caribbean stock (Cuban endemics in GUCB and CM-A13.1 in IJCB), and as they are absent from other rookeries in the region (except the Mediterranean), there is no evidence of these having survived in other present-day stocks.
The typical spatial genetic gradient for major haplotypes is also reflected in the placement of the different clades in the phylogenetic analyses. Western Caribbean rookeries exhibit the highest haplotype frequency for A1.1 and other closely related haplotypes. Central Caribbean plus Cayo Largo has the highest proportion of CMA3.1, the most frequent in this region, while in the Eastern Caribbean, CMA5.1 and 5.2 predominate. Another haplotype grouping is formed by haplotypes present in IJCB (A13.1 and A17.1). GUCB haplotypes, on the other hand, are spread all over the network, connecting A1.1, A3.1, and A13.1 or branching from them.
The uneven geographic pattern and significant differentiation between Cuban MUs within relatively short distances imply that an isolation-by-distance model is not the most likely explanation for differentiation, at least within archipelagos in the central Caribbean. Other significant factors must be driving these processes. For example, current-mediated transport, cycles of extinction and recolonization with concomitant founder events, or local mutation processes can produce high variability between nearby regions (Figure 4).

4.4. Conservation Implications and Future Studies

Our identification of Cuban MUs builds on recent studies with longer mtDNA sequences, demonstrating their capacity to uncover novel genetic structure and clarify sources’ origins in foraging grounds [18,72,73]. With the clear, contrasting haplotype compositions with which Cuban MUs are identified, except for CLCB, these should be readily distinguishable in mixed-stock analyses. Nevertheless, because of the relatively low sample size for the San Felipe rookery in the present study, additional genetic surveys will still be necessary to verify the connectivity with the Guanahacabibes rookeries inferred here. Still, widespread, shared haplotypes will continue to present a challenge when distinguishing contributions by CLCB, and studies with alternative molecular markers with even greater resolution will still be needed. Studies of foraging areas in the Western Atlantic that combine genetic analyses and satellite tagging are sorely needed to discover where Cuban turtles are feeding and to what extent the Cuban stocks contribute.
Future actions based on biological and threat analyses will also benefit from the knowledge of the multiple MUs in the Cuban Archipelago, which will facilitate the focusing of management actions specific to the requirements of each. Cuban rookeries’ genetic diversity and singularity should require special attention in regional conservation planning, especially if these habitats harbor basal genetic diversity that may have been extirpated from historical rookeries such as the Caymans. Protecting this diversity will guarantee the preservation of genetic plasticity necessary for adaptation to future threats and bottlenecks by these endangered species. Finally, our results are necessary input to regional management programs that require robust evaluations of rookery contributions to mixed-stock assemblages in regionally significant developmental, foraging, and migratory habitats.

Supplementary Materials

The following supporting information can be downloaded at: https://www.mdpi.com/article/10.3390/d15050586/s1; Table S1. Genetic and nesting information for Greater Caribbean green turtle rookeries used in this study [74,75,76]; Table S2. AMOVA results for alternative Cuban green turtle Management Unit composition; Table S3. AMOVA results for alternative Regional Management Units among Caribbean rookeries. Figure S1. Representation of rookeries differentiation according to the Barrier analysis.

Author Contributions

Conceptualization, J.A.-R., F.A.A.-G., and G.E.-L.; methodology, K.O., F.A.A.-G., and O.C.-N.; software, F.A.A.-G. and O.C.-N.; validation, K.O., F.A.A.-G., and G.E.-L.; formal analysis, J.A.-R., F.A.A.-G., and O.C.-N.; investigation, J.A.-R., F.A.A.-G., and O.C.-N.; resources, K.O., F.A.A.-G., and J.A.-R.; data curation, J.A.-R., F.A.A.-G., and O.C.-N.; writing—original draft preparation, J.A.-R.; writing—review and editing, F.A.A.-G., O.C.-N., K.O., G.E.-L., and G.G.-S.; visualization, J.A.-R., F.A.A.-G., and G.E.-L.; supervision, K.O., G.E.-L., and G.G.-S.; project administration, K.O. and J.A.-R.; funding acquisition, K.O., F.A.A.-G., and J.A.-R. All authors have read and agreed to the published version of the manuscript.

Funding

Field research was funded by the World Wildlife Fund Program in Cuba and the Ocean Foundation. The Academy of Science for the Developing World and the Wider Caribbean Sea Turtle Conservation Network provided funds for the research visit to Unidad Académica Mazatlán, Instituto de Ciencias del Mar y Limnología and the Centro de Investigaciones en Ecosistemas (CIE), both part of Universidad Nacional Autónoma de México (UNAM). Secretaría de Desarrollo Institucional, UNAM covered the publication costs.

Institutional Review Board Statement

The protocol for this study was reviewed and approved by the Faculty of Biology, Havana University, Cuba. Scientific collection permits were issued by the Oficina Nacional de Regulación Ambiental y Seguridad Nuclear 1998/17, 2002/35, and 2007/53, together with annual permits to enter Natural Protected Areas. Import and export of samples were covered by CITES permits 000520 Cuba. All tissue sample methods and animal handling were carried out in accordance with relevant institutional, national, and international guidelines and regulations.

Data Availability Statement

The data used for this study are available in this article and its supplementary material. The DNA sequences generated have been incorporated into GenBank under accession numbers MW438351–MW595608.

Acknowledgments

We thank the protected areas administration and the forest rangers protecting and monitoring the sea turtle nesting areas for their logistic support, the Ministry of Science, Technology, and Environment for authorization to enter natural protected areas and for support for field monitoring, and all workers and volunteers for their effort to protect sea turtles in Cuba. We also thank UNAM for access and collaborators at genetics laboratories in Unidad Académica Mazatlán, Instituto de Ciencias del Mar y Limnología, Mazatlán, and Centro de Investigaciones en Ecosistemas, Morelia.

Conflicts of Interest

The authors declare no conflict of interest. The funders had no role in the study’s design; in the collection, analyses, or interpretation of data; in the writing of the manuscript; or in the decision to publish the results.

References

  1. Kohn, M.H.; Murphy, W.J.; Ostrander, E.A.; Wayne, R.K. Genomics and Conservation Genetics. Trends Ecol. Evol. 2006, 21, 629–637. [Google Scholar] [CrossRef] [PubMed]
  2. Velez-Zuazo, X.; Ramos, W.D.; van Dam, R.P.; Diez, C.E.; Abreu Grobois, F.A.; Mcmillan, W.O. Dispersal, Recruitment and Migratory Behaviour in a Hawksbill Sea Turtle Aggregation. Mol. Ecol. 2008, 17, 839–853. [Google Scholar] [CrossRef] [PubMed]
  3. Bolker, B.M.; Okuyama, T.; Bjorndal, K.A.; Bolten, A.B. Incorporating Multiple Mixed Stocks in Mixed Stock Analysis: ‘Many-to-Many’Analyses. Mol. Ecol. 2007, 16, 685–695. [Google Scholar] [CrossRef]
  4. Bass, A.L.; Epperly, S.P.; Braun-McNeill, J. Green Turtle (Chelonia mydas) Foraging and Nesting Aggregations in the Caribbean and Atlantic: Impact of Currents and Behavior on Dispersal. J. Hered. 2006, 97, 346–354. [Google Scholar] [CrossRef] [PubMed]
  5. Moncada, F.; Abreu-Grobois, F.A.; Muhlia-Melo, A.; Bell, C.; Tröeng, S.; Bjorndal, K.A.; Bolten, A.B.; Meylan, A.B.; Zurita, J.; Espinosa, G. Movement Patterns of Green Turtles (Chelonia mydas) in Cuba and Adjacent Caribbean Waters Inferred from Flipper Tag Recaptures. J. Herpetol. 2006, 40, 22–34. [Google Scholar] [CrossRef]
  6. Jensen, M.P.; FitzSimmons, N.N.; Dutton, P.H. Molecular Genetics of Sea Turtles. In The Biology of Sea Turtles; Wyneken, J., Lohmann, K.J., Musick, J.A., Eds.; CRC Press: Boca Raton, FL, USA, 2013; Volume 3, pp. 135–161. ISBN 978-1-4398-7308-3. [Google Scholar]
  7. Chaloupka, M.; Musick, J.A.; Lutz, P.L. Age, Growth, and Population Dynamics. Biol. Sea Turt. 1997, 2, 233–276. [Google Scholar]
  8. Komoroske, L.M.; Jensen, M.P.; Stewart, K.R.; Shamblin, B.M.; Dutton, P.H. Advances in the Application of Genetics in Marine Turtle Biology and Conservation. Front. Mar. Sci. 2017, 4, 156. [Google Scholar] [CrossRef]
  9. Bowen, B.W.; Meylan, A.B.; Ross, J.P.; Limpus, C.J.; Balazs, G.H.; Avise, J.C. Global Population Structure and Natural History of the Green Turtle (Chelonia mydas) in Terms of Matriarchal Phylogeny. Evolution 1992, 46, 865–881. [Google Scholar]
  10. Formia, A.; Broderick, A.C.; Glen, F.; Godley, B.J.; Hays, G.C.; Bruford, M.W. Genetic Composition of the Ascension Island Green Turtle Rookery Based on Mitochondrial DNA: Implications for Sampling and Diversity. Endanger. Species Res. 2007, 3, 145–158. [Google Scholar] [CrossRef]
  11. Reece, J.S.; Castoe, T.A.; Parkinson, C.L. Historical Perspectives on Population Genetics and Conservation of Three Marine Turtle Species. Conserv. Genet. 2005, 6, 235–251. [Google Scholar] [CrossRef]
  12. Bjorndal, K.A.; Bolten, A.B.; Moreira, L.; Bellini, C.; Marcovaldi, M.Â. Population Structure and Diversity of Brazilian Green Turtle Rookeries Based on Mitochondrial DNA Sequences. Chelonian Conserv. Biol. 2006, 5, 262–268. [Google Scholar] [CrossRef]
  13. Seminoff, J.A.; Allen, C.D.; Balazs, G.H.; Dutton, P.H.; Eguchi, T.; Haas, H.; Hargrove, S.A.; Jensen, M.; Klemm, D.L.; Lauritsen, A.M.; et al. Status Review of the Green Turtle (Chelonia mydas) under the Endangered Species Act; SWFSC (Southwest Fisheries Science Center): La Jolla, CA, USA, 2015. [Google Scholar]
  14. Dow, W.; Eckert, K.; Palmer, M.; Kramer, P. An Atlas of Sea Turtle Nesting Habitat for the Wider Caribbean Region; Wider Caribbean Sea Turtle Conservation Network (WIDECAST): Beaufort, NC, USA, 2007. [Google Scholar]
  15. Moncada Gavilán, F.; Azanza-Ricardo, J.; Forneiro, Y.; Gerhartz, J.L.; Nodarse, G.; Cruz, Y. Programa de Monitoreo de Tortugas Marinas. In Estado Actual de la Biodiversidad Marino-Costera, en la Región de los Archipiélagos del Sur de Cuba; Hernández Ávila, A., Ed.; Impresos Dominicanos s.r.l: La Habana, Cuba, 2014; pp. 130–141. [Google Scholar]
  16. Nodarse Andreu, G.; Moncada Gavilán, F.; Medina Cruz, Y.; Rodríguez Castillo, C.; Hernández Orozco, F.; Blanco López, R.; Escobar González, E. Comportamiento de La Anidación de Tortugas Marinas en los Cayos San Felipe y Archipiélago de los Canarreos, Cuba (2001–2006). Rev. Cuba. Investig. Pesq. 2010, 27, 66–71. [Google Scholar]
  17. Moncada, F.; Abreu-Grobois, F.A.; Bagley, D.; Bjorndal, K.A.; Bolten, A.B.; Camiñas, J.A.; Ehrhart, L.; Muhlia-Melo, A.; Nodarse, G.; Schroeder, B.A. Movement Patterns of Loggerhead Turtles Caretta Caretta in Cuban Waters Inferred from Flipper Tag Recaptures. Endanger. Species Res. 2010, 11, 61–68. [Google Scholar] [CrossRef]
  18. Shamblin, B.M.; Dutton, P.H.; Shaver, D.J.; Bagley, D.A.; Putman, N.F.; Mansfield, K.L.; Ehrhart, L.M.; Peña, L.J.; Nairn, C.J. Mexican Origins for the Texas Green Turtle Foraging Aggregation: A Cautionary Tale of Incomplete Baselines and Poor Marker Resolution. J. Exp. Mar. Biol. Ecol. 2017, 488, 111–120. [Google Scholar] [CrossRef]
  19. Ruiz, U.A.; Vega, P.M.; Riveron, G.F.B.; Abreu, G.A.F.; Solano, A.G.; Pérez, M.T.; Pérez, B.E.; Azanza, R.J.; Frías, S.R.; Díaz, F.R.; et al. Estructura Genética de Poblaciones de Caretta Caretta En El Gran Caribe y La Costa Atlántica de Estados Unidos, con Enfasis en Colonias de Anidacion del Suroeste Cubano. Rev. Investig. Mar. 2008, 29, 151–160. [Google Scholar]
  20. Ruiz-Urquiola, A.; Riverón-Giró, F.B.; Pérez-Bermúdez, E.; Abreu-Grobois, F.A.; González-Pumariega, M.; James-Petric, B.L.; Díaz-Fernández, R.; Álvarez-Castro, J.M.; Jager, M.; Azanza-Ricardo, J.; et al. Population Genetic Structure of Greater Caribbean Green Turtles (Chelonia mydas) Based on Mitochondrial DNA Sequences, with an Emphasis on Rookeries from Southwestern Cuba. Rev. Investig. Mar. 2010, 31, 33–52. [Google Scholar]
  21. Shamblin, B.M.; Bagley, D.A.; Ehrhart, L.M.; Desjardin, N.A.; Martin, R.E.; Hart, K.M.; Naro-Maciel, E.; Rusenko, K.; Stiner, J.C.; Sobel, D.; et al. Genetic Structure of Florida Green Turtle Rookeries as Indicated by Mitochondrial DNA Control Region Sequences. Conserv. Genet. 2015, 16, 673–685. [Google Scholar] [CrossRef]
  22. Abreu-Grobois, F.A.; Horrocks, J.A.; Formia, A.; Dutton, P.H.; LeRoux, R.; Vélez-Zuazo, X.; Soares, L.; Meylan, P. New MtDNA D-Loop Primers Which Work for a Variety of Marine Turtle Species May Increase the Resolution of Mixed Stock Analysis. In Proceedings of the 26th Annual Symposium on Sea Turtle Biology, ISTS, Athens, Greece, 3–8 April 2006; Frick, M., Panagopoulou, A., Rees, A.F., Williams, K., Eds.; International Sea Turtle Society: Island of Crete, Greece, 2006; p. 200. [Google Scholar]
  23. Azanza Ricardo, J.; Moncada Gavilán, F.; Martin-Viaña, Y.F.; Gerhartz Muro, J.L. Chapter 3: Cuba. In North Atlantic and Wider Caribbean: MTSG Regional Report; Nalovic, M., Cuevas, E., Godfrey, M., Eds.; IUCN-SSC Marine Turtle Specialist Group: Ross, CA, USA, 2019; pp. 48–67. [Google Scholar]
  24. Hillis, D.M.; Moritz, C.; Mable, B.K. Molecular Systematics; Sinauer: Sunderland, MA, USA, 1996; Volume 2. [Google Scholar]
  25. Hall, T. BioEdit, Version 5.0.6; North Carolina State University, Department of Microbiology: Raleigh, NC, USA, 2001.
  26. Kumazawa, Y.; Nishida, M. Complete Mitochondrial DNA Sequences of the Green Turtle and Blue-Tailed Mole Skink: Statistical Evidence for Archosaurian Affinity of Turtles. Mol. Biol. Evol. 1999, 16, 784–792. [Google Scholar] [CrossRef]
  27. Lahanas, P.N.; Miyamoto, M.M.; Bjorndal, K.A.; Bolten, A.B. Molecular Evolution and Population Genetics of Greater Caribbean Green Turtles (Chelonia mydas) as Inferred from Mitochondrial DNA Control Region Sequences. Genetica 1994, 94, 57–66. [Google Scholar] [CrossRef]
  28. Shamblin, B.M.; Dutton, P.H.; Bjorndal, K.A.; Bolten, A.B.; Naro-Maciel, E.; Santos, A.J.B.; Bellini, C.; Baptistotte, C.; Marcovaldi, M.Â.; Nairn, C.J. Deeper Mitochondrial Sequencing Reveals Cryptic Diversity and Structure in Brazilian Green Turtle Rookeries. Chelonian Conserv. Biol. 2015, 14, 167–172. [Google Scholar] [CrossRef]
  29. Shamblin, B.M.; Godfrey, M.H.; Pate, S.M.; Thompson, W.P.; Sutton, H.; Altman, J.; Fair, K.; McClary, J.; Wilson, A.M.; Milligan, B.; et al. Green Turtles Nesting at Their Northern Range Limit in the United States Represent a Distinct Subpopulation. Chelonian Conserv. Biol. 2018, 17, 314–319. [Google Scholar] [CrossRef]
  30. Encalada, S.E.; Lahanas, P.N.; Bjorndal, K.A.; Bolten, A.B.; Miyamoto, M.M.; Bowen, B.W. Phylogeography and Population Structure of the Atlantic and Mediterranean Green Turtle Chelonia mydas: A Mitochondrial DNA Control Region Sequence Assessment. Mol. Ecol. 1996, 5, 473–483. [Google Scholar] [CrossRef] [PubMed]
  31. Bjorndal, K.A.; Bolten, A.B.; Troeng, S. Population Structure and Genetic Diversity in Green Turtles Nesting at Tortuguero, Costa Rica, Based on Mitochondrial DNA Control Region Sequences. Mar. Biol. 2005, 147, 1449–1457. [Google Scholar] [CrossRef]
  32. Shamblin, B.M.; Bjorndal, K.A.; Bolten, A.B.; Hillis-Starr, Z.M.; Lundgren, I.A.N.; Naro-Maciel, E.; Nairn, C.J. Mitogenomic Sequences Better Resolve Stock Structure of Southern Greater Caribbean Green Turtle Rookeries. Mol. Ecol. 2012, 21, 2330–2340. [Google Scholar] [CrossRef]
  33. Costa Jordao, J.; Bondioli, A.C.V.; de Almeida-Toledo, L.F.; Bilo, K.; Berzins, R.; Le Maho, Y.; Chevallier, D.; De Thoisy, B. Mixed-Stock Analysis in Green Turtles Chelonia mydas: MtDNA Decipher Current Connections among West Atlantic Populations. Mitochondrial DNA Part A 2017, 28, 197–207. [Google Scholar] [CrossRef]
  34. Librado, P.; Rozas, J. DnaSP v5: A Software for Comprehensive Analysis of DNA Polymorphism Data. Bioinformatics 2009, 25, 1451–1452. [Google Scholar] [CrossRef] [PubMed]
  35. Excoffier, L.; Lischer, H.E.L. Arlequin Suite Ver 3.5: A New Series of Programs to Perform Population Genetics Analyses under Linux and Windows. Mol. Ecol. Resour. 2010, 10, 564–567. [Google Scholar] [CrossRef] [PubMed]
  36. Manni, F.; Guérard, E.; Heyer, E. Geographic Patterns of (Genetic, Morphologic, Linguistic) Variation: How Barriers Can Be Detected by Using Monmonier’s Algorithm. Hum. Biol. 2004, 76, 173–190. [Google Scholar] [CrossRef]
  37. Kumar, S.; Stecher, G.; Li, M.; Knyaz, C.; Tamura, K. MEGA X: Molecular Evolutionary Genetics Analysis across Computing Platforms. Mol. Biol. Evol. 2018, 35, 1547–1549. [Google Scholar] [CrossRef]
  38. Clement, M.; Posada, D.; Crandall, K.A. TCS: A Computer Program to Estimate Gene Genealogies. Mol. Ecol. 2000, 9, 1657–1659. [Google Scholar] [CrossRef]
  39. Múrias dos Santos, A.; Cabezas, M.P.; Tavares, A.I.; Xavier, R.; Branco, M. TcsBU: A Tool to Extend TCS Network Layout and Visualization. Bioinformatics 2016, 32, 627–628. [Google Scholar] [CrossRef] [PubMed]
  40. Benjamini, Y.; Yekutieli, D. False Discovery Rate–Adjusted Multiple Confidence Intervals for Selected Parameters. J. Am. Stat. Assoc. 2005, 100, 71–81. [Google Scholar] [CrossRef]
  41. Naro-Maciel, E.; Hart, K.M.; Cruciata, R.; Putman, N.F. DNA and Dispersal Models Highlight Constrained Connectivity in a Migratory Marine Megavertebrate. Ecography 2017, 40, 586–597. [Google Scholar] [CrossRef]
  42. Anderson, J.D.; Shaver, D.J.; Karel, W.J. Genetic Diversity and Natal Origins of Green Turtles (Chelonia mydas) in the Western Gulf of Mexico. J. Herpetol. 2013, 47, 251–257. [Google Scholar] [CrossRef]
  43. Maggs, C.A.; Castilho, R.; Foltz, D.; Henzler, C.; Jolly, M.T.; Kelly, J.; Olsen, J.; Perez, K.E.; Stam, W.; Väinölä, R.; et al. Evaluating Signatures of Glacial Refugia for North Atlantic Benthic Marine Taxa. Ecology 2008, 89, S108–S122. [Google Scholar] [CrossRef] [PubMed]
  44. Jensen, M.P.; FitzSimmons, N.N.; Bourjea, J.; Hamabata, T.; Reece, J.; Dutton, P.H. The Evolutionary History and Global Phylogeography of the Green Turtle (Chelonia mydas). J. Biogeogr. 2019, 46, 860–870. [Google Scholar] [CrossRef]
  45. van der Zee, J.P.; Christianen, M.J.; Nava, M.; Velez-Zuazo, X.; Hao, W.; Bérubé, M.; van Lavieren, H.; Hiwat, M.; Berzins, R.; Chevalier, J.; et al. Population Recovery Changes Population Composition at a Major Southern Caribbean Juvenile Developmental Habitat for the Green Turtle, Chelonia mydas. Sci. Rep. 2019, 9, 14392. [Google Scholar] [CrossRef] [PubMed]
  46. Bowen, B.W.; Rocha, L.A.; Toonen, R.J.; Karl, S.A. The Origins of Tropical Marine Biodiversity. Trends Ecol. Evol. 2013, 28, 359–366. [Google Scholar] [CrossRef]
  47. Dutton, P.H.; Jensen, M.P.; Frey, A.; LaCasella, E.; Balazs, G.H.; Zárate, P.; Chassin-Noria, O.; Sarti-Martinez, A.L.; Velez, E. Population Structure and Phylogeography Reveal Pathways of Colonization by a Migratory Marine Reptile (C Helonia Mydas) in the Central and Eastern Pacific. Ecol. Evol. 2014, 4, 4317–4331. [Google Scholar] [CrossRef]
  48. Jackson, J.B. Reefs since Columbus. Coral Reefs 1997, 16, S23–S32. [Google Scholar] [CrossRef]
  49. Patrício, A.R.; Vélez-Zuazo, X.; van Dam, R.P.; Diez, C.E. Genetic Composition and Origin of Juvenile Green Turtles Foraging at Culebra, Puerto Rico, as Revealed by MtDNA. Lat. Am. J. Aquat. Res. 2017, 45, 506–520. [Google Scholar] [CrossRef]
  50. Jensen, M.P.; Dalleau, M.; Gaspar, P.; Lalire, M.; Jean, C.; Ciccione, S.; Mortimer, J.A.; Quillard, M.; Taquet, C.; Wamukota, A.; et al. Seascape Genetics and the Spatial Ecology of Juvenile Green Turtles. Genes 2020, 11, 278. [Google Scholar] [CrossRef] [PubMed]
  51. Dethmers, K.E.; Broderick, D.; Moritz, C.; Fitzsimmons, N.N.; Limpus, C.J.; Lavery, S.; Whiting, S.; Guinea, M.; Prince, R.I.; Kennett, R.O.D. The Genetic Structure of Australasian Green Turtles (Chelonia mydas): Exploring the Geographical Scale of Genetic Exchange. Mol. Ecol. 2006, 15, 3931–3946. [Google Scholar] [CrossRef] [PubMed]
  52. Browne, D.C.; Horrocks, J.A.; Abreu-Grobois, F.A. Population Subdivision in Hawksbill Turtles Nesting on Barbados, West Indies, Determined from Mitochondrial DNA Control Region Sequences. Conserv. Genet. 2010, 11, 1541–1546. [Google Scholar] [CrossRef]
  53. Dutton, P.H.; Jensen, M.P.; Frutchey, K.; Frey, A.; LaCasella, E.; Balazs, G.H.; Cruce, J.; Tagarino, A.; Farman, R.; Tatarata, M. Genetic Stock Structure of Green Turtle (Chelonia mydas) Nesting Populations across the Pacific Islands. Pac. Sci. 2014, 68, 451–464. [Google Scholar] [CrossRef]
  54. García-Machado, E.; Ulmo-Díaz, G.; Castellanos-Gell, J.; Casane, D. Patterns of Population Connectivity in Marine Organisms of Cuba. Bull. Mar. Sci. 2018, 94, 193–211. [Google Scholar] [CrossRef]
  55. Stiebens, V.A.; Merino, S.E.; Roder, C.; Chain, F.J.; Lee, P.L.; Eizaguirre, C. Living on the Edge: How Philopatry Maintains Adaptive Potential. Proc. R. Soc. B Biol. Sci. 2013, 280, 20130305. [Google Scholar] [CrossRef]
  56. Gaspar, P.; Candela, T.; Shillinger, G.L. Dispersal of Juvenile Leatherback Turtles from Different Caribbean Nesting Beaches: A Model Study. Front. Mar. Sci. 2022, 9, 959366. [Google Scholar] [CrossRef]
  57. Allard, M.W.; Miyamoto, M.M.; Bjorndal, K.A.; Bolten, A.B.; Bowen, B.W. Support for Natal Homing in Green Turtles from Mitochondrial DNA Sequences. Copeia 1994, 1994, 34–41. [Google Scholar] [CrossRef]
  58. Carreras, C.; Pont, S.; Maffucci, F.; Pascual, M.; Barcelo, A.; Bentivegna, F.; Cardona, L.; Alegre, F.; SanFelix, M.; Fernandez, G.; et al. Genetic Structuring of Immature Loggerhead Sea Turtles (Caretta Caretta) in the Mediterranean Sea Reflects Water Circulation Patterns. Mar. Biol. 2006, 149, 1269–1279. [Google Scholar] [CrossRef]
  59. Bowen, B.W.; Meylan, A.B.; Avise, J.C. An Odyssey of the Green Sea Turtle: Ascension Island Revisited. Proc. Natl. Acad. Sci. USA 1989, 86, 573–576. [Google Scholar] [CrossRef]
  60. Gaspar, P.; Georges, J.-Y.; Fossette, S.; Lenoble, A.; Ferraroli, S.; Le Maho, Y. Marine Animal Behaviour: Neglecting Ocean Currents Can Lead Us up the Wrong Track. Proc. R. Soc. B Biol. Sci. 2006, 273, 2697–2702. [Google Scholar] [CrossRef] [PubMed]
  61. Luschi, P.; Hays, G.C.; Papi, F. A Review of Long-Distance Movements by Marine Turtles, and the Possible Role of Ocean Currents. Oikos 2003, 103, 293–302. [Google Scholar] [CrossRef]
  62. Hays, G.C. Ocean Currents and Marine Life. Curr. Biol. 2017, 27, R470–R473. [Google Scholar] [CrossRef] [PubMed]
  63. Blumenthal, J.M.; Abreu-Grobois, F.A.; Austin, T.J.; Broderick, A.C.; Bruford, M.W.; Coyne, M.S.; Ebanks-Petrie, G.; Formia, A.; Meylan, P.A.; Meylan, A.B.; et al. Turtle Groups or Turtle Soup: Dispersal Patterns of Hawksbill Turtles in the Caribbean. Mol. Ecol. 2009, 18, 4841–4853. [Google Scholar] [CrossRef]
  64. Gaspar, P.; Benson, S.R.; Dutton, P.H.; Réveillère, A.; Jacob, G.; Meetoo, C.; Dehecq, A.; Fossette, S. Oceanic Dispersal of Juvenile Leatherback Turtles: Going beyond Passive Drift Modeling. Mar. Ecol. Prog. Ser. 2012, 457, 265–284. [Google Scholar] [CrossRef]
  65. Putman, N.F.; Scott, R.; Verley, P.; Marsh, R.; Hays, G.C. Natal Site and Offshore Swimming Influence Fitness and Long-Distance Ocean Transport in Young Sea Turtles. Mar. Biol. 2012, 159, 2117–2126. [Google Scholar] [CrossRef]
  66. Shamblin, B.M.; Hart, K.M.; Martin, K.J.; Ceriani, S.A.; Bagley, D.A.; Mansfield, K.L.; Ehrhart, L.M.; Nairn, C.J. Green Turtle Mitochondrial Microsatellites Indicate Finer-Scale Natal Homing to Isolated Islands than to Continental Nesting Sites. Mar. Ecol. Prog. Ser. 2020, 643, 159–171. [Google Scholar] [CrossRef]
  67. Arriaza, L.; Rodas, L.; Simanca, J.; Lorenzo, S.L.; Milian, D.E.; Romero, P. Contribución a la Gestión Ambiental del Golfo de Batabanó, Cuba: Modelación Numérica de Corrientes Marinas. Rev. Investig. Mar. 2011, 29, 89–99. [Google Scholar]
  68. Moncada, F.; Coppenrath, C.M.; Hirsch, S.; Nodarse, G.; Page-Karjian, A.; Reeves, A.M.; Perrault, J.R. Nesting Green Turtle Tagged in Cuba, Recaptured in Florida. Mar. Turt. Newsl. 2019, 156, 1–2. [Google Scholar]
  69. Claro, R.; Reshetnikov, Y.S.; Alcolado, P.M. Physical Attributes of Coastal Cuba. In Ecology of the Marine Fishes of Cuba; Smithsonian Institution Press: Washington, DC, USA, 2001; pp. 1–20. [Google Scholar]
  70. Espinosa, G.; Díaz, R.; Matos, J.; Becquer, U.; Romo, J.; Borrell, Y. Variación Aloenzimática en Poblaciones Cubanas del Camarón Blanco Litopenaeus Schmitti. Rev. Investig. Mar. 2003, 24, 11–19. [Google Scholar]
  71. Barcia, A.R.; Lopez, G.E.; Hernandez, D.; García-Machado, E. Temporal Variation of the Population Structure and Genetic Diversity of Farfantepenaeus Notialis Assessed by Allozyme Loci. Mol. Ecol. 2005, 14, 2933–2942. [Google Scholar] [CrossRef] [PubMed]
  72. Castellanos-Gell, J.; Robainas-Barcia, A.; Pina-Amargós, F.; Chevalier-Monteagudo, P.; Metcalfe, C.; Molina, W.F.; Casane, D.; García-Machado, E. Genetic Diversity of Reef Fishes around Cuba: A Multispecies Assessment. Mar. Biol. 2016, 163, 1–16. [Google Scholar] [CrossRef]
  73. Chaves, J.A.; Peña, M.; Valdés-Uribe, J.A.; Muñoz-Pérez, J.P.; Vallejo, F.; Heidemeyer, M.; Torres-Carvajal, O. Connectivity, Population Structure, and Conservation of Ecuadorian Green Sea Turtles. Endanger. Species Res. 2017, 32, 251–264. [Google Scholar] [CrossRef]
  74. Barbanti, A.; Martin, C.; Blumenthal, J.M.; Boyle, J.; Broderick, A.C.; Collyer, L.; Ebanks, G.; Godley, B.J.; Mustin, W.; Ordonez, V.; et al. How many came home? Evaluating ex-situ conservation of green turtles in the Cayman Islands. Mol. Ecol. 2019, 28, 1637–1651. [Google Scholar] [CrossRef] [PubMed]
  75. Cremades, C.; Lefèvre, S. Chapter 2: Guadeloup. In Sea Turtles in the North-West Atlantic & Caribbean Region MTSG Regional Report; Nalovic, M., Cuevas, E., Godfrey, M., Eds.; IUCN-SSC Marine Turtle Specialist Group: Ross, CA, USA, 2018; pp. 40–49. [Google Scholar]
  76. Berzins, R.; Chevalier, J.; Chevalier, D.; De Thoisy, B.; Kelle, L.; Lankester, M.C.; Nalovic, M. Chapter 1: French Guiana. In Sea Turtles in the North-West Atlantic & Caribbean Region MTSG Regional Report; Nalovic, M., Cuevas, E., Godfrey, M., Eds.; IUCN-SSC Marine Turtle Specialist Group: Ross, CA, USA, 2018; pp. 28–39. [Google Scholar]
Figure 2. Relationship between genetic (Fst) and geographic distances (km) for Greater Caribbean rookeries and management units. Group I: among areas with lower distance range except for GUCB and IJCB; Group II: GUCB and IJCB vs. the rest Western Caribbean; Group III: Western Caribbean vs. Eastern Caribbean rookeries. CLCB is highlighted with white circles within group I.
Diversity 15 00586 g002
Figure 3. Haplotype profiles for SW Cuban and regional green turtle management units (red dots). Non-Cuban endemic A1 (A1.1, A1.2, A1.4); widely shared secondary haplotypes (A16.1, A17.1, A18.1, A18.2, A28.1); rare haplotypes (A2.1, A4.1, A6.1, A20.1, A21.1, A22.1, A34.1, A53.1, A78.1); Cuban endemic (A1.5, A1.6, A3.2, A3.8, A3.9, A13.2, A27.2, A48.2, A48.3, A56.1, A57.1). Map was adapted from Maptool (seaturtle.org, Maptool 2002).
Diversity 15 00586 g003
Figure 4. Most parsimonious network for haplotype datasets from SW Cuban and Wider Caribbean green turtle and management units. The ‘CM-’ prefix was excluded from haplotype codes for legibility. Pie sizes are proportional to the relative haplotype frequencies in the total dataset. Individual pie segments represent relative haplotype frequencies estimated from sub-regional MU averages. Sub-regions: W_Caribbean = NUSA + CEFL + RNM + QRMX; C_Caribbean = SOFL + CAYM + TORT; E_Caribbean = BUCK + AVES + GUAD + SURN + FGU; GUCB = Guanahacabibes + San Felipe; IJCB = Isla de la Juventud; CLCB = Cayo Largo. Black dots = hypothetical (not observed) intermediate haplotypes; empty squares = six-bp insert distinguishing adjacent haplotypes.
Diversity 15 00586 g004
Table 1. Genetic differentiation among Southwestern Cuba green turtle rookeries using 860 bp sequences. Above the diagonal: haplotype frequency comparison using an X2 test with sequential Bonferroni correction for multiple tests. Below the diagonal: pairwise frequency-based Fst values. Non-significant values are highlighted in grey.
C. PiojosLa BarcaPerjuicioAntonioSan FelipeI. JuventudCayo Largo
C. Piojos-38.8931.7436.4428.4841.2458.36
La Barca0.073-14.4532.9016.6326.1940.05
Perjuicio0.0680.012-21.039.6016.3121.03
Antonio0.0400.0370.005-5.6845.3826.64
San Felipe0.1210.0430.0000.000-16.4110.80
I. Juventud0.3160.4300.4480.4300.610-31.97
Cayo Largo0.3260.2920.2690.2130.2000.800-
Disclaimer/Publisher’s Note: The statements, opinions and data contained in all publications are solely those of the individual author(s) and contributor(s) and not of MDPI and/or the editor(s). MDPI and/or the editor(s) disclaim responsibility for any injury to people or property resulting from any ideas, methods, instructions or products referred to in the content.

