Article

Hybridization in the Fringed Orchids: An Analysis of Species Boundaries in the Face of Gene Flow

by
Simone A. Evans
1,2,†,
Dennis F. Whigham
1,
Ida Hartvig
1,*,‡,§ and
Melissa K. McCormick
1,*,§
1
Smithsonian Environmental Research Center, 647 Contees Wharf Rd, Edgewater, MD 21037, USA
2
Department of Biology, University of Maryland, College Park, MD 20742, USA
*
Authors to whom correspondence should be addressed.
Current address: Department of Genetics, Stanford University, Stanford, CA 94305, USA.
Current address: Center for Evolutionary Hologenomics, University of Copenhagen, 1165 København, Denmark.
§
These authors contributed equally to this work.
Diversity 2023, 15(3), 384; https://doi.org/10.3390/d15030384
Submission received: 31 December 2022 / Revised: 24 February 2023 / Accepted: 27 February 2023 / Published: 7 March 2023
(This article belongs to the Special Issue Distribution and Diversity of Orchids)

Abstract

:
Natural hybridization between closely related species in sympatry is an evolutionary process that is common in orchids. Once seen as a threat to parent species, interspecific genetic change is increasingly viewed as a source of novel variation in some ecological contexts. Terrestrial fringed orchids in the genus Platanthera contain several clades with high genetic compatibility among species and many putative hybrids. We used biallelic SNPs generated with 3RAD sequencing to study the hybrid complex formed from the parent species P. blephariglottis, P. ciliaris, and P. cristata with high resolution. The genetic structure and phylogenetic relationship of the hybrid complex revealed site-dependent gene flow between species. We documented extensive hybridization and cryptic hybrids in sympatric sites. Interspecific genetic exchange is particularly common between P. blephariglottis and P. ciliaris, with cryptic hybrids among putative P. ciliaris samples being more common than parental assignments in sympatric sites. Hybridization across the triad species complex can reticulate lineages and introduce adaptive alleles. Conversely, it can reduce diversification rates and introduce maladaptive alleles. Investigation into whether anthropogenic forces are eroding species boundaries, particularly the permeable P. blephariglottis and P. ciliaris boundary, is appropriate for conservation efforts.

1. Introduction

Orchids constitute one of the most species-rich plant families, with 25,000–30,000 documented species [1,2]. The exact number of orchid species and definitions of species boundaries are sources of contention between so-called lumpers and splitters engaged in taxonomical debates [3]. Classical definitions for a biological species center around reproductive isolation [4]. Further deliberation recognized that species could remain distinct despite some gene leakage due to introgression, defined as the transfer of alleles from one taxon to another divergent taxon [3,5]. This concept of semipermeable species lines applies to several orchid species that appear to have diverged despite ongoing gene flow [3,6]. When defining lineages as separate species, the extent to which genetic exchange can occur, especially between recently diverged populations, is controversial.
Orchids have weak genetic barriers to hybridization, so interspecific crosses can occur between genetically related taxa that co-occur and maintain overlapping flowering periods [7,8,9,10]. Hybridization may influence species boundaries through differential introgression, local adaptation, speciation, or a partial merger of taxa termed reticulate evolution [3,10,11]. Conversely, hybridization may negatively affect endangered species by disrupting co-adaptive gene clusters or eroding rare species [11,12]. Orchid species delimitation is further complicated by symbioses [13,14]. Biotic interactions with pollinators and mycorrhizal fungal distributions may affect the niche range of orchid taxa [15,16], form parapatric boundaries between sympatric orchid populations, or facilitate hybridization at sites of colocalization. Characterizing interspecific genetic exchange can uncover semipermeable species boundaries and help resolve morphology-based taxon delimitation.
Hybrid zones are the geographic area where genomic exchange occurs between diverged lineages in primary or secondary contact [17]. Hybrid zone dynamics reflect the interaction of phenotypic divergence with adaptive selection, generating a plant evolution center that cannot be fully recapitulated under controlled settings [18,19,20,21]. Conservation of orchid species in the light of hybridization depends on understanding the types of crosses between species, the intensity of genetic exchange, whether the hybridization dynamics lead to the exchange of advantageous or deleterious alleles, and whether hybridization is facilitated by anthropogenic activities [22]. Intermediate phenotypes in overlapping orchid populations have historically been accepted as hybrids [23,24], but genetic data are needed to understand gene flow, intraspecific variation, and phenotypic plasticity [10,25,26].
The terrestrial orchid genus Platanthera (Rich.) [27] is a powerful system for studying plant hybridization because it maintains extensive diversity and species with overlapping spatial boundaries [19,25,28]. Platanthera orchids span most of the temperate Northern Hemisphere and have undergone extensive floral radiation [10,29,30]. Plastid and nuclear ITS markers showed evidence for polyploid hybridization and speciation in the Platanthera hyperborea complex [26]. When neutral genetic markers (AFLPs) were used to genomically assess the sympatric zone between the closely related P. bifolia and P. chlorantha, researchers showed good separation between parent species but found intermediate plants maintained the genetic profile of P. bifolia [10]. Finally, targeted enrichment of multilocus datasets reconstructed the phylogeny of Platanthera subgenus Limnorchis and was used to estimate that the subgenus diverged from Platanthera 3–4.5 Mya [30]. With observed hybridization and backcrossing, Platanthera orchids may help evaluate the evolutionary significance of porous species boundaries.
Within Platanthera, species in subgenus Blephariglottis sect. Blephariglottis [31] demonstrate strong floral radiation [32,33]. The Orange Fringed orchid, P. ciliaris (L.) Lindl, the Crested Orange Bog orchid, P. cristata (Michx.), and the White Fringed orchid P. blephariglottis (Willd.) Lind. have a wide distribution and overlap in several regions throughout the Eastern United States between New England and Florida and as far west as Texas [34,35]. The three parent species are found in sphagnum bogs, pine savannas, meadows, and prairies, with the habitats of P. ciliaris being particularly varied [34]. The specificity of two key biotic interactions, orchid mycorrhizae and pollinators, may constrain parent species distributions and generate parapatric boundaries between populations of species. While a range-wide analysis of pollinator fauna is missing for the subgenus Blephariglottis, studies have identified swallowtail butterflies (Papilio spp.) as pollinators of P. blephariglottis and P. ciliaris and bumblebees (Bombus spp.) as the predominant pollinator of P. cristata and an occasional pollinator of P. blephariglottis [34,36,37,38,39,40]. Partial overlap in pollinators and flower morphology may facilitate occasional cross-pollination events and interspecific gene flow [32]. The distribution of specific mycorrhizal fungi partners impacts the distribution of parent species and whether hybrids can establish [15]. Preliminary explorations of mycorrhizal diversity in P. ciliaris, P. cristata and P. blephariglottis have shown the three species to associate primarily with fungi in the genus Tulasnella [41,42,43], and an overlap in appropriate fungi might support the post-zygotic success of hybridization in sites of colocalization. In sites with species overlap, pairs of the three parent species have been observed to form putative hybrids with intermediate morphology [32]. Here we studied the putative crosses of P. blephariglottis with P. cristata to form P. x canbyi [33] and with P. ciliaris to form P. x bicolor [24] (Figure 1a). We analyzed sympatric sites where the hybrid’s parent species co-occurred, sympatric sites where orange parent species co-occurred and P. blephariglottis was previously observed, and allopatric sites where a single parent species occurred (Figure 1b). Out of the ten sites studied, we found putative hybrids for P. x bicolor in Central Pennsylvania as well as coastal North Carolina, and P. x canbyi on the eastern shore of Maryland as well as New Jersey.
The putative hybrids with intermediate phenotypes suggested parental species had crossed, but how they crossed and at what frequency was still unknown. The orange complex has been analyzed morphologically and observationally with pollinator ecotypes [32,34]. Still, the assumed hybridization had not been confirmed with genomic data. An attempt to identify species and putative hybrids in the orange complex with standard DNA barcoding markers (ITS, trnH-psbA, trnL) failed to distinguish the taxa due to very limited sequence diversity. Sequences are available on NCBI GenBank (accession numbers OQ474558–OQ474566 and OQ507373–OQ507385). The genetic similarity across the hybrid complex for these markers likely reflects recent species divergence that is better resolved with multilocus analyses of genetic divergence [28,44,45].
To test the hypothesis that hybridization occurs between closely related Platanthera taxa, we conducted 3RAD genomic sequencing of allopatric and sympatric sites [44,45]. We explored the extent of interspecific crosses of P. blephariglottis with P. ciliaris and P. cristata, and aimed to answer the following questions: (1) Is there hybridization and evidence of ongoing introgression? (2) What hybrid classes result from the interspecific genetic exchange? (3) How does genetic composition relate to morphological measurements? Are there cryptic hybrids? We then discuss how answers to these questions can inform strategic measures to preserve field sites with rare orchids and inform investigations into how anthropogenic change affects hybridization.

2. Materials and Methods

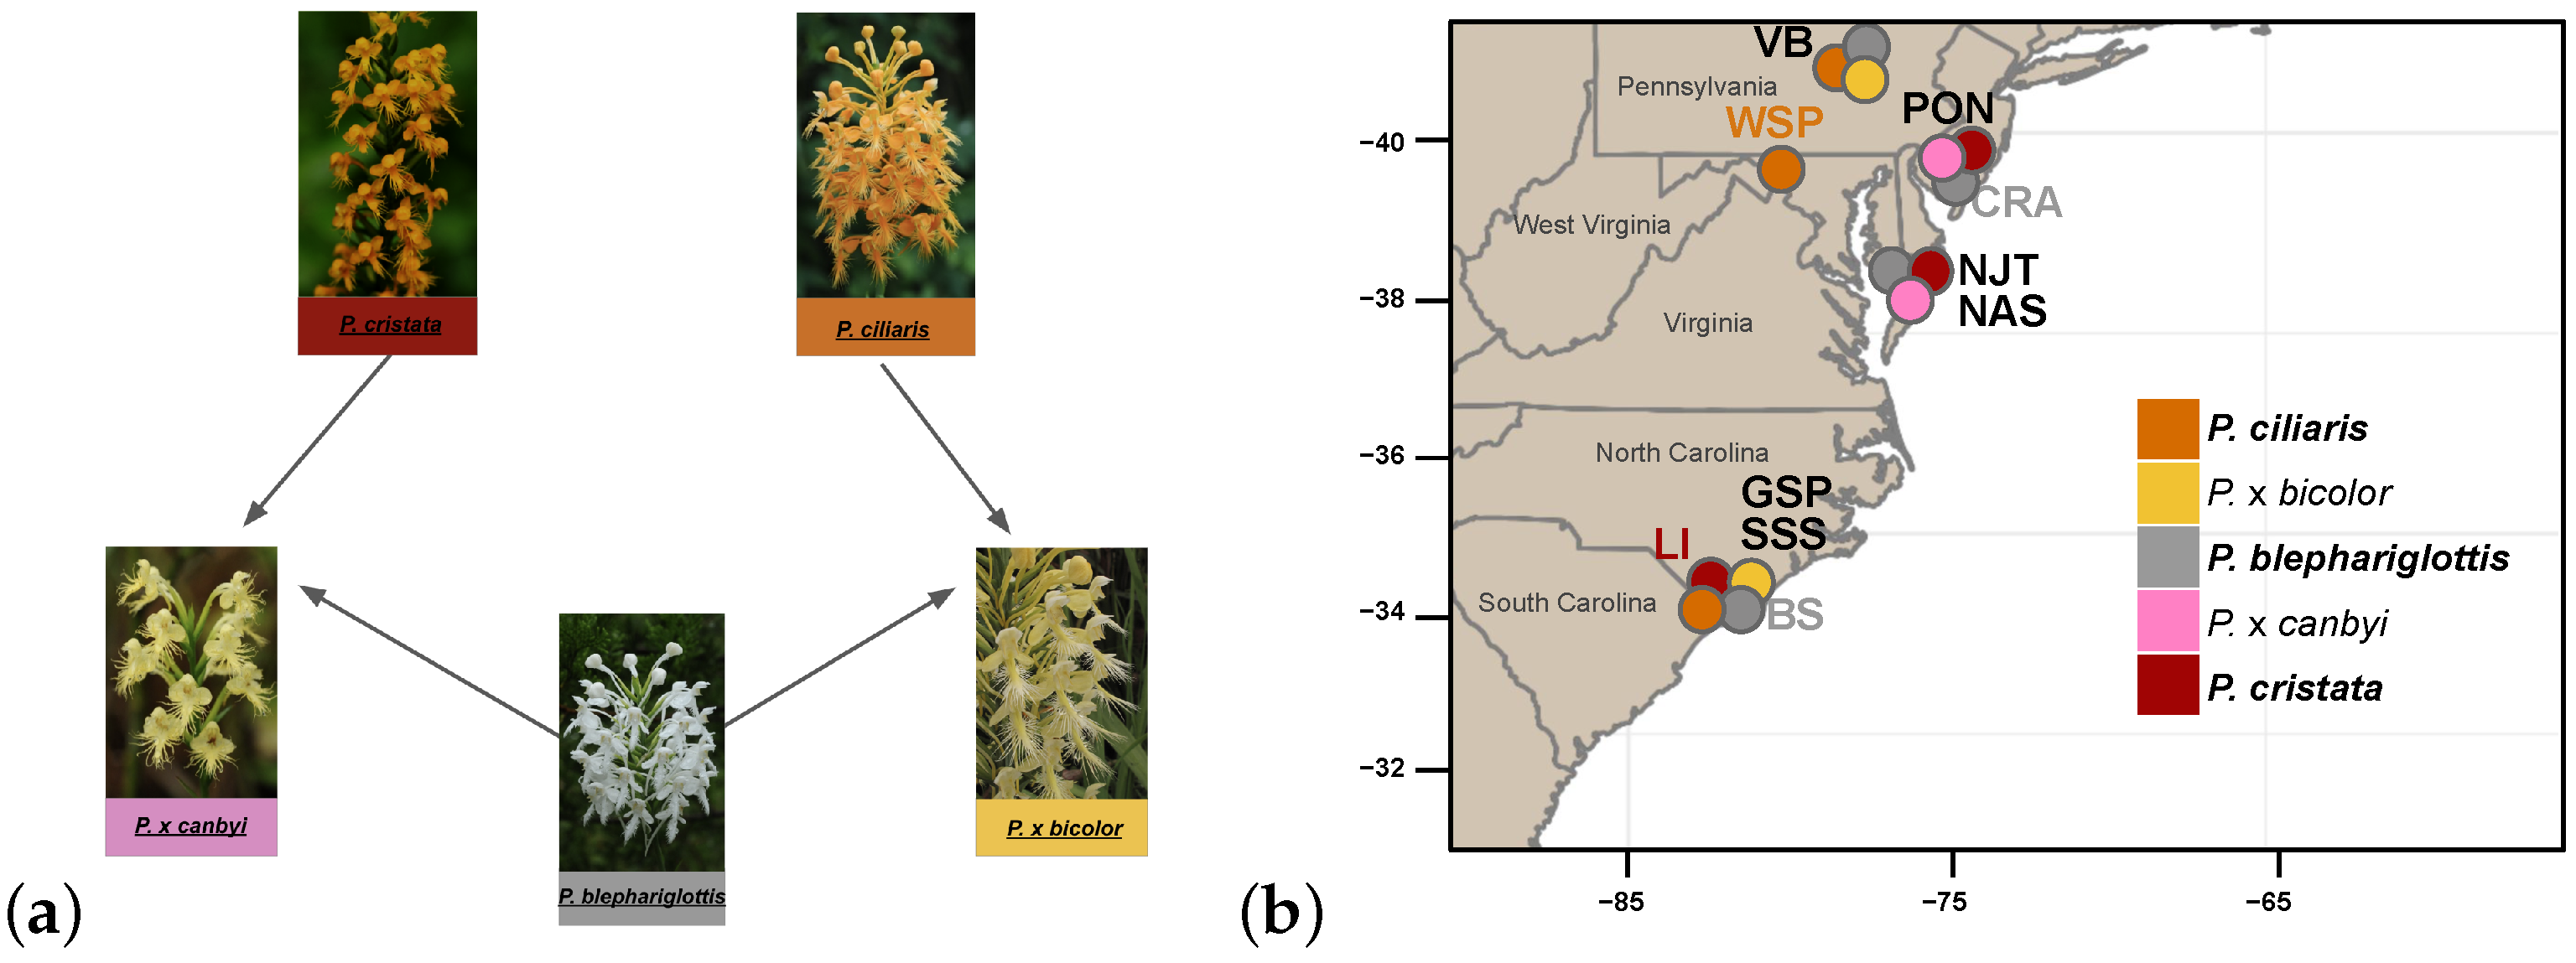
2.1. Hybridization and Backcrossing in the Fringed Orchids: Morphology

We compiled data on six morphological traits—lip width, lip length, lip with fringe, longest fringe, spur length, flower width, and inflorescence width—in the targeted populations from a larger dataset on variations in the complex [32] (Figure 1b) to assess morphological variation among taxa. We measured inflorescence width from the widest point of the inflorescence. We aimed for the center of the inflorescence for other morphological measurements, but we prioritized peak blooming flowers that occasionally fell at the bottom or top of the inflorescence, depending on the blooming stage. We obtained data on two flowers from each individual (n = 111) and according to flower color and site history, we assigned a putative species name of P. ciliaris (n = 23), P. x bicolor (n = 12), P. blephariglottis (n = 40), P. x canbyi (n = 10), or P. cristata (n = 26). We are missing flower width data for a P. blephariglottis sample in site PON (PON_ble_12) and spur length data for a P. cristata sample in SSS (SSS_cri_31).
We analyzed floral trait data in R 4.1.2 [46]. First, we calculated the mean and standard deviation of the traits for each putative species or hybrid with Morphotools [47]. To visualize the clustering of putative hybrid morphology, we implemented principal component analyses (PCA) of floral measures with MorphoTools and prcomp functions in R [47]. We calculated permutational multivariate analysis of variance (Permanova) [48], a non-parametric approach that does not require prior information about the population distribution. We performed 9999 permutations of the permanovas and implemented Benjamini–Hochberg p-value correction for multiple comparisons.

2.2. Hybridization and Backcrossing in the Fringed Orchids: Genomics

For genomic analyses, we collected 147 samples from the Platanthera hybrid complex, composed of P. ciliaris (n = 32), P. x bicolor (n = 18), P. blephariglottis (n = 53), P. x canbyi (n = 9), and P. cristata (n = 37) in ten populations across four states between July and August of 2019 (Figure 1b and Figure S8). We placed leaves in bags with silica gel immediately after collection for optimal preservation of DNA. We extracted DNA with the NucleoSpin Plant DNA extraction kit (Macherey-Nagel), following the manufacturer’s instructions and using 20 mg of dried leaf material per sample and an elution volume of 50 µL. Three enzymes, MspI, BamHI, and ClaI, were used to digest the DNA, and RAD library preparations were conducted by the EHS lab at the University of Georgia [49]. Paired-end 150 bp sequencing of pooled libraries was performed on an Illumina HiSeq instrument by Admera Health (South Plainfield, NJ, USA).
We conducted quality control validation on the raw sequence data with FastQC and removed twelve samples with fewer than 400,000 raw reads. We processed paired 3RAD reads from the remaining samples (n = 135) with iPyrad 0.9.81 [50,51] on the Smithsonian High-Performance Cluster (SI/HPC) [52]. We demultiplexed each sequencing run with a maximum of one barcode mismatch and merged the demultiplexed reads for the remaining iPyrad steps. We increased the maximum depth to 1 × 10 6 within each sample to ensure coverage of clusters that were sequenced in high depth. We applied a clustering threshold of 90% minimum similarity because it is more appropriate for closely related species [53]. We made the adapter filter stricter (2) to remove barcodes leftover from demultiplexing [51,54]. We raised the maximum number of heterozygotes in the consensus to 0.1 to retain more alignments [53]. Finally, we increased the minimum number of samples used per locus to 50 since downstream MrBayes and NewHybrids analyses are sensitive to missing data. The remaining iPyrad parameters were kept as default values [51].
To visually depict the degree of variation among the Platanthera taxa, we conducted dimensionality-reducing PCA. We filtered for SNPs that were present in 75% of samples (MinCov = 0.75), meaning SNPs not present in over 25% of samples were excluded [51]. We then used the iPyrad analysis toolkit to perform PCA with a sample impute method and t-distributed Stochastic Neighbor Embedding (tSNE) plots of PC axes with a perplexity of 9 and 10 × 10 5 iterations [51]. To model the evolutionary relationship between the Platanthera taxa, we conducted a Bayesian inference of phylogeny with MrBayes 3.2.7a on the Smithsonian HPC [51,55]. Implementation of the Metropolis coupled Markov Chain Monte Carlo (MCMC) algorithm with four heated chains, 8 million generations, a burn-in fraction of 25%, and sampling of every 1000th tree constructed a phylogenetic tree that was visualized in Jupyter Notebooks with toytree [56].

2.3. Observed Hybridization Types

To visualize the allele frequencies of Platanthera taxa, we conducted admixture analyses with STRUCTURE [57]. We ran ten runs each with K values 2–5 to conduct k-means clustering of the SNP datasets using a burn-in of 200,000 and 1 × 10 6 MCMC steps [58,59]. We averaged values across runs with CLUMPP [60]. To determine the best supported ancestral population value, we analyzed the highest rate of change in the log probability of data between successive K values [58,59].
We used NewHybrids to assign hybrid categories with posterior distributions from a Bayesian model-based clustering framework [61]. First, we re-sorted the demultiplexed files from iPyrad step 1 into two sets. One set contained P. x bicolor and its respective parent species (P. blephariglottis and P. ciliaris). The second set contained P. x canbyi and its respective parent species (P. blephariglottis and P. cristata). We re-ran steps 2–7 of the iPyrad pipeline using the adjusted parameters explained previously. The P. ciliaris set (n = 92) contained 4443 loci and the P. cristata set (n = 84) contained 4927 loci. We implemented Fst analyses with hybriddetective to filter the variants into the 300 maximum allowed by NewHybrids to focus on the most informative loci between the two parent species [62,63]. We converted the VCF file generated in iPyrad into a genepop file using PGDSpider with a population definition file that assigned the parent species to either Pop1 or Pop2 under the assumption that loci informative across parent species would be informative for the hybrids. We converted the Fst selected loci from a VCF file to a NewHybrids input file using PGDSpider [64] and generated hybrid assignments in parallelnewhybrids with a burn-in of 1 × 10 5 iterations, a sweep of 4 × 10 6 , and Jeffrey’s theta and Pi priors [61,63,65,66].

2.4. Morphological versus Genetic Composition

We overlaid the genetic composition of the orchid populations on the morphological measurements we had visualized with PCA dimension reduction analyses. We used scatterPie [67] to replace the points in the morphology PCA with pie charts reflective of the genetic admixture of the population determined by STRUCTURE analyses. For samples paired across morphological and genomic analyses (n = 9), we populated a pie chart with the STRUCTURE output for the corresponding sample. For unpaired samples, we populated the pie charts with the averaged STRUCTURE output for the corresponding species or hybrid at the same sites. As we did not obtain genomic data for the P. cristata samples in site PON, we averaged STRUCTURE output of P. cristata in sympatric sites NAS and GSP.

3. Results

3.1. Morphology Analysis

We found significant differences among species in flower morphology when we conducted a multivariate Permanova analysis of the combined traits (p < 0.001) and observed strong clustering in dimension reduction analyses (Figure S2) [32]. The putative parent species, P. blephariglottis, P. ciliaris, and P. cristata, clustered independently. The measured floral traits from the putative hybrids, P. x bicolor and P. x canbyi, clustered between the appropriate parent species. Moreover, the two principal components described 73.8% and 17.8% of the variance in flower morphology (Figure S2). The sub-complex of P. blephariglottis, P. ciliaris, and its hybrid P. x bicolor maintained morphological similarity (Figures S1–S3).

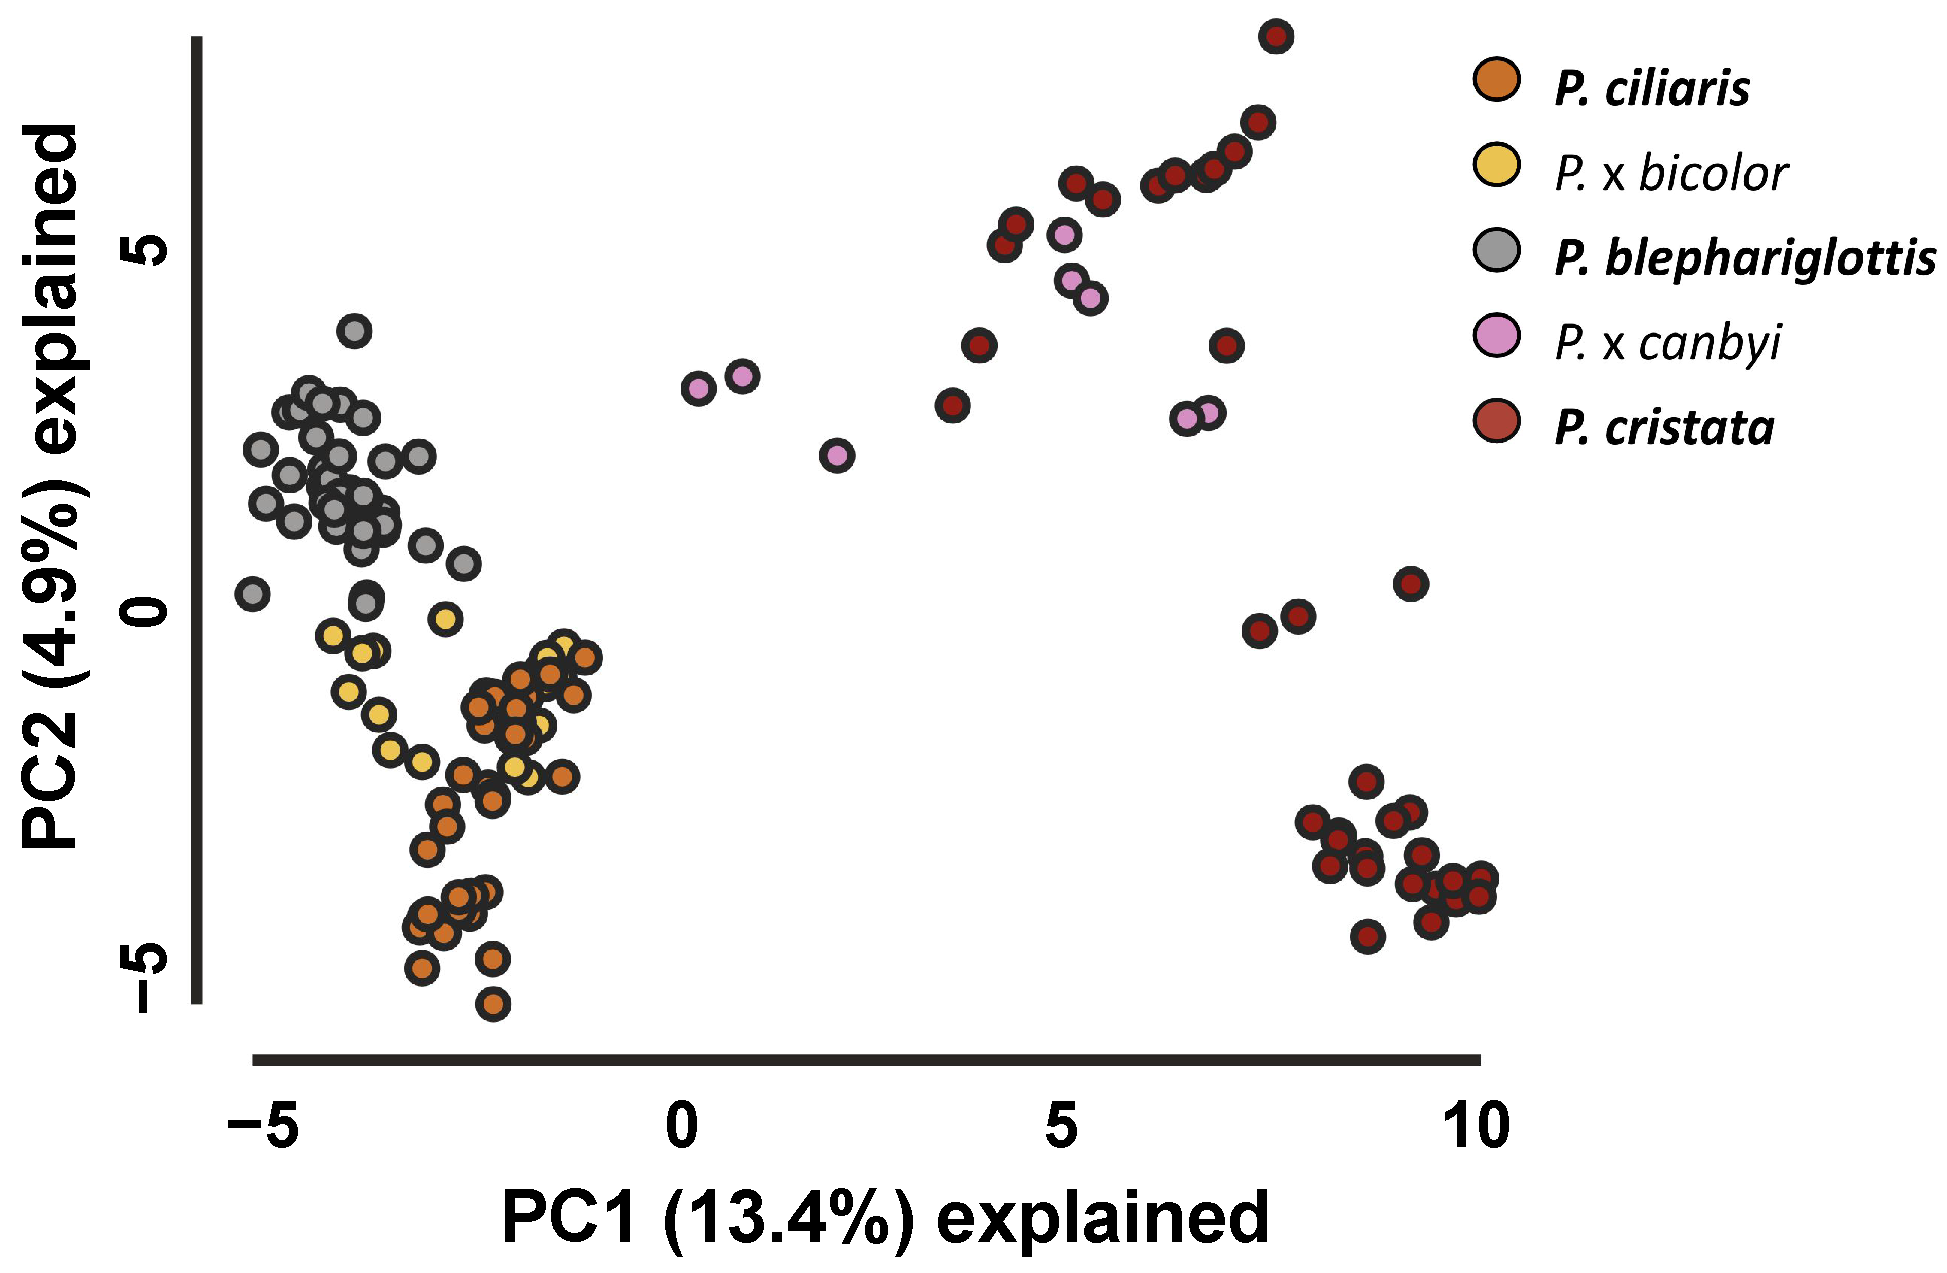
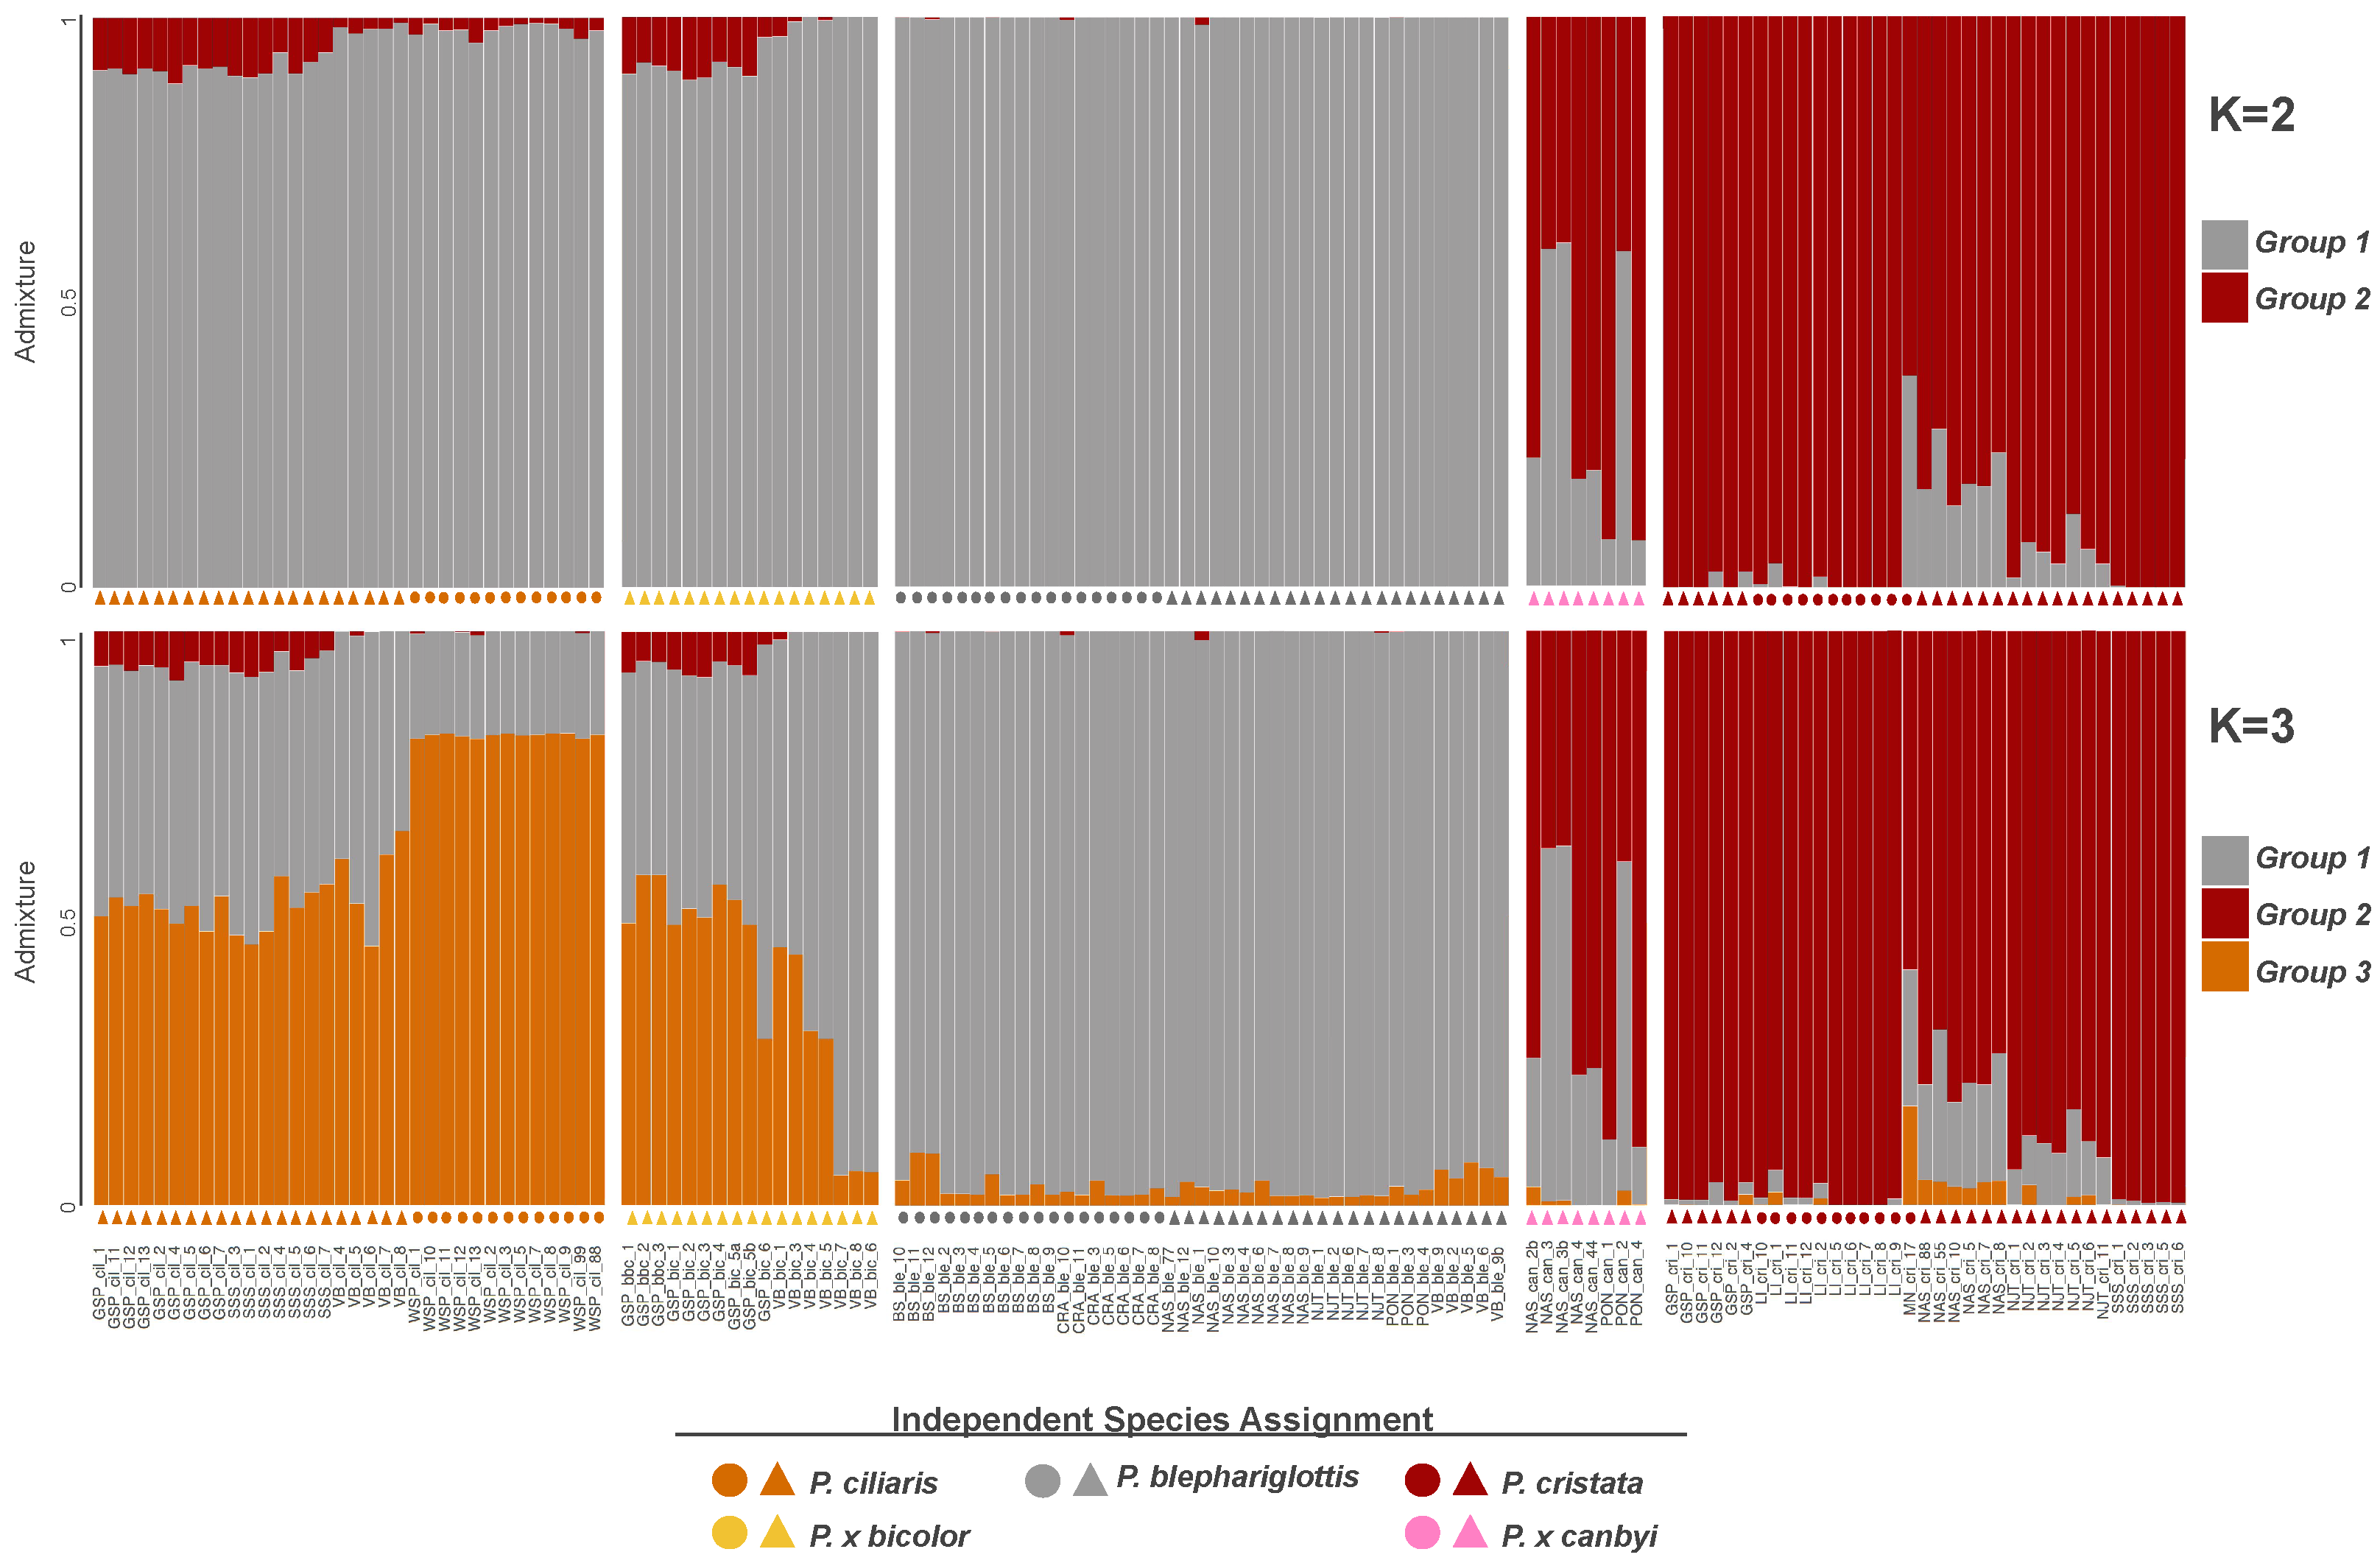
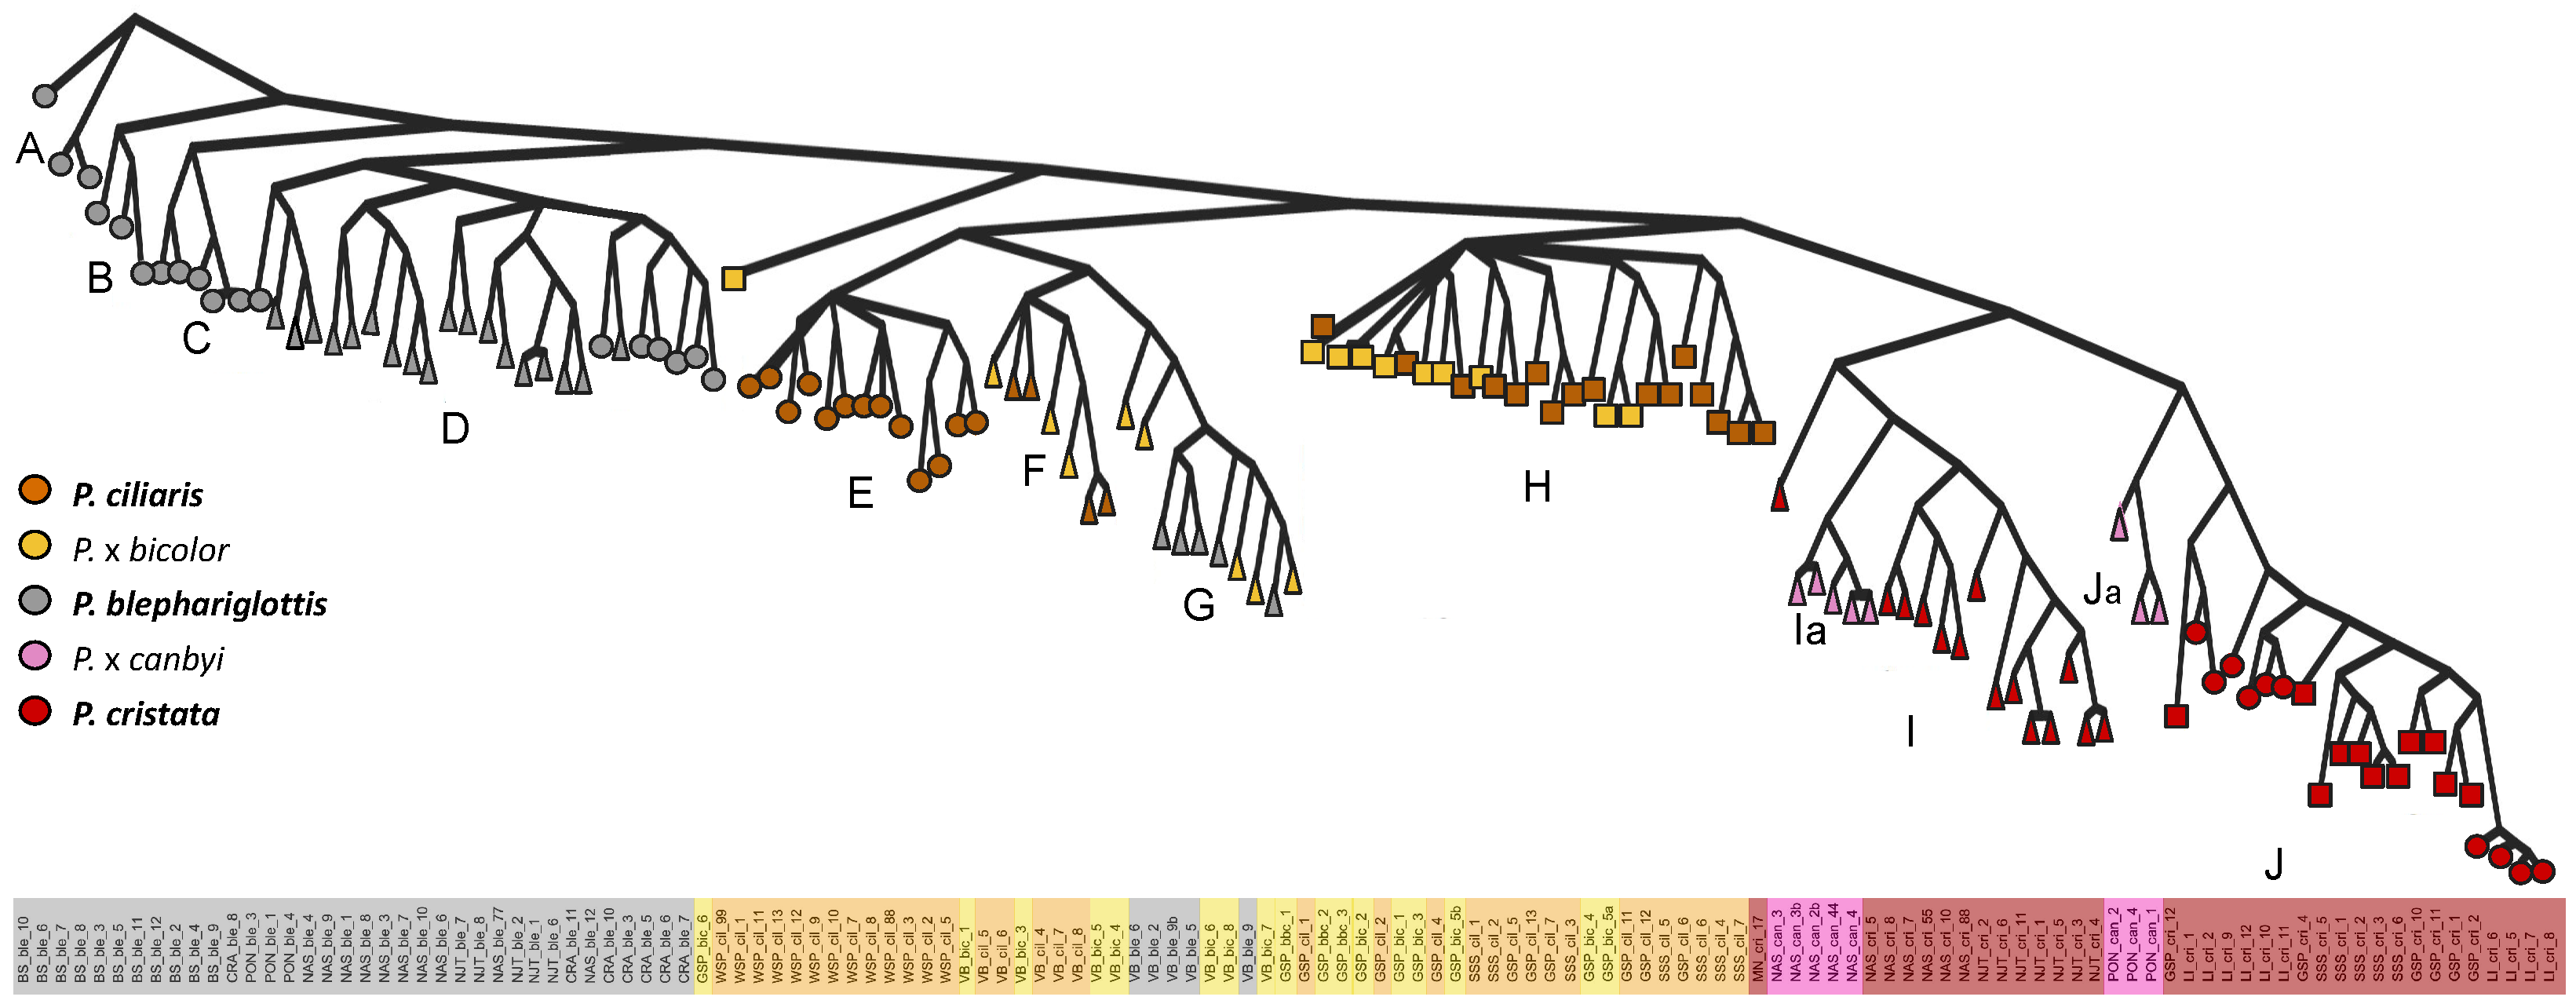
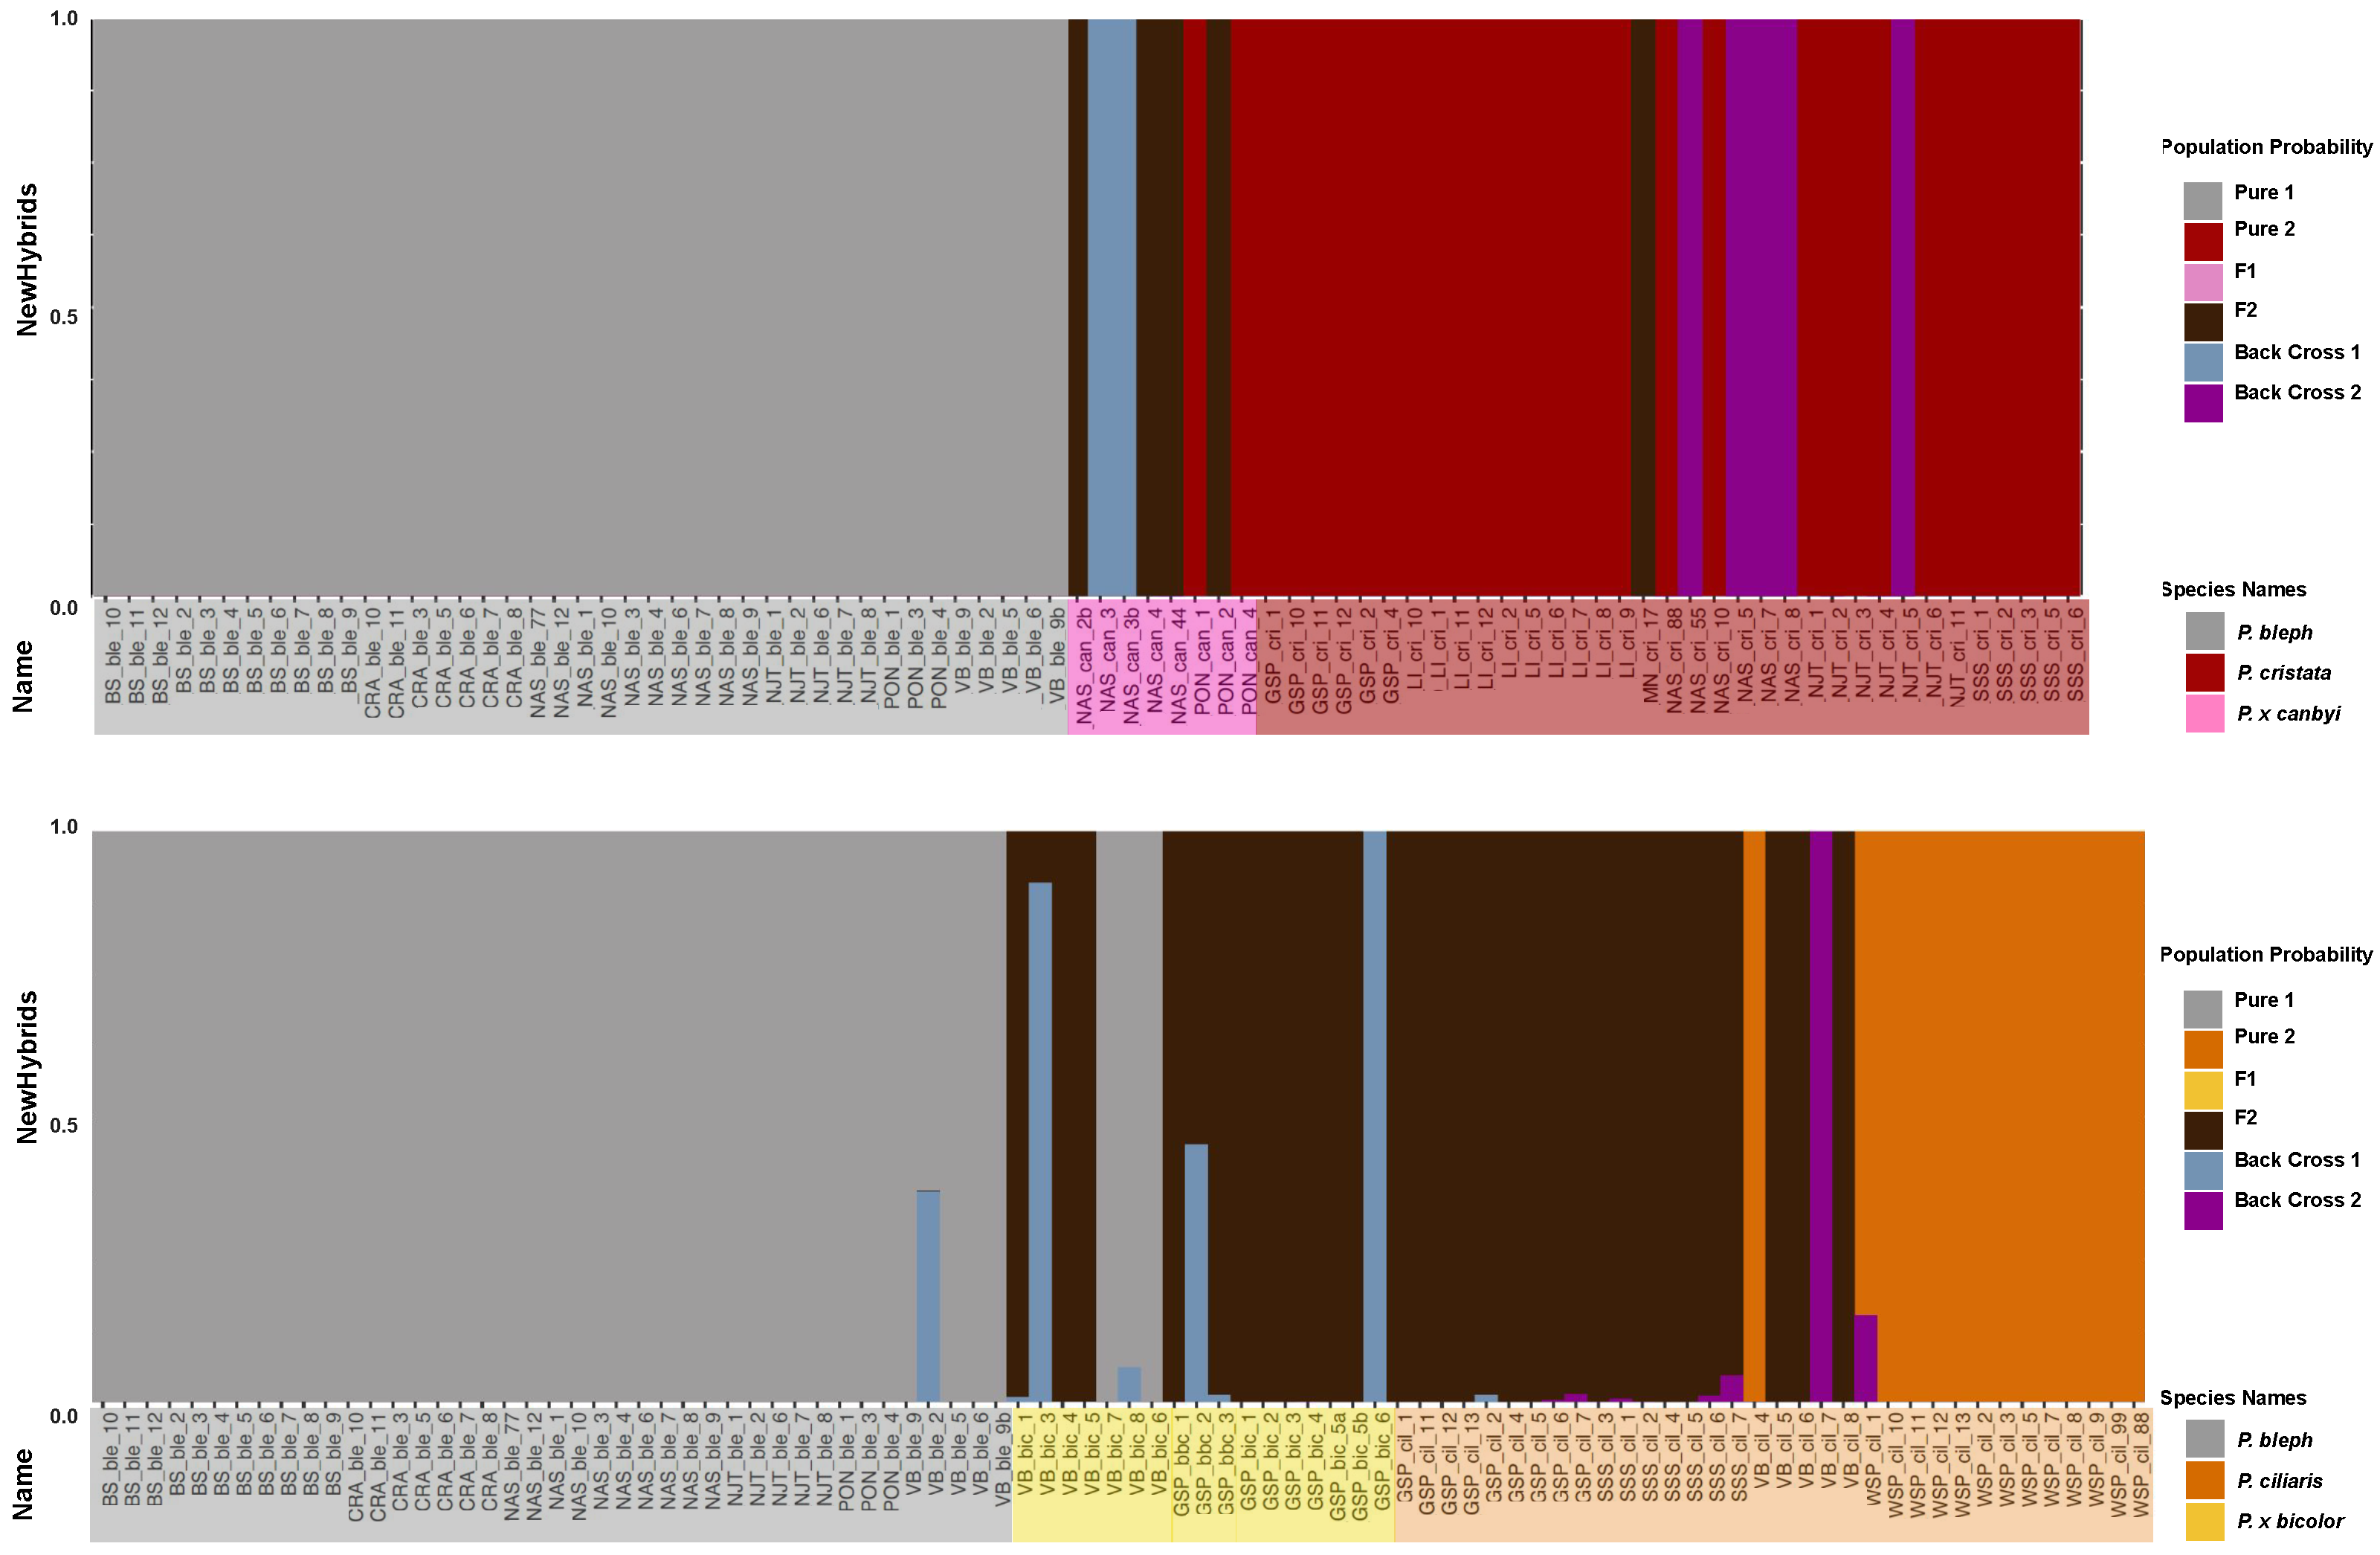
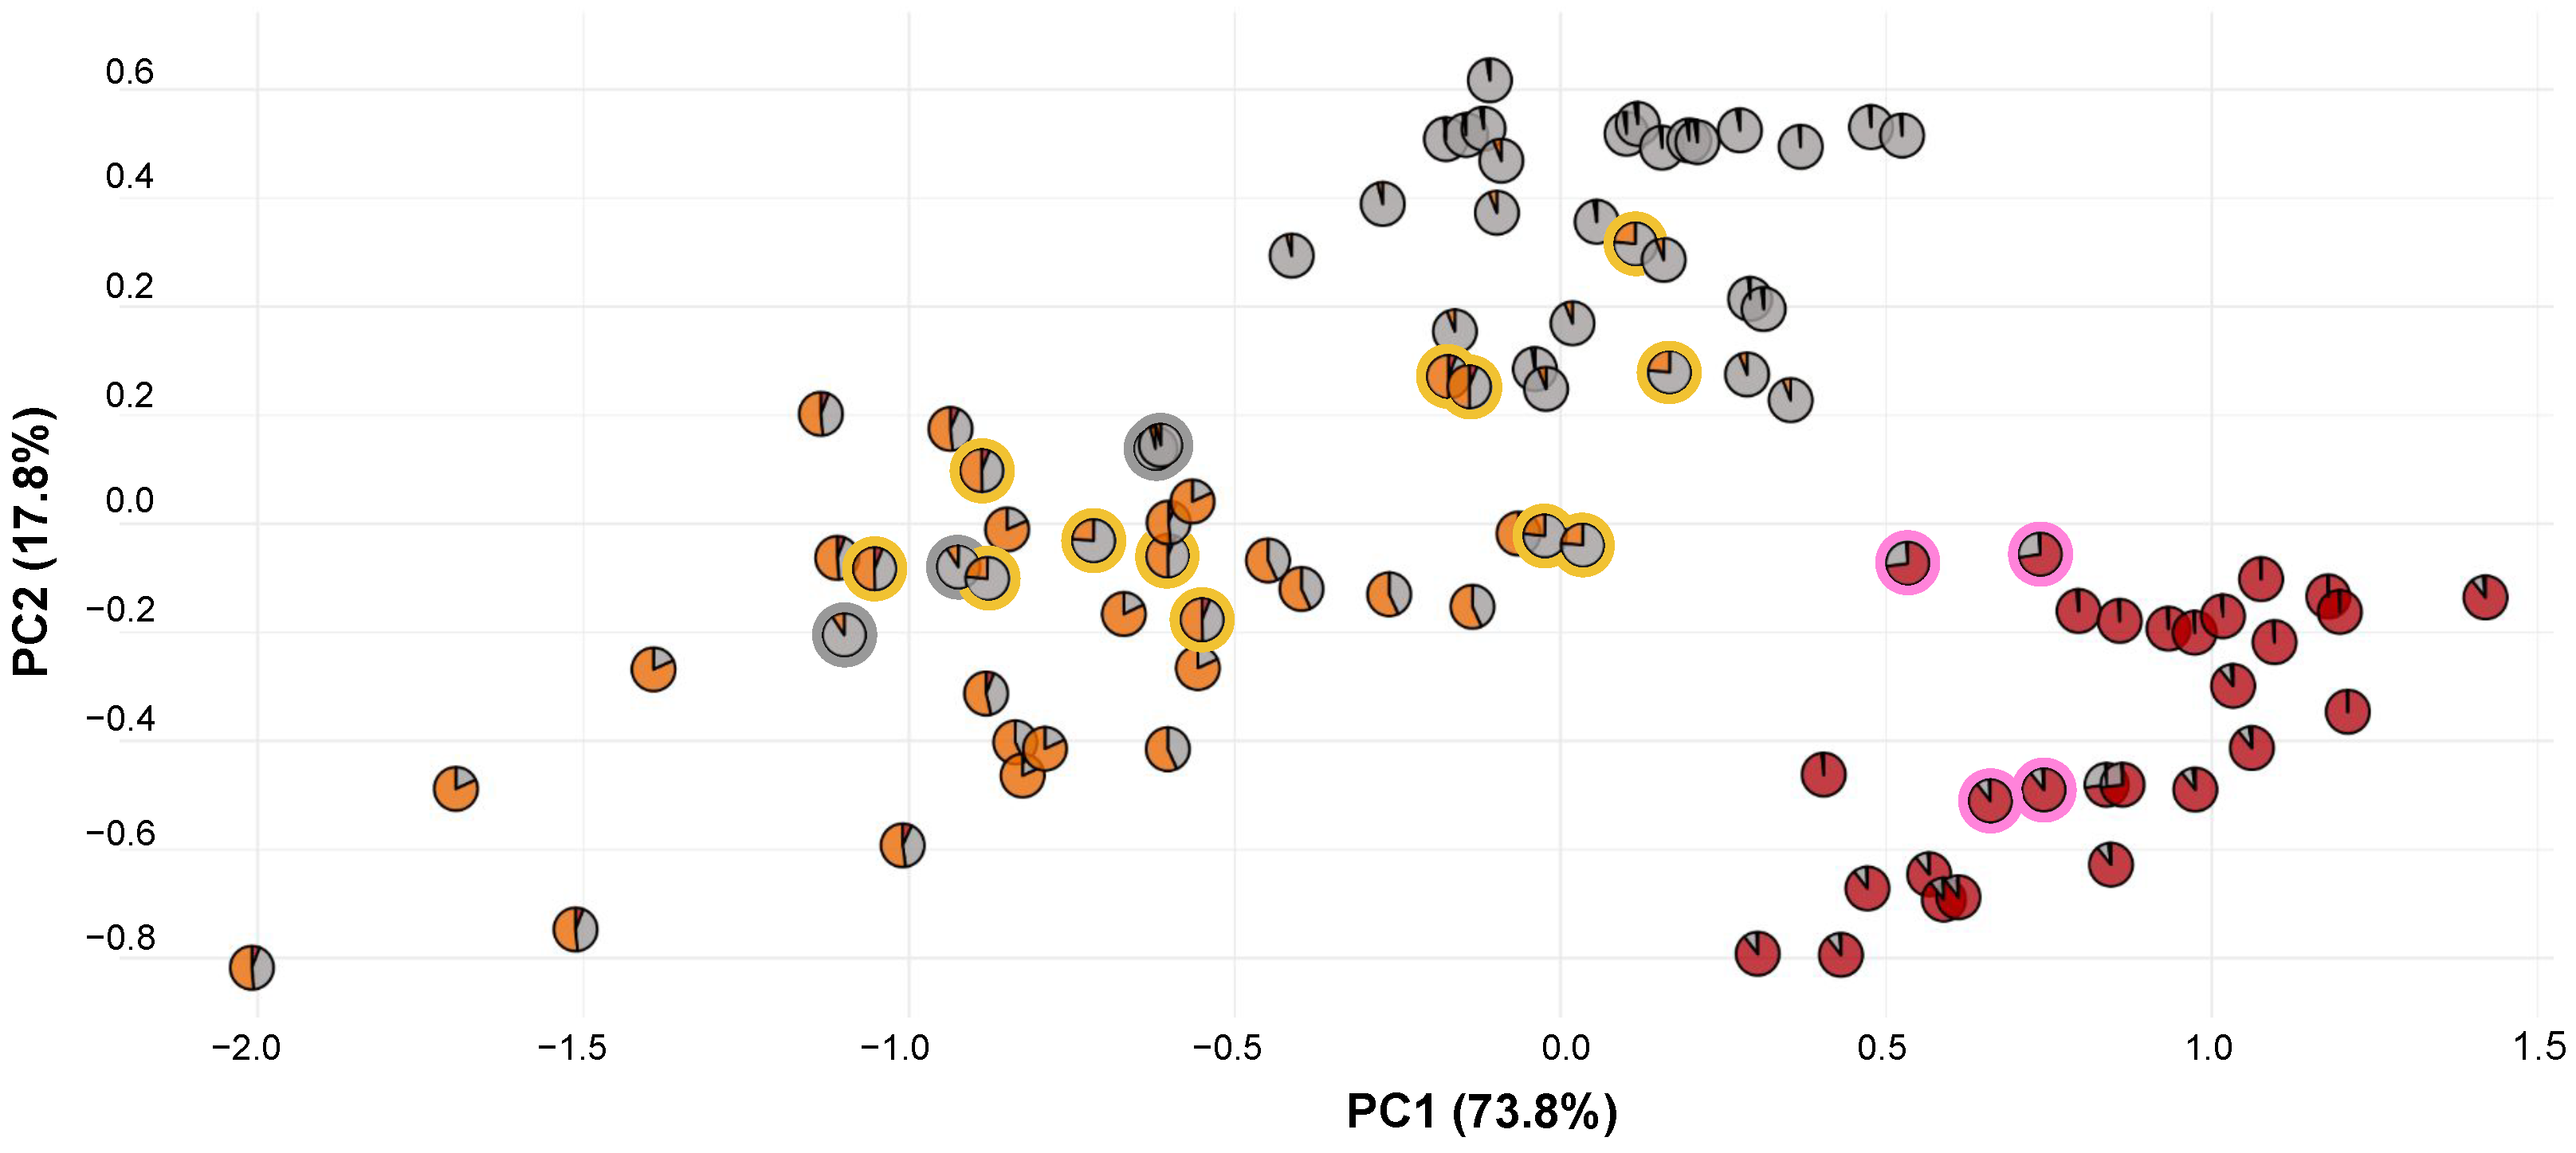
3.2. Genomic Analysis

3RAD analysis yielded an average of 1.20 × 10 6 ± 6.9 × 10 5 reads per individual that maintained an average Phred quality score of 38. iPyrad analyses identified 149,669 single nucleotide polymorphisms (SNPs) across 7214 loci after filtering. PCA dimension reduction analyses of these SNP data sets showed clustering of the parent species and hybrids between the appropriate parent species, albeit with some overlap between P. cristata and P. x canbyi as well as the extensive overlap between P. ciliaris and P. x bicolor (Figure 2 and Figure S4). The upper cluster of P. cristata overlapping with P. x canbyi were samples from sympatric sites where P. cristata was documented to have genetic admixture (NAS, NJT). The bottom P. cristata cluster contained samples from LI, GSP, and SSS. Similarly, the bottom cluster of P. ciliaris was composed of samples from the allopatric site WSP. Cluster patterns were maintained in tSNE plots (Figure S4).
To investigate gene flow between the three parent species, we conducted posterior probabilities of the SNP datasets. An ancestral population size of K = 2 was the peak value in deltaK analyses [58], but the mean L(K) was highest for K = 3 and K = 4 (Figures S6 and S7). As the deltaK method is known for bias towards K = 2 [68] and K = 3 both had a high mean L(K) and made sense biologically, we presented plots for both K = 2 and K = 3.
The two clusters defined in K = 2 broadly correspond with a P. blephariglottis + P. ciliaris cluster and a P. cristata cluster (Figure 3), indicating gene flow is stronger between P. blephariglottis and P. ciliaris. Platanthera cristata was more distinct, with some signs of introgression in sympatric sites NJT and NAS and the hybrid P. x canbyi maintained varied admixture (Figure 3). K = 3 maintained the cluster corresponding with P. cristata and further divided P. blephariglottis and P. ciliaris into two clusters. These two clusters broadly correspond to current species perceptions of P. blephariglottis and P. ciliaris and reveal significant admixture between the two species, corroborating it as a K value worth exploring.
While the SNPs of P. cristata and P. blephariglottis in allopatric sites (BS, LI sites in Figure 3) were almost exclusively assigned to one ancestral population, allopatric P. ciliaris samples (WSP) maintained some gray-orange admixture (Figure 3). More admixture was observed in sympatric sites. Platanthera ciliaris in a sympatric site with P. blephariglottis (VB) and in two sympatric sites where P. blephariglottis was not found at the time of the study but was reported in the recent past (GSP, SSS) maintained considerable admixture. Sympatric P. x bicolor and P. ciliaris maintained nearly indistinguishable structure profiles. Admixture of putative Platanthera cristata and P. x canbyi samples varied across sites. Platanthera cristata samples in sympatric sites with P. blephariglottis (NAS,NJT) maintained a genetic admixture that was slightly stronger in site NAS relative to NJT. Moreover, P. x canbyi samples maintained split or red skewed admixture is sites NAS and PON. In sites where P. blephariglottis was only reported in the recent past (GSP, SSS), the P. cristata samples maintained negligible admixture comparable to the allopatric site LI.
We observed site dependency in the degree of genomic admixture between P. cristata and P. blephariglottis that reflected the current colocalization of parent species. The admixture profile of the hybrid complex reflected the geographic distribution of the parent species. Platanthera cristata is not found in Pennsylvania [35] and we found negligible red structure in the samples from the Pennsylvania site VB. The three parent species have been observed at a preserve in Brunswick, North Carolina. While extensive admixture was seen in P. ciliaris samples of this region (GSP, SSS), negligible admixture was seen in P. cristata (LI, GSP, SSS). Interestingly, some admixture was observed between P. ciliaris and P. cristata in the GSP+SSS region, indicating potential hybridization between the two orange species. Admixture across our sites reflected the absence of parent species in certain geographic regions, but reduced admixture was observed in most P. cristata and P. blephariglottis samples.
Species were generally retained across the Bayesian inference trees (Figure 4). A clade with several subclades (A–D) contained exclusively P. blephariglottis samples. Another clade with two subclades (I,J) contained P. cristata and two paraphyletic groups of P. x canbyi (Ia,Ja). Several scattered clades contained P. ciliaris and the hybrid P. x bicolor (F,G,H), but allopatric P. ciliaris formed a distinct clade (E). We observed a site effect within the clades of parent species, as clade H only contained samples from sites in the same preserve (GSP and SSS), and the hybrids in NAS and VB clustered with their putative parents.
We classified the posterior probability that an individual belonged to a certain genotype frequency class (F1, F2, backcross, pure parent). Samples from allopatric sites (BS, CRA, WSP, LI) were assigned to a pure parent class in NewHybrid analyses. Almost all of the putative P. blephariglottis samples were assigned to the pure parent genotype in both sympatric and allopatric sites. Most of the P. ciliaris samples in sympatric sites where P. blephariglottis was localized at the time of the study (VB) or recently localized (GSP, SSS) were identified as F2 P. x bicolor. The putative P. x bicolor hybrids were also predominantly F2 P. x bicolor, but a minority were identified as P. blephariglottis or backcrosses with P. blephariglottis (Figure 5). Platanthera cristata in sites where P. blephariglottis was recently localized (GSP, SSS) were all assigned parent genotypes. The putative P. cristata in sympatric sites where P. blephariglottis was localized at the time of the study (NAS, NJT) maintained a mixture of P. cristata parent species and backcrosses of P. x canbyi with P. cristata. Putative P. x canbyi samples also maintained a range in genotype assignment, with some found to be late generation F2 hybrids, backcrosses to P. cristata, and backcrosses to P. blephariglottis (Figure 5). We found that sympatric P. ciliaris and P. blephariglottis showed substantial signs of hybridization and that sympatric P. cristata and P. blephariglottis also hybridized, but to a lesser degree. Even in sympatric sites where P. blephariglottis was not found at the time of this study (GSP, SSS), most putative P. ciliaris were P. x bicolor hybrids, and none of the P. cristata were hybrids.
To understand floral trait measurements with respect to genetic composition, we reconstructed the morphology PCA plot using pie charts composed of STRUCTURE admixture (Figure 6). We found that genetic-based name assignments maintained clear morphological trends, especially for P. blephariglottis and P. cristata. The samples on the outer fringes of the P. cristata and P. blephariglottis clusters were measured in sites where the genetic structure was relatively pure, and samples clustered in the center demonstrated more admixture. Platanthera ciliaris was more variable in genetic structure and morphology. The P. ciliaris cryptic hybrids maintained a range of morphotypes across the P. ciliaris distribution. Morphological or color-based techniques align in part with P. blephariglottis and P. cristata but do not model the genomic profile of P. ciliaris.

4. Discussion

4.1. Hybridization in Allopatric and Sympatric Sites

Natural hybridization within the plant kingdom is a double-edged evolutionary force. Hybridization may facilitate adaptive allele sharing or break apart coadapted gene groups, just as it may generate stable hybrid populations or genetically erode rare parent species [12,69]. We documented contemporary hybridization between the fringed orchid species P. ciliaris, P. blephariglottis, and P. cristata with genomic and morphological approaches. Our multilocus datasets documented interspecific gene flow across hybrid zones. We generated well-supported clades of P. cristata and P. blephariglottis but identified a convoluted phylogenetic distribution of P. ciliaris, P. x bicolor, and a subsection of P. blephariglottis samples. As we assigned species names based on color identification in the field, we did not expect clear species distinctions in the phylogenetic tree or a distinct clade of contemporary hybrids. Interestingly, we found Platanthera ciliaris and P. blephariglottis hybridized extensively, demonstrating weak reproductive barriers. Platanthera cristata hybridized to a lesser degree with P. blephariglottis in only sympatric sites. Although the three parent species are distributed throughout the Eastern United States, signs of hybridization generally occurred in regions with the appropriate parent species, suggesting that hybridization may be geographically limited by the distance between sites.
The limited rate of hybridization between P. blephariglottis and P. cristata might reflect additional site-specific prezygotic reproductive barriers, such as pollinator availability and flowering time, or post-zygotic reproductive barriers, such as seed inviability and mycorrhizal fungi constraining effects. Swallowtail butterflies (Papilio spp.) have been reported to visit P. ciliaris and P. blephariglottis and bees (Bombus spp.) have been reported to visit P. cristata and other species in the subgenus Blephariglottis [34,37,38,39,40]). Some researchers argue that the smaller flowers and shorter spurs of P. cristata suggest that they are pollinated predominantly by bees [38,40], which may explain the more distinct morphology and genomic composition of P. cristata we observed. Differences in phenology also represent barriers to hybridization that could vary along the range of the species. Variations in flowering times across the distribution area of the species have not been assessed in detail, but during fieldwork, we observed a greater overlap in flowering time for P. cristata and P. blephariglottis in NJ and MD than in NC, agreeing with a higher rate of hybridization and admixture in the northern part of the sampling area for this species pair. Flowering time for P. ciliaris and P. blephariglottis overlapped in all sites where they co-occurred, consistent with more even rates of admixture in sympatric sites across the sampling area. The difference in morphology and especially spur length, between P. cristata and the larger flowered P. blephariglottis might also contribute to the lower rate of hybridization and admixture in this species pair.
If the two species overlap in mycorrhizal fungal partners, it is plausible that hybrids are compatible with strains used by both parents. The parent species have been found to associate with strains of fungi in the genus Tulasnella [41,42,43], and a single Tulasnella strain successfully germinated both P. blephariglottis and P. ciliaris [42]. This suggests that mycorrhizal fungal specificity is likely not the primary postzygotic barrier to hybridization between P. ciliaris and P. blephariglottis, given that parental fungi are available. More research is needed to determine the mycorrhizal specificity of hybrids in relation to their parents. Whether differential OMF use by P. cristata and P. blephariglottis affects hybrid viability also remains to be tested. The strength of reproductive barriers between the two species varied but was fairly maintained across geographic areas, suggesting a balance between the reticulate gene flow within the hybrid zone and the preservation of parental genotypes [70]. Selection against hybrids has been documented for Epidendrum neotropical orchids as they maintain prezygotic isolation and low hybrid fertility [6]. Studies of several Orchis hybrid zones have also suggested that post-zygotic barriers are sufficient to maintain species integrity when reproductive isolation falters [70]. Individual reproductive barriers are generally permeable, but species integrity is maintained by a combination of several reproductive barriers that arose through reinforcement [71,72], an important note for recently diverged species in this study.
Reproductive barriers and other ecological boundaries cap the extent of genomic exchange between diverged taxa. When minimal barriers are present, hybridization can disrupt genetic integrity or promote competition due to hybrid vigor [21,73]. While P. blephariglottis and P. cristata maintained relatively limited hybridization, sympatric sites with P. ciliaris were primarily composed of P. x bicolor hybrids. We also found no P. ciliaris samples with negligible admixture in sympatric or allopatric sites, suggesting P. ciliaris might not be sufficiently isolated to prevent interspecific gene flow. Our sampling occurred over a large geographic area along the East coast of the United States, so we expect similarly high levels of hybridization to occur in other sympatric sites. While extensive hybridization documented between P. blephariglottis and P. ciliaris may support the two species being color morph varieties of one species [34], their genomic composition can largely distinguish the parent species and suggests they are closely related species that retain genetic mixing. Given our sampling was enriched in sympatric sites, future research into additional allopatric sites and multi-generational field studies can assess whether anthropogenic forces, such as agricultural expansion and erratic flowering, influence the observed hybridization and affect competition between P. x bicolor hybrids and their parent species [16,21,73].

4.2. Morphology versus Genetic Composition

The relationship between genomic and phenotypic variation has been tackled by key models, including Helianthus sunflowers, Heliconius butterflies, finches, and hamlet fish [63,74]. The environmental factors governing the hybridization patterns of these models help define drivers of introgression and rapid speciation. Orchidaceae is among the most biodiverse flowering plant families. Still, studies characterizing the molecular diversity of orchids and their hybrids are limited compared to other plant families [75]. As Platanthera orchids are a key angiosperm model for hybridization due to extensive adaptive radiation and selection mediated, in part, by specialized pollinator relationships [10,34], we coupled genomic and morphological approaches to characterize the genetic diversity of orchids.
Quantitative morphological characteristics partially reflect the hybrid complex, as putative hybrids with intermediate morphology tended to maintain mixed genetic admixture and hybrid assignment. While the extensive admixture and cryptic hybridization in P. ciliaris lacked any clear patterns with color-based or morphological measurements, the admixture and cryptic hybridization in the rest of our Platanthera complex corresponded with morphological measurements to a moderate degree. We speculate that the difficulty distinguishing the orange parent species and hybrids was partly because slight yellow is easier to distinguish from white than lighter orange is from solid orange, suggesting that color-based species identification of the white P. blephariglottis species is more precise than the orange species.
Field identification of the orange parent species (P. ciliaris and P. cristata) and their respective hybrids with P. blephariglottis based on flower color alone was not sufficient. As several visually identified P. cristata were identified as cryptic P. x canbyi, it is more appropriate to implement both color and quantitative morphological measurements when genomic analyses are impractical. These morphological measurements can focus on a small set of easily measurable traits, such as spur and fringe length [32], and be supplemented with genomic analyses when possible. The wide range of P. ciliaris morphological measurements were not reflective of genomic hybrid status, suggesting that genomic approaches are important to tease apart cryptic hybridization in the subcomplex P. ciliaris forms with P. blephariglottis. A limitation of our study was not pairing morphological and genomic measurements on an individual sample level. Direct sample pairing in future studies may allow better linking of morphology and genomics. The range of admixture profiles for the orange parent species demonstrates that the complex interplay between phenotypic divergence and molecular composition [18] in actively evolving hybrid zones is best resolved with genomic approaches.

4.3. Species Boundaries and Conservation Models

Hybridization and introgression influence orchid evolution [44], and the resulting genetic and morphological intermediates make it challenging to delimit species. The species boundaries of rapidly evolving Platanthera orchids undergoing interspecific gene flow demonstrate this complexity. A ploidy of 2n = 42 is broadly conserved across the majority of Platanthera taxa [76], and our results suggest repeated backcrossing supports P. x canbyi and P. x bicolor being homoploid hybrids and maintaining the same chromosome number as parent species [19]. As the genomic structure of the Platanthera hybrid complex aligns with their modern species colocalization, the hybrids likely represent patchily distributed products of contemporary hybridization. Ongoing gene flow in hybrid zones is often a transitional phase within the longer-term interspecific exchange that can allow for variation in allele frequency [10,17]. Unlike most hybrid zone models, however, Platanthera orchids do not occur along a single plane of colocalization. With patchily distributed species, the orange Platanthera complex maintained a continuum of genetic structure in sites with multiple parent species. Cross-pollination and the establishment of seedlings with the appropriate fungi is a differential process likely needed to generate stable hybrid populations [77] and may influence the patchy distribution of the Platanthera taxa. Interspecific exchange in the hybrid zones containing the Platanthera complex demonstrates continuity in species boundaries that merits future research into whether hybridization is driven by anthropogenic forces, including wetland drainage, agricultural expansion, invasive species expansion, pollinator decline as a result of habitat disruption and pesticides, and erratic flowering in a warming climate [16].
The three primary species models (biological, phylogenetic, and ecological) delimit species in different ways, but underlying evolutionary principles–such as variation, genetic determination, inheritance, selection, and accumulated change–are consistent. As speciation occurs as a continuum [3], it is arguably as important to analyze the evolutionary processes influencing diversification, such as hybridization. Natural hybridization may support biodiversity through novel breeding opportunities or impair hybrid fitness by generating genomic obstacles. Here, we outline a few potential impacts of our observed hybridization on species-level evolution. Hybridization localized to certain sites could support a local homogenization of parent species and potentially ephemeral speciation. If the hybrids have an adaptive advantage over their parent species, they might evolve into a stable population with the potential to generate a separate species. Still, widespread hybridization can result in genetic erosion of endangered or locally endangered parent species [12,69]. The hybrid P. x canbyi is confined to sympatric sites, and we do not see any clear evidence of genetic erosion in P. cristata or P. blephariglottis. However, the prominence of cryptic P. x bicolor might reflect the partial erosion of P. ciliaris. Conservation models may need to assess whether anthropogenic activities promote a breakdown of natural species barriers, especially between P. ciliaris and P. blephariglottis, to inform site preservation and whether to co-plant parent species in restoration efforts. If the processes leading to hybridization are natural, however, no intervention would be warranted. Longitudinal studies into whether anthropogenic factors, such as fragmentation, or natural factors, such as fungal specificity or species fitness, influence colocalization and promote species erosion would further inform conservation decisions.

5. Conclusions

To describe gene flow between possibly diverging taxa, we analyzed hybridization across a set of allopatric and sympatric sites. We showed that multilocus genomic analyses provided the resolution to study hybridization between closely related Platanthera taxa when single fragment approaches were insufficient. The genomic composition of the Platanthera hybrid complex revealed contemporary hybridization in sites of colocalization. We showed permeable reproductive barriers between P. ciliaris and P. blephariglottis and somewhat permeable reproductive barriers between P. cristata and P. blephariglottis. To determine whether anthropogenic activities drive breakdowns of natural barriers to gene flow, longitudinal studies into habitat fragmentation and symbiotic partner decline of the Platanthera hybrid complex may help explain the extensive hybridization we observed across the Eastern United States. Hybridization dynamics provide insight into the interplay between genomic structure and species boundaries. A genomic understanding of diversity and hybridization coupled with measures of anthropogenic pressure may inform Platanthera conservation.

Supplementary Materials

The following supporting information can be downloaded at: https://www.mdpi.com/article/10.3390/d15030384/s1, Figure S1: Floral Measurements; Figure S2: Floral PCA; Figure S3: Floral Violin Plots; Figure S4: Labeled Genomic PCA and tSNE Plots; Figure S5: MrBayes Bootstrapped; Figure S6: Evanno Plots; Figure S7: K = 2–5 STRUCTURE Plots; Figure S8: Site Information.

Author Contributions

Conceptualization, I.H., S.A.E., M.K.M. and D.F.W.; methodology, S.A.E., I.H. and M.K.M.; software, S.A.E.; validation, S.A.E., I.H. and M.K.M.; formal analysis, S.A.E. and I.H.; investigation, I.H., S.A.E. and M.K.M.; resources, M.K.M., I.H., S.A.E. and D.F.W.; data curation, I.H.; writing—original draft preparation, S.A.E.; writing—review and editing, I.H., S.A.E., M.K.M. and D.F.W.; visualization, S.A.E.; supervision, M.K.M., I.H. and D.F.W.; project administration, I.H., S.A.E. and M.K.M.; funding acquisition, I.H., M.K.M. and S.A.E. All authors have read and agreed to the published version of the manuscript.

Funding

This research was funded by the Carlsberg Foundation (Grant: CF190076), the Garden Club of America (The Elizabeth Gardner Norweb Summer Environmental Studies Scholarship), the Washington Biologist Field Club, the Maryland Native Plant Society, the American Orchid Society, and the National Science Foundation (REU Award: #1950656).

Data Availability Statement

3RAD genomic data is available at the Electronic Research Data Archive (ERDA) at University of Copenhagen, https://doi.org/10.17894/ucph.7e5e4947-519f-4472-b122-4a72253d8c3d.

Acknowledgments

We appreciate financial and administrative support from Julianne McGuinness and the North American Orchid Conservation Center. We appreciate support from the Nature Conservancy for allowing us to work in Brunswick, NC. and Worcester, MD. We appreciate support from Bob Sprague for helping access sites in Hazleton, PA, and Chatsworth, NJ., as well as the Pine Island Cranberries Co. for permission to access sites in Chatsworth, NJ. We extend our thanks to Thomas Chapin, Monica Marcelli, Eranga Wettewa, Hope Brooks, Collot Guerard, and Brett Morgan, associated with the Molecular Ecology and Plant Ecology labs at the Smithsonian Environmental Research Center. We thank the Smithsonian National Museum of Natural History Laboratories of Analytical Biology (LAB) and recognize that most analyses were conducted on the Smithsonian High Performance Cluster (SI/HPC; https://doi.org/10.25572/SIHPC). We thank Isaac Overcast for actively participating in the iPyrad Gitter (https://gitter.im/dereneaton/ipyrad) to support iPyrad and its downstream analyses. Finally, we thank Rebecca Dikow, Mike Trizna, and Matthew Kweskin at the Smithsonian for analysis assistance.

Conflicts of Interest

The authors declare no conflict of interest.

Abbreviations

The following abbreviations are used in this manuscript:
RADRestriction site Associated DNA Sequencing
SNPSingle Nucleotide Polymorphism
F1First filial generation
F2Second and later filial generations
blePlatanthera blephariglottis
criPlatanthera cristata
cilPlatanthera ciliaris
bicPlatanthera x bicolor
bbcPlatanthera x bicolor
canPlatanthera x canbyi

References

  1. Givnish, T.J.; Spalink, D.; Ames, M.; Lyon, S.P.; Hunter, S.J.; Zuluaga, A.; Iles, W.J.; Clements, M.A.; Arroyo, M.T.; Leebens-Mack, J.; et al. Orchid Phylogenomics and multiple drivers of their extraordinary diversification. Proc. R. Soc. B 2015, 282, 20151553. [Google Scholar] [CrossRef]
  2. Hassler, M. World Orchids. Synonymic Checklist and Distribution of the Orchids of the World. Version 14.5. Available online: www.worldplants.de/orchids/ (accessed on 4 December 2022).
  3. Harrison, R.G.; Larson, E.L. Hybridization, introgression, and the nature of Species Boundaries. J. Hered. 2014, 105, 795–809. [Google Scholar] [CrossRef] [PubMed]
  4. Mayr, E. Systematics and the Origin of Species; Columbia University Press: New York City, NY, USA, 1942. [Google Scholar]
  5. Queiroz, K. Ernst Mayr and the modern concept of species. Proc. Natl. Acad. Sci. USA 2005, 102, 6600–6607. [Google Scholar] [CrossRef] [PubMed]
  6. Arida, B.L.; Scopece, G.; Machado, R.M.; Moraes, A.P.; Forni-Martins, E.; Pinheiro, F. Reproductive barriers and fertility of two neotropical orchid species and their natural hybrid. Evol. Ecol. 2021, 35, 41–64. [Google Scholar] [CrossRef]
  7. Andriamihaja, C.F.; Ramarosandratana, A.V.; Grisoni, M.; Jeannoda, V.; Besse, P. The Leafless Vanilla Species-Complex from the South-West Indian Ocean Region: A Taxonomic Puzzle and a Model for Orchid Evolution and Conservation Research. Diversity 2020, 12, 443. [Google Scholar] [CrossRef]
  8. Cozzolino, S.; D’Emerico, S.; Widmer, A. Evidence for reproductive isolate selection in Mediterranean orchids: Karyotype differences compensate for the lack of pollinator specificity. Biol. Lett. 2004, 271, 259–262. [Google Scholar] [CrossRef]
  9. Dafni, A.; Ivri, Y. Pollination ecology of, and hybridization between, Orchis coriophora L. and Orchis collina Sol. ex Russ. (Orchidaceae) in Israel. New Phytol. 1979, 83, 181–187. [Google Scholar] [CrossRef]
  10. Esposito, F.; Vereecken, N.J.; Gammella, M.; Rinaldi, R.; Laurent, P.; Tyteca, D. Characterization of sympatric Platanthera bifolia and Platanthera chlorantha (Orchidaceae) populations with intermediate plants. PeerJ 2018, 6, 4256. [Google Scholar] [CrossRef]
  11. Vereecken, N.J.; Dafni, A.; Cozzolino, S. Pollination syndromes in Mediterranean orchids—implications for speciation, taxonomy and conservation. Bot. Rev. 2010, 76, 220–240. [Google Scholar] [CrossRef]
  12. Stull, G.W.; Pham, K.K.; Soltis, P.S.; Soltis, D.E. Deep reticulation: The long legacy of hybridization in vascular plant evolution. Plant J. 2023. Accepted Author Manuscript. [Google Scholar] [CrossRef]
  13. Fay, M.F. How can we meet the challenges in the twenty-first century? Bot Stud. 2018, 59, 16. [Google Scholar] [CrossRef] [PubMed]
  14. Krupnick, G.A.; McCormick, M.K.; Mirenda, T.; Whigham, D.F. The status and future of Orchid Conservation in North America. Ann. Mo. Bot. Gard. 2013, 99, 180–198. [Google Scholar] [CrossRef]
  15. Li, T.; Wu, S.; Yang, W.; Selosse, M.; Goa, J. How Mycorrhizal Associations Influence Orchid Distribution and Population Dynamics. Front. Plant Sci. 2021, 12, 647114. [Google Scholar] [CrossRef] [PubMed]
  16. Wallace, L.E. Biological Investigations In the Genus Platanthera (Orchidaceae): Conservation Issues in Platanthera Leucophaea Furthermore, Evolutionary Diversification in Section Limnorchis. Ph.D. Thesis, School of the Ohio State University, Columbus, OH, USA, 2002. Available online: https://etd.ohiolink.edu/apexprod/rws_olink/r/1501/10?clear=10&p10_accession_num=osu1038833679 (accessed on 20 February 2023).
  17. Gompert, Z.; Mandeville, E.G.; Buerkle, C.A. Analysis of population genomic data from hybrid zones. Annual Review of Ecology, Evolution, and Systematics. Annu. Rev. Ecol. Evol. Syst. 2017, 48, 207–209. [Google Scholar] [CrossRef]
  18. Knief, U.; Bossu, C.M.; Saino, N.; Hansson, B.; Poelstra, J.; Vijay, N.; Weissensteiner, M.; Wolf, J.B. Epistatic mutations under divergent selection govern phenotypic variation in the Crow Hybrid Zone. Nat. Ecol. Evol. 2019, 3, 570–576. [Google Scholar] [CrossRef]
  19. Runemark, A.; Vallejo-Marin, M.; Meier, J.I. Eukaryote hybrid genomes. PLoS Genet. 2019, 15, e1008404. [Google Scholar] [CrossRef]
  20. Taylor, S.A.; Larson, E.L. Insights from genomes into the evolutionary importance and prevalence of hybridization in nature. Nat. Ecol. Evol. 2019, 3, 170–177. [Google Scholar] [CrossRef]
  21. Vilà, M.; Weber, E.; D’Antonio, C.M. Conservation implications of invasion by plant hybridization. Biol. Invasions. 2000, 2, 207–217. [Google Scholar] [CrossRef]
  22. Swarts, N.D.; Dixon, K.W. Terrestrial orchid conservation in the age of extinction. Ann. Bot. 2009, 104, 543–556. [Google Scholar] [CrossRef]
  23. Stoutamire, W.P. Relationships of the purple-fringed orchids Platanthera psycodes and P. grandiflora. Brittonia 1974, 26, 42–58. [Google Scholar] [CrossRef]
  24. Brown, P.M. Understanding Platanthera chapmanii (Orchidaceae), its origins and hybrids. SIDA Contrib. Bot. 2004, 21, 853–859. [Google Scholar]
  25. Wallace, L.E. Spatial genetic structure and frequency of interspecific hybridization in Platanthera aquilonis and P. dilatata (Orchidaceae) occurring in sympatry. Am. J. Bot. 2006, 93, 1001–1009. [Google Scholar] [CrossRef]
  26. Wettewa, E.; Bailey, N.; Wallace, L.E. Comparative analysis of genetic and morphological variation within the Platanthera hyperborea complex (Orchidaceae). Syst. Bot. 2020, 45, 767–778. [Google Scholar] [CrossRef]
  27. Richard, L.M. De Orchideis Europaeis Annotationes; Ex typ. A. Belin: Paris, France, 1817. [Google Scholar]
  28. Bateman, R.M.; James, K.E.; Rudall, P.J. Contrast in levels of morphological versus molecular divergence between closely related Eurasian species of Platanthera (orchidaceae) suggests recent evolution with a strong allometric component. New J. Bot. 2012, 2, 110–148. [Google Scholar] [CrossRef]
  29. Hulten, E.; Fries, M. Atlas of North European Vascular Plants North of the Tropic of Cancer; Koeltz Scientific Books: Schmitten, Germany, 1986. [Google Scholar]
  30. Wettewa, E.; Wallace, L.E. Molecular phylogeny and ancestral biogeographic reconstruction of Platanthera subgenus Limnorchis (Orchidaceae) using target capture methods. Mol. Phylogenet. Evol. 2021, 157, 107070. [Google Scholar] [CrossRef] [PubMed]
  31. Efimov, P.G. A Revision of Platanthera (Orchi-daceae; Orchidoideae; Orchideae) in Asia. Phytotaxa 2016, 254, 1–233. [Google Scholar] [CrossRef]
  32. Hartvig, I.; Evans, S.; Ligon, J.; Eserman, L.; Coffey, E.; McCormick, M. Quantitative morphological variation in the orange and white fringed orchids (Platanthera) in the eastern US. American Orchid Society. Lindleyana 2022, 532–539. Available online: https://static-curis.ku.dk/portal/files/326038574/Hartvig_et_al_2022_Quantitative_morphology_Platanthera.pdf (accessed on 20 February 2023).
  33. Luer, C.A. The Native Orchids of the United States and Canada Excluding Florida; The New York Botanical Garden: Bronx, NY, USA, 1975. [Google Scholar]
  34. Argue, C.L. The Pollination Biology of North American Orchids; Springer: New York City, NY, USA, 2012. [Google Scholar]
  35. The PLANTS Database. United States Department of Agriculture, Natural Resources Conservation Service. Available online: http://plants.usda.gov (accessed on 20 February 2023).
  36. Pace, M.C. The Orchidaceae of northeastern North America: Systematics, evolution, diversity, and conservation. J. Torrey Bot. 2020, 29, 156–189. [Google Scholar]
  37. Cole, F.R.; Firmage, D.H. The Floral Ecology of Platanthera-Blephariglottis. Am. J. Bot. 1984, 71, 700–710. [Google Scholar] [CrossRef]
  38. Hapeman, J.R.; Inoue, K. Floral Diversification, Pollination Biology, and Molecular Evolution in Platanthera (Orchidaceae); Cambridge University Press: Cambridge, UK, 1997; pp. 433–454. [Google Scholar]
  39. Robertson, J.L.; Wyatt, R. Evidence for Pollination Ecotypes in the Yellow-Fringed Orchid, Platanthera ciliaris. Evolution 1990, 44, 121–133. [Google Scholar] [CrossRef]
  40. Smith, G.; Snow, G. Pollination Ecology of Platanthera (Habenaria) ciliaris and P. blephariglottis(Orchidaceae). Bot. Gaz. 1976, 137, 133–140. [Google Scholar] [CrossRef]
  41. Zale, P.J.; McCormick, M.K.; Whigham, D.F. Choosing a Favorable Substrate to Cultivate Native Orchids Symbiotically: Examples Using Goodyera tesselata and Platanthera blephariglottis. HortScience 1976, 57, 634–642. [Google Scholar] [CrossRef]
  42. Zettler, L.W.; Dvorak, C.J. Tulasnella calospora (UAMH 9824) retains its effectiveness at facilitating orchid symbiotic germination in vitro after two decades of subculturing. Bot Stud. 2021, 62, 34580790. [Google Scholar] [CrossRef] [PubMed]
  43. Zettler, L.W.; Hofer, C.J. Propagation of the little club-spur orchid (Platanthera clavellata) by symbiotic seed germination and its ecological implications. Environ. Exp. Bot. 1998, 39, 189–195. [Google Scholar] [CrossRef]
  44. Cozzolino, S.; Scopece, G.; Roma, L.; Schlüter, P.M. Different filtering strategies of genotyping by sequencing data provide complementary resolutions of species boundaries and relationships in a clade of sexually deceptive orchids. J. Syst. Evol. 2019, 52, 133–144. [Google Scholar] [CrossRef]
  45. Knowles, L.L.; Maddison, W.P. Statistical Phylogeography. Mol. Ecol. 2002, 11, 2623–2635. [Google Scholar] [CrossRef] [PubMed]
  46. R Core Team. R: A Language and Environment for Statistical Computing; R Foundation for Statistical Computing: Vienna, Austria, 2002; Available online: https://www.R-project.org/ (accessed on 20 February 2023).
  47. Koutecký, P. MorphoTools: A set of R functions for morphometric analysis. Plant Syst. Evol. 2015, 301, 1115–1121. [Google Scholar] [CrossRef]
  48. Oksanen, J.; Blanchet, F.; Friendly, M.; Kindt, R.; Legendre, P.; McGlinn, D.; Minchin, P.R.; O’Hara, R.B.; Simpson, G.L.; Solymos, P.; et al. Vegan: Community Ecology Package. R Package Version 2.2-1. 2. 1-2. 2015. Available online: https://cran.r-project.org/web/packages/vegan/index.html (accessed on 20 February 2023).
  49. Bayona-Vásquez, N.J.; Glenn, T.C.; Kieran, T.J.; Pierson, T.W.; Hoffberg, S.L.; Scott, P.A.; Bentley, K.E.; Finger, J.W.; Louha, S.; Troendle, N.; et al. Adapterama III: Quadruple-indexed, double/triple-enzyme RADseq libraries (2RAD/3RAD). PeerJ 2019, 7, e7724. [Google Scholar] [CrossRef] [PubMed]
  50. Eaton, D.A. Pyrad: Assembly of de novo RADseq loci for phylogenetic analyses. Bioinformatics 2014, 30, 1844–1849. [Google Scholar] [CrossRef]
  51. Eaton, D.A.; Overcast, I. Ipyrad: Interactive Assembly and analysis of RADseq datasets. Bioinformatics 2020, 36, 2592–2594. [Google Scholar] [CrossRef]
  52. Yu, G. SI/HPC: Smithsonian Institution High Performance Computing Cluster. Available online: https://researchcomputing.si.edu/high-performance-computing-cluster (accessed on 20 August 2022).
  53. McCartney-Melstad, E.; Gidiş, M.; Shaffer, H.B. An empirical pipeline for choosing the optimal clustering threshold in RADseq studies. Mol. Ecol. Resour. 2019, 19, 1195–1204. [Google Scholar] [CrossRef]
  54. Hodel, R.G.; Massatti, R.; Bishop, S.G.; Knowles, L.L. Testing which axes of species differentiation underlie covariance of phylogeographic similarity among montane sedge species. Evolution 2021, 75, 349–364. [Google Scholar] [CrossRef] [PubMed]
  55. Ronquist, F.; Huelsenbeck, J.P. MrBayes 3: Bayesian phylogenetic inference under Mixed Models. Bioinformatics 2003, 19, 1572–1574. [Google Scholar] [CrossRef] [PubMed]
  56. Eaton, D.A. Toytree: A minimalist tree visualization and manipulation library for Python. Methods Ecol. Evol. 2019, 11, 187–191. [Google Scholar] [CrossRef]
  57. Pritchard, J.K.; Stephens, M.; Donnelly, P. Inference of population structure using multilocus genotype data. Genetics 2000, 155, 945–959. [Google Scholar] [CrossRef]
  58. Evanno, G.; Regnaut, S.; Goudet, J. Detecting the number of clusters of individuals using the software structure: A simulation study. Mol. Ecol. 2005, 14, 2611–2620. [Google Scholar] [CrossRef]
  59. Gao, Y.; Harris, A.J.; Li, H.; Gao, X. Hybrid speciation and introgression both underlie the genetic structures and evolutionary relationships of three morphologically distinct species of lilium (Liliaceae) forming a hybrid zone along an elevational gradient. Front. Plant Sci. 2020, 11, 576407. [Google Scholar] [CrossRef]
  60. Jakobsson, M.; Rosenberg, N.A. CLUMPP: A cluster matching and permutation program for dealing with label switching and multimodality in analysis of population structure. Bioinformatics 2007, 23, 1801–1806. [Google Scholar] [CrossRef]
  61. Anderson, E.C.; Thompson, E.A. A model-based method for identifying species hybrids using multilocus genetic data. Genetics 2002, 160, 1217–1229. [Google Scholar] [CrossRef]
  62. Gramlich, S.; Wagner, N.D.; Hörandl, E. Rad-seq reveals genetic structure of the F2-generation of natural willow hybrids (Salix L.) and a great potential for interspecific introgression. BMC Plant Biol. 2018, 6, 7645–7655. [Google Scholar] [CrossRef]
  63. Hench, K.; Helmkampf, M.; McMillan, W.O.; Puebla, O. Rapid radiation in a highly diverse marine environment. Proc. Natl. Acad. Sci. USA 2022, 119, e2020457119. [Google Scholar] [CrossRef]
  64. Lischer, H.E.; Excoffier, L. PGDSpider: An automated data conversion tool for connecting population genetics and genomics programs. Bioinformatics 2012, 28, 298–299. [Google Scholar] [CrossRef]
  65. Anderson, E.C. User’s Guide to the Program NewHybrids, Version 1.1 beta. Technical Report. Available online: http://ib.berkeley.edu/labs/slatkin/eriq/software/new_hybs_doc1_1Beta3.pdf (accessed on 7 April 2022).
  66. Wringe, B.F.; Stanley, R.R.; Jeffery, N.W.; Anderson, E.C.; Bradbury, I.R. hybriddetective: A workflow and package to facilitate the detection of hybridization using genomic data in r. Mol. Ecol. Resour. 2017, 17, e275–e284. [Google Scholar] [CrossRef] [PubMed]
  67. Yu, G. scatterpie: Scatter Pie Plot. R Package Version 0.1.8; 2022. Available online: https://cran.r-project.org/web/packages/scatterpie/index.html (accessed on 3 April 2022).
  68. Janes, J.K.; Miller, J.M.; Dupuis, J.R.; Malefant, R.M.; Gorrell, J.C.; Cullingham, C.I.; Andrew, R.L. The K = 2 conundrum. Mol Ecol. 2017, 26, 3594–3602. [Google Scholar] [CrossRef] [PubMed]
  69. Cozzolino, S.; Nardella, A.M.; Impagliazzo, S.; Widmer, A.; Lexer, C. Hybridization and conservation of Mediterranean Orchids: Should we protect the orchid hybrids or the orchid hybrid zones? Biol. Conserv. 2006, 191, 14–23. [Google Scholar] [CrossRef]
  70. Bersweden, L.; Viruel, J.; Schatz, B.; Harland, J.; Gargiulo, R.; Cowan, R.S.; Calevo, J.; Juan, A.; Clarkson, J.J.; Leitch, A.R.; et al. Microsatellites and petal morphology reveal new patterns of admixture in Orchis hybrid zones. Am. J. Bot. 2021, 108, 1388–1404. [Google Scholar] [CrossRef]
  71. Lowry, D.B.; Modliszewski, J.L.; Wright, K.M.; Wu, C.A.; Willis, J.H. The strength and genetic basis of reproductive isolating barriers in flowering plants. Proc. R. Soc. B 2008, 363, 3009–3021. [Google Scholar] [CrossRef]
  72. Scopece, G.; Croce, A.; Lexer, C.; Cozzolino, S. Components of reproductive isolation between Orchis mascula and Orchis pauciflora. Evolution 2013, 67, 2083–2093. [Google Scholar] [CrossRef]
  73. Quilodrán, C.S.; Austerlitz, F.; Currat, M.; Montoya-Burgos, J.I. Cryptic biological invasions: A general model of hybridization. Sci. Rep. 2018, 8, 2414. [Google Scholar] [CrossRef]
  74. Hübner, S.; Bercovich, N.; Todesco, M.; Mandel, J.R.; Odenheimer, J.; Ziegler, E.; Lee, J.D.; Baute, G.J.; Owens, G.L.; Grass, C.J.; et al. Sunflower pan-genome analysis shows that hybridization altered gene content and disease resistance. Nat. Plants 2019, 5, 54–62. [Google Scholar] [CrossRef]
  75. Palaz, E.B.; Demirel, F.; Adali, S.; Demirel, S.; Yilmaz, A. Genetic relationships of salep orchid species and gene flow among Serapias vomeracea × Anacamptis morio hybrids. Plant Biotechnol. Rep. 2022, 16, 1863–5466. [Google Scholar] [CrossRef]
  76. Rice, A.; Glick, L.; Abadi, S.; Einhorn, M.; Kopelman, N.M.; Salman-Minkov, A.; Mayzel, J.; Chay, O.; Mayrose, I. The Chromosome Counts Database (CCDB)—A community resource of plant chromosome numbers. New Phytol. 2015, 206, 19–26. [Google Scholar] [CrossRef] [PubMed]
  77. Hollick, P.S.; Taylor, R.J.; McComb, J.A.; Dixon, K.W. If Orchid Mycorrhizal Fungi Are So Specific, How Do Natural Hybrids Cope? Selbyana 2005, 26, 159–170. [Google Scholar] [CrossRef]
Figure 1. (a) Platanthera hybrid complex. The parent species P. blephariglottis (gray) crosses with P. cristata (red) to form P. x canbyi (pink) and with P. ciliaris (orange) to form P. x bicolor (yellow). (b) Site acronyms represent the approximate locations of ten sites across the Eastern United States. Labels for sympatric sites (PON, NJT, NAS, GSP, and SSS) are colored black, and allopatric sites (WSP, CRA, LI, BS) are colored according to the taxon that was present. Circles on the map represent the geographic localization of the taxa. We assigned sites and taxa prior to genomic sequencing.
Diversity 15 00384 g001
Figure 2. Principal Component Analysis of Platanthera taxa. PCA of SNP datasets reflected clustering of parent species based on their genomic composition.
Diversity 15 00384 g002
Figure 3. Population structure of Platanthera taxa. Every SNP is assigned a probability of belonging to ancestral populations (K = 2 or K = 3) represented by gray, red, or orange. Assignments are summarized in a single bar. Below each bar is a symbol where color represents the field assigned species name, P. blephariglottis (gray), P. ciliaris (orange), P. cristata (red), P. x canbyi (pink), and P. x bicolor (yellow), and shape represents whether one (circle) or two (triangle) parent species were present at the site.
Diversity 15 00384 g003
Figure 4. Phylogenetic relationship among Platanthera species and putative hybrids across sympatric and allopatric populations. The shapes correspond to sympatric sites where the hybrid’s parent species co-occurred (triangle), sympatric sites where orange parent species co-occurred and P. blephariglottis was observed recently (square), and allopatric sites (circle). The Bayesian posterior probabilities of all deep branches were maximally supported (100), and the external branches also maintained high branch support (Figure S5).
Diversity 15 00384 g004
Figure 5. Genotype assignment of the Platanthera hybrid complex. The bars are a cumulative probability for the different population types: pure parent 1 (gray), pure parent 2 (red for the top graph and orange for the bottom graph), F1 hybrid (pink for the top graph and yellow for the bottom), F2 hybrid (brown), backcross with parent 1 (blue), and backcross with parent 2 (purple). Below each bar is the sample identification with a color reflective of species. The allopatric sites with one parent species are BS, CRA, LI, and WSP.
Diversity 15 00384 g005
Figure 6. PCA of floral morphology for genetically-identified Platanthera species. Each sample point shows a pie chart generated based on population structure data for the individual sample or an average of the same samples in that particular site due to discordance between the samples analyzed genetically and those analyzed morphometrically. For clarity, we circled the putative hybrids (pink and yellow) and the P. blephariglottis samples that clustered with P. ciliaris morphometrically (gray).
Diversity 15 00384 g006
Disclaimer/Publisher’s Note: The statements, opinions and data contained in all publications are solely those of the individual author(s) and contributor(s) and not of MDPI and/or the editor(s). MDPI and/or the editor(s) disclaim responsibility for any injury to people or property resulting from any ideas, methods, instructions or products referred to in the content.

