Article

Alien Plant Invasions of the Natural Habitat in the Western Region of Saudi Arabia: Floristic Diversity and Vegetation Structure

by
Saud T. Alharthi
*,
Mohamed A. El-Shiekh
and
Ahmed A. Alfarhan
Department of Botany & Microbiology, College of Science, King Saud University, P.O. Box 2455, Riyadh 11451, Saudi Arabia
*
Author to whom correspondence should be addressed.
Diversity 2023, 15(3), 309; https://doi.org/10.3390/d15030309
Submission received: 13 January 2023 / Revised: 16 February 2023 / Accepted: 16 February 2023 / Published: 21 February 2023

Abstract

:
The western region of Saudi Arabia is a major vegetation diversity hotspot with wide range of habitats and variant climatic and topographical characteristics. The vegetation diversity in this region has not been fully studied to monitor the changes that happen over time in these habitats. This study aims to identify the floristic diversity and vegetation structure of the plant species in invaded habitats of the western region of Saudi Arabia. A total of 58 stands in the different invaded habitats (i.e., mountains, protected areas “ridge mountain habitat”, wadis, farmlands, ruderal areas, and coastal areas) were examined. A total of 146 plant species (94 native and 52 alien species) distributed among 132 genera and 49 families were recorded. Asteraceae, Poaceae, and Fabaceae were the most represented families and accounted for approximately 35% of the identified species. Multivariate analysis of the identified species clustered them into four main vegetation groups: VG I dominated by Opuntia ficus-indica-Juniperus phoenicea, VG II dominated by Reichardia tingitana-Heliotropium aegyptiacum, VG III dominated by Prosopis juliflora-Acacia seyal-Abutilon pannosum, and VG IV dominated by Suaeda monoica. The ecological information represented in this study may help in monitoring the changes in vegetation diversity across the western region of Saudi Arabia and designing the required conservation plans.

1. Introduction

Saudi Arabia occupies the greatest section of the Arabian Peninsula with an area of approximately 2,250,000 km2 located between longitudes 34°40′ E–55°45′ E and latitudes 15°45′ N–34°35′ N [1] and mostly covered by dry deserts. However, the diversity of topographical and climatic characteristics across Saudi Arabia leads to significant vegetation diversity between the different regions of the country. Several studies examined the flora of Saudi Arabia and identified 837 genera represented by 2250 plant species, 246 of which are endemic species and 20% are classified as rare due to afforestation, grazing, and habitat loss [2,3,4,5]. The most dominant life form in Saudi Arabia is the annual plants. In general, plant coverage in Saudi Arabia is scarce in relation to the large area of the country. Furthermore, the Saudi Arabian flora is represented by different geological areas e.g., the western Africa, the southeastern and northeastern Asia, and the northern and northwestern Mediterranean regions. Nevertheless, the majority of plant species in Saudi Arabia belongs to a mixture of different climatic conditions including Saharo-Arabian or Saharo-Sindian, Sindian, and Mediterranean regions [6,7] or mainly to the Saharo-Sindian phytogeographical region [8].
As one of the biodiversity hotspots in Saudi Arabia, the western region, is characterized by diverse habitats and is among the richest regions of biodiversity in the Arabian Peninsula. A large number of endemic, rare, threatened, and endangered plant species can be found in this region [6,9,10,11]. Because biodiversity hotspots play significant roles in both national and international conservation strategic plans [12], several previous studies examined the biodiversity of the western region of Saudi Arabia. The vegetation of Wadi Al-Sharaea, Makkah, Saudi Arabia, (with a total area of 638.98 km2) as a biodiversity hotspot for desert ecosystem was examined and 110 species belonging to 77 genera and 33 families were identified [13]. Similarly, 100 plant species distributed among 34 families were identified in Wadi Fatimah, Makkah, Saudi Arabia with an area of roughly 4.86 km2 [14]. About 126 species belonging to 39 plant families were identified in Wadi Al-Noman, Makkah, Saudi Arabia, an area covering 740.1 km2 [15]. A total of 224 species representing 124 genera and 62 families were recorded along the altitudinal vegetation zones of Asir Mountain, southwest Saudi Arabia in a study area covering 12,000 km2 [16]. Another study in Asir Mountain identified 189 species belonging to 74 families [17]. Along the altitudinal gradient of Al Baha region, western Saudi Arabia, 190 plant species belonging to 59 families were identified [6]. In the Hijaz mountains, western Saudi Arabia, 106 vascular plant species belonging to 35 families were identified [18]. In an area covering a distance of roughly 1174 km along the Hijaz mountains in the northwestern coastal land of the Red Sea in Saudi Arabia, 142 plant species from 41 families were recorded [19].
Nevertheless, the majority of these studies are old and do not cover the whole region. Moreover, a significant change in the biodiversity of this region was reported using remote sensing data indicating significant loss in biodiversity of a course of 10 years [19]. Therefore, we designed the current study in order to identify the floristic diversity and vegetation structure of the plant species in the western region of Saudi Arabia after invaded by alien species in the last years.

2. Materials and Methods
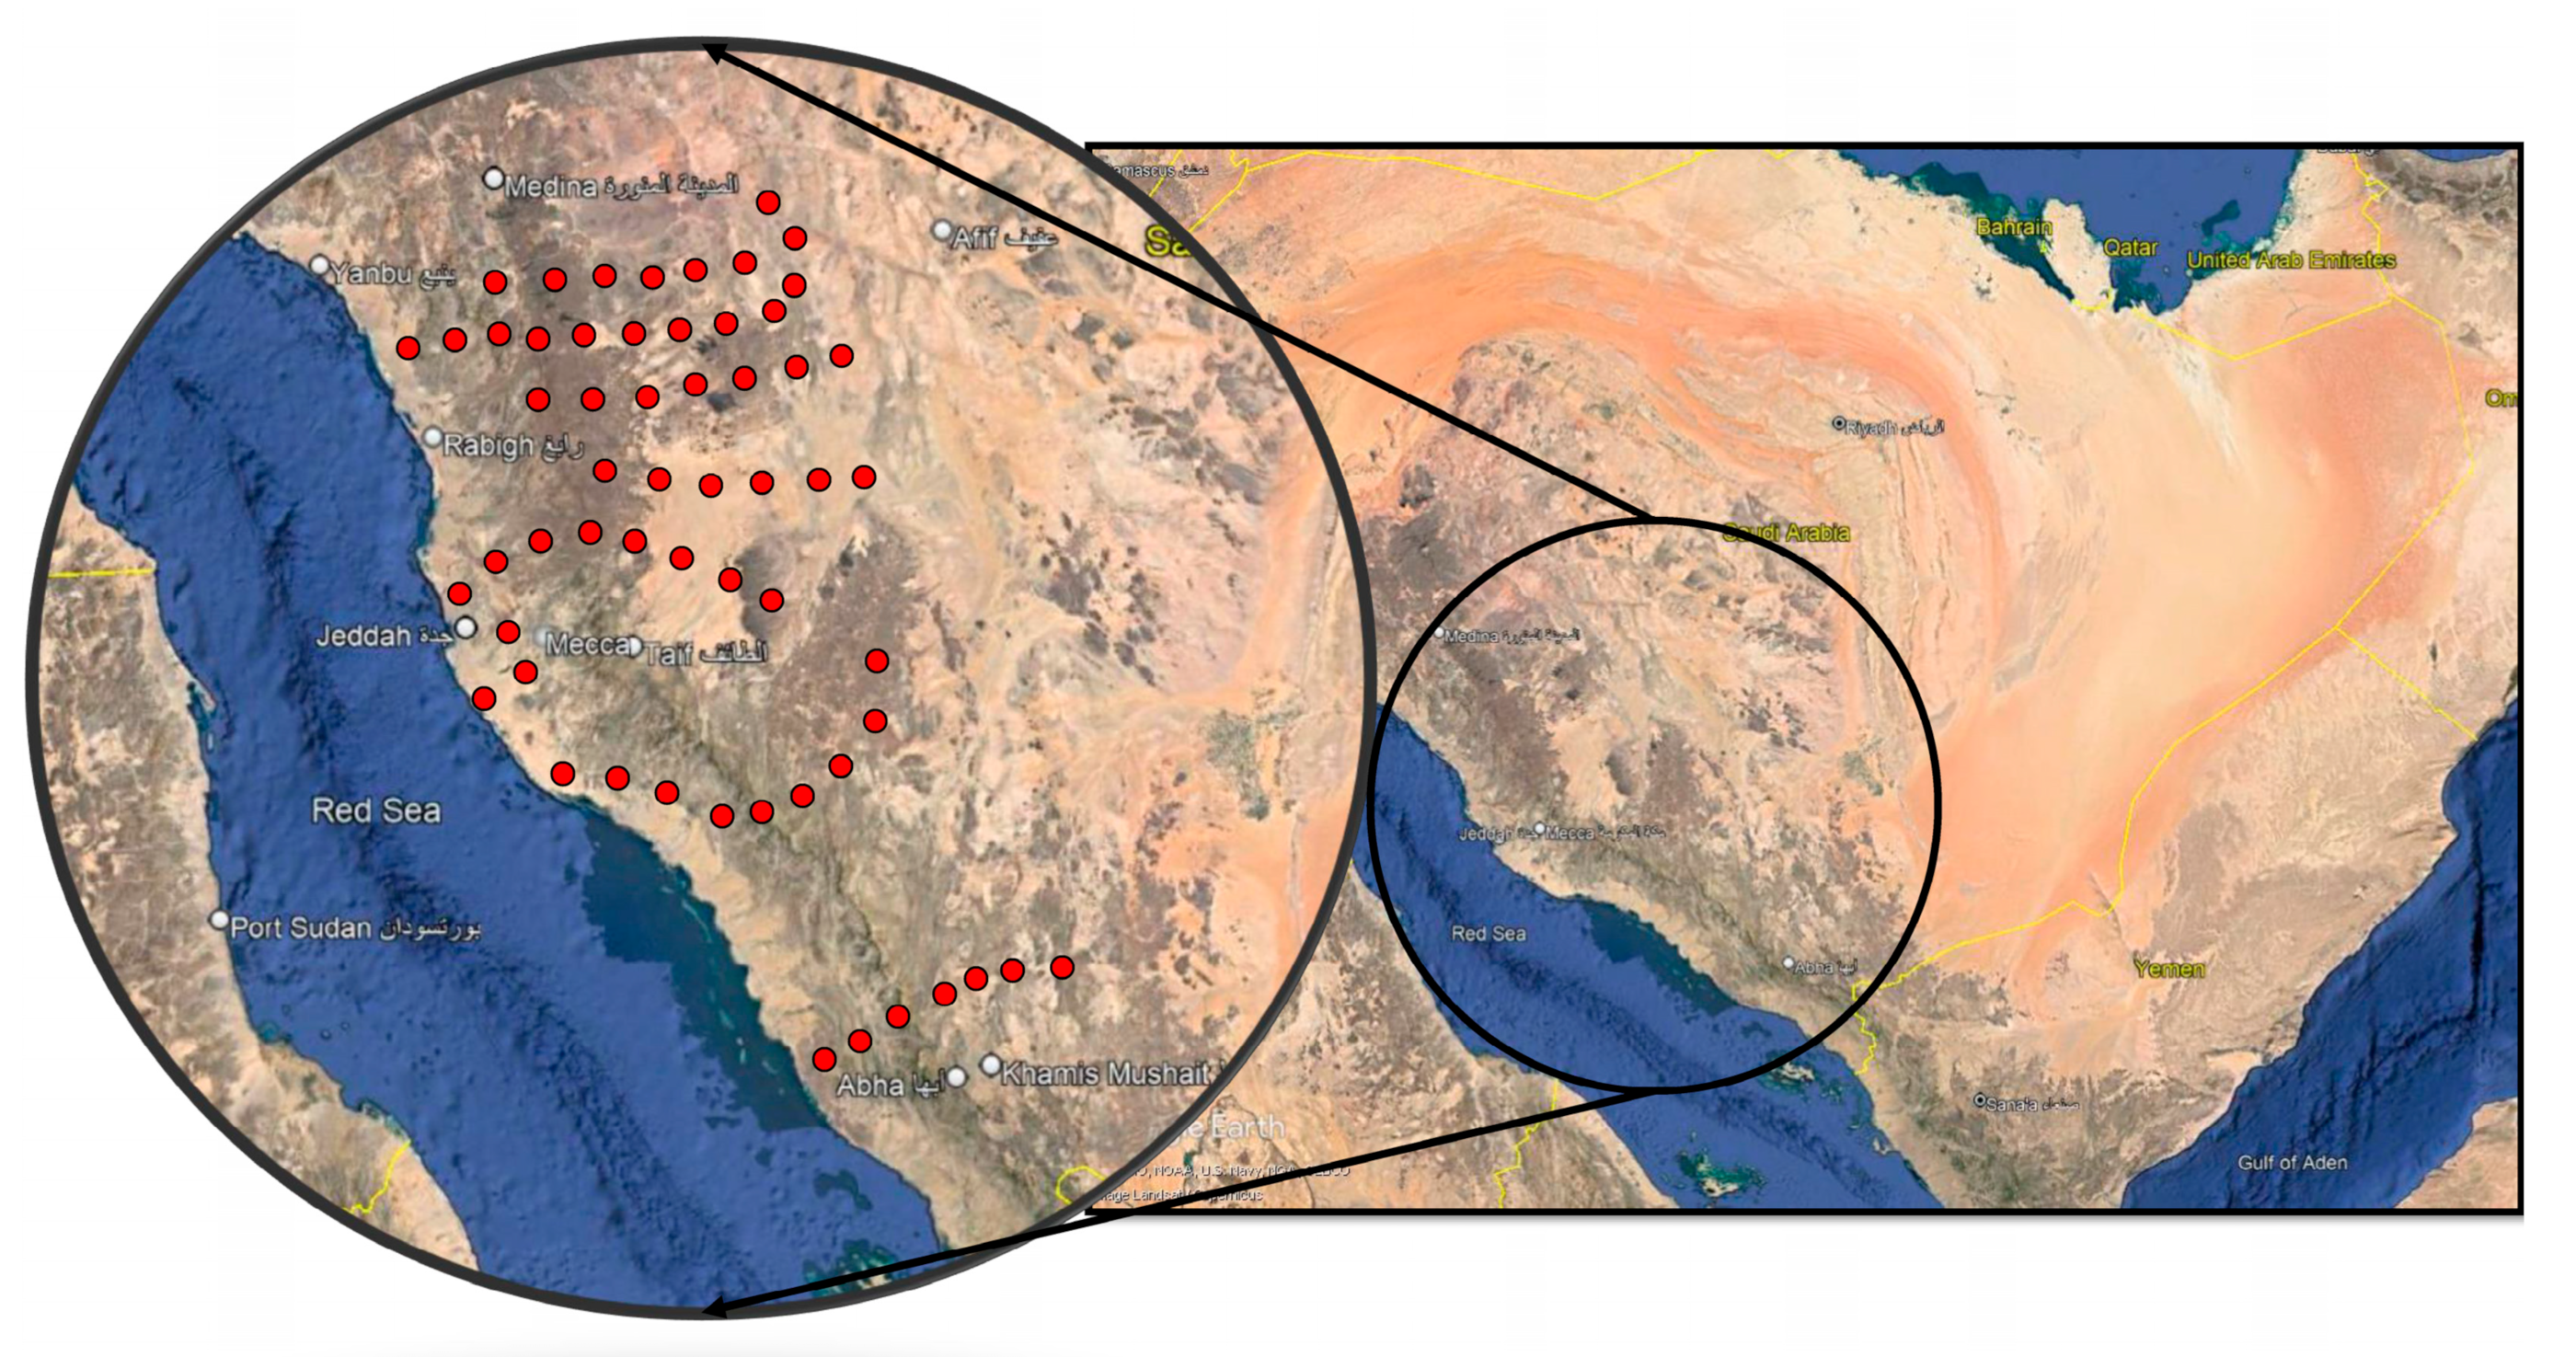
2.1. Study Area

The current study examines the vegetation structure and floristic diversity of the western region of Saudi Arabia as one of the biodiversity hotspots in the country. The study area extends along the coastal region of the Red Sea from the north (Rabigh; 22.79067, 39.01896) to the south (Jeddah; 21.28541, 39.23755). Moreover, the area from Al Figrah mountains in the north (24.37895, 38.97724; 2100 m above sea level “a.s.l.”) to Raidah Sanctuary in the south (18.2387, 42.54429; 1900 m a.s.l.) is also examined. Therefore, the study area includes the Tihama plain and Al Sarawat Mountains with different habitats (i.e., mountains, protected areas “ridge mountain habitat,” wadis, farmlands, ruderal areas, and coastal areas) as shown in the map depicted in Figure 1. A total of 58 stands in the different habitats along the western region of Saudi Arabia were examined.
Overall, the study area is divided into two main sections: the western mountains and the coastal plain of the Red Sea. The western mountains include the Hijaz mountains with an average altitude of 1200 m a.s.l., the Midian mountains with altitudes exceeding 2000–2500 m a.s.l., and the Al Sarawat mountains with altitudes ranging from 800 to 3015 m a.s.l. The coastal plain of the Red Sea, known as Tihama plain, is composed mainly of sand dunes and gravel plains. According to the Saudi Geological Survey, the geological formation of the coastal plain in the western region is composed of sedimentary rocks and surface sediments dated back to the late Middle and New Ages (the third and fourth ages). These sediments’ thickness reaches about 5000 m in the coastal plain of the Red Sea. On the other hand, the rocks of the highlands date back to the pre-Cambrian period and are formed from igneous rocks (e.g., granite and basalt) and metamorphic rocks (e.g., gneiss and schist). These rocks are characterized by their hardness and resistance to erosion factors. The valleys are also covered with sedimentary rocks that formed in them later. There are also some sand dunes and salt marshes, interspersed with a few short valleys that slop from the western mountains towards the Red Sea.

2.2. Climatic Characteristics

The climatic characteristics of the western region of Saudi Arabia can be divided into three main categories based on the variation in altitudes above sea levels, the geographical location, and the desertic effects as follows: (i) mountain regions characterized by significant variation in temperatures and rainfall rates in summer and winter seasons, (ii) plain regions with high temperatures in summer and low temperatures in winter due to low altitudes, and (iii) the eastern regions with approximate average altitudes of 800 m a.s.l., leading to low temperatures in winter and high temperatures in summer.
Climatic data regarding temperatures, precipitation, relative humidity, and wind speed were collected from five different regions (i.e., Abha, Madinah, Makkah, Tabuk, and Yanbu) to represent the study area. The data were collected for a period of 29 years from 1989 to 2017. The data showed significant variation as the average monthly temperatures across the five regions ranged from 11 to 37.7 °C (Supplementary Figure S1a). The Makkah region showed the highest average temperatures while Tabuk and Yanbu showed the lowest. Precipitation showed variation among the five regions in terms of annual precipitation and months of precipitation (Supplementary Figure S1b). In general, the annual precipitation ranged from 17.7 mm in Abha to 2.6 mm in Tabuk. Makkah, Madinah, and Tabuk regions received an average annual precipitation of 8.6, 4.9, and 2.9 mm, respectively. Therefore, some regions were characterized by high relative humidity e.g., Abha and Yanbu, while others had exceptionally low humidity levels e.g., Makkah (Supplementary Figure S1c). Wind speed was relatively similar among the study area except in Makkah region where it was lower than the other regions (Supplementary Figure S1d). This evident variation in geographical and climatic characteristics leads to significant enrichment of vegetation diversity in the western region of Saudi Arabia. Nevertheless, the whole study area is characterized by a dry climate as shown in the climate diagrams (Supplementary Figure S2).

2.3. Sampling Stands

After survey field trips, 58 stands were selected to represent the different habitats found in the study area i.e., mountains, protected areas, wadis, coastal areas, farmlands, and ruderal areas, and to perform the analysis of the vegetation structure. The area of each stand was roughly 50 × 50 m, and the coordinates of these stands were recorded and shown on the map in Figure 1. Plant samples and data collection were performed in the spring of 2018. The species collected from each stand were identified and listed, their families, life forms, and chorotypes were also classified [3,4,5,20]. Samples of the collected species were deposited in the King Saud University Herbarium (KSUP).

2.4. Vegetation Cover and Density Estimation

The plant coverage of each identified species was calculated using the abundance percentage method [21]. Furthermore, the density of each identified species was estimated using the quadrat method [22]. In summary, 5 quadrates were applied in each sampling stand and the number of individuals of each species in each quadrat was counted. The relative densities and frequencies of the species was calculated using the following equations:
Realtive   density   of   a   species   m 2 = No .   of   individuals No .   of   quadrats   × quadrat   area   m 2 × 100 ,
Vegetation   density   ha 1 = Relative   density   of   the   species   × 100 ,
Realtive   frequency   of   a   species = No .   of   quadrats   including   this   species No .   of   quadrates   used   × 100 ,

2.5. Diversity Indices

Vegetation diversity indices were calculated [23,24,25]. In brief, α-diversity represents the species richness and was calculated using the following equation:
D = S log A ,
where (D) is the species richness, (S) is the number of species, and (A) is the sampling area.
Shannon-Wiener index represents the species relative evenness and was calculated using the following equation:
H ^ = i = 1 s p i log p i ,
where (s) is the number of species and (pi) is the relative coverage value of the ith species.
Based on Shannon-Wiener index, species evenness was calculated as follows:
J = H ^ H ^ max ,
where ( H ^ ) is the Shannon diversity index and ( H ^ max ) is the maximum possible value of H ^ (if every species was equally likely).
Simpson index represents the relative concentration of dominance and was calculated using the following equation:
C = i = 1 s p i 2 ,
where (s) is the number of species and (pi) is the relative coverage value of the ith species.

2.6. Soil Analysis

Three different soil samples were collected from each stand at a depth of 20 cm and then pooled together. Soil was air-dried for 24 h and then ground and kept for further analysis. Soil pH and electrical conductivity (EC) were measured immediately after collection of the samples. Soil texture was examined using Bouyoucos hydrometer [26] to identify the percentages of sand, silt, and clay in each sample. Organic matter (OM) content in each sample was measured by the loss-on-ignition method [26]. N and P contents were determined using atomic absorption spectroscopy, while Inductively Coupled Plasma Mass Spectrometry (NexIONTM 300D ICP-MS, PerkinElmer, Inc., Waltham, MA, USA) was used to determine contents of K, Mg, Ca, Fe, Na, and Mn [26].

2.7. Statistical Analysis

The data regarding the 58 sampling stands, species coverage values for the identified species and soil variables were utilized to create the matrix of species coverage data for further analysis. In details, the TWINSPAN numerical classification analysis using two-way indicator species was applied [27]. The DECORANA ordination software was applied on the same stands to confirm the classification of the vegetation groups resulted from TWINSPAN [28]. The correlation between the soil variables and distribution of the identified plant species in the study area was examined via the canonical correspondence analysis (CCA) on the CANOCO software [29]. The variance among diversity indices and soil parameters across different studied habitats was examined via one-way analysis of variance (ANOVA) on IBM SPSS Statistics 20 (IBM Corp., Armonk, NY, USA). Duncan’s multiple range test (p ≤ 0.05) was applied to compare means. Pearson’s correlation analysis was applied to examine the ordination axes on one hand and soil variables on the other hand. The same analysis was used to examine the correlations between species diversity indices and soil variables.

3. Results

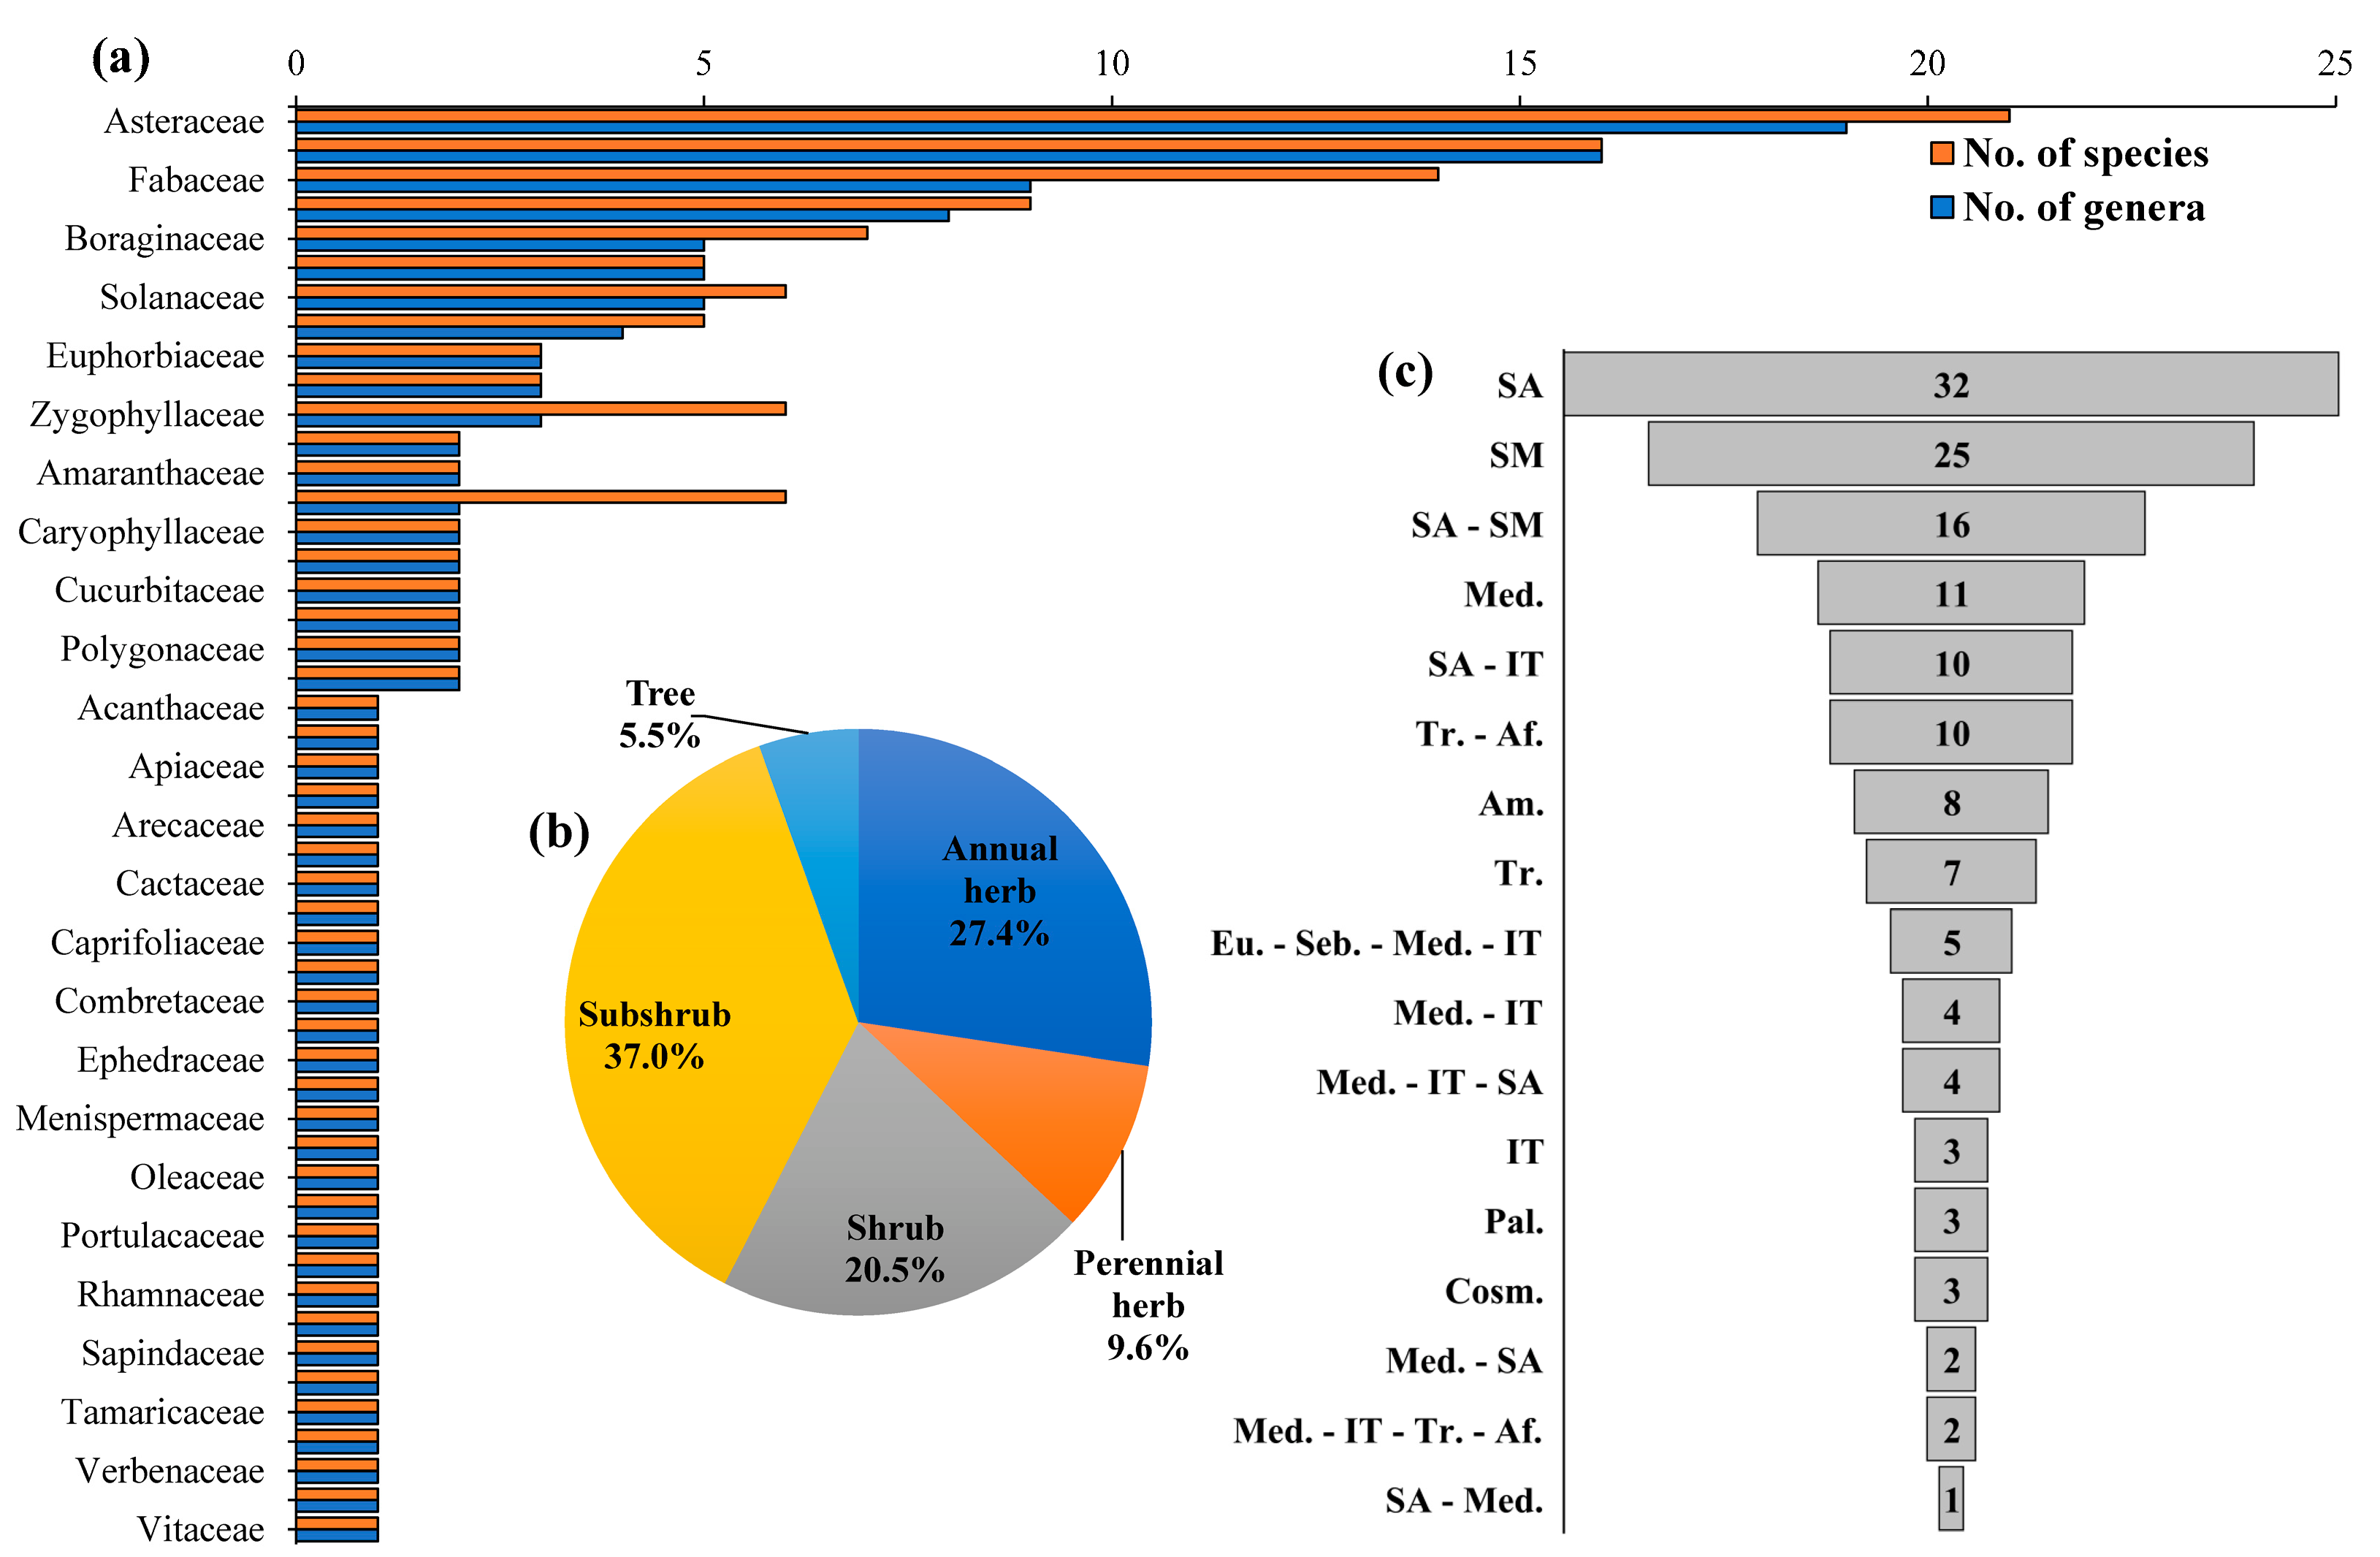
3.1. Floristic Diversity and Phytogeography

Surveying the selected sampling stands in the western region of Saudi Arabia led to identification of 146 plant species (94 native and 52 alien) representing 132 genera and distributing among 49 families. A list of the identified species, families, and life forms is provided (Supplementary Table S1). Asteraceae was the commonest family with 19 genera represented by 21 species (14.4% of the identified species), followed by Poaceae with 16 species (11% of the identified species). The majority of the identified families (28 families representing 57.1% of all families) were represented by one species only e.g., Acanthaceae, Oleaceae, and Verbenaceae (Figure 2a). Subshrubs and annual herbs were the most represented life forms in the study area with 36.9 and 27.4% of the identified species, respectively (Figure 2b). Trees represented only 5.4% of the species identified in the study area with only 8 different species e.g., Commiphora myrrah, Olea europaea, and Prosopis juliflora.
As the study area is located in the Saharo-Arabian region, the majority of the identified species belonged to this category; 32 species representing 21.9% of all recorded species (Figure 2c). The Somali-Masai region was represented by 25 species (17.1%). These two regions also formed the highest represented bi-regional category (the Saharo-Arabian Somali-Masai) with 16 species (11%). The highest represented pluri-regional category was the European Siberian Mediterranean Irano-Turanian with 5 species (3.4%).

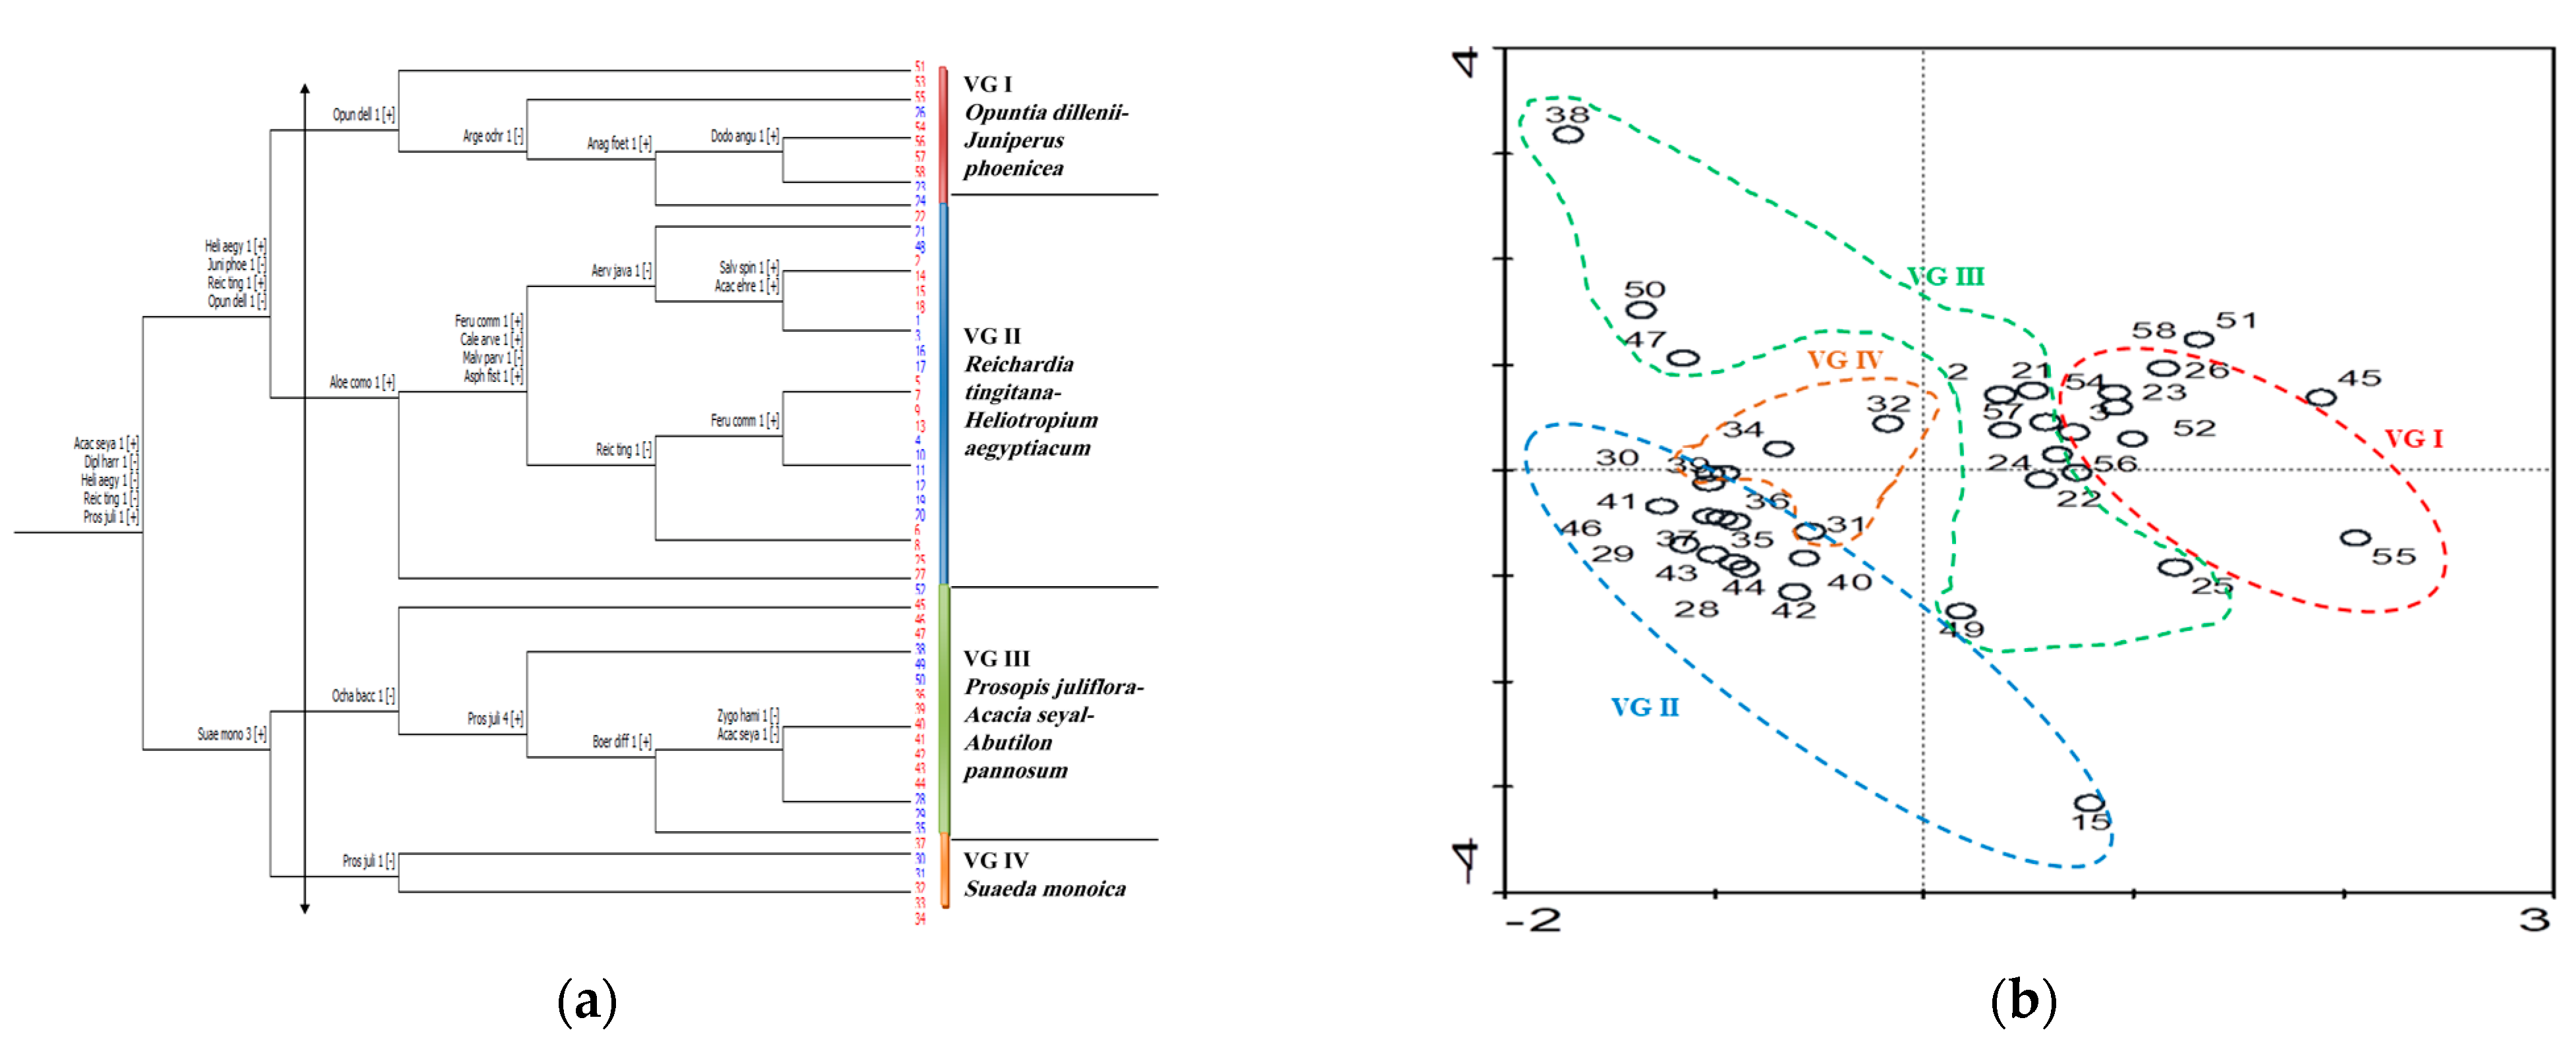
3.2. Vegetation Structure

A total of 146 species were identified in the selected sampling stands. The multivariate analysis of these species showed that the entire vegetation of the study area could be divided into four vegetation groups at the second level of TWINSPAN (Figure 3). Some groups were located in one specific habitat while others were abundant in two or more different habitats. These vegetation groups were numbered and named based on the first and the second (if present) dominant species as follows: VG I: Opuntia ficus-indica-Juniperus phoenicea, VG II: Reichardia tingitana-Heliotropium aegyptiacum, VG III: Prosopis juliflora-Acacia seyal-Abutilon pannosum, and VG IV: Suaeda monoica. The average frequency and relative coverage values for each species in each vegetation group is shown in the synoptic table resulted from the application of TWINSPAN analysis (Supplementary Table S2).
VG I (Opuntia ficus-indica-Juniperus phoenicea): This group included 11 sampling stands representing 18.9% of all the stands. It was only found in mountain habitats (Table 1). The most dominant plant in this group was Opuntia ficus-indica with 90% coverage and 67% frequency, followed by Juniperus phoenicea with 30% coverage and 67% frequency percentages. Other accompanying species were also found in this group e.g., Acacia etbaica and Pentas lanceolata.
VG II (Reichardia tingitana-Heliotropium aegyptiacum): With 25 sampling stands, this vegetation group is the highest represented group among all the identified groups and accounts for 43.1% of the whole study area. The species of this group inhabit mountains (40%), farmlands (24%), wadis (28%), and ruderal areas (8%). With 10% coverage and 63% frequency, Reichardia tingitana was the most dominant species in this association followed by Heliotropium aegyptiacum (coverage = 5%, frequency = 58%). Other species found in this association included Diplotaxis harra, Calendula arvensis, and Salvia spinosa.
VG III (Prosopis juliflora-Acacia seyal-Abutilon pannosum): Eleven stands were included in this association which represent 29.3% of the study area. The dominant species in this association were Prosopis juliflora (coverage = 85%, frequency = 67%), Acacia seyal (coverage = 30%, frequency = 47%), and Abutilon pannosum (coverage = 20%, frequency = 35%). Other species classified in this group included Calotropis procera, Cynodon dactylon, Marrubium vulgare, Rhazya stricta, and Zygophyllum simplex. The species of this association mainly inhibit wadis (64.7%), farmlands (17.7%), coastal areas (11.8%), and protected areas (5.9%).
VG IV (Suaeda monoica): This group represents 8.6% (5 sampling stands) of the study area and inhabits only wadi habitats. The most dominant plant species in this association was Suaeda monoica with 43% coverage and 80% frequency, followed by Acacia ehrenbergiana with 10% coverage and 60% frequency. Other species in this association included Dodonaea angustifolia, Zygophyllum hamiense, Convolvulus arvensis, and Aizzon canariense.

3.3. Correaltion Analyses

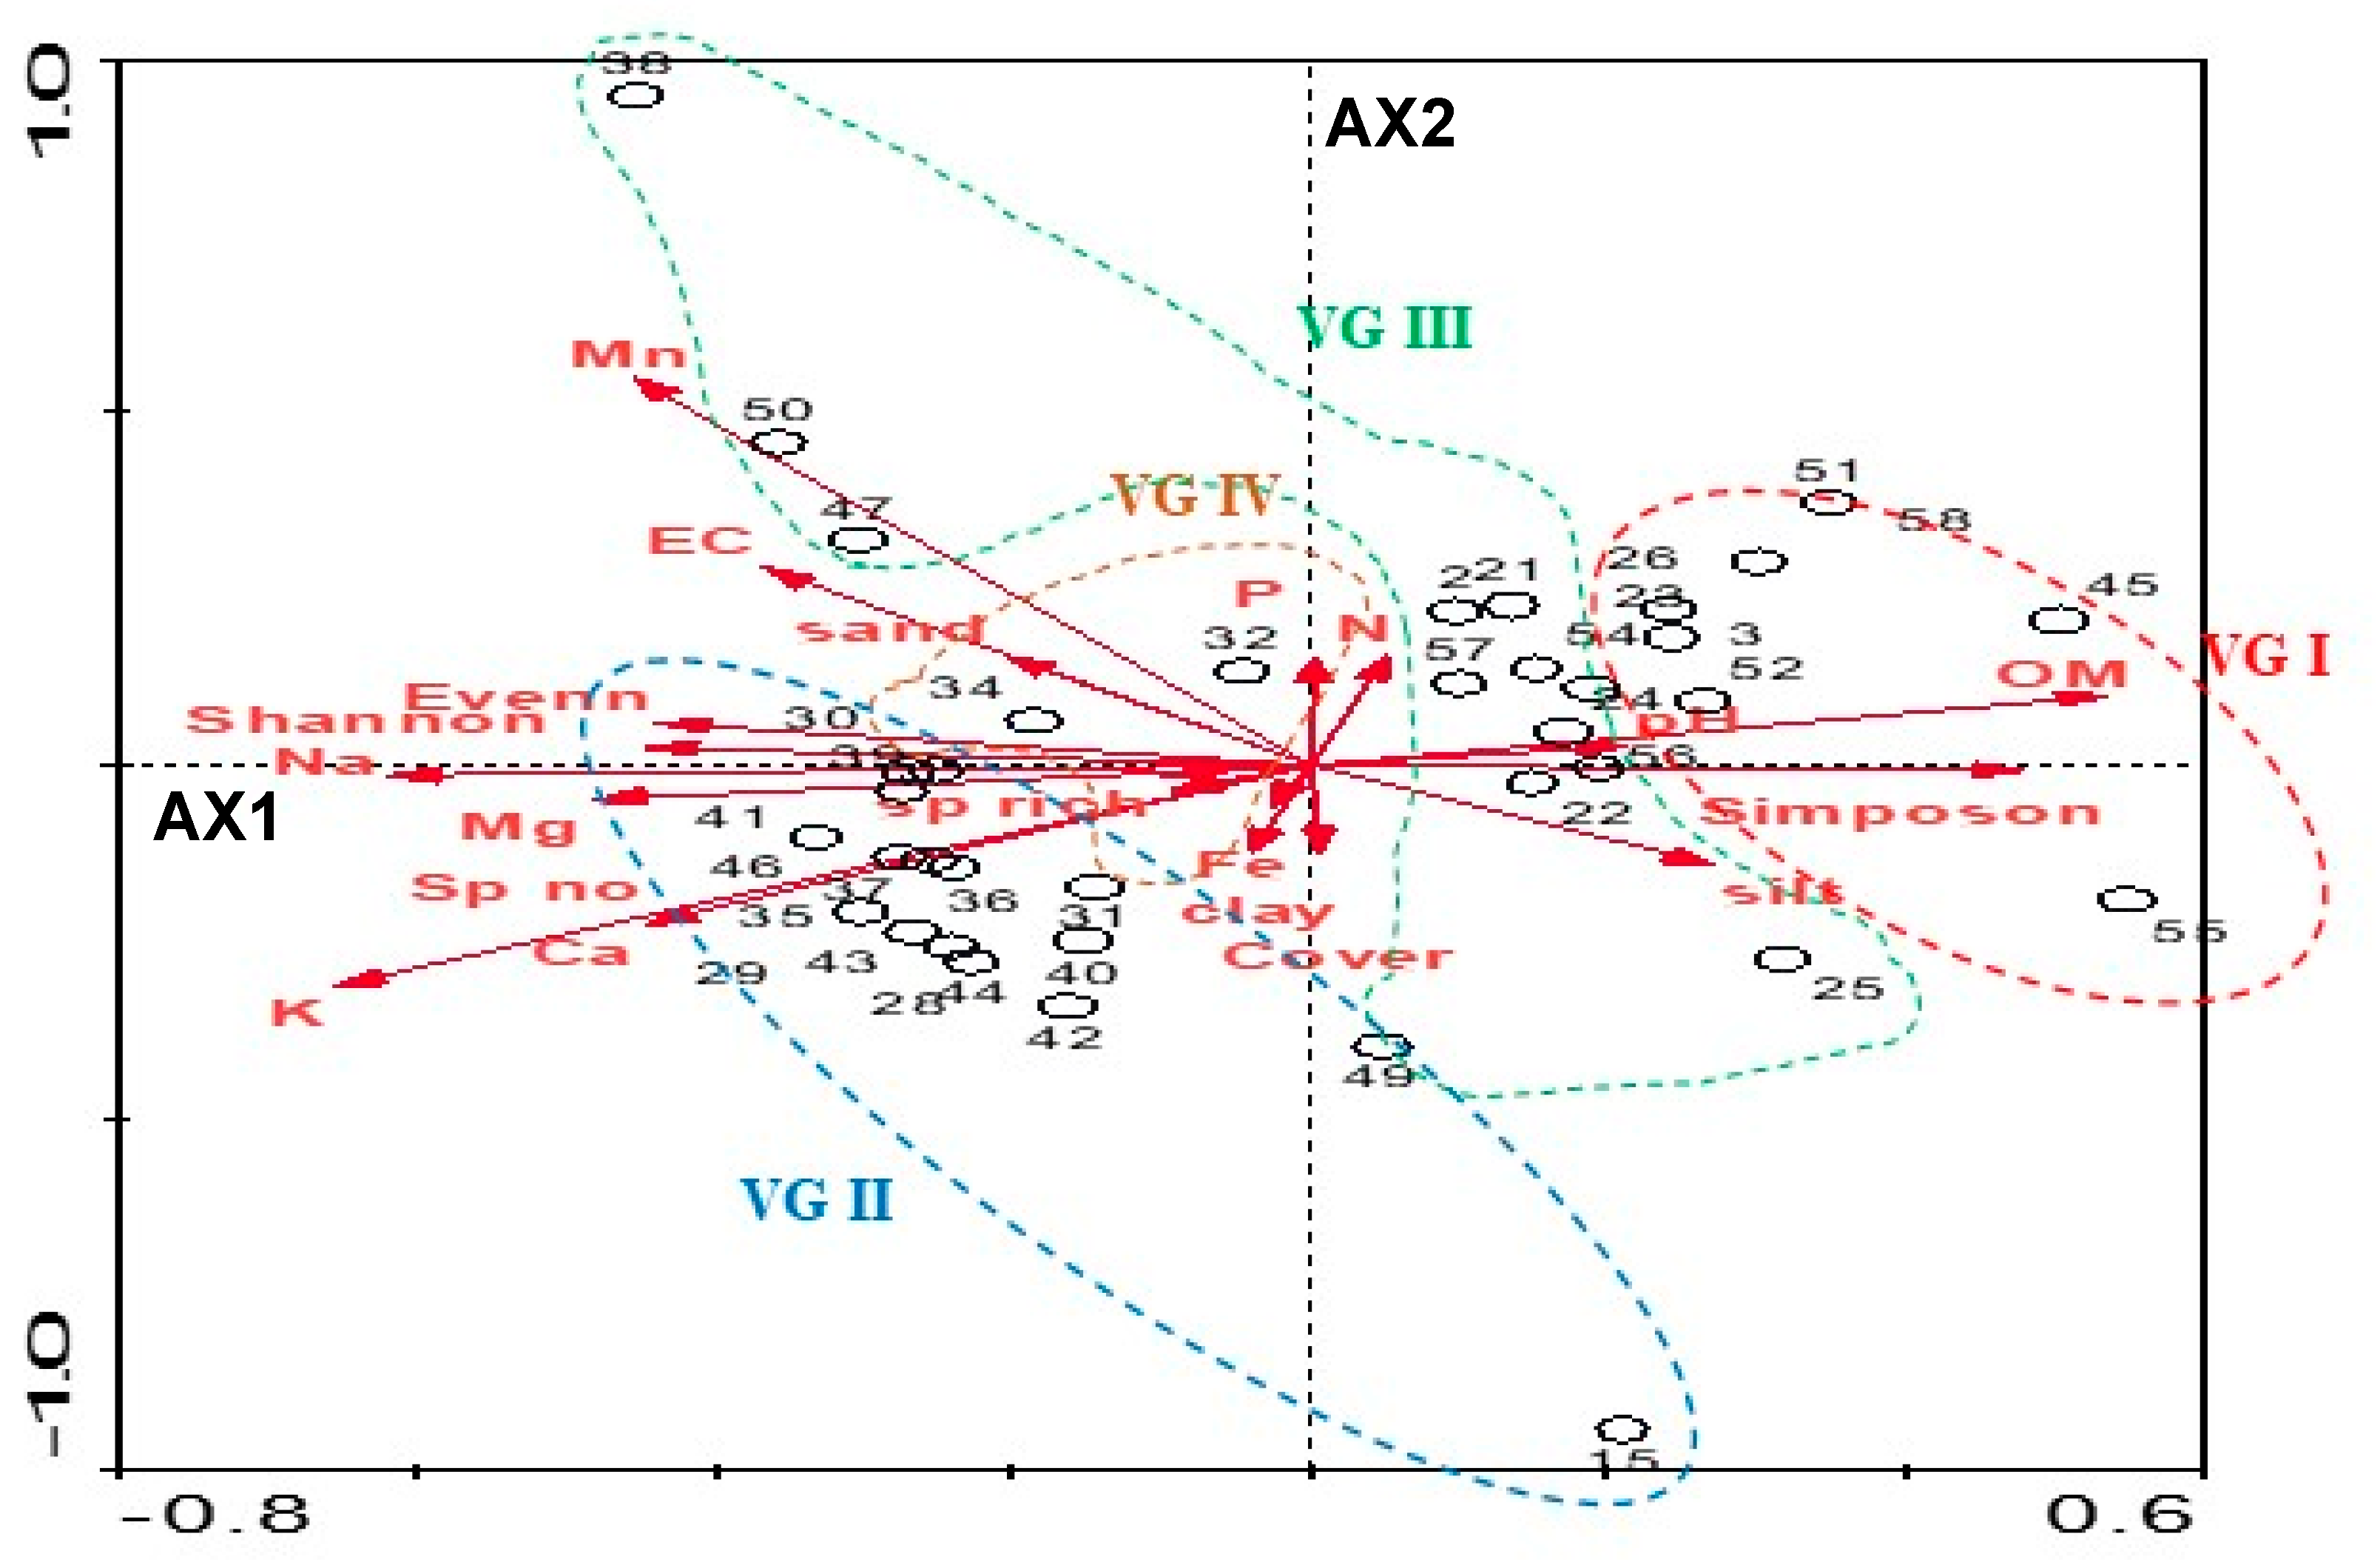
3.3.1. Relationships between Soil Variables and Distribution of Sampling Stands

The results of the correlation analysis between soil variables and the distribution of the sampling stands indicate the strong relationship between them (Figure 4). Simpson index (r = 0.47) and OM content (r = 0.52) in the soil showed a strong positive correlation with the first axis (Table 2). On the other hand, species evenness (r = −0.43), Shannon-Wiener index (r = −0.44), EC (r = −0.40), and the contents of K (r = −0.60), Mg (r = −0.50), Ca (r = −0.44), Na (r = −0.61), and Mn (r = −0.44) had negative correlations with the first axis. Nevertheless, the second axis showed a positive correlation with Mn content in the soil (r = 0.51) and no negative correlations with any soil variable.

3.3.2. Relationships between Diversity Indices and Soil Variables

The obtained results indicated the number of species was positively correlated with the content of silt in the soil (r = 0.30), while it was negatively correlated (r = −0.3) with the content of sand (Table 3). Furthermore, plant coverage showed a negative correlation with Mn content in the soil (r = 0.30) and a positive correlation with soil pH (r = −0.4), OM (r = −0.33), and Fe (r = −0.34) contents. Similarly, species richness showed a negative correlation with sand content in the soil (r = −0.35) and positive correlations with contents of OM (r = 0.33) and silt (r = 0.40) in the soil. Species evenness showed positive correlation with soil pH and OM and clay contents with the same correlation coefficient (r = 0.30) and with content of Fe (r = 0.31) in the soil, but a negative correlation with Mn (r = −0.40) content in the soil. Moreover, Shannon-Wiener index showed positive correlations with contents of silt (r = 0.34), OM (r = 0.40), and Fe (r = 0.30) and negative correlations with contents of sand (r = −0.34) and Mn (r = −0.32) in the soil. Conversely, Simpson index showed negative correlations with contents of clay, silt, OM, and Fe with the same coefficient (r = −0.30) in the soil but positive correlations with contents of sand (r = 0.30) and Mn (r = 0.40).

3.4. Soil-Plant Association Characteristics

One-way ANOVA showed all the studied variables have significant variations among the four vegetation groups except the soil contents of clay, N, P, and Na (Table 4). VG I (Opuntia ficus-indica-Juniperus phoenicea) found only in mountain habitats had the highest Simpson index (0.6); but, the lowest values of species evenness (0.5), Shannon-Wiener index (0.4), and the soil contents of clay (10.5%), and K (2.7 mg g−1). VG II (Reichardia tingitana-Heliotropium aegyptiacum), also mainly inhabiting mountain habitats, showed the highest number of species (9.8), species richness (2.7%), species evenness (0.84), and Shannon-Wiener index (0.8), in addition to the highest contents of silt (24.7%), OM (8.7%), and Fe (0.7 ppm) in the soil. Nevertheless, this group showed the lowest plant coverage (32.8%), Simpson index (0.2), and soil contents of sand (62.1%) and Mn (0.01 ppm). The third vegetation group is dominated by Prosopis juliflora-Acacia seyal-Abutilon pannosum, inhabiting mainly wadis, had the highest plant coverage (94.2%), soil EC (1.3 mmohs cm3) and contents of K (7.84 mg g−1), Mg (5.5 ppm), and Mn (0.07 ppm). Nevertheless, it showed the lowest soil pH (7.5) and Fe content (0.1 ppm). Similarly, VG IV, dominated by Suaeda monoica and found only in wadi habitats, had the highest pH (7.9) and sand content (80.5%) in the soil. On the other hand, the lowest number of species (4.4), species richness (0.9%), and soil EC (0.1 mmohs cm−3) was found in this vegetation group. In addition, VG III showed the lowest contents of OM (2.1%), Ca (9.3 ppm), and Mg (2.5 ppm) in the soil.

4. Discussion

In the current study, 146 plant species (94 native and 52 alien) and 49 families were identified. The most dominant families were Asteraceae, Poaceae, and Fabaceae. These families are also the most represented plant families in the flora of Saudi Arabia in the same order [20,30]. Our results showed that the plant families represented by only one plant species were the dominant plant families in the study area indicating that the majority of the identified plant species are xerophytic species adapted to the harsh environments of the study area. The same finding was indicated in previous studies [31,32,33,34,35].
The flora of Saudi Arabia contains more than 2250 different species, 20% of them are considered as rare plants because of habitat destruction and deforestation [20]. Furthermore, the vegetation of Saudi Arabia is generally scarce due to the abundance of desert habitats characterized by low vegetation densities. More than 60% of the flora of Saudi Arabia are annual species significantly influenced by the amount of rain; however, the western region of Saudi Arabia has the highest vegetation diversity among all other regions [6,15,36]. The western region of Saudi Arabia is located mainly in the hyper-arid zone including xeromorphic and psammophilous herbs and shrubs. Moreover, variations in topography and climatic characteristics significantly affect the existence and distribution of various plant species and life forms [37,38,39]. Our results indicated that the study area shows significant variation in climatic characteristics, the dry weather being dominant in the whole area (Supplementary Figure S2). The most dominant life form in the western region of Saudi Arabia are small shrubs, followed by annual herbs. The availability of water during the rainy months supports the growth of annual herbs in these habitats [40]. However, such water could not be adequate to support the growth of subshrubs, therefore, their existence might be due to their ability to tolerate the dry weather and grow in harsh habitats e.g., mountains and ruderal areas [41]. Overall, the composition of the life forms in the study area follows the typical pattern desert flora dominated by chamaephytes and xerophytes. The same pattern is also recognizable in different desert habitats in various parts of Saudi Arabia [3,4,5,20,37,38,42,43].
Unsurprisingly, the majority (21.9%) of the identified plant species in the study area belonged to the Saharo-Arabian region. This is clearly attributed to the location of the study area in this region. According to Takhtadzhian [44], the majority of Saudi Arabian region are located within the ranges of the Saharo-Arabian and/or African regions. The southwestern region of the study area is clearly affected by the Somali-Masai region that was the second highest represented region by the identified species.
Our previous study [45] identified 52 alien plant species in the western region of Saudi Arabia. The presence of these species in the studied area showed negative correlation with the presence of native species indicating the harmful effects of alien species on biodiversity. Moreover, several alien species e.g., A. mexicana, N. glauca, O. ficus-indica, and P. juliflora were classified as dangerous invasive alien species in Saudi Arabia [46].
In the current study, four vegetation groups are identified. These groups consist of different plant shrubs and tufted grasses. Moreover, the nature and distribution of these groups are significantly related to the topography and soil physical characteristics in the study area. The VG I (Opuntia ficus-indica-Juniperus phoenicea) inhabits and dominates mountains in the study area. Opuntia ficus-indica is among the most abundant alien species in the western region of Saudi Arabia, the members of this genus could be found at elevations from 800 to 2200 m [45,46]. Similarly, Juniperus is known to grow at high altitudes [47,48] to form forests along the mountains. This explains the association between these two species in VG I. The distribution of this group positively correlated with the Simpson index and the content of silt and OM in the soil. The species in this group exhibit higher dominance as compared to other species in other groups which could be attributed to the lower ability of other species to adapt in the harsh mountain habitats as compared to Opuntia and Juniperus.
The VG II (Reichardia tingitana-Heliotropium aegyptiacum), on the other hand, is distributed in four different habitats i.e., farmlands, mountains, wadis, and ruderal areas. The species of this group are mainly annual and perennial herbs and subshrubs, which would partially explain the wide distribution of this group in the study area. The distribution of these species in the study area is widely affected by climate changes as the life cycle of annual species varies depending upon favorable conditions. If the area receives a sufficient amount of rain in a season, the density and abundance of herbaceous flora are significantly high and vice versa. Furthermore, the growth of these plants varies from retarded to normal heights based on the amount of precipitation [49,50]. The distribution of this vegetation group negatively correlated with the soil content of different minerals e.g., K, Ca, Mg, and Na. This group also shows the highest number of identified species but the lowest species coverage. This can be explained by the high competition between different plant species and the lower availability of minerals in the soil.
VG III is dominated by three species i.e., Prosopis juliflora, Acacia seyal, and Abutilon pannosum. This group is similar to the group identified in the study performed in 2016 on the invasive plants in Saudi Arabia [46]. Prosopis juliflora is classified among the most threating invasive species in Saudi Arabia. As a part of one of the Ministry of Agriculture’s afforestation programs, Prosopis juliflora was introduced to Saudi Arabia; however, it continues to spread in natural habitats. Efforts are recently made to remove this plant from the urban areas [45]. The species of this group inhibited and were more abundant in wadis. Upon growing in wadi habitats, Prosopis juliflora trees change their growth habit from erect trees into a prostrate shrub extending their shoot parts and covering the soil surface and therefore blocking the pathways [45]. This phenomenon could explain the higher plant coverage values characterized this group in the current study. The distribution of the species belonging to this group positively correlated with higher EC values and contents of N and P in the soil, but negatively with the soil pH.
The VG IV (Suaeda monoica) are found only in wadi habitats with the lowest species number, richness, and evenness. This can be explained by the poor soils that is found in the stands of this group with the highest sand content, in addition to the lowest content of OM, Ca, and Mg with lower contents of other minerals. Therefore, this habitat supports the growth of a few adapted psammophytic, phytogenic populations of sand binding plants with the highest concentration of their dominance, and plays a major role in decreasing species diversity [40,50,51].

5. Conclusions

In the current study, the floristic diversity and vegetation structure of the western region of Saudi Arabia is investigated. Our results indicate that the study area is rich in vegetation diversity. The floristic diversity of the western region of Saudi Arabia is representative to the whole country as the distribution patterns of families, life forms, and chorotypes of the identified species are similar to those known to be dominant in Saudi Arabia. The identified plant species are classified into four vegetation groups with relation to variation in topographical and climatic characteristics of the study area. The limitation of the current study is mainly the large study area needed a lot of field trips to identify the present plant species. Nevertheless, the current study generates an ecological database to significantly help in designing the required conservation plans across the western region of Saudi Arabia via monitoring the changes in plant diversity. Further studies to examine the vegetation diversity in the different habitats and protected areas in the western region of Saudi Arabia are highly recommended.

Supplementary Materials

The following supporting information can be downloaded at: https://www.mdpi.com/article/10.3390/d15030309/s1, Figure S1: The climatic data regarding temperatures, precipitation, relative humidity, and wind speed collected from five different regions (i.e., Abha, Madinah, Makkah, Tabuk, and Yanbu) to represent the study area for a period of 29 years from 1989 to 2017; Figure S1: Climate diagrams of the five different regions (i.e., Abha, Madinah, Makkah, Tabuk, and Yanbu) representing the study area shows that this area is characterized by a dry climate; Table S1: A list of all the plant species identified in the study area and their families and life forms; Table S2: Synoptic table of average frequency and relative coverage (%) of the 4 vegetation groups (clusters) identified after application of TWINSPAN.

Author Contributions

Conceptualization, S.T.A. and M.A.E.-S.; Data curation, S.T.A. and M.A.E.-S.; Formal analysis, S.T.A. and M.A.E.-S.; Funding acquisition, S.T.A.; Investigation, S.T.A., M.A.E.-S. and A.A.A.; Methodology, S.T.A., M.A.E.-S. and A.A.A.; Project administration, M.A.E.-S. and A.A.A.; Resources, M.A.E.-S. and A.A.A.; Software, S.T.A. and M.A.E.-S.; Supervision, M.A.E.-S. and A.A.A.; Validation, M.A.E.-S.; Visualization, S.T.A. and M.A.E.-S.; Writing—original draft, S.T.A.; Writing—review & editing, M.A.E.-S. and A.A.A. All authors have read and agreed to the published version of the manuscript.

Funding

This scientific paper contains studies and research results supported by King Abdulaziz City for Science and Technology Grant No. (1-18-01-001-0076).

Institutional Review Board Statement

Not applicable.

Data Availability Statement

All the raw data is available upon request.

Conflicts of Interest

The authors declare no conflict of interest.

References

  1. AlNafie, A.H. Phytogeography of Saudi Arabia. Saudi J. Biol. Sci. 2008, 15, 159–176. [Google Scholar]
  2. Chaudhary, S.A. Flora of the Kingdom of Saudi Arabia; Ministry of Agriculture and Water: Riyadh, Saudi Arabia, 2001; Volume 2, p. 542. [Google Scholar]
  3. Collenette, S. Wildflowers of Saudi Arabia; National Commission for Wildlife Conservation and Development (NCWCD): Riyadh, Saudi Arabia, 1999; p. 799. [Google Scholar]
  4. Collenette, S. A Checklist of Botanical Species in Saudi Arabia; International Asclepiad Society: West Sussex, UK, 1998. [Google Scholar]
  5. Collenette, S. An Illustrated Guide to the Flowers of Saudi Arabia; Scorpion Publishing Ltd: Riyadh, Saudi Arabia, 1985. [Google Scholar]
  6. Al-Aklabi, A.; Al-Khulaidi, A.W.; Hussain, A.; Al-Sagheer, N. Main vegetation types and plant species diversity along an altitudinal gradient of Al Baha region, Saudi Arabia. Saudi J. Biol. Sci. 2016, 23, 687–697. [Google Scholar] [CrossRef] [PubMed]
  7. El-Sheikh, M.A.; Thomas, J.; Alatar, A.A.; Hegazy, A.K.; Abbady, G.A.; Alfarhan, A.H.; Okla, M.I. Vegetation of Thumamah Nature Park: A managed arid land site in Saudi Arabia. Rendiconti Lincei 2013, 24, 349–367. [Google Scholar] [CrossRef]
  8. Zohary, M. Geobotanical Foundations of the Middle East; Swets & Zeitlinger: Lisse, The Netherlands, 1973. [Google Scholar]
  9. Al-Namazi, A.A.; Al-Khulaidi, A.W.A.; Algarni, S.; Al-Sagheer, N.A. Natural plant species inventory of hotspot areas in Arabian Peninsula: Southwest Al-Baha region, Saudi Arabia. Saudi J. Biol. Sci. 2021, 28, 3309–3324. [Google Scholar] [CrossRef]
  10. Thomas, J.; El-Sheikh, M.A.; Alatar, A.A. Endemics and endangered species in the biodiversity hotspot of the Shada Mountains, Saudi Arabia. J. Arid. Land 2017, 9, 109–121. [Google Scholar] [CrossRef] [Green Version]
  11. Al-Abbasi, T.; Al-Farhan, A.; Al-Khulaidi, A.; Hall, M.; Llewellyn, O.; Miller, A.; Patzelt, A. Important plant areas in the Arabian Peninsula. Edinb. J. Bot. 2010, 67, 25–35. [Google Scholar] [CrossRef]
  12. Hobohm, C.; Janišová, M.; Jansen, J.; Bruchmann, I.; Deppe, U. Biogeography of endemic vascular plants–overview. In Endemism in Vascular Plants; Springer Nature: Cham, Switzerland, 2014; pp. 85–163. [Google Scholar]
  13. Elaidarous, A.A.; Osman, H.E.; Galal, T.M.; El-Morsy, M.H. Vegetation–environment relationship and floristic diversity of Wadi Al-Sharaea, Makkah Province, Saudi Arabia. Rendiconti Lincei. Scienze Fisiche e Naturali 2022, 33, 169–184. [Google Scholar] [CrossRef]
  14. Abdel Khalik, K.; Al-Gohary, I.; Al-Sodany, Y. Floristic composition and vegetation: Environmental relationships of Wadi Fatimah, Mecca, Saudi Arabia. Arid. Land Res. Manag. 2017, 31, 316–334. [Google Scholar] [CrossRef]
  15. Abdel Khalik, K.; El-Sheikh, M.; El-Aidarous, A. Floristic diversity and vegetation analysis of wadi Al-Noman, Mecca, Saudi Arabia. Turk. J. Bot. 2013, 37, 894–907. [Google Scholar] [CrossRef]
  16. Ghazal, A.M.F. Vegetation patterns and plant communities distribution along an altitudinal gradient at Asir Mountain, southwest Saudi Arabia. Pak. J. Bot. 2015, 47, 1377–1389. [Google Scholar]
  17. Al-Yemeni, M.; Sher, H. Biological spectrum with some other ecological attributes of the flora and vegetation of the Asir Mountain of South West, Saudi Arabia. Afr. J. Biotechnol. 2010, 9, 5550–5559. [Google Scholar]
  18. Abd El-Ghani, M.M. Vegetation along a transect in the Hijaz mountains (Saudi Arabia). J. Arid Environ. 1996, 32, 289–304. [Google Scholar] [CrossRef]
  19. Alharthi, A.; El-Sheikh, M.A.; Elhag, M.; Alatar, A.A.; Abbadi, G.A.; Abdel-Salam, E.M.; Arif, I.A.; Baeshen, A.A.; Eid, E.M. Remote sensing of 10 years changes in the vegetation cover of the northwestern coastal land of Red Sea, Saudi Arabia. Saudi J. Biol. Sci. 2020, 27, 3169–3179. [Google Scholar] [CrossRef] [PubMed]
  20. Chaudhary, H. Flora of Kingdom of Saudi Arabia vol. I, II and III; Ministry of Agriculture and Water, National Herbarium, National and Water Research Center: Riyadh, Saudi Arabia, 1999–2001. [Google Scholar]
  21. Kent, M. Vegetation Description and Data Analysis: A Practical Approach, 2nd ed.; John Wiley & Sons: Chichester, UK, 2012; p. 428. [Google Scholar]
  22. Ellenberg, D.; Mueller-Dombois, D. Aims and Methods of Vegetation Ecology; Wiley: New York, NY, USA, 1974; p. 547. [Google Scholar]
  23. Pielou, E.C. Ecological Diversity; John Wiley & Sons: Hoboken, NJ, USA, 1975. [Google Scholar]
  24. Magurran, A.E. Ecological Diversity and Its Measurement; Princeton University Press: Princeton, NJ, USA, 1988. [Google Scholar]
  25. Magurran, A.E. Measuring Biological Diversity; John Wiley & Sons: Hoboken, NJ, USA, 2003. [Google Scholar]
  26. Allen, S.E. Chemical Analysis of Ecological Materials, 2nd ed.; Blackwell Scientific: Oxford, UK, 1989; p. 368. [Google Scholar]
  27. Hill, M.O. TWINSPAN: A FORTRAN Program for Arranging Multivariate Data in an Ordered Two-way Table by Classification of the Individuals and Attributes; Section of Ecology and Systematics, Cornell University: New York, NY, USA, 1979; p. 90. [Google Scholar]
  28. Hill, M.O. DECORANA: A FORTRAN Program for Detrended Correspondence Analysis and Reciprocal Averaging; Section of Ecology and Systematics, Cornell University: New York, NY, USA, 1979; p. 52. [Google Scholar]
  29. Ter Braak, C.J.; Smilauer, P. CANOCO Reference Manual and CanoDraw for Windows User’s Guide: Software for Canonical Community Ordination (Version 4.5); Wageningen University: Wageningen, The Netherlands, 2002; Available online: http://www.canoco5.com/ (accessed on 3 December 2022).
  30. Migahid, A.M. Flora of Saudi Arabia; Riyadh University Publications: Riyadh, Saudi Arabia, 1996; Volume 1. [Google Scholar]
  31. Migahid, A.M.; El-Sheikh, A.M. A contribution to the study of vegetation in western and north western Saudi Arabia. Proc. Saudi Biol. Soc. 1983, 6, 115–150. [Google Scholar]
  32. Migahid, M.A.; El-Sheikh, A.M. The Natural Vegetation of Al-Rabadha Area of Western Saudi Arabia. Proc. Saudi Biol. Soc. 1983, 6, 151–174. [Google Scholar]
  33. Al-Sherif, E.A.; Ayesh, A.M.; Rawi, S.M. Floristic composition, life form and chorology of plant life at Khulais region, Western Saudi Arabia. Pak. J. Bot. 2013, 45, 29–38. [Google Scholar]
  34. Al Wadie, H. Floristic composition and vegetation of Wadi Talha, Aseer mountains, south west Saudi Arabia. J. Biol. Sci. 2002, 2, 285–288. [Google Scholar]
  35. Heneidy, S.Z.; Bidak, L.M. Biodiversity of the Plant Species in Bisha, Asir Region, Southwestern Saudi Arabia. Pak. J. Biol. Sci. 2001, 4, 1323–1330. [Google Scholar]
  36. Hegazy, A.; El-Demerdash, M.; Hosni, H. Vegetation, species diversity and floristic relations along an altitudinal gradient in south-west Saudi Arabia. J. Arid Environ. 1998, 38, 3–13. [Google Scholar] [CrossRef]
  37. El-Sheikh, M.A.; Al-Shehri, M.A.; Alfarhan, A.H.; Alatar, A.A.; Rajakrishnan, R.; Al-Rowaily, S.L. Threatened Prunus arabica in an ancient volcanic protected area of Saudi Arabia: Floristic diversity and plant associations. Saudi J. Biol. Sci. 2019, 26, 325–333. [Google Scholar] [CrossRef]
  38. Alatar, A.A.; El-Sheikh, M.A.R.; Thomas, J.; Hegazy, A.K.; El Adawy, H.A. Vegetation, Floristic Diversity, and Size-Classes of Acacia gerrardii in an Arid Wadi Ecosystem. Arid. Land Res. Manag. 2015, 29, 335–359. [Google Scholar] [CrossRef]
  39. El-Sheikh, M.A. Population structure of woody plants in the arid cloud forests of Dhofar, southern Oman. Acta Bot. Croat. 2013, 72, 97–111. [Google Scholar] [CrossRef] [Green Version]
  40. Alatar, A.A.; El-Sheikh, M.A.; Thomas, J. Vegetation analysis of Wadi Al-Jufair, a hyper-arid region in Najd, Saudi Arabia. Saudi J. Biol. Sci. 2012, 19, 43–54. [Google Scholar] [CrossRef] [PubMed] [Green Version]
  41. El-Sheikh, M.A.; Abbadi, G.A.; Bianco, P.M. Vegetation ecology of phytogenic hillocks (nabkhas) in coastal habitats of Jal Az-Zor National Park, Kuwait: Role of patches and edaphic factors. Flora-Morphol. Distrib. Funct. Ecol. Plants 2010, 205, 832–840. [Google Scholar] [CrossRef]
  42. Al-Turki, T.; Al-Olayan, H. Contribution to the flora of Saudi Arabia: Hail region. Saudi J. Biol. Sci. 2003, 10, 190–222. [Google Scholar]
  43. El-Ghanim, W.M.; Hassan, L.M.; Galal, T.M.; Badr, A. Floristic composition and vegetation analysis in Hail region north of central Saudi Arabia. Saudi J. Biol. Sci. 2010, 17, 119–128. [Google Scholar] [CrossRef] [Green Version]
  44. Takhtadzhian, A.L. The Floristic Regions of the World; University of California Press: Berkeley, CA, USA, 1988; p. 522. [Google Scholar]
  45. Alharthi, S.T.; El-Sheikh, M.A.; Alfarhan, A.A. Biological change of western Saudi Arabia: Alien plants diversity and their relationship with edaphic variables. J. King Saud Univ. Sci. 2023, 35, 102496. [Google Scholar] [CrossRef]
  46. Thomas, J.; El-Sheikh, M.A.; Alfarhan, A.H.; Alatar, A.A.; Sivadasan, M.; Basahi, M.; Al-Obaid, S.; Rajakrishnan, R. Impact of alien invasive species on habitats and species richness in Saudi Arabia. J. Arid Environ. 2016, 127, 53–65. [Google Scholar] [CrossRef]
  47. Rahmonov, O.; Abramowicz, A.; Pukowiec-Kurda, K.; Fagiewicz, K. The link between a high-mountain community and ecosystem services of juniper forests in Fann Mountains (Tajikistan). Ecosyst. Serv. 2021, 48, 101255. [Google Scholar] [CrossRef]
  48. Brooks, W.; Mandil, K. Vegetation dynamics in the Asir woodlands of south-western Saudi Arabia. J. Arid Environ. 1983, 6, 357–362. [Google Scholar] [CrossRef]
  49. El-Sheikh, M.A.; Thomas, J.; Arif, I.A.; El-Sheikh, H.M. Ecology of inland sand dunes “nafuds” as a hyper-arid habitat, Saudi Arabia: Floristic and plant associations diversity. Saudi J. Biol. Sci. 2021, 28, 1503–1513. [Google Scholar] [CrossRef] [PubMed]
  50. Elmefregy, M.; El-Sheikh, M. Ecological status of sand binder plant white saxaul (Haloxylon persicum) at the managed area of Al-Qassim, Saudi Arabia: Plant associations and population structure. Appl. Ecol. Environ. Res. 2020, 18, 2781–2794. [Google Scholar] [CrossRef]
  51. Valentini, E.; Taramelli, A.; Cappucci, S.; Filipponi, F.; Nguyen Xuan, A. Exploring the Dunes: The Correlations between Vegetation Cover Pattern and Morphology for Sediment Retention Assessment Using Airborne Multisensor Acquisition. Remote Sens. 2020, 12, 1229. [Google Scholar] [CrossRef] [Green Version]
Figure 1. A map of Saudi Arabia with a focus on the study area (the circle on the left) showing the selected sampling stands (the red dots).
Diversity 15 00309 g001
Figure 2. Floristic diversity in the 58 selected sampling stands in the western region of Saudi Arabia showed as the number of identified plant species and their families (a), the life forms of these species (b), and the chorotype spectrum in the study area (c). AF: African, Am.: American, Cosm.: Cosmopolitan, Eu.: European, IT: Irano-Turanian, Med.: Mediterranean, Pal.: Paleotropical, SA: Saharo-Arabian, Sb: Siberian, SM: Somali-Masai, Tr.: Tropical.
Diversity 15 00309 g002
Figure 3. (a) Multivariate analysis of the 58 sampling stands by TWINSPAN classified them into four vegetation groups. (b) The stands ordination by DECORANA software confirmed the classification into four vegetation groups. The identified groups are VG I: Opuntia ficus-indica-Juniperus phoenicea, VG II: Reichardia tingitana-Heliotropium aegyptiacum, VG III: Prosopis juliflora-Acacia seyal-Abutilon pannosum, and VG IV: Suaeda monoica.
Diversity 15 00309 g003
Figure 4. A biplot resulted from canonical correspondence analysis of the 58 sampling stands ordination according to species diversity indices and soil variables.
Diversity 15 00309 g004
Table 1. Different vegetation groups identified in the study with the sampling stands belonging to each group, the habitats each group inhabits, and the dominant species based on their average coverage and relative frequency values. Numbers of native and alien species in each vegetation group are shown.
VG *# Stands% Study AreaStandsHabitats (%) +1st Dominant sp.C (%)P (%)2nd Dominant sp.C (%)P (%)No. Species
VG I1118.9622–24,
26, 51,
53–58
F = 0
M = 100
P = 0
W = 0
C = 0
R = 0
Opuntia ficus-indica9067Juniperus phoenicea3067Native: 32
Casual: 0
Naturalized: 11
Invasive: 2
VG II2543.101–21,
25, 27,
48, 52
F = 24
M = 40
P = 0
W = 28
C = 0
R = 8
Reichardia tingitana1063Heliotropium aegyptiacum558Native: 50
Casual: 2
Naturalized: 23
Invasive: 2
VG III1729.3128, 29,
35–39,
40–47,
49, 50
F = 17.65
M = 0
P = 5.88
W = 64.71
C = 11.67
R = 0
Prosopis juliflora8576Acacia seyal3047Native: 38
Casual: 2
Naturalized: 33
Invasive: 2
Abutilon pannosum2035
VG IV55.6330–34F = 0
M = 0
P = 0
W = 100
C = 0
R = 0
Suaeda monoica4380Acacia ehrenbergiana1060Native: 6
Casual: 0
Naturalized: 8
Invasive: 1
* VG: Vegetation group, # stands: number of stands in this group, % study area: the percentage that the vegetation group represents of the whole study area, C: average coverage of the species in the sampling stands, P: relative frequency of the species in the sampling stands. + Habitats: F: farmlands, M: mountains, P: protected areas, W: wadis, C: coastal areas, and R: ruderal areas.
Table 2. Biplot scores of different diversity indices and soil variables with the ordination axes.
VariableAxis 1Axis 2
Diversity indices
Species number−0.10−0.04
Species coverage (%)0.01−0.11
Species richness−0.10−0.02
Species evenness−0.43 *0.10
Shannon (Ĥ)−0.44 *0.02
Simpson-C0.50 *−0.01
Soil
pH0.210.02
EC (mmohs cm−3)−0.40 *0.26
Bulk soil (%)
Sand−0.200.14
Silt0.30−0.13
Clay−0.04−0.12
Organic matter0.52 **0.10
Minerals
N (mg g−1)0.0030.14
P (mg g−1)0.050.142
K (mg g−1)−0.64 ***−0.29
Mg (ppm)−0.50 *−0.05
Ca (ppm)−0.44 *−0.21
Fe (ppm)−0.03−0.10
Na (ppm)−0.61 ***−0.0.15
Mn (ppm)−0.440.51 **
* p ≤ 0.05, ** p ≤ 0.01, *** p ≤ 0.001.
Table 3. Pearson’s correlation coefficients between calculated diversity indices and different physical and chemical soil characteristics in the study area.
VariablepHSand (%)Silt (%)Clay (%)OM (%)Fe (ppm)Mn (ppm)
Sp. number−0.023−0.30 *0.33 *0.010.210.02−0.10
Plant coverage (%)−0.4 **0.30−0.24−0.23−0.33 *−0.34 **0.30 *
Sp. richness0.20−0.35 **0.40 **0.200.33 *0.20−0.22
Evenness0.30 *−0.260.230.30 *0.30 *0.31 *−0.23 *
Shannon (Ĥ)0.20−0.340.30 **0.250.40 **0.30 *−0.32 *
Simpson-C−0.260.30 *−0.30 *−0.30 *−0.30 *−0.30 *0.40 **
* p ≤ 0.05, ** p ≤ 0.01.
Table 4. Mean ± standard deviation values of the diversity indices and soil variables for the identified vegetation groups in the study area. VG I: Opuntia ficus-indica-Juniperus phoenicea, VG II: Reichardia tingitana-Heliotropium aegyptiacum, VG III: Prosopis juliflora-Acacia seyal-Abutilon pannosum, and VG IV: Suaeda monoica.
VariableVG IVG IIVG IIIVG IVF-Valuep-Value
Diversity indices
Species number6.82 ± 2.709.84 ± 2.908.8 ± 2.614.4 ± 1.707.20.00 ***
Species coverage (%)86.73 ± 30.8532.84 ± 31.9794.24 ± 33.6581.60 ± 37.8514.60.00 ***
Species richness1.40 ± 0.102.70 ± 0.101.80 ± 0.700.90 ±0.5016.60.00 ***
Species evenness0.50 ±0.160.84 ± 0.140.62 ± 0.160.70 ± 0.1015.80.00 ***
Shannon (Ĥ)0.40 ± 0.150.81 ± 0.160.60 ± 0.180.40 ± 0.1022.110.00 ***
Simpson-C0.60 ± 0.150.20 ± 0.120.40 ± 0.160.45 ± 0.1022.60.00 ***
Soil
pH7.70 ± 0.347.82 ± 0.257.50 ± 0.307.9 ± 0.206.90.001 ***
EC (mmohs cm−3)0.30 ± 0.500.33 ± 0.421.30 ± 1.540.14 ± 0.104.50.007 ***
Bulk soil (%)
Sand72.01 ± 7.862.10 ± 19.570.90 ± 13.380.50 ± 12.122.710.054 *
Silt17.5 ± 6.9024.7 ± 15.0217.7 ± 11.108.9 ± 5.6030.038 *
Clay10.5 ± 2.313.2 ± 5.311.5 ± 3.610.6 ± 6.51.30.30
Organic matter8.28 ± 3.728.70 ± 2.905.58 ± 3.802.19 ± 1.607.50.00 ***
Minerals
N (mg g−1)4.50 ± 1.805.80 ± 4.045.60 ± 2.902.92 ± 1.021.40.30
P (mg g−1)0.2 ± 0.010.2 ± 0.020.2 ± 0.010.1 ± 0.030.80.53
K (mg g−1)2.70 ± 1.993.10 ± 1.977.84 ± 2.705.02 ± 1.9413.40.00 ***
Mg (ppm)3.54 ± 1.32.53 ± 1.45.50 ± 1.932.50 ± 1.57.60.00 ***
Ca (ppm)13.80 ± 6.5812.75 ± 3.1020.20 ± 4.439.30 ± 3.302.730.053 *
Fe (ppm)0.12 ± 0.010.70 ± 0.050.10 ± 0.030.30 ± 0.113.70.018 *
Na (ppm)9.83 ± 2.2312.01 ± 3.1015.72 ± 5.1411.80 ± 0.971.50.227
Mn (ppm)0.04 ± 0.010.01 ± 0.010.07 ± 0.010.04 ± 0.017.20.00 ***
Maximum and minimum values in each row are shown in bold and underlined, respectively. * p ≤ 0.05, *** p ≤ 0.001.
Disclaimer/Publisher’s Note: The statements, opinions and data contained in all publications are solely those of the individual author(s) and contributor(s) and not of MDPI and/or the editor(s). MDPI and/or the editor(s) disclaim responsibility for any injury to people or property resulting from any ideas, methods, instructions or products referred to in the content.

