Article

The Role of Uncultivated Habitats in Supporting Wild Bee Communities in Mediterranean Agricultural Landscapes

Department of Entomology, Institute of Environmental Sciences, Faculty of Agriculture Food and Environment, The Hebrew University of Jerusalem, Rehovot 7610001, Israel
*
Author to whom correspondence should be addressed.
Diversity 2023, 15(2), 294; https://doi.org/10.3390/d15020294
Submission received: 17 January 2023 / Revised: 13 February 2023 / Accepted: 14 February 2023 / Published: 17 February 2023
(This article belongs to the Special Issue Invertebrate Diversity in Fragmented Habitats)

Abstract

:
In agricultural landscapes, uncultivated habitat patches may have a focal role in supporting communities of ecosystem service providers. However, little is known on the variances among different types of uncultivated habitat patches in providing resources and maintaining populations of these beneficial organisms. We studied wild bee communities in natural and semi-natural uncultivated patches embedded in semi-arid Mediterranean agricultural landscapes. We investigated the effects of local- and landscape-scale land-use characteristics, as well as their interactions, on bee diversity, functional composition, and forage and nesting resources. Most bee community parameters were affected by both local- and landscape-scale characteristics, but no significant interactions were found among the scales. Local land-use effects were related primarily to overall plant cover, and to the abundance and richness of flowering plants. Landscape effects, mostly limited to a 400 m range, were varied. The abundance of focal crop pollinators varied considerably between patch type and pollinator species. The different types of uncultivated habitats maintain complementary bee and flower communities. Our findings show the important role of uncultivated habitat patches in providing floral and nesting resources for bees, and creating resource-landscapes that can support wild bee communities and crop pollination services in Mediterranean agricultural landscapes.

1. Introduction

Agricultural landscapes are comprised of agricultural production areas mixed with uncultivated patches of different types and varying spatial scales. Much of the work on biodiversity and ecosystem services in agricultural landscapes has used agricultural fields and orchards as focal points, and explored how they are affected by field management and spatial configuration, biogeographic factors, crop type, and the landscape matrix [1,2,3]. However, the uncultivated patches might have a crucial role as wildlife habitats in agricultural landscapes, thus promoting biodiversity. In turn, populations of ecosystem services providers may spill over from unmanaged habitats to adjacent fields and provide agricultural benefits. These uncultivated patches may vary considerably in their spatial configuration, physical characteristics, and ultimately resource availability. All these may significantly affect their role as focal habitats that support biodiversity and its functionality. Nevertheless, there is limited knowledge concerning the availability of resources across different types of uncultivated patches and the possible effects of this variability on communities of ecosystem services providers inhabiting agricultural landscapes.
Biotic pollination is crucial for the sustainability of both natural and agricultural ecosystems. An estimated 88% of all angiosperm species are animal-pollinated [4] and 77% of the leading global food crops depend on animal pollinators for yield quantity and quality [5,6,7,8]. Wild bees contribute substantially to the pollination of a variety of crops, may enhance overall pollination when active alongside with honeybees, and provide a “safety net” in the event of honey bee collapses [9]. Moreover, diverse bee communities promote the spatio-temporal stability of crop pollination services [10,11]. In Europe and the US, long-term monitoring has shown declines in the richness of wild bee species during the last century [12,13] and shifts in their species composition [14,15]. Habitat loss and homogenization, driven mainly by agricultural intensification, are highlighted as current and future main threats to wild bees [16,17,18,19].
The season-long abundance and diversity of nesting and foraging resources shape the composition of bee communities and are vital for their persistence in agricultural landscapes [20,21]. Therefore, conservation actions for wild bees in agricultural landscapes are usually focused on increasing the availability of these resources, mainly by managing field margins and hedgerows [22,23,24,25,26,27]. Yet, relatively little is known on the utility of unmanaged natural and semi-natural habitat patches in providing forage and nesting resources for bees and promoting their diversity in agricultural landscapes. Resource availability and bee communities in these natural and semi-natural habitat patches may be affected by local characteristics at the patch scale that vary considerably between habitat patch types due to local changes in biotic and abiotic conditions [28], with possible functional implications [29]. In addition, the effect of these natural and semi-natural habitat patches on bee communities depends on the landscape context that may alter overall abundance and dispersal of bees [28,29,30] and their crop pollination services [31]. Finally, the importance of interactive effects of local- and landscape-scale factors (such as landscape-dependent changes in local habitat characteristics) on bee communities is poorly understood [28,30,32].
The study reported here was focused on uncultivated patches as focal habitats of wild bees in agricultural landscapes and on the factors that shape bee communities at different spatial scales. We studied highly diverse bee communities in natural and semi-natural habitat patches embedded in a semi-arid Mediterranean agro-ecosystem, and asked the following specific questions: (A) What are the differences in micro-climatic conditions and availability of wild bees foraging and nesting resources among major types of uncultivated habitat patches? (B) What are the effects of local and landscape land-use characteristics on bee species richness, abundance, and functional composition in uncultivated patches? Do these effects vary across spatial scales? (C) Is there an interactive effect between local and landscape land-use characteristics? (D) Do focal crop pollinators inhabit uncultivated patches?

2. Materials and Methods
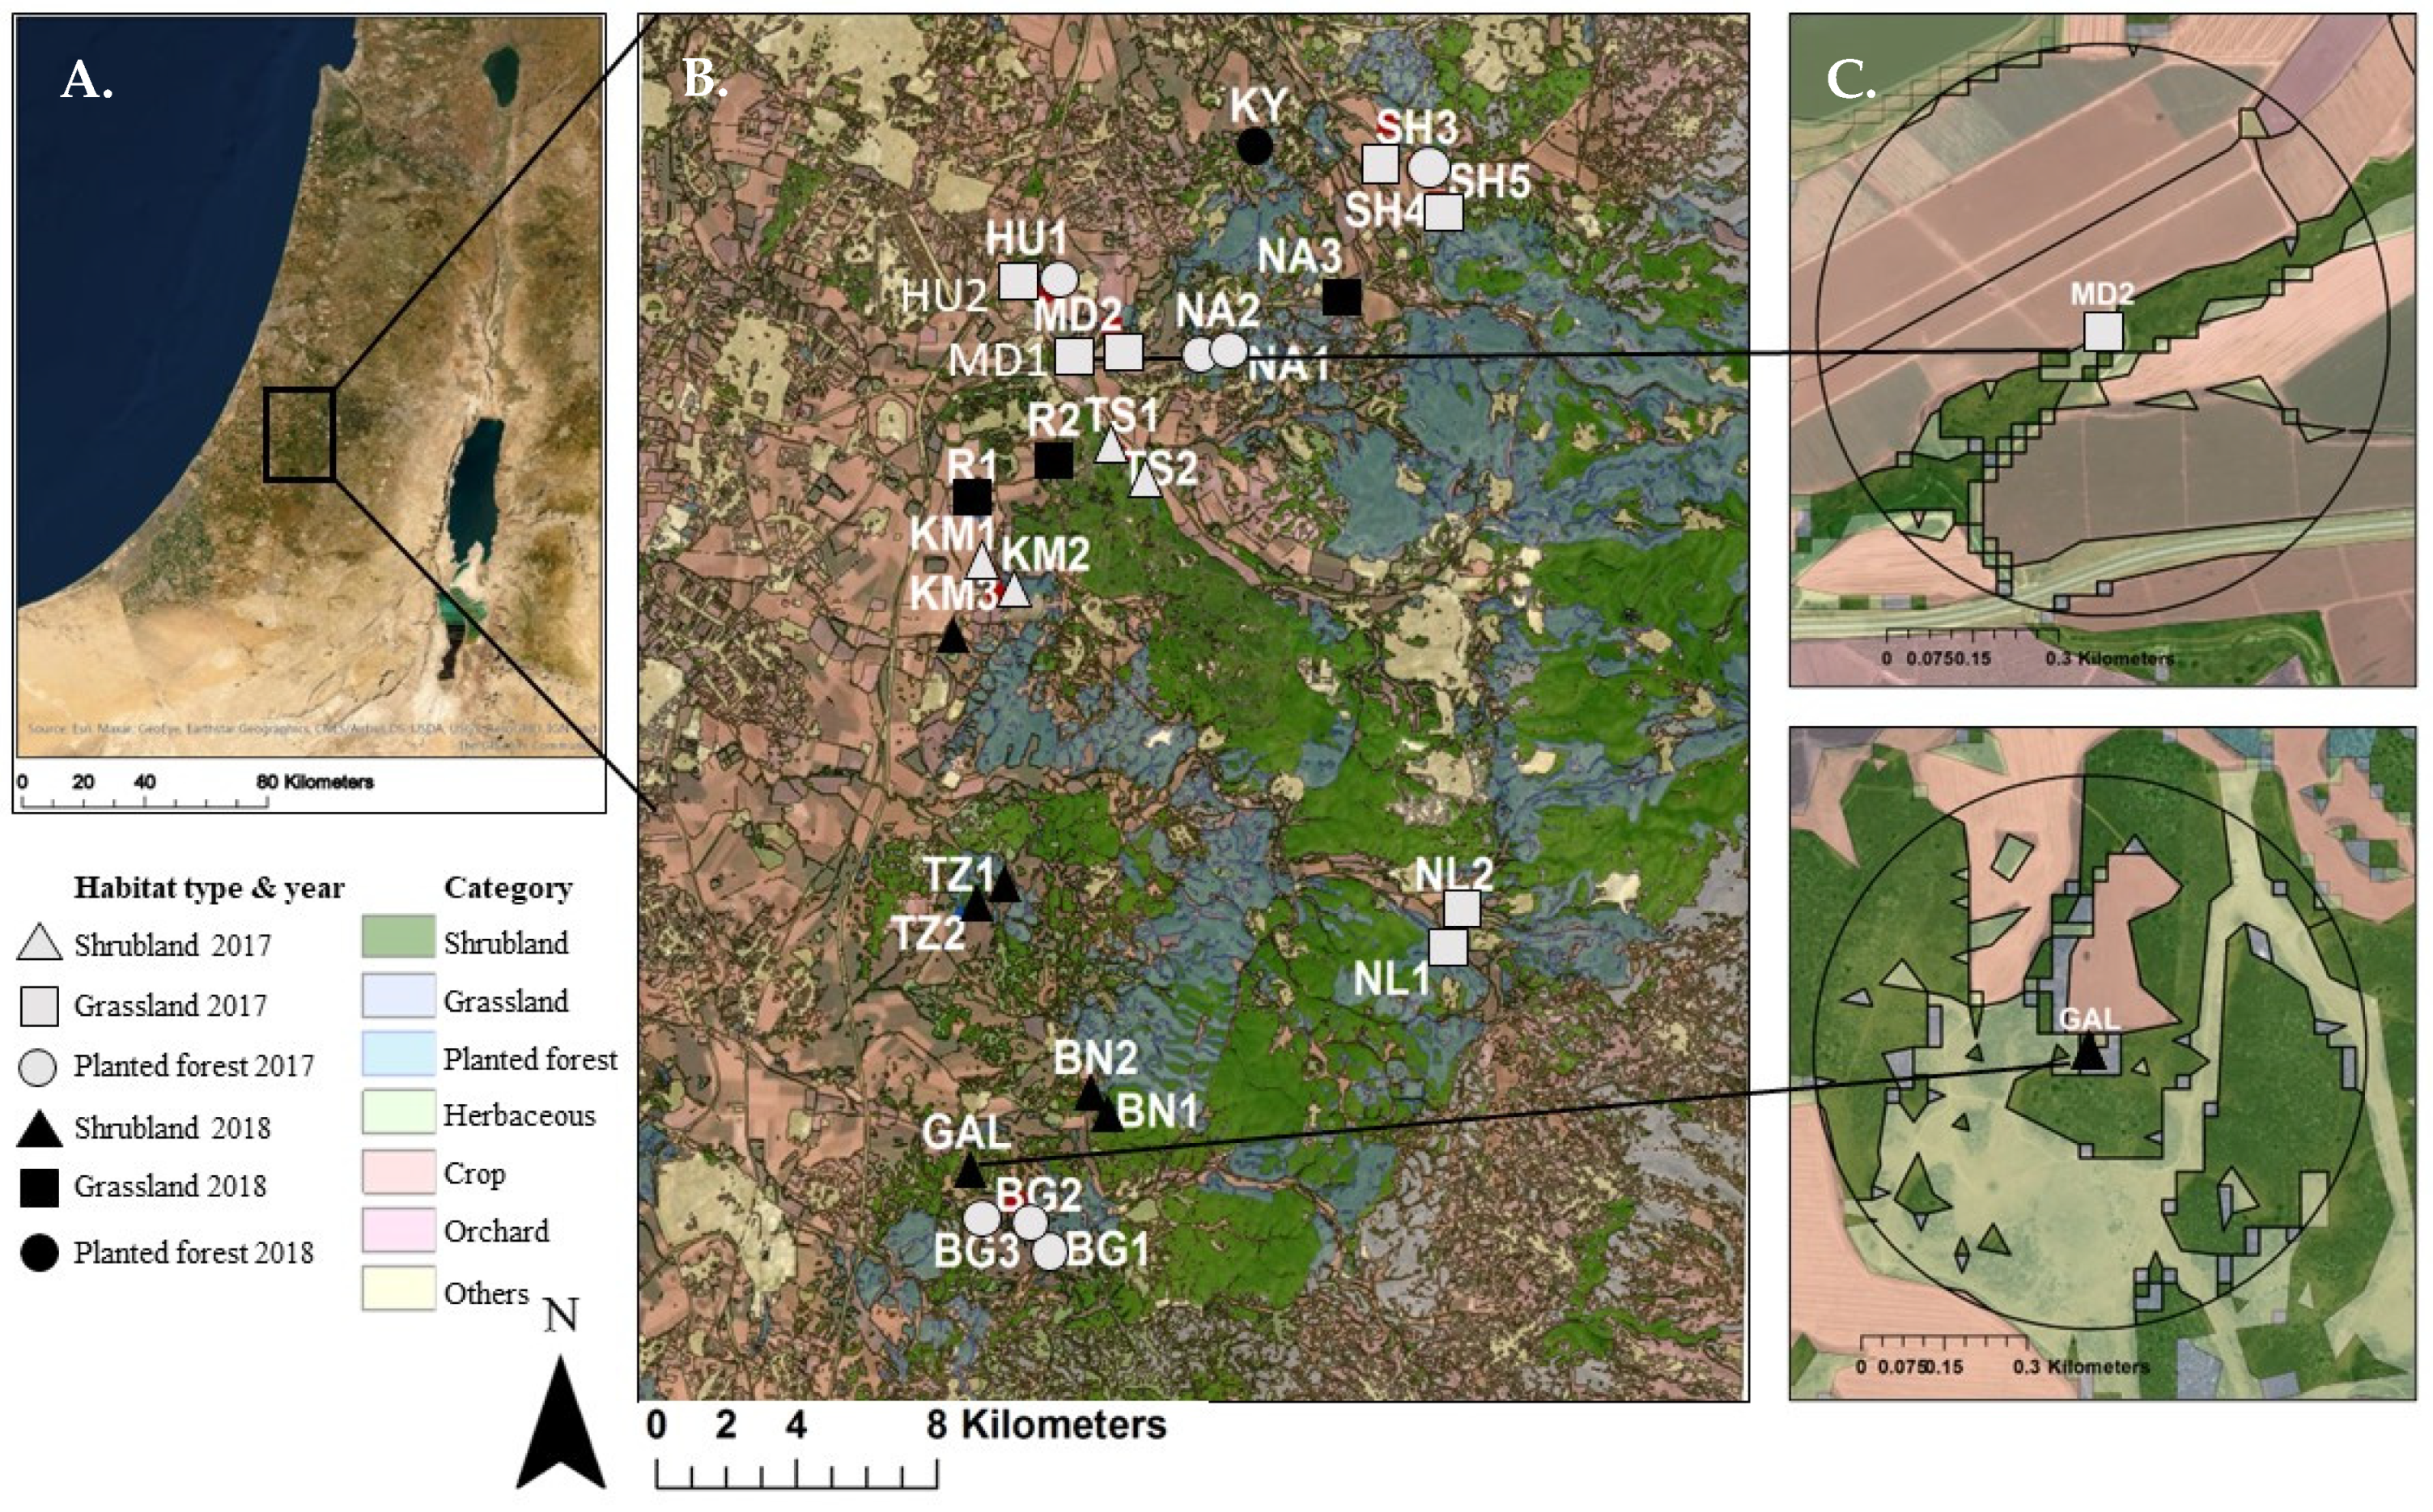
2.1. Study Area

The study was conducted in the Judean Foothills, a highly fragmented heterogeneous Mediterranean agro-natural ecosystem, in central Israel. The study area was characterized by a mosaic of natural vegetation at different successional stages (herbaceous, sparse and dense shrublands), planted forests, agricultural fields and orchards, and a few rural settlements. The area lies at the interface between a humid Mediterranean ecosystem to its north and an arid ecosystem to the south, making it a hot-spot of biodiversity [33], bees [34], and plants [35] in particular. Honeybees, Apis mellifera Linnaeus 1758, are native to the region and are commonly managed for crop pollination and honey production; feral honey bees are absent due to Varroa mites.

2.2. Study Design

To study the role of uncultivated habitats in maintaining crop pollinators in this system, we focused on patches adjacent to agricultural fields that were not in bloom during the study. Based on aerial photos and ground verification, we identified three major types of uncultivated habitats surrounding agricultural fields in our study system: (A) Mediterranean grassland (batha) dominated by herbaceous plants, (B) Mediterranean shrubland (maquis) dominated by local shrubs and trees, and (C) planted forest > 20 years old, of eucalyptus, carob and pine trees, not in bloom during our sampling. The planted forest plots were not managed after tree planting, and underwent significant successional changes, with considerable establishment of local perennial plants (Figure S1). Since we were interested in testing both local (patch-scale) and landscape (≥100 m radii) land-use effects, as well as possible interactions across scales, we prepared our sampling plots to independently represent the variation across these scales; twelve plots were established in grasslands, nine in shrubland, and nine in planted forests, spanning a land-use gradient of 10–70% uncultivated land in 300–1000 m buffers around plot centroid, for a total of 30 plots (see more details on land-use classification below) (Figure 1 and Figure 2). Each plot was 400 m2 (10 × 40) in size, at a minimal distance of 500 m from neighboring plots, and 10 m from the habitat patch edge (to decrease edge effects). Habitat patches varied in size (1.8–51.6 hectares; Table S1); this variation was reflected in the land-use analysis as the percentage of the area of each habitat type at 100–1000 m radii (see details on the land-use analysis below).

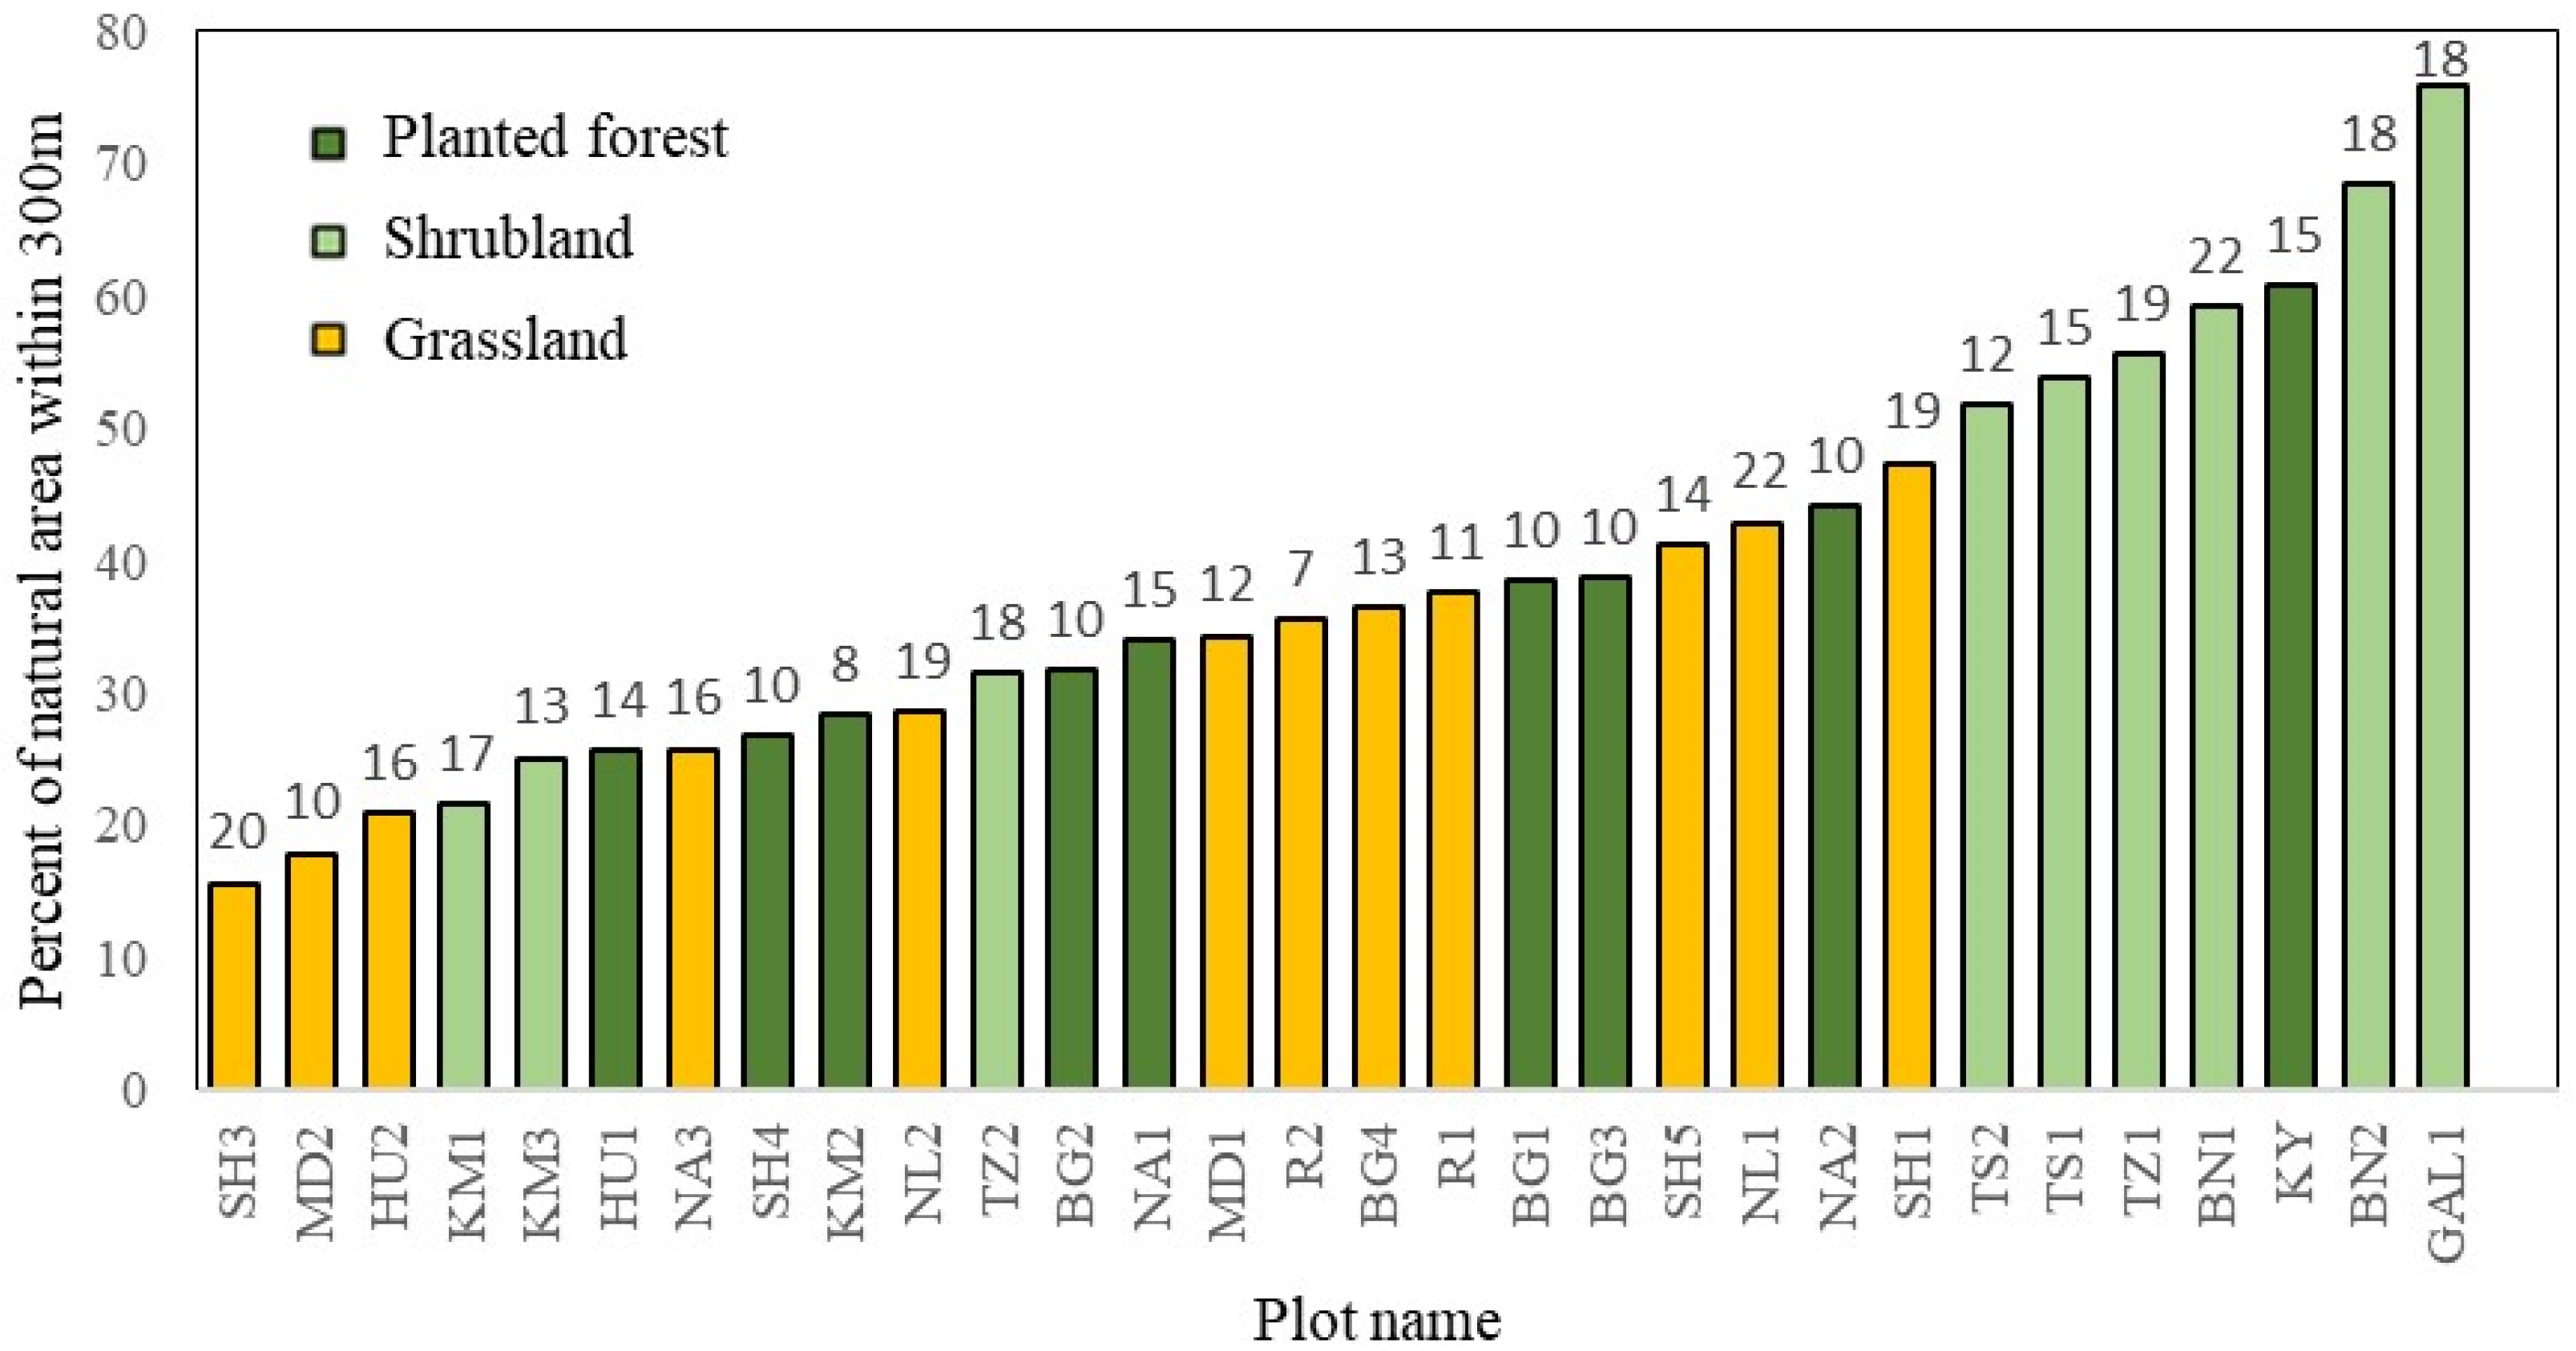
2.3. Landscape Parameters: Land-Use Classification and Analysis

Using the 2016 Israel land-use map (Central Bureau of Statistics) complemented by ground verification, when necessary, we classified the following dominant land-use categories: grassland (herbaceous area), shrubland, planted forest (mainly eucalyptus, carob and pine), agriculture (orchards and crop fields), and other land-uses (mainly water reservoirs, developed areas, and quarries; comprising <10% of the study area). We calculated the percentage of each of these land-use categories in 100, 200, 300, 400, 500, 750, and 1000 m radii around each of the plot centroids (ArcGIS 10.2.1). In addition, we grouped together the natural and semi-natural land-use categories (grassland, shrubland, planted forest), to obtain an overall uncultivated vs. cultivated area (orchards and crop fields were grouped together). See Table S1 for detailed land-use data.

2.4. Field Data Collection

Fieldwork was conducted in March–April in 2017 (20 plots) and 2018 (10 plots), corresponding to the peak wild bloom and bee activity period in the region [34]. We randomly set the sampling order of plots, to avoid geographical bias. Each plot was sampled for two consecutive days, under standardized weather conditions (clear, partly cloudy, or bright overcast skies, temperatures between 16–34 °C, and wind velocity < 2.5 m/s). The following measures were collected on each sampling day:

2.4.1. Local Habitat Parameters

1. Weather conditions. Twice a day, before starting the bee sampling (see below), we measured air temperature and wind velocity using anemometer (model LM-8010, Lutron Electronic Enterprise Co., Taibei, China), and solar radiation using a digital luminance meter.
2. Forage and nesting resources. Blooming plant species richness, abundance (number of flower/inflorescence), and nesting substrates (classified to dry and fresh herbaceous and woody plants, bare ground, large stones and rocks, and foliage) were recorded in ten 1 m diameter hoops, placed in a 10 m × 40 m grid across the entire plot. The Shannon–Weaver diversity index was calculated for the different nesting substrates (as listed above) in each plot, to account for plot-level diversity of nesting resources.

2.4.2. Bee Sampling

Wild bees were sampled using two complementary methods [36]: netting and pan traps. Bees were netted from flowers for a total of 30 min per sampling day; 15 min in the morning (8:00–12:00) and 15 in early afternoon (12:00–15:00). Netting was carried out while slowly walking across the plot, systematically surveying its entire area and all blooming plants. Handling time of captured bees was excluded from the overall sampling time. Bees were also collected using 12 pan traps (white, blue, and yellow, 15 cm diameter plastic bowls, filled with soapy water) that were placed in a 2 m × 2 m grid in the side far from the adjacent agricultural field (see Figure S2 for plot set up). Traps were placed in the morning (8–9) and left open for 7 h on each sampling day.

2.5. Bee Identification and Functional Traits

Bees were identified to species level and deposited at the National Entomological Collections, The Steinhardt Museum of Natural History, Tel Aviv University. Functional traits were compiled for each bee species based on published literature, expert opinions, flower visitation data, and inference from taxonomically related species (following Williams et al. [37]). Traits included nesting guild (above/below ground; available for 87% of all bee species), sociality (solitary/primitive eusocial/cleptoparasite; available for 84% of all bee species), lecty (polylege/oligolege; available for 84% of all bee species), and tongue length (short/long). For each species, we also measured the inter-tegular distance (distance between wing base, ITD) of five females and five males (available for 79% of bee species). Bee size is considered a good proxy of foraging ranges of bee species [38]. ITD is correlated with bee tongue length; by integrating it with bee family identity, 91% of tongue length variation could be predicted [39]; “BeeIT” R package was used for this estimation. Finally, we focused on species known to be crop pollinators or having high agricultural affinity, i.e., having highest relative abundance in agricultural fields, as found in previous studies in the study region [34,40,41].

2.6. Data Analysis

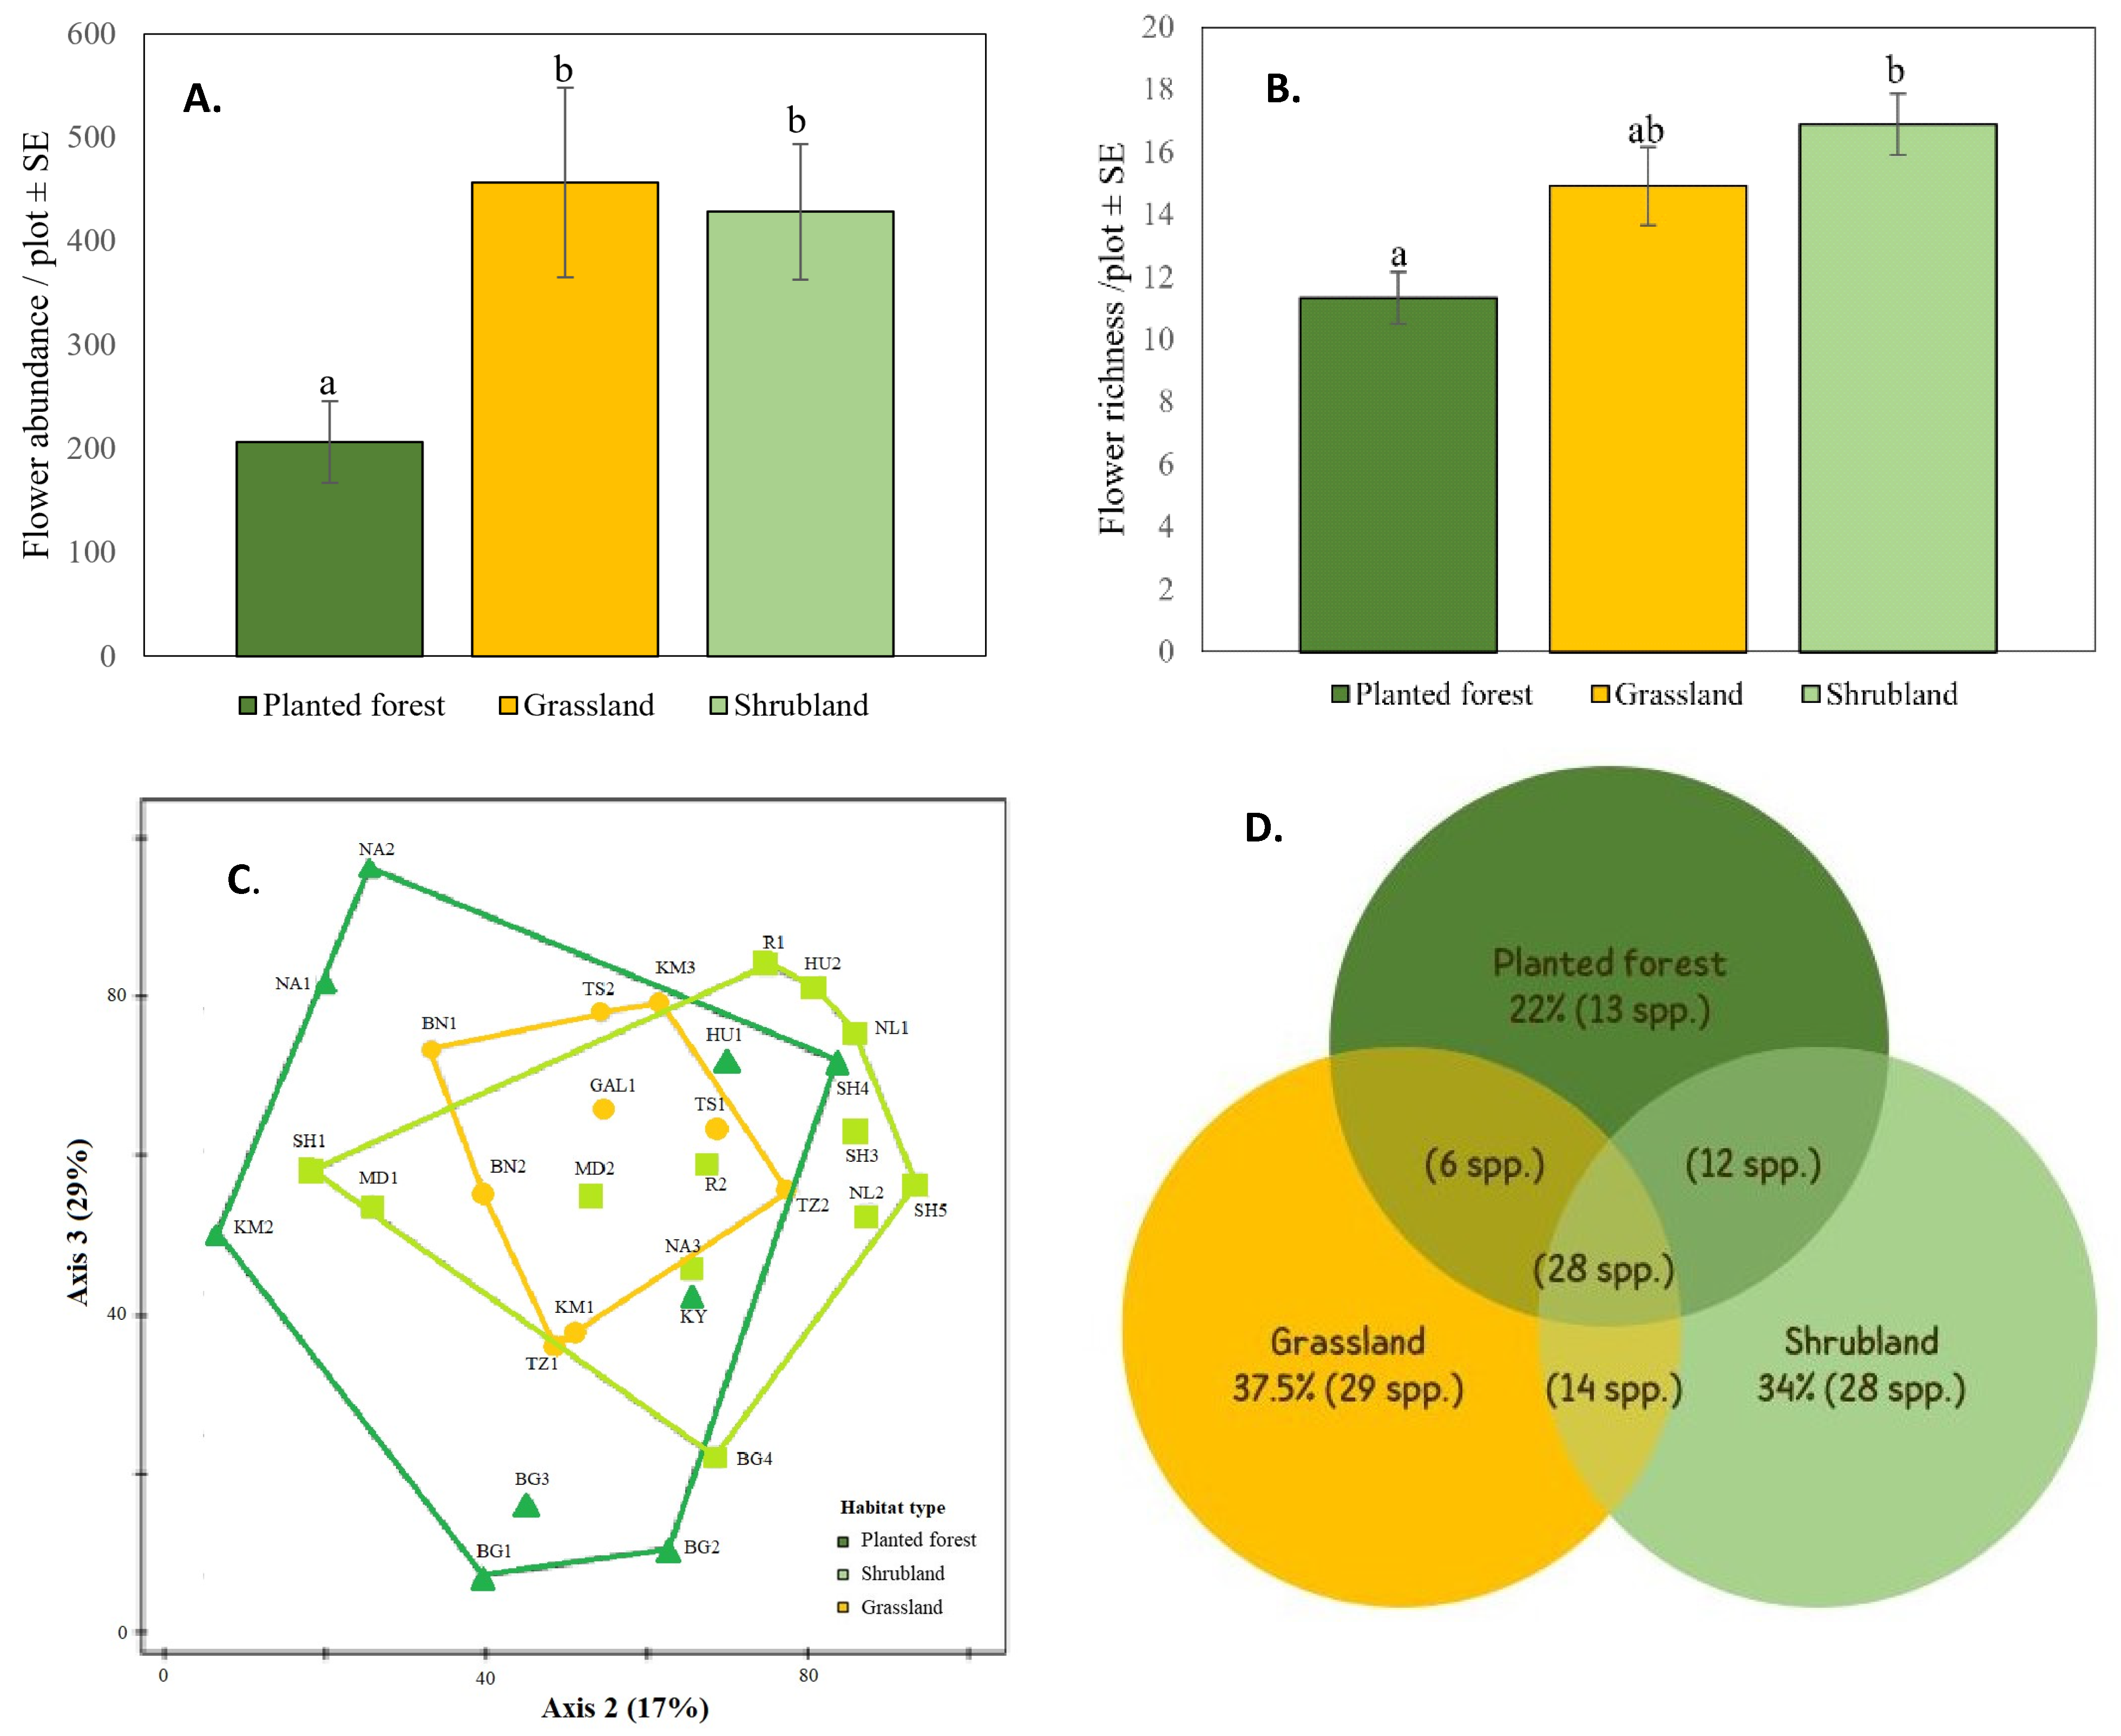
2.6.1. Wild Bee and Flower Abundance and Species Richness

We used generalized linear mixed models (GLMMs) and linear mixed effects model (LME) [42] to determine the effect of local-scale parameters (habitat type, habitat patch size, micro-climate-weather measures, forage and nesting resources; no collinearity was found between habitat type and the other habitat characteristics), landscape-scale parameters (percentage of uncultivated area at various radii), and the interaction between them (habitat type and landscape parameters) on the following dependent variables: (a) wild bee abundance and species richness; (b) bee functional traits, focusing of the relative abundance and species richness of: nesting—above vs. below ground nesters; sociality—solitary, primitive eusocial, and cleptoparasitic bees; foraging (lecty)—oligo vs. polylectic bees; tongue length—short vs. long tongue bees; body size (ITD measurement). We focused on relative rather than absolute abundance and richness, to highlight changes in the functional composition of the sampled bee communities; (c) richness and abundance of crop pollinating species; and (d) flower abundance and species richness. We used a Poisson distribution with a log-link function for the count data, and a binomial distribution for the life history traits. To account for spatio-temporal variation, we defined the following random factors: sampling year, time in the season (days after the first sampling day each year), and sub-region (north or south). Due to overdispersion in all count data models, an observation level random effect (OLRE) was added to each count data model [43]. First, a full model that included all fixed effects, the interaction between habitat type and landscape effects, and random effects was used. Accordingly, all possible models with the different configurations of fixed effects were compared. In order to avoid multicollinearity between land-use patterns at hierarchical radii, each radius was tested separately. We then tested the data for Poisson distribution by using an ‘Overdispersion test’. Next, the best-fitted model was selected, based on models’ AICcs [44]. When ΔAICc between alternative models was <2, models were considered equivalent. Finally, p-values were obtained by a likelihood ratio test for every fixed variable included in the model. Analyses were performed using lme4, glmmTMB, DHARMa, and MuMin R packages (R Core Team 2018, version 3.5.0).

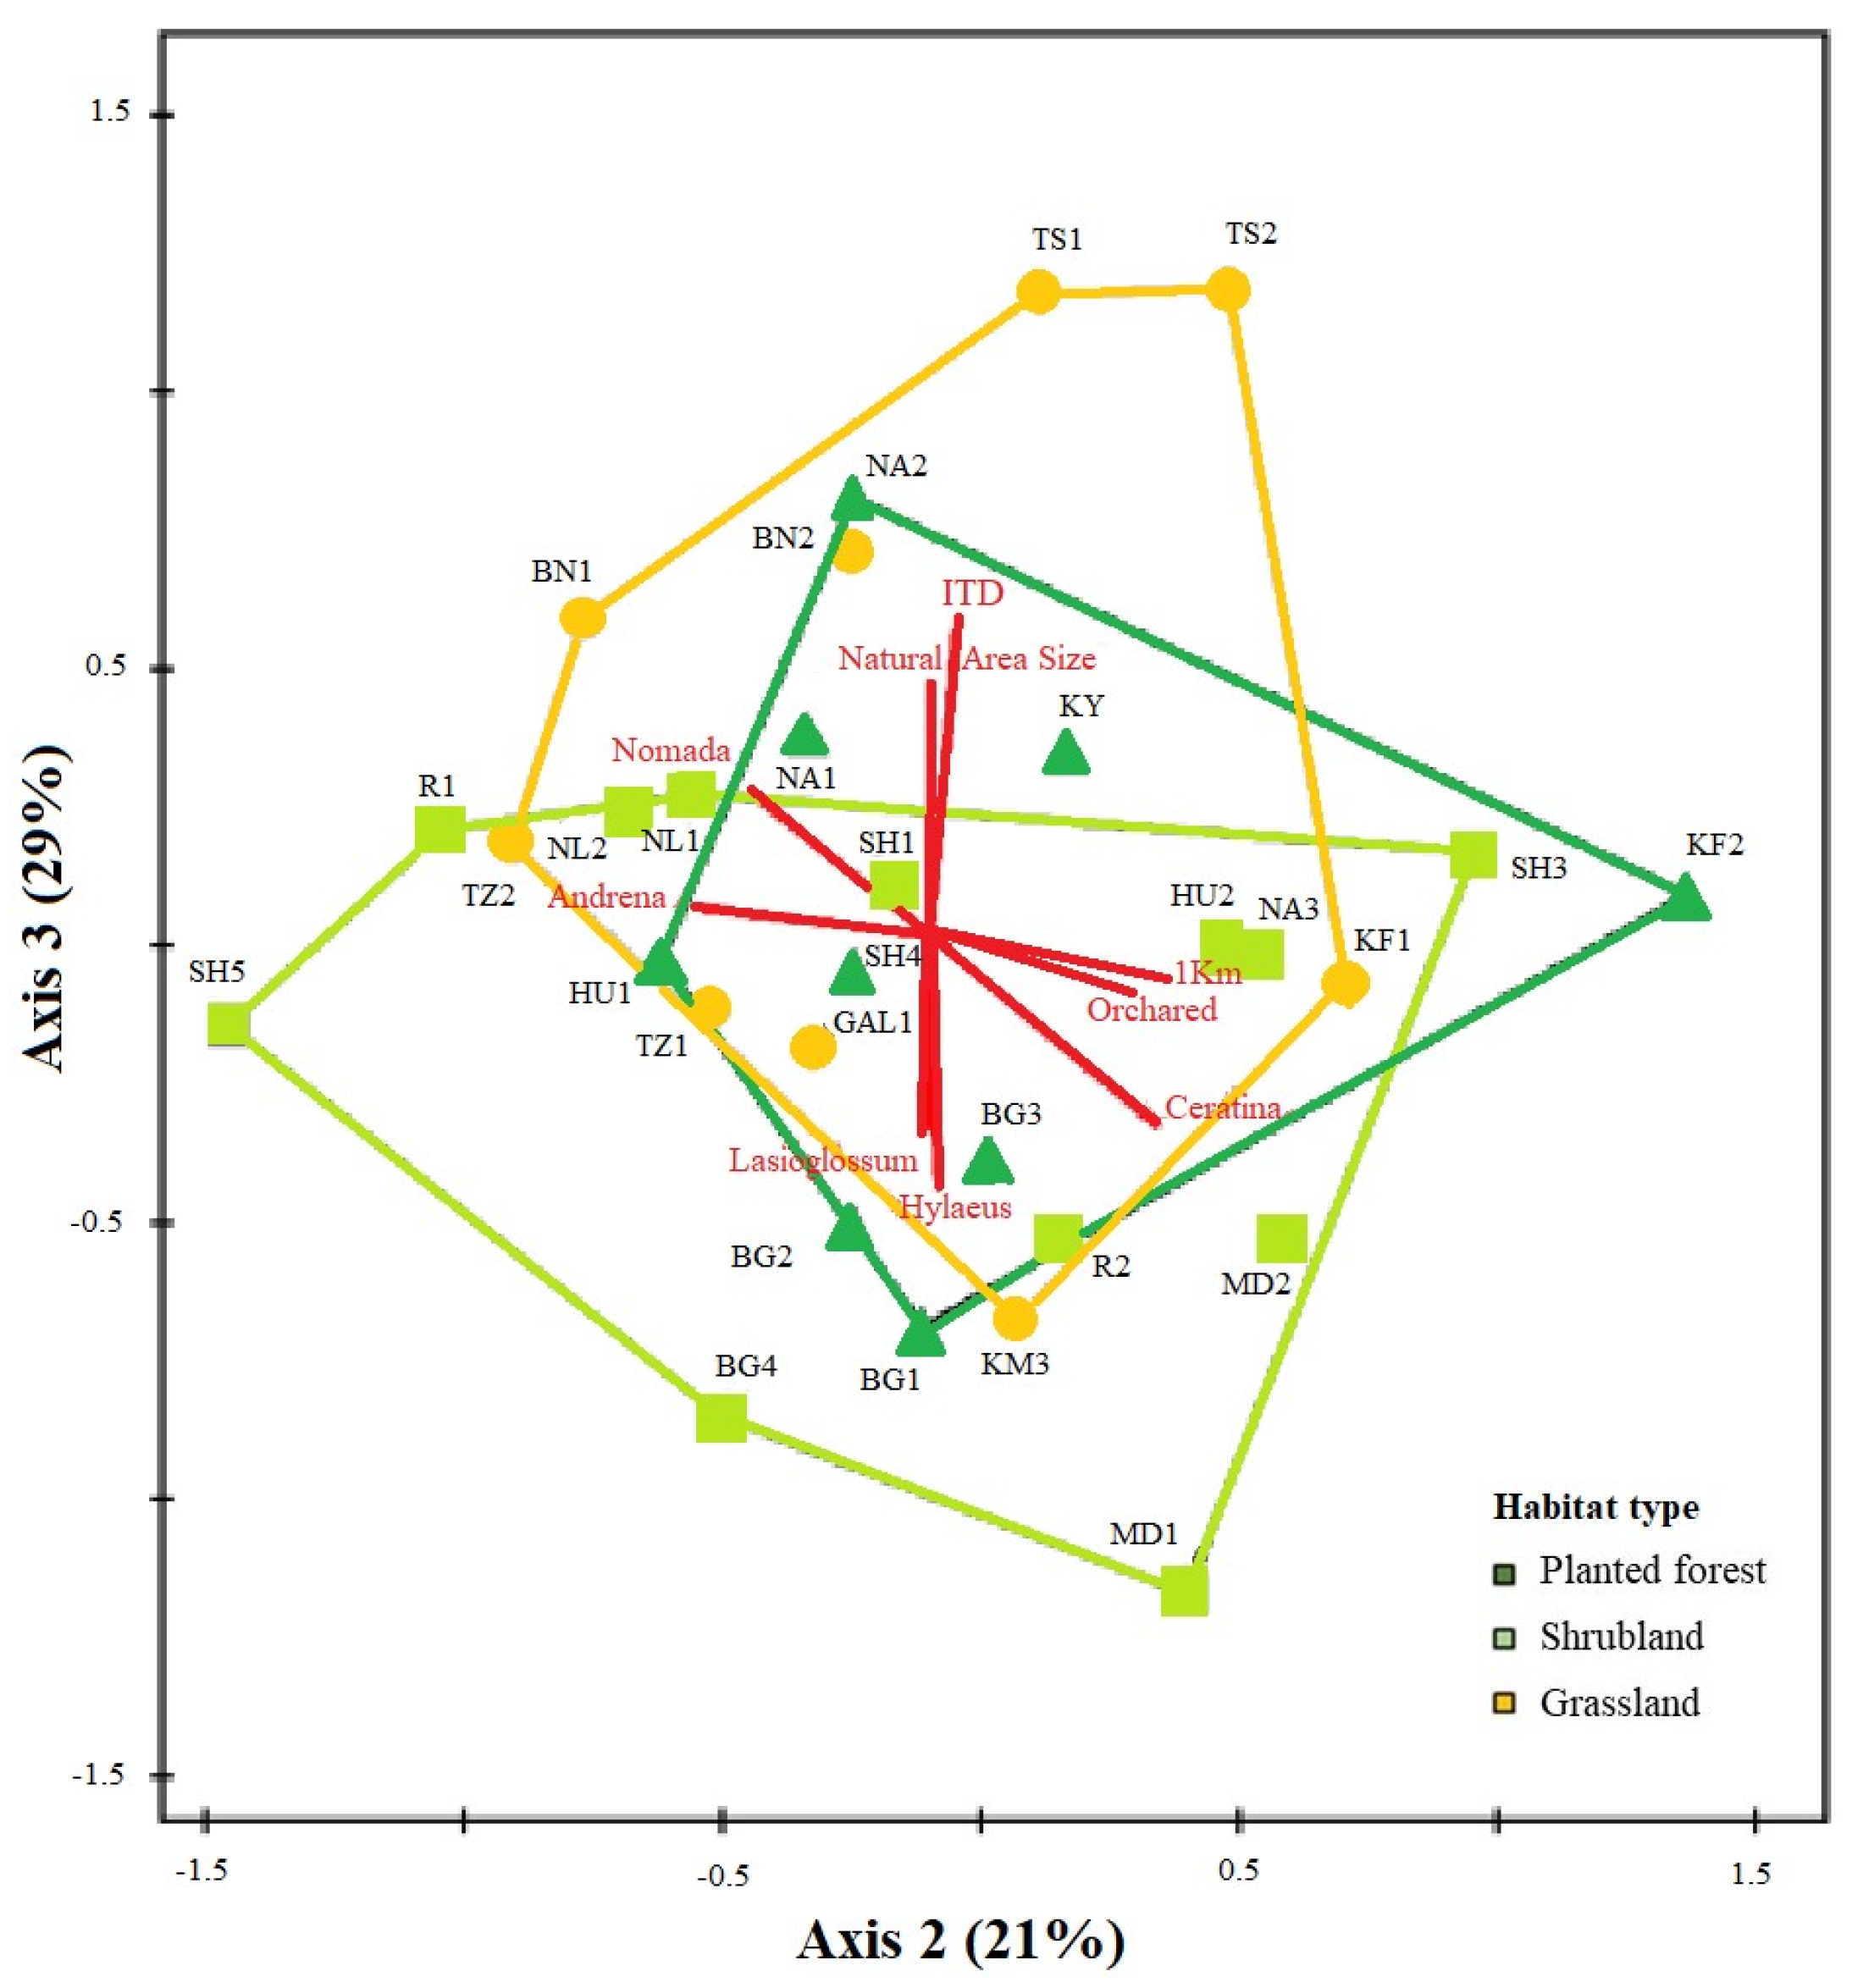
2.6.2. Wild Bee and Flower Species Composition

We performed a non-metric multidimensional scaling (NMS) to visualize patterns of bee and flower species composition. We used the Sorensen measure [45] and compared the obtained results using all the species. Ordinations with p-value < 0.05 and final stress < 20 were chosen and re-run five times each to determine consistency [46]. We investigated for correlation of environmental factors and dominant genus to bee composition. Multi-Response Permutation Procedures (MRPP) with the Sorensen measure were performed to determine whether wild bee and flower species composition varied significantly between habitat types; values close to 1 indicated high within-habitat similarity in species composition, compared to random site allocation. NMS and MRPP tests were performed in PC-ORD version 6.22 (McCune and Mefford 2011, Gleneden Beach, OR, USA).

3. Results

Overall, we collected 2355 wild bees of 253 species (99% of the specimens were identified to the species level; see Table S2 for species list), and we recorded 11,191 flowers/inflorescences of 130 plant species.

3.1. Local Habitat Characteristics

3.1.1. Microclimate

The uncultivated habitats did not differ in mean temperature (LME, χ2 = 3.05, p = 0.2) and wind velocity (LME, χ2 = −0.37, p = 0.7), while radiation intensity was higher in shrubland compared to planted forest plots (LME, χ2 = 6.01, p < 0.001).

3.1.2. Forage and Nesting Resources

Planted forests provided significantly lower number of flowering species and flower abundance compared to grasslands and shrublands (Figure 3A,B; GLMM; flower richness: χ2 = 8.7, p = 0.01; flower abundance: χ2 = 8.0, p = 0.01). The uncultivated habitats overlapped in their flowering species composition (MRPP A = 0.018, p = 0.018; Figure 3C); planted forests exhibited highest intra-habitat variation, while the grasslands had lowest variability. Twenty-two to 37.5% of flowering species were unique to only one uncultivated habitat type (Figure 3D) and only 18% (23 species) of these unique species were rare or very rare in the study area, according to Danin and Fragman-Sapir (2016 [47]). Twenty one percent of flowering species (28 species) were found in all uncultivated habitat types; all these species were common or very common in the study area [47].
The uncultivated habitats did not differ in percent cover of the main nesting substrates (plants: LME, χ2 = 0.9, p = 0.6; bare ground: LME, χ2 = 2.5, p = 0.2), nor in the Shannon–Weaver index for ground cover diversity (LME, χ2 = 2.8, p = 0.2). However, as expected, grasslands contained higher herbaceous cover compared to planted forests (Tukey, t = −2.7, p = 0.02) and lower woody cover compared to shrublands (Tukey, t = 4.5, p < 0.001). The total plant cover (herbaceous and woody) was highest in shrublands and lowest in planted forests (Tukey, t = −2.5, p = 0.04).

3.2. Bee Community

In all analyses of the bee community, no interaction was found between habitat type and landscape parameters, and it was therefore not included in the best-fitted models.

3.2.1. Bee Abundance and Species Richness

Bee abundance and species richness did not differ statistically among the three uncultivated habitats. Instead, these variables were best explained by the combined effects of local- and landscape-scale parameters—total plant cover (herbaceous and woody) and size of uncultivated areas within 100–400 m radii for bee abundance (three equivalent models; Table 1); total plant cover and size of uncultivated areas within 100–500 m for bee species richness (five equivalent models; Table 1).

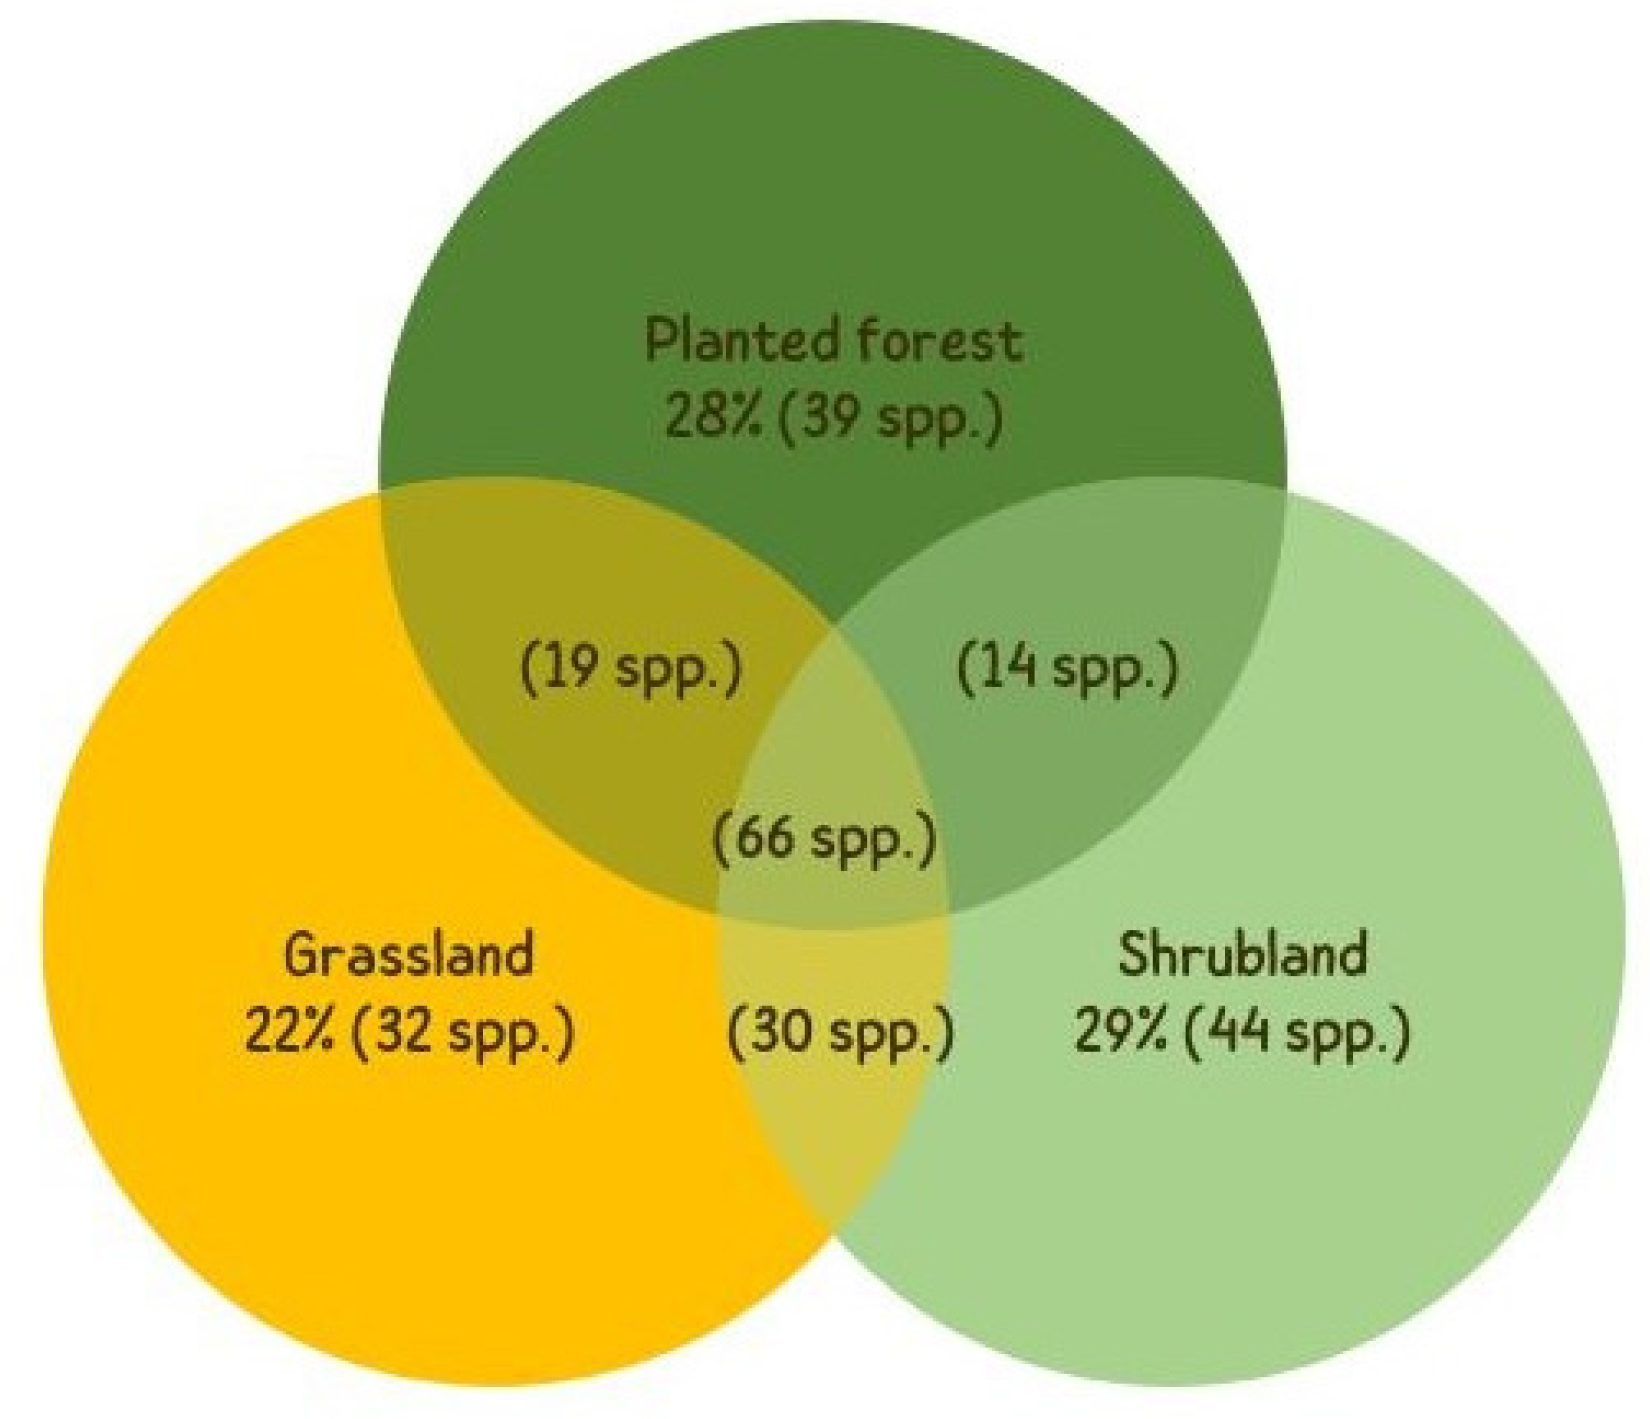
3.2.2. Bee Community Composition

Bee community composition was similar in the three uncultivated habitats, as visualized by their overlap in the NMS (Figure 4) and the low A value obtained in the MRPP (i.e., high within habitat variation in species composition; A = 0.01, p = 0.04). Bee composition was associated by landscape variables; highest correlations were obtained between bee species composition and the percentage of orchards (axis 1; r = 0.54), and non-cultivated habitats (axis 3; r = 0.54) within 1 km buffers, as well as bee body size (ITD) (axis 3; r = 0.66). Among the bee genera sampled, the ordination was strongly shaped by Andrena (axis 2; r = 0.52), Nomada (axis 2; r = 0.53), Lasioglossum (axis 3; r = 0.51), and Hylaeus (axis 3; r = 0.47).
Twenty-six percent of the sampled bee species (66 bee species, represented by 1611 individuals) were sampled in all habitat types; 45% of the sampled bee species (115 species) were unique to one habitat and were similarly spread between the three habitat types (Figure 5). Almost all of the habitat unique species (110 species out of 115 unique species in total) were rare species (present in less then 3 plots), and there was no significant difference in the proportion of unique/common species between habitat types (Fisher’s Exact Test, p = 0.64; Figure 5).

3.2.3. Bee Functional Traits

(a)
Nesting guild
The majority of sampled bees were ground-nesters (61.5% of bee species and 74% of sampled bees). The proportion of above-ground nesting bees was correlated with both local and landscape factors; their relative abundance was affected by woody cover, flower abundance, flower richness, and the percentage of uncultivated area within 300–400 m radii (Table 2); the proportion of above-ground nesting bee species was correlated with the percentage of uncultivated area within a 200 m radius and flower abundance.
  • (b) Sociality
Sampled bees were mostly solitary (89% of bees belonging to 207 species), whereas 4.8% (110 bees belonging to 7 species of Halictus and Lasioglossum) were primitive eusocial, and the remaining sampled bees (146 bees belonging to 39 species) were either cleptoparasitic bees or of unknown sociality. The relative abundance of primitive eusocial bees was not linked to local factors, and was marginaly linked to landscape factors (GLMM, habitat type:, χ2 = 0.6, p = 0.7, uncultivated area within 400 m: χ2 = 3.2, p = 0.07). The proportion of primitive eusocial bee species was too low to allow statistical modeling.
  • (c) Foraging guild (lecty)
Forty nine percent of the sampled bees were polylectic—generalist foragers (131 species), 40% were oligolectic—specialist foragers (66 species), and the rest were either cleptoparasites or of unknown foraging habitats. Both local and landscape factors were correlated with bees’ foraging guild distribution; the relative abundance and species richness of oligolectic bees were correlated with flower abundance, woody plants ground cover, and the percentage of uncultivated area within a 200 m radius (Table 3). The proportion of polylectic bee species was also correlated with both local (flower richness and abundance) and landscape elements (the percentage of uncultivated area within a 200 m radius).
  • (d) Tongue length and body size (ITD)
Sampled bees were mostly short-tongue (82% of species, 49% of bees) and of tiny to medium body size (ITD range 0.63–4.66 mm, median 1.9 mm). The calculated tongue length was correlated with flower abundance, and the proportion of long-tongue bee species was additionally correlated with total plant cover and the percentage of uncultivated area within a 100 m radius (Table 4). Bee body size (ITD) was correlated only with local scale factors, with positive relation to habitat patch size and flower abundance.

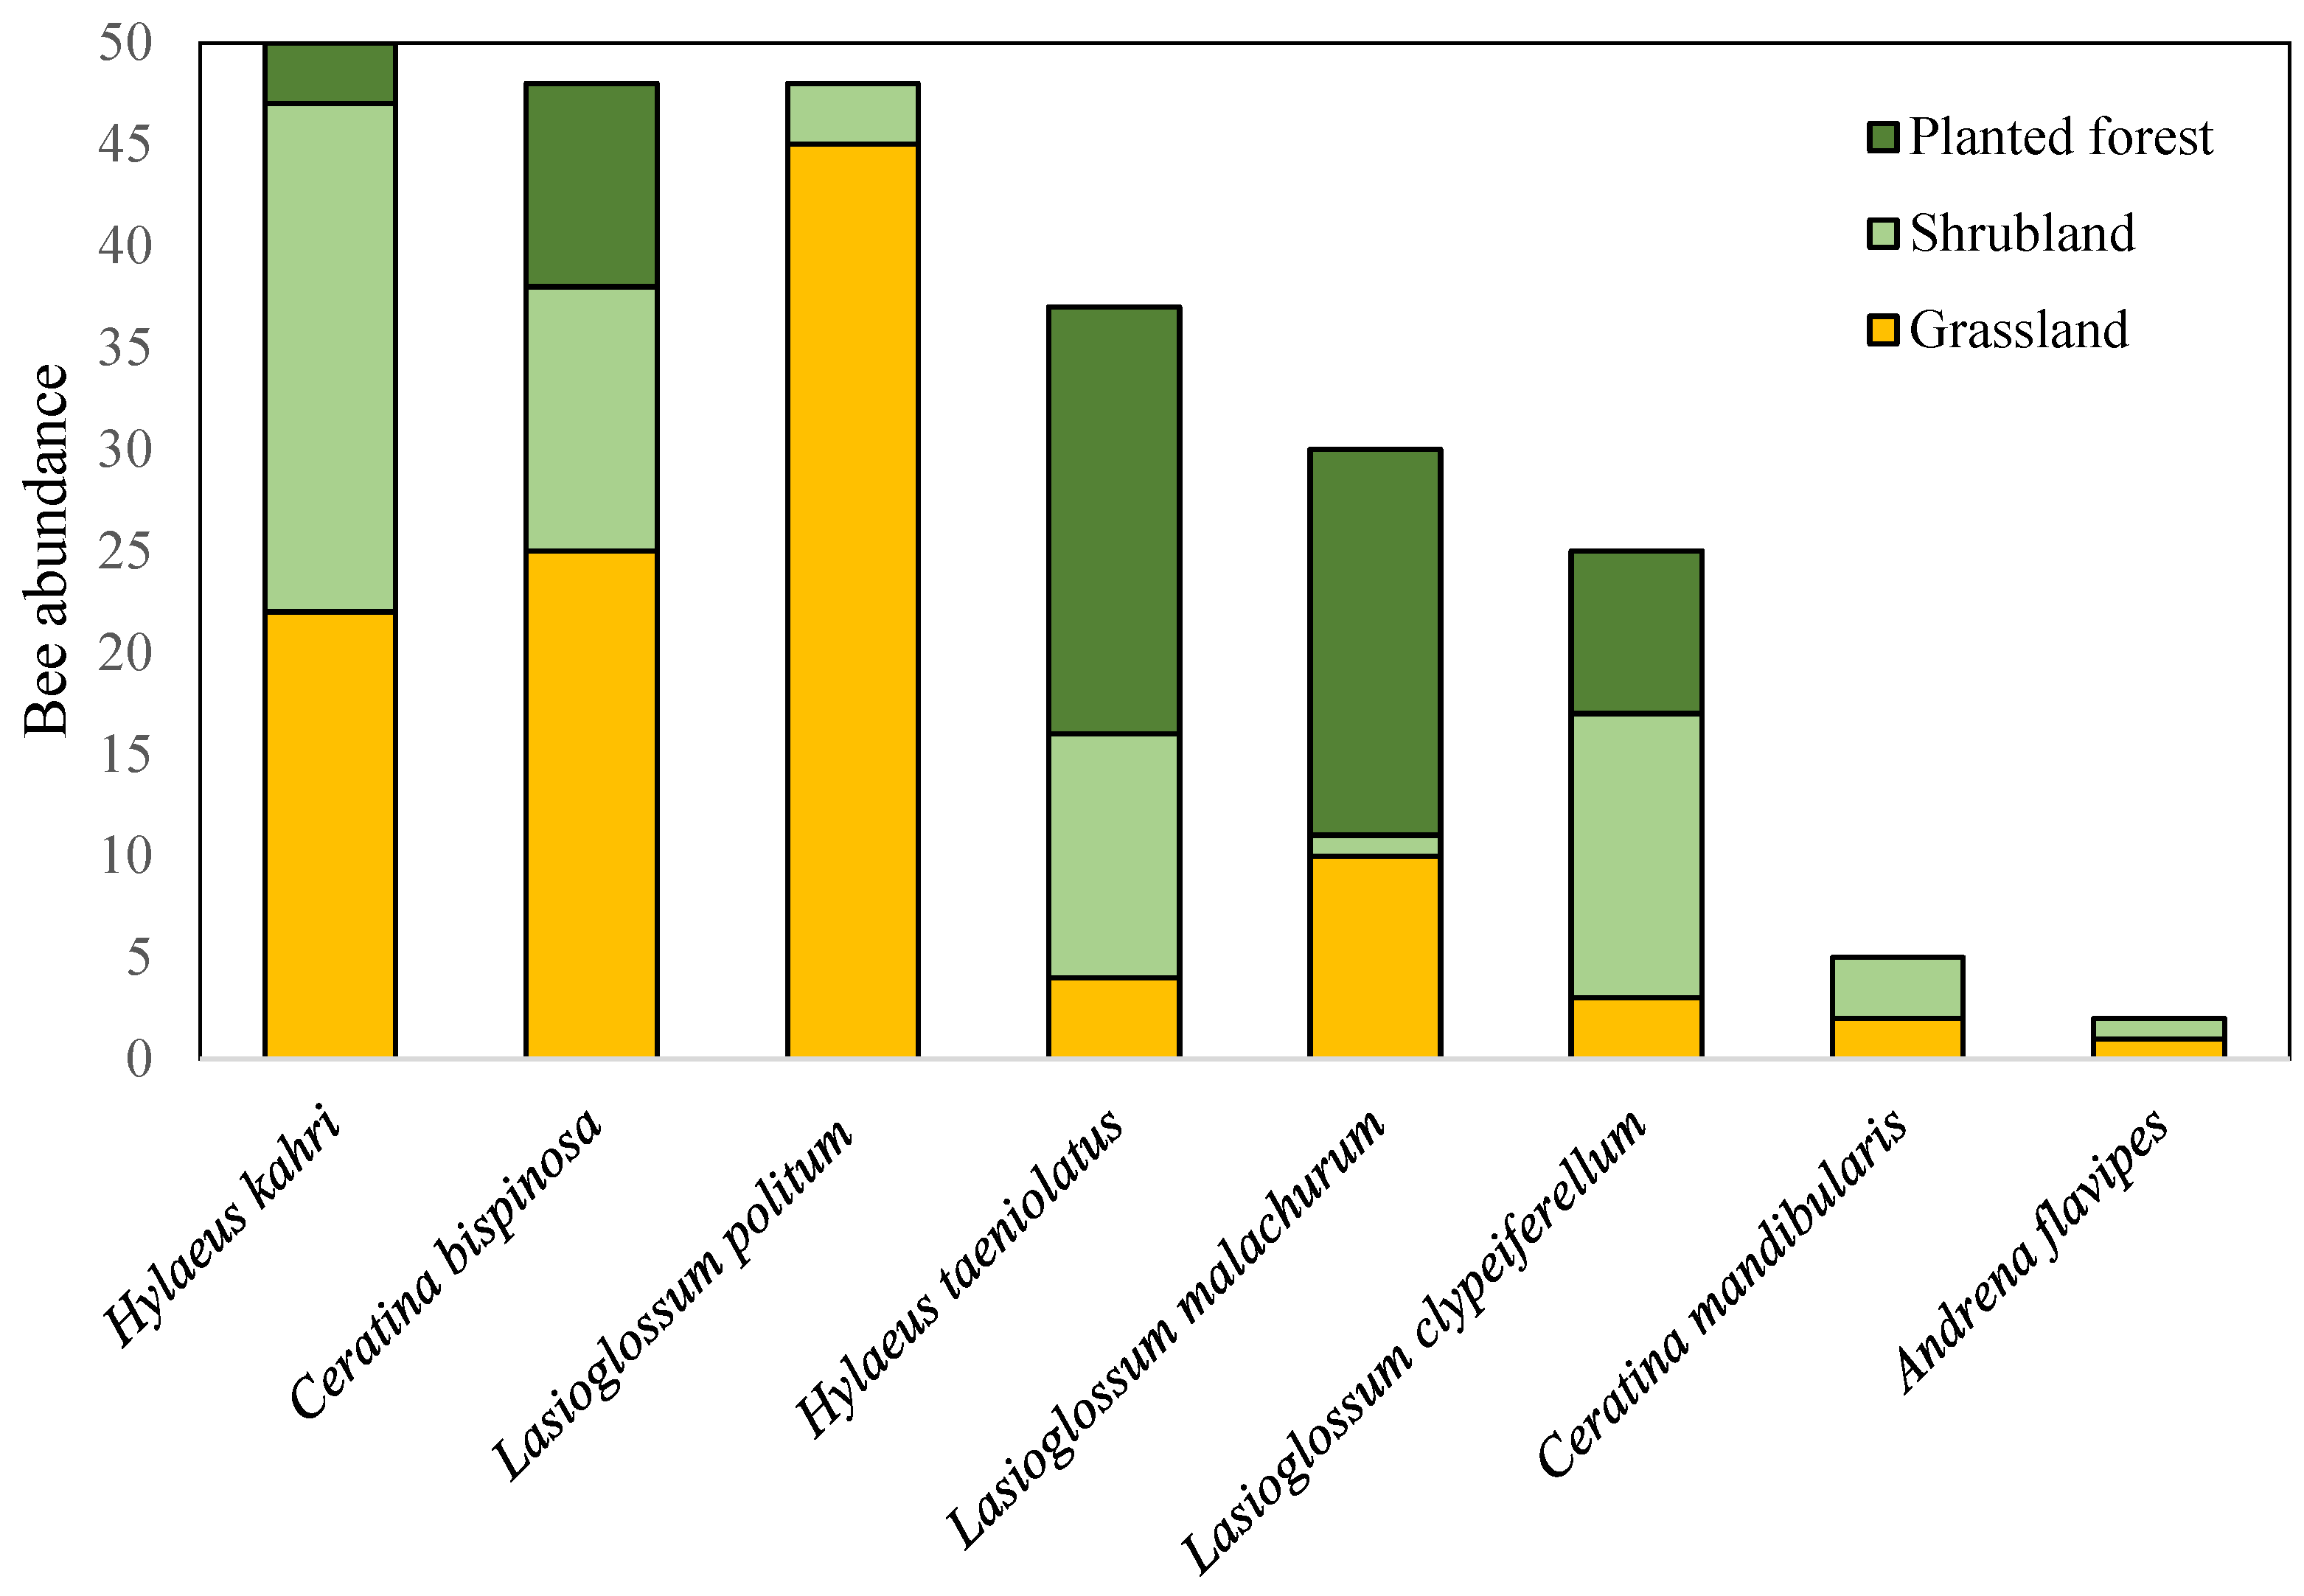
3.2.4. Crop Pollinators Species

We collected 249 bees of eight species which were described as crop pollinators and of high agricultural affinity ([34]; Figure 6). These species were found in all three habitat types, but at variable prevalence and abundance. No model described (ΔAIC < 2 with null model) the abundance and species richness of this group well.

4. Discussion

In this study of bee communities inhabiting uncultivated patches in semi-arid Mediterranean landscapes, we found that natural patches (shrublands and grasslands) differed from semi-natural (planted) patches in both physical structure and the provisioning of floral resources. The majority of bee community parameters were affected by both local- and landscape-scale characteristics, but no significant interaction was found between these scales. Local land-use effects were related mostly to the characteristics of plant communities, including their physical structure (ground cover) and the abundance and richness of flowering plants. The landscape effects varied between different bee community parameters and were mostly limited to a 400 m range; only bee species composition was significantly affected by factors at a relatively larger scale (1000 m). Most of the focal crop pollinators known to this region were found in the studied uncultivated patches, but their abundances varied considerably between patch type and pollinator species.
The planted patches were significantly different from the natural patches in both their biotic and abiotic conditions, having lower sun radiation, plant cover, and flower richness and abundance. All these factors significantly affect the physical structure and floral resource availability and composition of the planted vs. the natural patches. These differences are interesting because the planted patches were established more than 30 years ago, at low tree density (>15 m apart) and were not managed since. Consequently, local perennials were abundantly established between trees in these patches. Hence, habitat management actions in this ecosystem may have relatively long-lasting effects on plant communities, floral availability, and species composition in specific, and consequently on bee communities. Importantly, habitat type in itself was not included in bee models. Instead, local land-use characteristics, related to plant cover and to floral richness and abundance, were included in the models. This may highlight a broader pattern of greater precision in modeling of wild pollinators that could be obtained by converting categorical habitat classifications into continuous variables specifically reflecting resource availability and habitat structure [48].
Our bee sampling was conducted when the planted trees were not in bloom. Yet, when in bloom, these trees, and especially Eucalyptus trees, provide high amounts of nectar and pollen, also at times with low wild floral availability in these landscapes. Therefore, temporal complementarity in forage availability between the different habitat patches is plausible in these landscapes [21]. The findings that many flower species were unique to each habitat type further supports a possible complementarity between habitat patches in providing floral resources throughout the bee activity season in the system. However, temporal complementarity is beyond the scope of the current study and could not be assessed directly.
Bee abundance and species richness were similarly affected by the combined effects of local habitat characteristic (plant cover) and landscape land-use attributes (percentage of uncultivated area); uncultivated habitat patches with higher plant cover and surrounded by higher percentage of uncultivated land showed higher bee abundance and species richness. Surprisingly, we did not find a direct effect of local flower community characteristics on bee abundance and richness, as found in other Mediterranean studies conducted on field margins [27,28]. However, plant cover includes overall woody and herbaceous cover, so that higher plant cover is likely associated with extended temporal availability and diversity of forage resources in the studied patches. For both bee abundance and species richness, landscape effects were limited to relatively short ranges (400 and 500 m radii, respectively) and no differences were found across the tested scales. This result likely reflects the small-bodied bee fauna found in this study and in the region as a whole [34], with a limited foraging distance [38].
Unlike bee abundance and species richness, bee species composition was affected only by landscape scale factors, spatial ranges of land-use effects were relatively large (1 km) and included the extent of both uncultivated land and orchards within this range. Indeed, bee visitor composition varied considerably between almond orchards (the main orchard crop requiring pollinators in the study region) and other, cropped and non-cropped habitats [34]. Interestingly, species composition was also affected significantly by bee body size, which varied considerably among the four bee genera with highest impact on bee ordination, especially Hyleaus vs. Andrena, Nomada and Lasioglossum. While the three habitat patch types shared 27% of their bee species and overlapped in their overall bee species composition, each habitat type also maintained 13–19% unique rare bee species. This indicates a complementary contribution of the three uncultivated habitat types to the bee species pool of this system, as found in other Mediterranean agricultural systems [27]. The planted patches exhibited the highest intra-habitat variation in bee species composition, likely due to the difference in planted tree composition (eucalyptus, carob, and pine) and variation in their phenology and pollen and nectar provisioning.
Bee nesting and foraging guild composition were similarly affected by a combination of local and landscape variables, at limited spatial scales, and with no variation across spatial scales. However, the direction of these effects differed among traits. The relative abundance and species richness of above-ground nesters was affected negatively by local patch-scale flower abundance and the percentage of uncultivated land at 200–400 m radii. The relative abundance and species richness was positively affected by patch-scale woody cover and flower richness (only relative abundance). The negative effects of the landscape are harder to explain and might indirectly reflect lower availability of diverse above-ground nesting sites and resources, such as hollow twigs and stems, wood logs, preexisting burrows, and crevices in the uncultivated habitats. This notion is further supported by the positive effect of woody cover, plausibly reflecting its limited availability in the habitat patches. The negative effect of flower abundance, which is likely to be inversely related to woody cover, also supports this idea. Interestingly, the relative abundance and species richness of oligolectic bees showed opposite effects compared to the described patterns of above-ground nesters. A higher proportion of oligolectic bees and bee species were found at sites with higher flower abundance and proportion of uncultivated land at the landscape and lower woody cover. Taken together, these results may reflect, both directly and indirectly, variation in the availability of forage resources and the sensitivity of oligolectic bees to changes in land use [49,50,51]. As in many bee communities in agricultural landscapes, the distribution of sociality was skewed toward much higher proportion of solitary bees and bee species, so that the modeling of primitive eusocial bees could not be performed. Larger habitat patches with higher floral abundance sustained larger bees with longer tongues. This may reflect the larger resource uptake necessary for larger-bodied species, possibly associated also with tongue length (Megachilidae and Apidae bees in our study system were larger compared to the short-tongue bee taxa).
Eight of the 10 dominant crop pollinators described previously in this region (for almond, sunflower, and watermelon; refs. [34,40,41]) were found in the uncultivated patches. Yet, the absolute abundance of the different species varied considerably, as well as their relative abundance in the three habitat types, with no clear pattern of habitat preference. The overall and per-plot-abundance of these agrobiont species was probably too low for our analyses. We can therefore conclude that crop pollinators inhabit uncultivated patches, and likely spill-over to nearby fields when crop is in bloom. However, additional research is needed to gain a better understanding of the factors that shape crop pollinators’ abundance and richness in these uncultivated patches and across agricultural lanscapes as a whole.

5. Conclusions

This study shows the important role of uncultivated habitat patches, shrubland and grassland in particular, in providing floral and nesting resources for bees, and supporting diverse and abundant wild bee communities in agricultural landscapes. The studied natural and semi-natural habitats were found to be important both locally, by providing wild bees with nesting and foraging resources, and at larger spatial scales, where they create resource-landscapes for the bees. Unique flower and bee species found in each type of these uncultivated habitats highlight their complementarity and collective conservation value. Bee communities inhabiting the uncultivated patches include species with high agricultural affinity and high potential to significantly contribute to crop pollination. Agricultural fields adjacent to uncultivated habitats and surrounded by uncultivated habitats at larger spatial scales are likely to receive substantial crop pollination services compared with fields lacking these elements. Hence, in Mediterranean agricultural landscapes, maintaining patches with natural and semi-natural vegetation, primarily on marginal lands not suitable for crop production, is expected to promote the conservation of wild bee communities and increase crop pollination services. Further investigations are needed to quantify the effect of such approach on other taxa and ecosystem services/disservices-providing organisms.

Supplementary Materials

The following supporting information can be downloaded at: https://www.mdpi.com/article/10.3390/d15020294/s1, Figure S1: Photos of representative study sites (A) grasslands (B) shrublands (C) planted forests; Figure S2: Study plot set up (not to scale); Table S1: Study plot information; Table S2: Bee species sampled in the study, grouped by families.

Author Contributions

Conceptualization, T.R., Y.M. and M.C.; Methodology, T.R., Y.M. and M.C.; Formal Analysis, T.R. and Y.M.; Investigation, T.R.; Resources, Y.M. and M.C.; Data Curation, T.R.; Writing–Original Draft Preparation, T.R.; Writing–Review & Editing, Y.M. and M.C.; Visualization, T.R. and Y.M.; Supervision, Y.M. and M.C.; Project Administration, Y.M.; Funding Acquisition, Y.M. and M.C. All authors have read and agreed to the published version of the manuscript.

Funding

Roth’s scholarship was funded by the KKL-JNF Appelby program, and by the Women’s League for Israel.

Institutional Review Board Statement

Not applicable.

Data Availability Statement

The data presented in this study are available on Tables S1 and S2; additional data are available on request from the corresponding author.

Acknowledgments

We wish to thank Holger Dathe, Achik Dorchin, Michael Kuhlmann, Andreas Müller, Sébastien Patiny, Alain Pauly, Gideon Pisanty, and Michael Terzo for bee identification.

Conflicts of Interest

The authors declare no conflict of interest.

References

  1. Jackson, L.E.; Brussaard, L.; de Ruiter, P.C.; Pascual, U.; Perrings, C.; Bawa, K. Agrobiodiversity. In Encyclopedia of Biodiversity, 2nd ed.; Levin, S.A., Ed.; Academic Press: Waltham, MA, USA, 2013; pp. 126–135. [Google Scholar]
  2. Lichtenberg, E.M.; Kennedy, C.M.; Kremen, C.; Batáry, P.; Berendse, F.; Bommarco, R.; Bosque-Pérez, N.A.; Carvalheiro, L.G.; Snyder, W.E.; Williams, N.M.; et al. A global synthesis of the effects of diversified farming systems on arthropod diversity within fields and across agricultural landscapes. Glob. Chang. Biol. 2017, 23, 4946–4957. [Google Scholar] [CrossRef] [PubMed] [Green Version]
  3. Estrada-Carmona, N.; Sánchez, A.C.; Remans, R.; Jones, S.K. Complex agricultural landscapes host more biodiversity than simple ones: A global meta-analysis. Proc. Natl. Acad. Sci. USA 2022, 119, e2203385119. [Google Scholar] [CrossRef] [PubMed]
  4. Ollerton, J.; Winfree, R.; Tarrant, S. How many flowering plants are pollinated by animals? Oikos 2011, 120, 321–326. [Google Scholar] [CrossRef]
  5. Klein, A.-M.; Vaissière, B.E.; Cane, J.H.; Steffan-Dewenter, I.; Cunningham, S.A.; Kremen, C.; Tscharntke, T. Importance of pollinators in changing landscapes for world crops. Proc. R. Soc. B Biol. Sci. 2007, 274, 303–313. [Google Scholar] [CrossRef] [PubMed] [Green Version]
  6. Eilers, E.J.; Kremen, C.; Greenleaf, S.; Garber, A.K.; Klein, A.-M. Contribution of Pollinator-Mediated Crops to Nutrients in the Human Food Supply. PLoS ONE 2011, 6, e21363. [Google Scholar] [CrossRef] [PubMed]
  7. Brittain, C.; Kremen, C.; Garber, A.; Klein, A.-M. Pollination and Plant Resources Change the Nutritional Quality of Almonds for Human Health. PLoS ONE 2014, 9, e90082. [Google Scholar] [CrossRef] [PubMed] [Green Version]
  8. Klatt, B.K.; Holzschuh, A.; Westphal, C.; Clough, Y.; Smit, I.; Pawelzik, E.; Tscharntke, T. Bee pollination improves crop quality, shelf life and commercial value. Proc. R. Soc. B Biol. Sci. 2014, 281, 20132440. [Google Scholar] [CrossRef]
  9. Garibaldi, L.A.; Steffan-Dewenter, I.; Winfree, R.; Aizen, M.A.; Bommarco, R.; Cunningham, S.A.; Kremen, C.; Carvalheiro, L.G.; Harder, L.D.; Afik, O.; et al. Wild Pollinators Enhance Fruit Set of Crops Regardless of Honey Bee Abundance. Science 2013, 339, 1608–1611. [Google Scholar] [CrossRef]
  10. Kennedy, C.M.; Lonsdorf, E.; Neel, M.C.; Williams, N.M.; Ricketts, T.H.; Winfree, R.; Bommarco, R.; Brittain, C.; Burley, A.L.; Cariveau, D.; et al. A global quantitative synthesis of local and landscape effects on wild bee pollinators in agroecosystems. Ecol. Lett. 2013, 16, 584–599. [Google Scholar] [CrossRef]
  11. Senapathi, D.; Fründ, J.; Albrecht, M.; Garratt, M.P.D.; Kleijn, D.; Pickles, B.J.; Potts, S.G.; An, J.; Andersson, G.K.S.; Bänsch, S.; et al. Wild insect diversity increases inter-annual stability in global crop pollinator communities. Proc. R. Soc. B Biol. Sci. 2021, 288, 20210212. [Google Scholar] [CrossRef]
  12. Potts, S.G.; Biesmeijer, J.C.; Kremen, C.; Neumann, P.; Schweiger, O.; Kunin, W.E. Global pollinator declines: Trends, impacts and drivers. Trends Ecol. Evol. 2010, 25, 345–353. [Google Scholar] [CrossRef] [PubMed]
  13. Koh, I.; Lonsdorf, E.V.; Williams, N.M.; Brittain, C.; Isaacs, R.; Gibbs, J.; Ricketts, T.H. Modeling the status, trends, and impacts of wild bee abundance in the United States. Proc. Natl. Acad. Sci. USA 2016, 113, 140–145. [Google Scholar] [CrossRef] [PubMed] [Green Version]
  14. Bartomeus, I.; Ascher, J.S.; Gibbs, J.; Danforth, B.N.; Wagner, D.L.; Hedtke, S.M.; Winfree, R. Historical changes in northeastern US bee pollinators related to shared ecological traits. Proc. Natl. Acad. Sci. USA 2013, 110, 4656–4660. [Google Scholar] [CrossRef] [PubMed] [Green Version]
  15. Carvalheiro, L.G.; Kunin, W.E.; Keil, P.; Aguirre-Gutiérrez, J.; Ellis, W.N.; Fox, R.; Groom, Q.; Hennekens, S.; Van Landuyt, W.; Maes, D.; et al. Species richness declines and biotic homogenisation have slowed down for NW-European pollinators and plants. Ecol. Lett. 2013, 16, 870–878. [Google Scholar] [CrossRef] [Green Version]
  16. Winfree, R.; Aguilar, R.; Vazquez, D.P.; LeBuhn, G.; Aizen, M.A. A meta-analysis of bees’ responses to anthropogenic disturbance. Ecology 2009, 90, 2068–2076. [Google Scholar] [CrossRef]
  17. Ollerton, J.; Erenler, H.; Edwards, M.; Crockett, R. Extinctions of aculeate pollinators in Britain and the role of large-scale agricultural changes. Science 2014, 346, 1360–1362. [Google Scholar] [CrossRef] [Green Version]
  18. Brown, M.J.F.; Dicks, L.V.; Paxton, R.J.; Baldock, K.C.R.; Barron, A.B.; Chauzat, M.-P.; Freitas, B.M.; Goulson, D.; Jepsen, S.; Kremen, C.; et al. A horizon scan of future threats and opportunities for pollinators and pollination. PeerJ 2016, 4, e2249. [Google Scholar] [CrossRef] [Green Version]
  19. Dicks, L.V.; Breeze, T.D.; Ngo, H.T.; Senapathi, D.; An, J.; Aizen, M.A.; Basu, P.; Buchori, D.; Galetto, L.; Garibaldi, L.A.; et al. A global-scale expert assessment of drivers and risks associated with pollinator decline. Nat. Ecol. Evol. 2021, 5, 1453–1461. [Google Scholar] [CrossRef]
  20. Kleijn, D.; van Langevelde, F. Interacting effects of landscape context and habitat quality on flower visiting insects in agricultural landscapes. Basic Appl. Ecol. 2006, 7, 201–214. [Google Scholar] [CrossRef]
  21. Mandelik, Y.; Winfree, R.; Neeson, T.; Kremen, C. Complementary habitat use by wild bees in agro-natural landscapes. Ecol. Appl. 2012, 22, 1535–1546. [Google Scholar] [CrossRef]
  22. Hannon, L.E.; Sisk, T.D. Hedgerows in an agri-natural landscape: Potential habitat value for native bees. Biol. Conserv. 2009, 142, 2140–2154. [Google Scholar] [CrossRef]
  23. Morandin, L.A.; Kremen, C. Hedgerow restoration promotes pollinator populations and exports native bees to adjacent fields. Ecol. Appl. 2013, 23, 829–839. [Google Scholar] [CrossRef] [PubMed] [Green Version]
  24. Campbell, A.J.; Wilby, A.; Sutton, P.; Wäckers, F.L. Do sown flower strips boost wild pollinator abundance and pollination services in a spring-flowering crop? A case study from UK cider apple orchards. Agric. Ecosyst. Environ. 2017, 239, 20–29. [Google Scholar] [CrossRef] [Green Version]
  25. Albrecht, M.; Kleijn, D.; Williams, N.M.; Tschumi, M.; Blaauw, B.R.; Bommarco, R.; Campbell, A.J.; Dainese, M.; Drummond, F.A.; Entling, M.H.; et al. The effectiveness of flower strips and hedgerows on pest control, pollination services and crop yield: A quantitative synthesis. Ecol. Lett. 2020, 23, 1488–1498. [Google Scholar] [CrossRef] [PubMed]
  26. Cole, L.J.; Kleijn, D.; Dicks, L.V.; Stout, J.C.; Potts, S.G.; Albrecht, M.; Balzan, M.V.; Bartomeus, I.; Bebeli, P.J.; Bevk, D.; et al. A critical analysis of the potential for EU Common Agricultural Policy measures to support wild pollinators on farmland. J. Appl. Ecol. 2020, 57, 681–694. [Google Scholar] [CrossRef] [PubMed]
  27. Sanchez, J.A.; Carrasco, A.; La Spina, M.; Pérez-Marcos, M.; Ortiz-Sánchez, F.J. How Bees Respond Differently to Field Margins of Shrubby and Herbaceous Plants in Intensive Agricultural Crops of the Mediterranean Area. Insects 2020, 11, 26. [Google Scholar] [CrossRef] [Green Version]
  28. Morrison, J.; Izquierdo, J.; Plaza, E.H.; González-Andújar, J.L. The role of field margins in supporting wild bees in Mediterranean cereal agroecosystems: Which biotic and abiotic factors are important? Agric. Ecosyst. Environ. 2017, 247, 216–224. [Google Scholar] [CrossRef]
  29. McKechnie, I.M.; Thomsen, C.J.M.; Sargent, R.D. Forested field edges support a greater diversity of wild pollinators in lowbush blueberry (Vaccinium angustifolium). Agric. Ecosyst. Environ. 2017, 237, 154–161. [Google Scholar] [CrossRef]
  30. Pywell, R.F.; Warman, E.A.; Carvell, C.; Sparks, T.H.; Dicks, L.V.; Bennett, D.; Wright, A.; Critchley, C.N.R.; Sherwood, A. Providing foraging resources for bumblebees in intensively farmed landscapes. Biol. Conserv. 2005, 121, 479–494. [Google Scholar] [CrossRef]
  31. Raderschall, C.A.; Bommarco, R.; Lindström, S.A.M.; Lundin, O. Landscape crop diversity and semi-natural habitat affect crop pollinators, pollination benefit and yield. Agric. Ecosyst. Environ. 2021, 306, 107189. [Google Scholar] [CrossRef]
  32. Neumüller, U.; Burger, H.; Krausch, S.; Blüthgen, N.; Ayasse, M. Interactions of local habitat type, landscape composition and flower availability moderate wild bee communities. Landsc. Ecol. 2020, 35, 2209–2224. [Google Scholar] [CrossRef]
  33. Mandelik, Y.; Dayan, T.; Chikatunov, V.; Kravchenko, V. Reliability of a Higher-Taxon Approach to Richness, Rarity, and Composition Assessments at the Local Scale. Conserv. Biol. 2007, 21, 1506–1515. [Google Scholar] [CrossRef] [PubMed]
  34. Pisanty, G.; Mandelik, Y. Profiling crop pollinators: Life history traits predict habitat use and crop visitation by Mediterranean wild bees. Ecol. Appl. 2015, 25, 742–752. [Google Scholar] [CrossRef] [PubMed]
  35. Weizel, Y.; Polak, G.; Cohen, Y. Ecology of the Vegetation in Israel; The Ecology Branch, Tel Aviv University: Tel Aviv, Israel, 1978. [Google Scholar]
  36. Westphal, C.; Bommarco, R.; Carre, G.; Lamborn, E.; Morison, N.; Petanidou, T.; Potts, S.G.; Roberts, S.P.M.; Szentgyorgyi, H.; Tscheulin, T.; et al. Measuring bee diversity in different european habitats and biogeographical regions. Ecol. Monogr. 2008, 78, 653–671. [Google Scholar] [CrossRef] [Green Version]
  37. Williams, N.M.; Crone, E.E.; Roulston, T.a.H.; Minckley, R.L.; Packer, L.; Potts, S.G. Ecological and life-history traits predict bee species responses to environmental disturbances. Biol. Conserv. 2010, 143, 2280–2291. [Google Scholar] [CrossRef]
  38. Greenleaf, S.S.; Williams, N.M.; Winfree, R.; Kremen, C. Bee foraging ranges and their relationship to body size. Oecologia 2007, 153, 589–596. [Google Scholar] [CrossRef]
  39. Cariveau, D.P.; Nayak, G.K.; Bartomeus, I.; Zientek, J.; Ascher, J.S.; Gibbs, J.; Winfree, R. The Allometry of Bee Proboscis Length and Its Uses in Ecology. PLoS ONE 2016, 11, e0151482. [Google Scholar] [CrossRef] [PubMed] [Green Version]
  40. Pisanty, G.; Klein, A.-M.; Mandelik, Y. Do wild bees complement honeybee pollination of confection sunflowers in Israel? Apidologie 2014, 45, 235–247. [Google Scholar] [CrossRef]
  41. Pisanty, G.; Afik, O.; Wajnberg, E.; Mandelik, Y. Watermelon pollinators exhibit complementarity in both visitation rate and single-visit pollination efficiency. J. Appl. Ecol. 2016, 53, 360–370. [Google Scholar] [CrossRef] [Green Version]
  42. Bolker, B.M.; Brooks, M.E.; Clark, C.J.; Geange, S.W.; Poulsen, J.R.; Stevens, M.H.H.; White, J.-S.S. Generalized linear mixed models: A practical guide for ecology and evolution. Trends Ecol. Evol. 2009, 24, 127–135. [Google Scholar] [CrossRef]
  43. Harrison, X.A. Using observation-level random effects to model overdispersion in count data in ecology and evolution. PeerJ 2014, 2, e616. [Google Scholar] [CrossRef] [Green Version]
  44. Johnson, J.B.; Omland, K.S. Model selection in ecology and evolution. Trends Ecol. Evol. 2004, 19, 101–108. [Google Scholar] [CrossRef]
  45. Magurran, A.E. Measuring Biological Diversity; Wiley-Blackwell: Hoboken, NJ, USA, 2004. [Google Scholar]
  46. Peck, J.E. Multivariate Analysis for Ecologists: Step-by-Step, 2nd ed.; MjM Software Design: Gleneden Beach, OR, USA, 2016. [Google Scholar]
  47. Danin, A.O. Fragman-Sapir. Flora of Israel. Available online: http://flora.org.il/en/plants (accessed on 1 January 2023).
  48. Schmid, B.; Nottebrock, H.; Esler, K.J.; Pagel, J.; Pauw, A.; Böhning-Gaese, K.; Schurr, F.M.; Schleuning, M. Responses of nectar-feeding birds to floral resources at multiple spatial scales. Ecography 2016, 39, 619–629. [Google Scholar] [CrossRef]
  49. Biesmeijer, J.C.; Roberts, S.P.M.; Reemer, M.; Ohlemüller, R.; Edwards, M.; Peeters, T.; Schaffers, A.P.; Potts, S.G.; Kleukers, R.; Thomas, C.D.; et al. Parallel Declines in Pollinators and Insect-Pollinated Plants in Britain and the Netherlands. Science 2006, 313, 351. [Google Scholar] [CrossRef] [PubMed]
  50. Winfree, R. The conservation and restoration of wild bees. Ann. N. Y. Acad. Sci. 2010, 1195, 169–197. [Google Scholar] [CrossRef] [PubMed]
  51. De Palma, A.; Kuhlmann, M.; Roberts, S.P.M.; Potts, S.G.; Börger, L.; Hudson, L.N.; Lysenko, I.; Newbold, T.; Purvis, A. Ecological traits affect the sensitivity of bees to land-use pressures in European agricultural landscapes. J. Appl. Ecol. 2015, 52, 1567–1577. [Google Scholar] [CrossRef] [PubMed] [Green Version]
Figure 1. Study plot types along the gradient of the percentage of natural area within a 300 m radius buffer (from lowest to highest). Numbers on top of bars represent number of bee species collected in each plot. The order of plots and habitat type distribution along the land-use gradient were similar in the other tested radii (see Table S1).
Diversity 15 00294 g001
Figure 2. The study system: (A) Location in central Israel; (B) the studied landscape, land-use classification, and the spread of plots sampled each year; (C) two study plots at contrasting land-use context. See Table S1 for plot information.
Diversity 15 00294 g002
Figure 3. Uncultivated habitat characteristics: (A) Mean (±SE) flower abundance (columns with different letters differ significantly at p < 0.05; GLMM analysis); (B) mean (±SE) flower species richness; (C) flower species composition (based on NMS; p < 0.01, Stress = 15.1, three dimension, 45.9% of variance explained); and (D) shared vs. unique flower species in the three habitats (the unique species are of the total number of species per habitat type; n = 9 for the shrubland and planted forest, n = 12 for the grassland).
Diversity 15 00294 g003
Figure 4. Bee species composition in the three uncultivated habitats based on NMS ordination, and vectors of correlated environmental variables (in red): the percentage of orchards and uncultivated habitats (Natural Area Size) within 1 km radius buffers, bee body size (ITD), and dominant bee genera. Three dimensions; p < 0.01, Stress = 16.3, 60% of variance explained.
Diversity 15 00294 g004
Figure 5. Shared vs. unique bee species in the three uncultivated habitats. The unique species are of total number of species per habitat type (n = 9 for the shrubland and planted forest, n = 12 for the grassland).
Diversity 15 00294 g005
Figure 6. Crop pollinator abundance in the different uncultivated habitats.
Diversity 15 00294 g006
Table 1. Best-fitted GLMM models (ΔAIC < 2) for wild bee abundance and species richness. Each equivalent model includes total plant cover (herbaceous and woody at the plot scale) + uncultivated area in a specific buffer range (100/300/400 m radii for bee abundance; 100/200/300/400/500 m radii for bee richness).
Model Parameters100 m200 m300 m400 m500 m
p2)p2)p2)p2)p2)
Bee abundance
Total plant cover (%)0.01 (6.2) 0.003 (8.7)0.003 (8.4)
Uncultivated area (%)0.02 (4.9) 0.03 (4.5)0.04 (3.9)
Bee species richness
Total plant cover (%)0.01 (5.8)0.004 (8.2)0.003 (8.3)0.003 (8.3)0.004 (8.1)
Uncultivated area (%)0.03 (4.7)0.04 (3.9)0.01 (5.7)0.02 (5.4)0.03 (4.5)
Table 2. Best-fitted GLMM models (ΔAIC < 2) for the proportion of above-ground nesting bees and bee species.
Modeled VariablesModel (ΔAIC, Weight) and Explanatory Variables
(− with Negative Effect; + with Positive Effect)
χ2p
Relative abundance of above-ground nesting beesBest-fitted model: (ΔAIC = 0, Weight = 0.32)19.5<0.001
Flower abundance (−)31<0.001
Alternative model: (ΔAIC = 0.5, weight = 0.25)
Flower abundance (−)29.8<0.001
Flower richness (+)2.90.08
Woody cover (%)13.6<0.001
Alternative model: (ΔAIC = 0.5, Weight = 0.25)
Flower abundance (−)20.2<0.001
Woody cover (%) (+)26.4<0.001
Uncultivated area within a 300 m radius (−)2.90.08
Alternative model: (ΔAIC = 1.1, Weight = 0.18)
Flower abundance (−)20.6<0.001
Woody cover (%) (+)27.6<0.001
Uncultivated area within a 400 m radius (−)2.20.1
Proportion of above-ground nesting bee speciesBest-fitted model: (ΔAIC = 0, Weight = 0.54)
Uncultivated area within a 200 m radius (−)5.50.02
Alternative model: (ΔAIC = 0.3, Weight = 0.46)
Flower abundance (−)2.80.09
Uncultivated area within a 200 m radius (−)4.80.02
Table 3. Best-fitted GLMM models (ΔAIC < 2) for the relative abundance of oligolectic bees, and for the proportion of oligolectic and polylectic bee species.
Explained Variables, Model TypeModel (ΔAIC, Weight)/Explanatory Variables
(− Negative Effect; + Positive Effect)
χ2p
Relative abundance of oligolectic bees
GLMM, Poisson
Best-fitted model: (ΔAIC = 0, Weight = 0.36)
Flower abundance (+)13.9<0.001
Habitat type6.70.07
Proportion of oligolectic bee species
GLMM, Poisson
Best-fitted model: (ΔAIC = 0, Weight = 0.51)
Woody cover % (−)6.60.01
Uncultivated area within a 200 m radius (+)6.60.02
Alternative model: (ΔAIC = 0.1, Weight = 0.49)
Flower abundance (+)5.40.01
Proportion of polylectic bee species
GLMM, Binomial
Best-fitted model: (ΔAIC = 0, Weight = 0.38)
Flower richness (−)6.9<0.001
Alternative model: (ΔAIC = 0.7, Weight = 0.28)
Flower abundance (−)6.20.01
Alternative model: (ΔAIC = 1.4 Weight = 0.19)
Flower abundance (−)5.70.01
Uncultivated area within a 200 m radius (−)2.40.11
Table 4. Best-fitted LME and GLMM models (ΔAIC < 2) for calculated tongue length distribution, proportion of long tongue bee species, and inter-tegular distance (ITD, a proxy for body size).
Explained Variables
Model Type
Model (ΔAIC, Weight)/Explanatory Variables
(− Negative Effect; + Positive Effect)
χ2p
Calculated tongue length
LME, Normal
Best-fitted model: (ΔAIC = 0, Weight = 0.9)
Flower abundance (+)17.9<0.001
Proportion of long tongue bee species
GLMM, Binomial
Best-fitted model: (ΔAIC = 0, Weight = 0.61)
Flower abundance (+)8.50.003
Uncultivated area within a 100 m radius (−)5.80.01
Alternative model: (ΔAIC = 0.8, Weight = 0.31)
Flower abundance (+)11<0.001
Total plant cover (%) (−)2.60.1
Uncultivated area within a 100 m radius (−)6.40.01
Body size (ITD)
LME, Normal
Best-fitted model: (ΔAIC = 0, Weight = 0.66)
Flower abundance (+)5.40.02
Alternative model: (ΔAIC = 0.2, Weight = 0.34)
Flower abundance (+)5.50.01
Uncultivated patch area (+)6.10.01
Disclaimer/Publisher’s Note: The statements, opinions and data contained in all publications are solely those of the individual author(s) and contributor(s) and not of MDPI and/or the editor(s). MDPI and/or the editor(s) disclaim responsibility for any injury to people or property resulting from any ideas, methods, instructions or products referred to in the content.

