Article

Effects of Stream Connectivity on Phytoplankton Diversity and Community Structure in Sunken Lakes: A Case Study from an August Survey

1
School of Resources and Environmental Engineering, Anhui University, Hefei 230601, China
2
Anhui Province Key Laboratory of Wetland Ecosystem Protection and Restoration, Anhui University, Hefei 230601, China
*
Author to whom correspondence should be addressed.
Diversity 2023, 15(2), 291; https://doi.org/10.3390/d15020291
Submission received: 18 November 2022 / Revised: 17 January 2023 / Accepted: 9 February 2023 / Published: 16 February 2023

Abstract

:
After the underground coal resources were exploited in the Huainan high diving mining area, the surface subsidence water formed a subsidence lake. Studying the influencing factors of the phytoplankton community structure in coal mining subsidence lakes is extremely important in enabling us to understand the nutritional status and ecological environment of the lake. In this study, we sampled phytoplankton in sunken lakes in August 2021 and analyzed the effects of the environmental factors on the phytoplankton community structure and diversity. The results showed that WT, pH, Cond, AN, NO and TP were the main environmental factors affecting phytoplankton cell density. The density and diversity of phytoplankton cells revealed obvious spatial distribution differences depending on the different drainage connectivity of sunken lakes, and the density and diversity of phytoplankton cells were higher in sunken lakes with better drainage connectivity. This study provides basic data for an in-depth understanding of sunken lakes, a special water body, and provides scientific data support for the reconstruction, restoration and sustainable development of the ecological environment in the mining area from the perspective of ecology.

1. Introduction

Huaibei is an important energy base in China with rich coal resources and a large production scale. The influence of human coal mining activities, coupled with numerous local river networks, a shallow groundwater level, thick aquifers and a large water volume has led to large collapse and water accumulation in the mining area [1]. The stagnant lakes in these subsidence areas have become important local surface water resources with the functions of water source regulation, ecological restoration, fishery and breeding and other ecological services, which are important for the economic development of the mining area and the economic development of the ecological environment [2,3]. Constrained by factors such as hydrological conditions, ecological environment conditions in the mining area, and different ways of utilizing different waters, the water quality of each lake also appears to be significantly different, with different degrees of eutrophication in different lakes. The investigation of water quality in the Ji River showed that the water is a eutrophic water body with high levels of nitrogen and phosphorus [4] Another study found that the nitrogen and phosphorus levels in the Xifei River waters have a clear spatial and temporal distribution pattern [5].
Spatially, the sunken lakes are closely related to the hydro-ecological environment of the mine area, and the characteristics related to the hydrological conditions, the ecological environment and the human activities of the mine area are reflected in the ecosystem of the sunken lakes [6]. Lin et al. observed that there were significant differences in the community structure of zooplankton in the different habitats of sunken lakes [7]. Temporally, the nutrient status of the same sunken lake may change year to year and even vary from one sinking stage to the next depending on whether the sinking still continues and the disturbance of human activities. The structural and functional characterization of lake ecosystems and their processes and mechanisms in response to the eutrophication process of water bodies and related ecological and environmental effects are important scientific issues faced in the reconstruction, restoration and evaluation of the ecological environment of mining areas.
The phytoplankton community is a key component in determining ecosystem stability because the phytoplankton species composition and biomass in a water body can quickly respond to the ecological conditions and trophic status of the water body. It can thus be used as an ecological indicator to understand water quality [8,9,10]. Although little research has been conducted on the phytoplankton community structure of sinkhole lakes, this knowledge is crucial for understanding the trophic status of sinkhole lakes and lake ecology. Wang et al. studied the phytoplankton community in a sunken lake of Huaibei, and the results uncovered that the lake presented mild eutrophication [11]. Wan et al. showed that phytoplankton had obvious eutrophication characteristics, and there was a potential risk of cyanobacteria bloom in the subsidence lake in the Digou coal mining subsidence area [12]. The phytoplankton community structure is mainly influenced by environmental factors, such as nutrient salinity, light, and hydrological conditions. Nutrients are essential for phytoplankton cell life, and nutrient levels and ratios are important factors controlling phytoplankton composition and community distribution [13]. Periodic changes in light affect the phytoplankton cell pigment content, which in turn controls the algal photosynthetic efficiency and growth rate [14]. Light affects the uptake of nutrients, such as nitrogen, by phytoplankton cells directly or indirectly by regulating their photosynthesis [15]. The better the connectivity of the water system, the higher the habitat heterogeneity of the connected water bodies that can maintain a high species diversity; the better the connectivity of the water system, the higher the self-purification and pollution-holding capacity of the water flow [16]. Junk et al. found that rivers effectively connect the vertical and functional structural continuity of lake ecosystems [17]. Gumiero et al. found that weakened hydrological connectivity of rivers due to factors, such as river construction, can affect ecologically important functions of local watershed ecosystems [18].
In this study, the phytoplankton community structure and environmental factors were monitored in seven collapsed lakes in the Huaibei coal mining subsidence area in August 2021. The purpose of the study was to: (1) analyze the water quality and phytoplankton community structure in the subsidence lakes; and (2) evaluate the main ecological factors affecting phytoplankton diversity and cell density, with an emphasis on the influence of stream connectivity on the phytoplankton community structure.

2. Materials and Methods

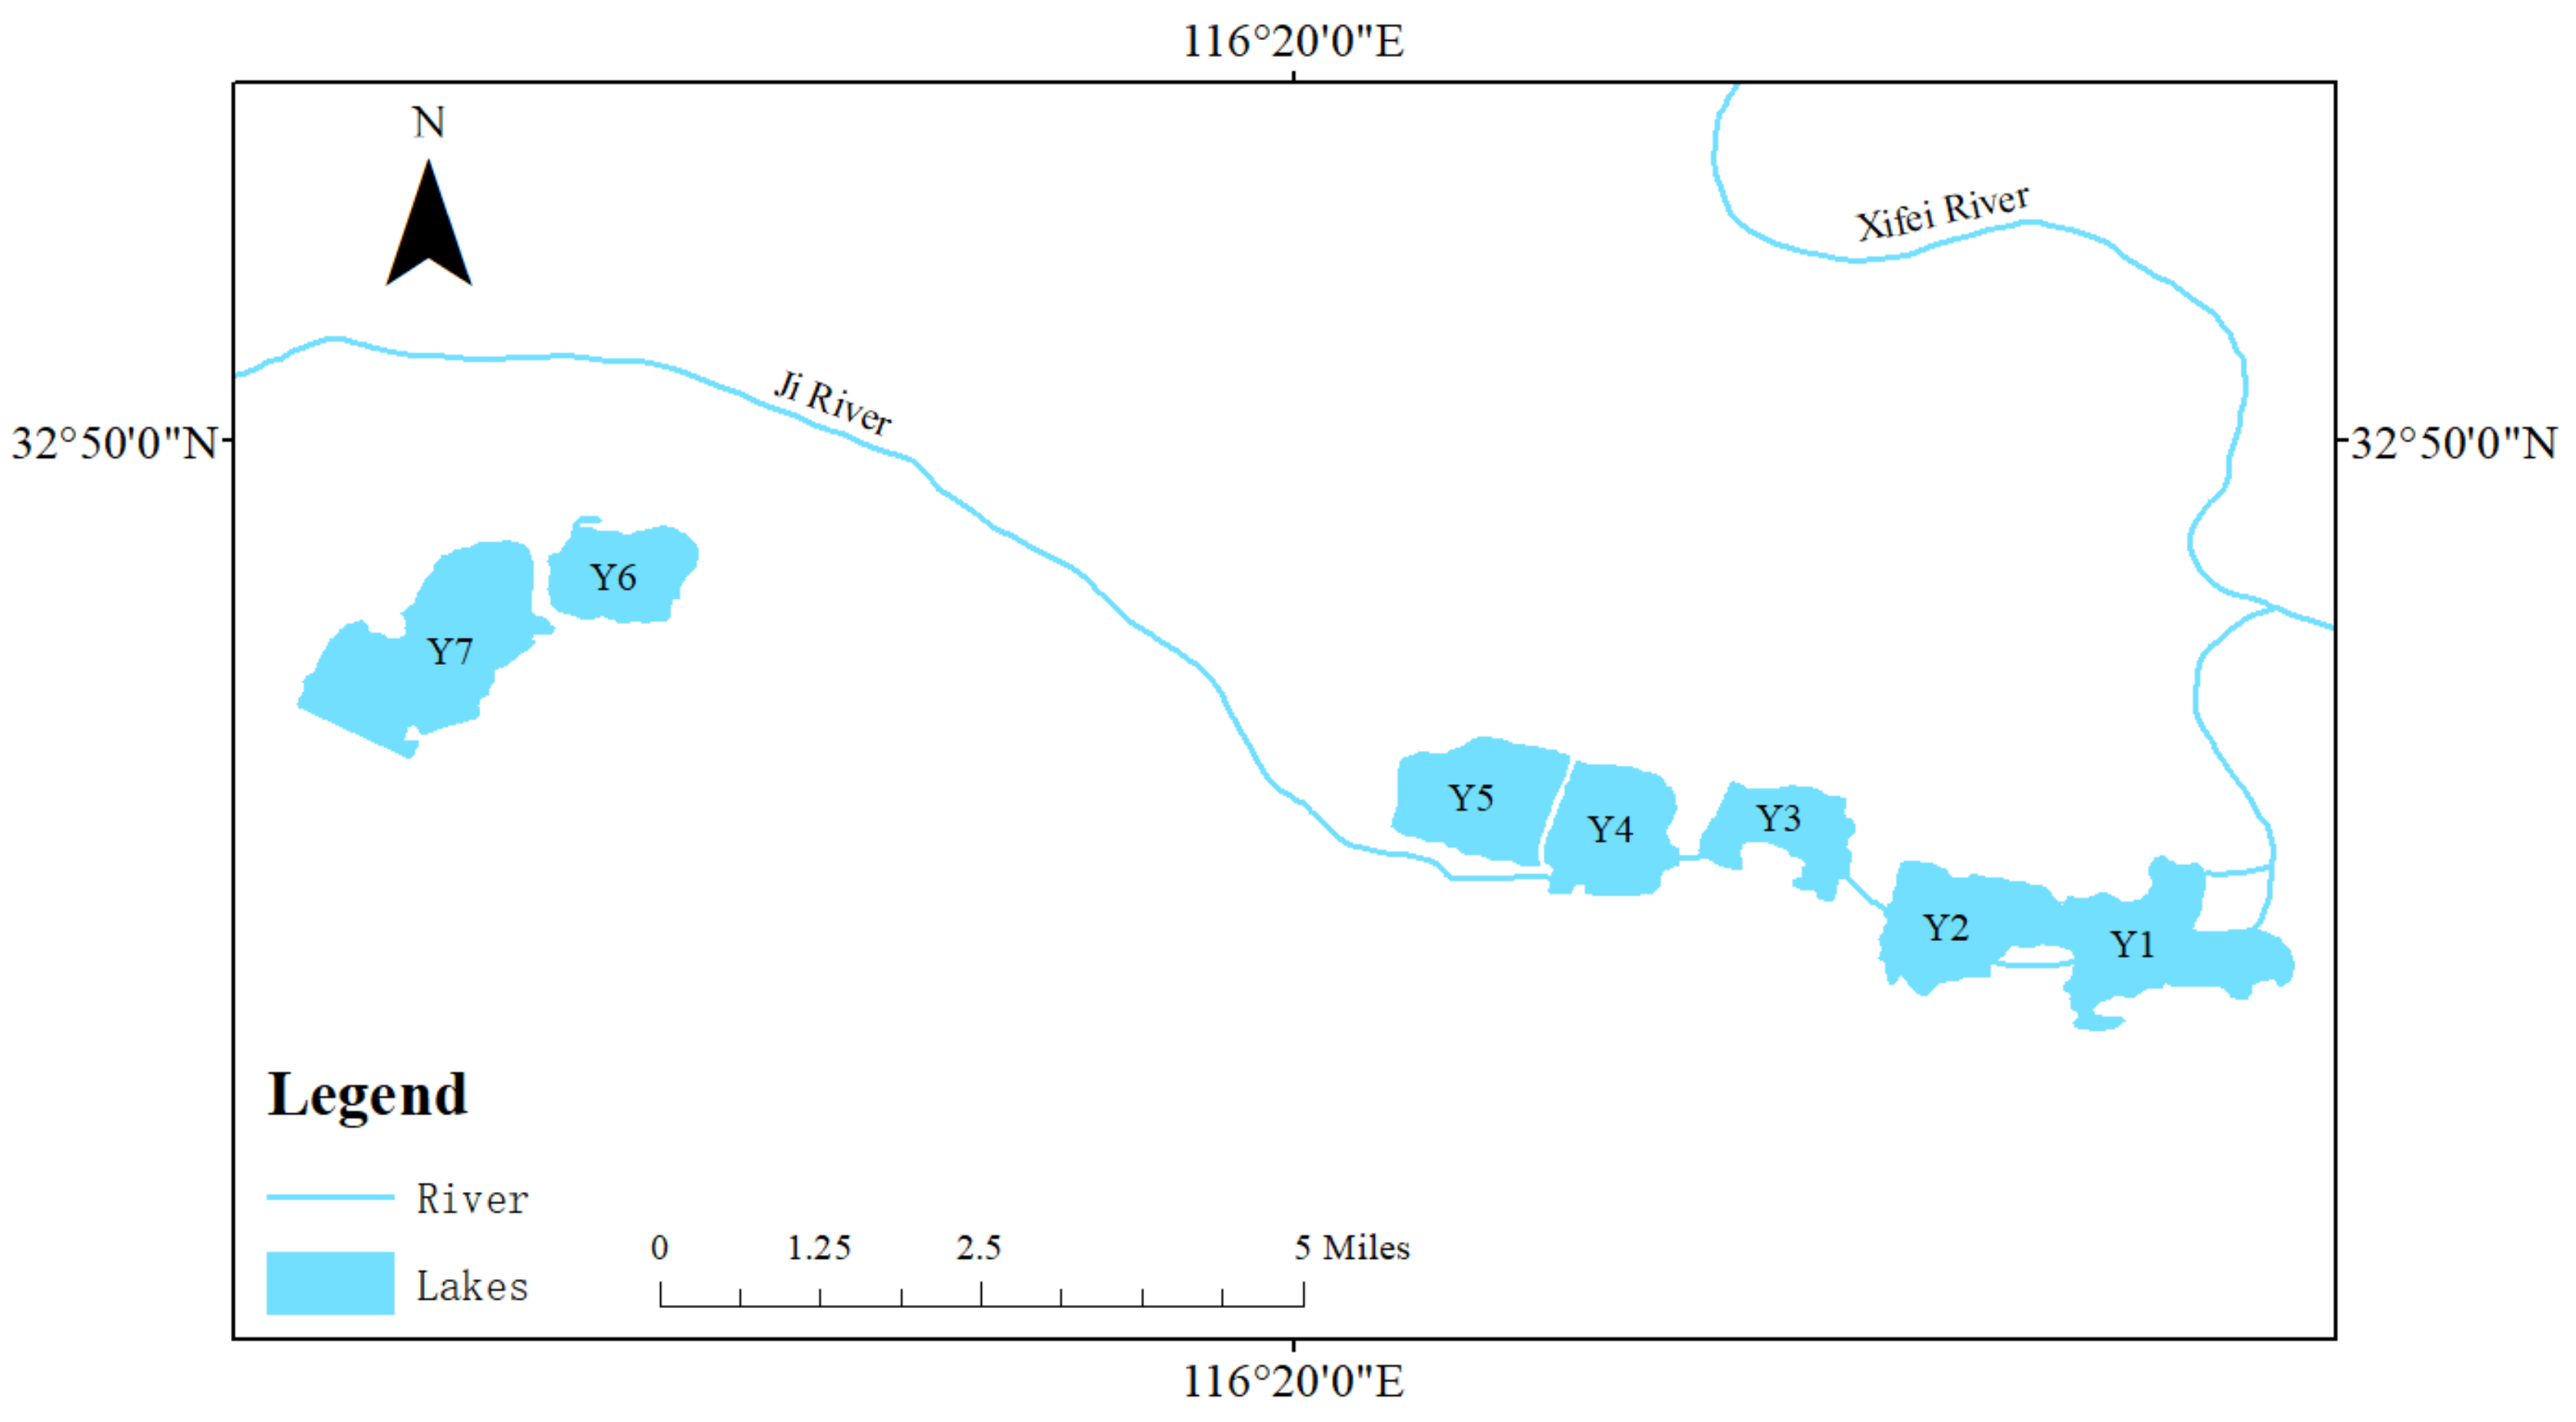
2.1. Sampling Area and Sampling Time

The lakes in the Digou coal mining subsidence area (latitude and longitude) are located in Xieqiao mine, Digou town, Yingshang county, Anhui province, north of the Xi River and south of the Ji River. They mainly formed with the collapse of farmland and consist of several bodies of waters in the west, middle and east. Seven sunken lakes were selected as sampling areas. Y1, Y2, Y3 and Y4 were connected to the Ji River, among which Y1 was connected to the Xifei River tributary in the northeast and the Ji River in the southeast; Y2 and Y3 were overspread by the Ji River; and Y4 was connected to the Ji River in the south, showing poor water system connectivity. Y5, Y6 and Y7 were closed water bodies. According to the morphological characteristics of the lakes, four sampling points were set for each lake, among which two sampling points were set in the center of the lake, and two sampling points were set within 50 m from the shore. Each sampling point was set with 2 water intake layers, namely, the surface layer (0.5 m from the lake surface) and the bottom layer (0.5 m from the lake bottom). A sampling survey was conducted in August 2021. Sampling lakes are shown in Figure 1.

2.2. Collection and Identification of Phytoplankton Samples

A 25# plankton net (64 μm) (Purity, Beijing, China) was thrown into the water, and the sample was collected for qualitative analysis by performing ∞-shaped gyrations back and forth in the water several times. Quantitative samples were collected with a 5 L plexiglass water collector. A 1 L water sample was taken, fixed with Lugol’s solution (Yuanye, Shanghai, China) on site, and concentrated to 30 mL after a 48 h sedimentation in the laboratory. We employed Hu and Wei’s method for specific identification of each sample [19]. After mixing, we counted 0.1 mL of the sample in a counting chamber under a light microscope (Olympus, BX53, Münster, Germany) at ×400 magnification. In all, we identified and counted randomly selected microscopic fields at the species level for every specimen. We identified phytoplankton species based on morphology. The biomass of phytoplankton was calculated from the cell volume of phytoplankton, which was determined by the average cell dimensions for each species.

2.3. Determination of Physical and Chemical Indicators

The field measurements included water temperature (WT), dissolved oxygen (DO), electrical conductivity (Cond), pH and sampling depth (SDep). Measurements were taken by the Hach HQ40d portable multimeter (Hach, Colorado, America). Water depth (WD) and Secchi depth (SD) were determined by the Secchi disk (Fuside, Beijing, China). Water samples from each lake were also extracted to measure chlorophyll a and the nutrient concentrations in the laboratory. Chlorophyll a, total nitrogen (TN) and total phosphorus (TP) were examined according to the description of SEPB (2002) [20]. NO3−N(NO) and NH4+−N(AN) contents of the water were measured as per the standard methods published by China’s State Environmental Protection Administration [21].

2.4. Data Analyses

In accordance with the Shannon–Wiener index (H’) [22], the Pielou index (J’) [23] and the Margalef index (D) [24], we investigated the species diversity as follows:
H = i = 1 s p i ln p i
J = H / ln S
D = S 1 / ln N
The formula for calculating phytoplankton dominance was:
Y = n i / N × f i
where ni is the number of individuals of species i, N is the total number of individuals of all species, S is the total number of phytoplankton species, and ni/N represents the relative proportion of species i. Y ≥ 0.02 is the dominant species. H’ = 0~1 (heavy pollution type), 1~3 (moderate pollution type), >3 (light pollution or no pollution type); D = 0~2 (heavy pollution type), 2~4 (medium pollution type), 4~6 (light pollution type), >6 (clean); J = 0~0.3 (heavy pollution type), 0.3~0.5 (medium pollution type) and >0.5 (light pollution or no pollution type).
One-way ANOVA was conducted to test the significant variance of the environment and the phytoplankton communities during different sampling periods. Pearson’s correlation analysis was performed to evaluate the influence of the water quality parameters on phytoplankton densities. All analyses were performed using IBM SPSS Statistics (Version 20.0, http://www.ibm.com (accessed on 10 May 2022)). To determine the possible relations between biological and environmental data, before the analysis was carried out, we log transformed the data to ensure the data were normally distributed. We used detrended correspondence analysis (DCA) to determine that all of the first axis gradient lengths were less than 3 and chose a linear model-based RDA analysis to review them with a linear model-based RDA analysis. Using the CANOCO program, Version 4.5, we performed redundancy analysis (RDA) to isolate the important local variables that explain the phytoplankton community structure. We made columnar graphs with GraphPad Prism 5 (https://www.graphpad.com (accessed on 10 May 2022)) and an interpolation map with ArcGIS software (Version 10.4, ESRI http://www.esri.com (accessed on 10 May 2022)), utilizing the inverse distance weighting method and histograms with Origin (version 2021).

3. Results

3.1. Ecological Factors Parameters

The water temperature of the lakes in the coal mining subsidence area ranged from 24.5–27.9 °C. The average water depth of the seven lakes was 4.86 m, the minimum values of the water level in Y1 were 1.7 m, and the minimum water level in Y5 was 9.3 m, the water depth at the middle point of each lake was greater than the side points. However, the seven lakes exhibited no significant difference in the profiles of their samples (p = 0.57). The water bodies were weakly alkaline with pH values of 7.68–8.03. The mean pH values of the closed lakes Y5, Y6 and Y7 were higher than those of the connected lakes.
We compared the nutrient fractions in different lakes, and the results showed that each nutrient fraction TP, TN, AN and NO differed significantly (most p < 0.05) in each sinkhole lake. Among them, TP and NO contents showed significant spatial differences, with TP contents of Y1, Y2, Y3, Y4 and Y5 significantly lower than those of Y6 and Y7, and NO contents of Y1, Y2, Y3 and Y4 significantly higher than those of Y5, Y6 and Y7. The spatial response showed that TP contents were high in the west and low in the east, while NO contents were high in the east and low in the west. The mean DO in each lake varied from 4.67–6.43 mg/L, and the mean Cond spanned 710.25–768.75 μS/cm, with SD ranging from 51–74 cm (Table 1).

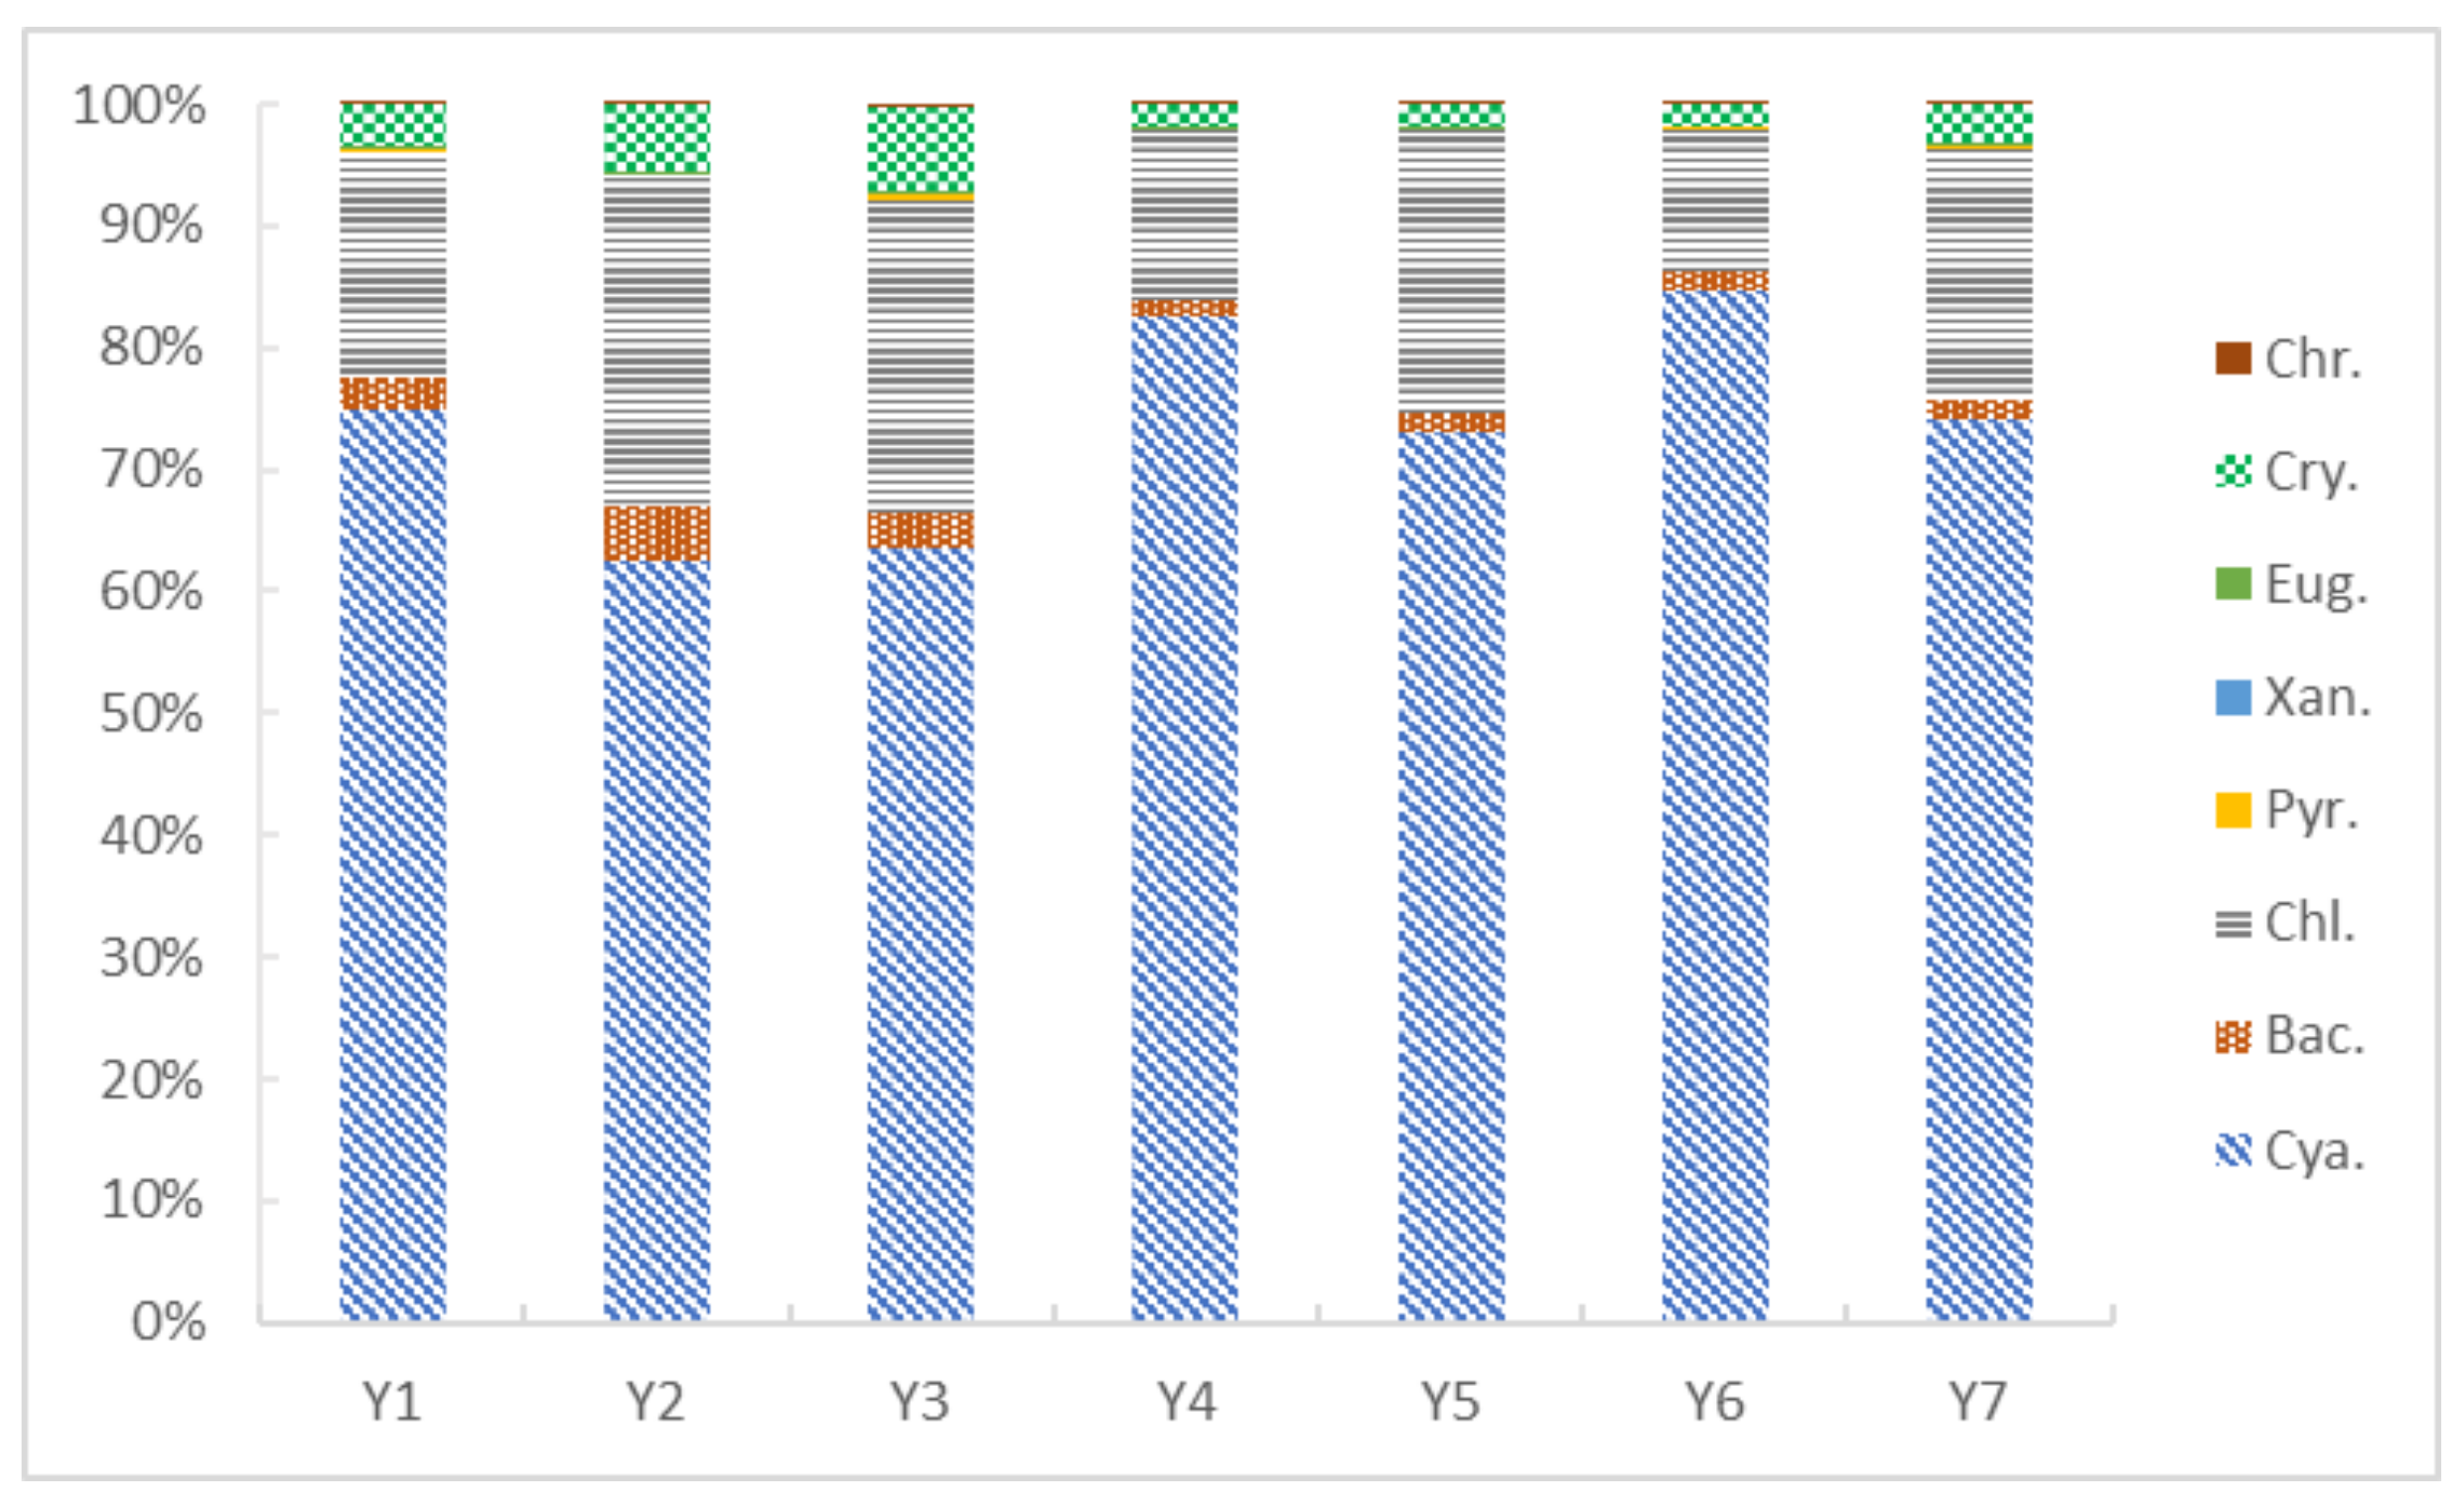
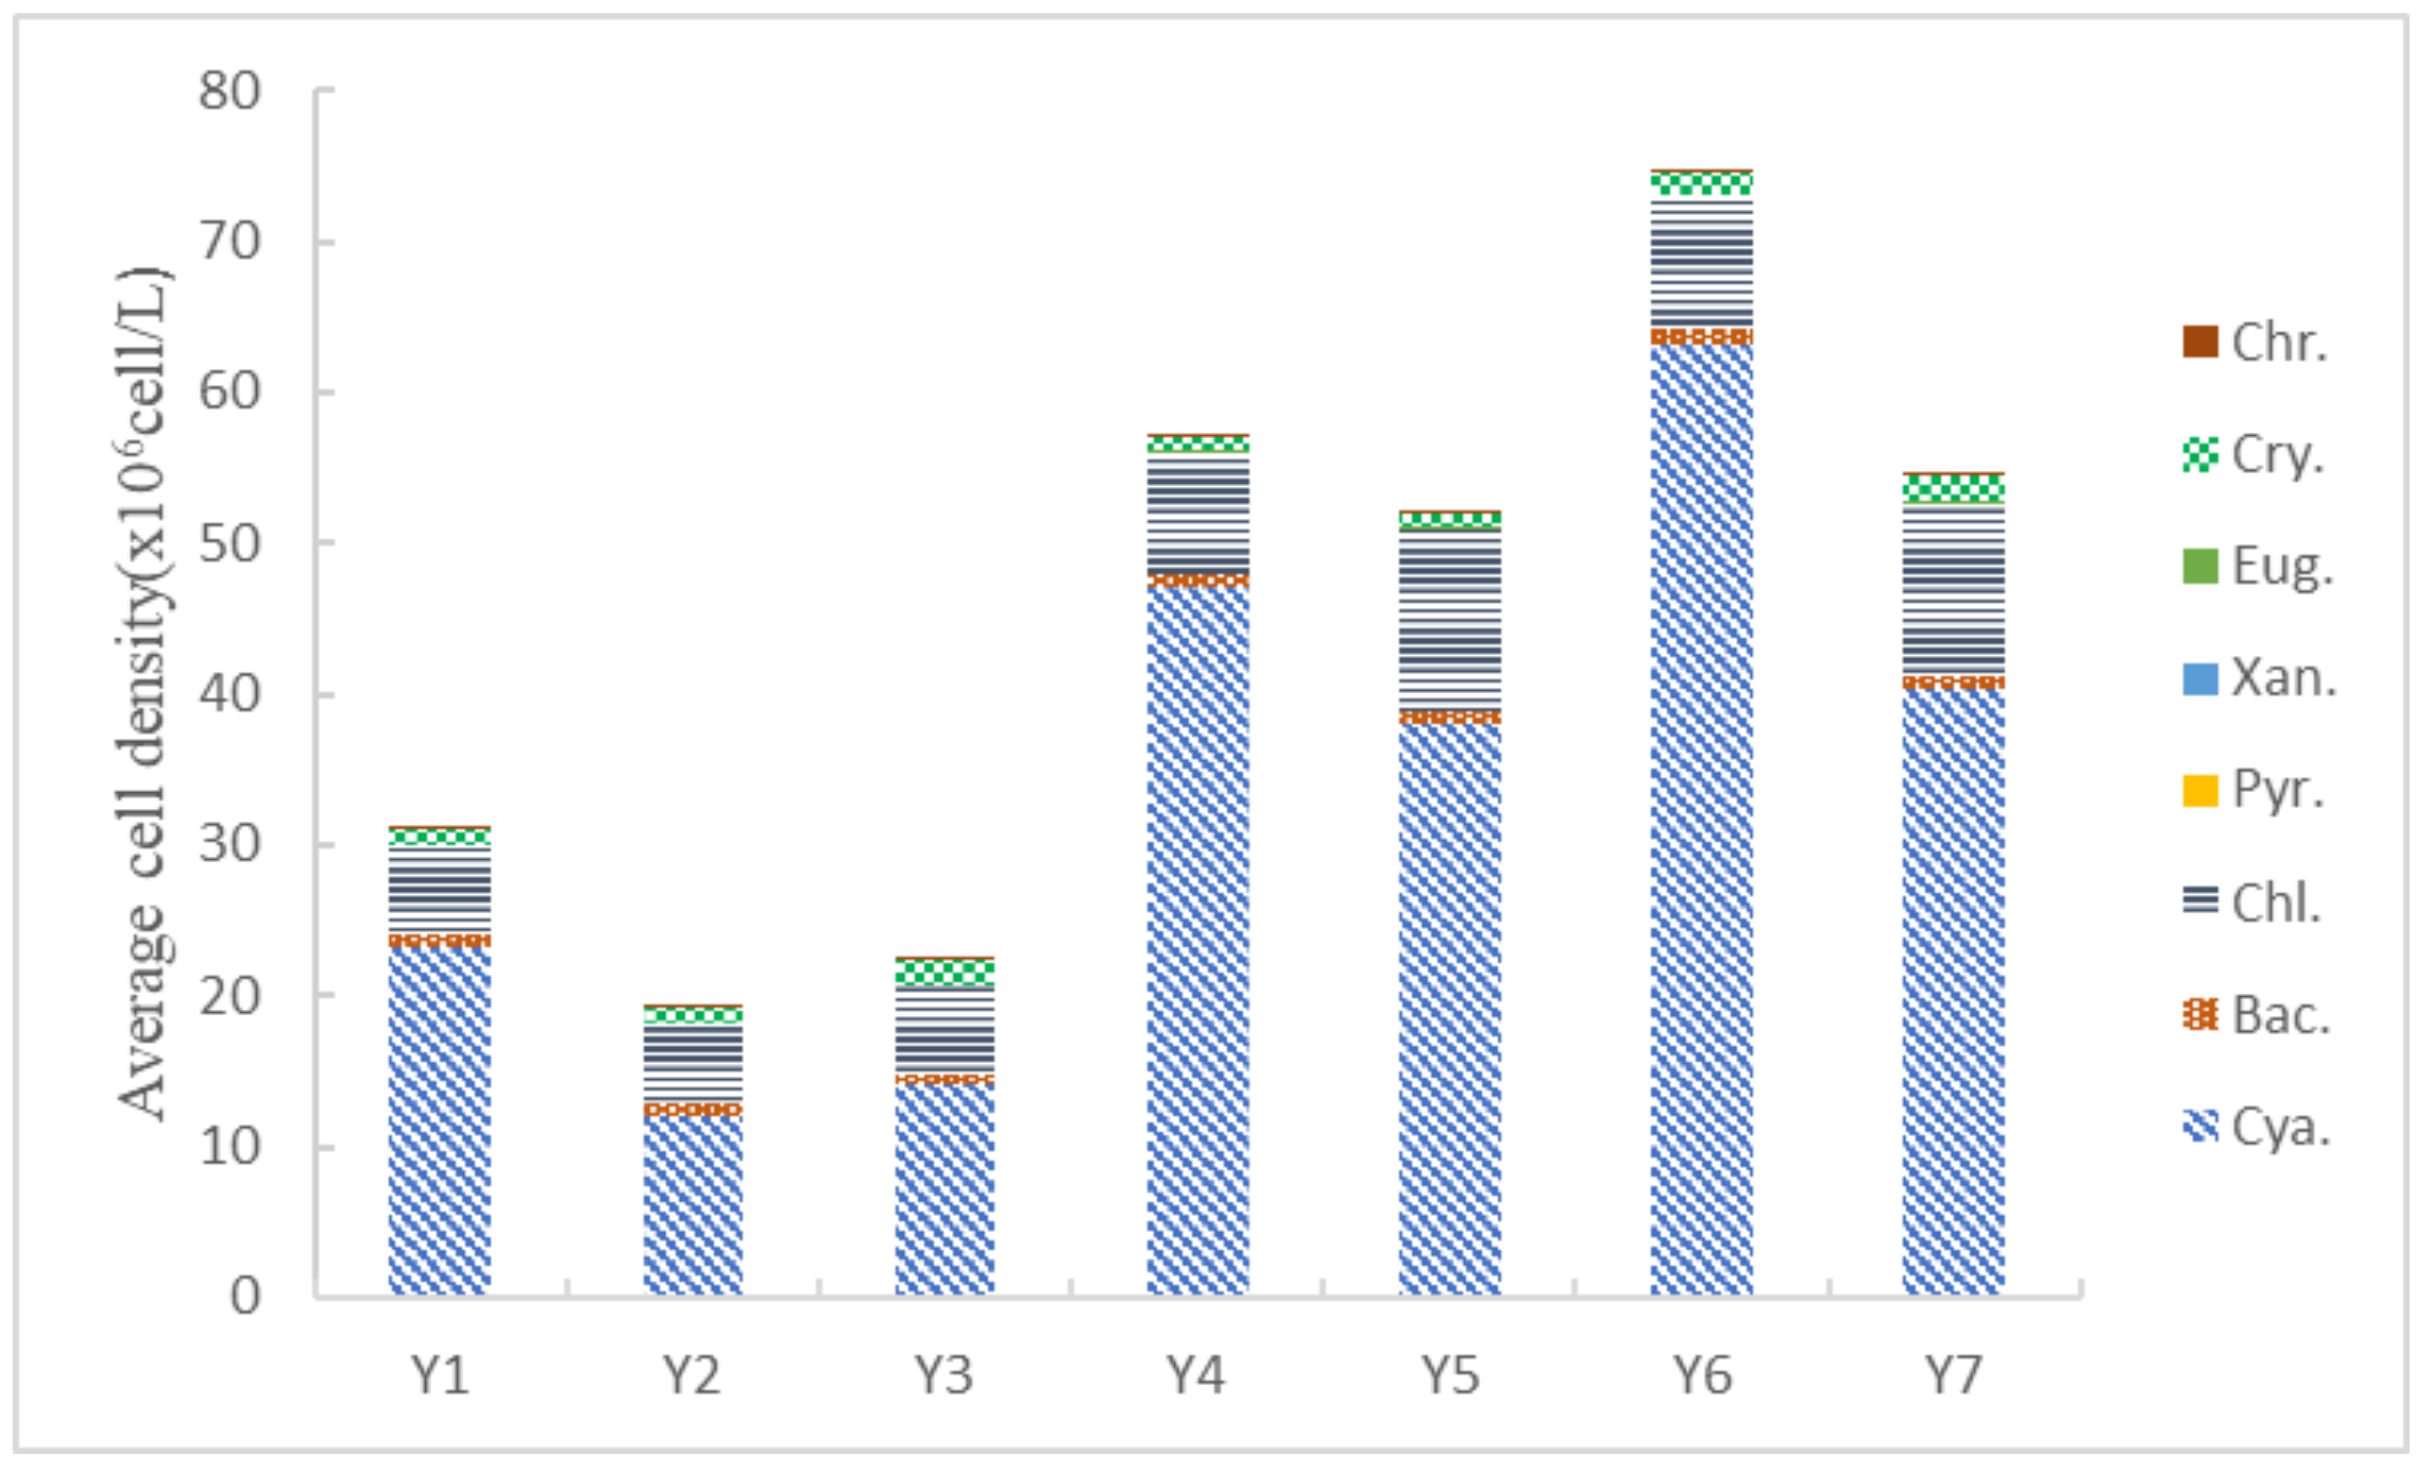
3.2. Phytoplankton Composition and Cell Density

A total of 120 species of phytoplankton were observed in this study, among which the chlorophyta was the most abundant with 52 species, accounting for 43.33% of the total species; followed by bacillariophyta and cyanobacteria with 38 and 15 species, representing 31.67% and 12.50%, respectively; euglenophyta with 6 species, constituting 5.00%; cryptophyta and chrysophyta with 3 species, making up 2.50%; pyrrophyta with 2 species, amounting to 1.67% and xanthophyta with 1 species, accounting for 0.83%.
Cell densities of the cyanobacteria and chlorophyta consistently dominated the phytoplankton in all lakes surveyed (Figure 2). The mean cell density of the seven sunken lakes was 44.42 × 10⁶ ind./L, and the cell density fluctuated from 19.23–74.55 × 10⁶ ind./L with the minimum cell density occurring in Y2 and the maximum in Y6 (Figure 3). According to the principle wherein a dominance of Y ≥ 0.02 represents the dominant species [25], the dominant species were Leptolyngbya tenuis, Chroococcus minor, Merismopedia sinica, Auxenochlorella pyrenoidosa, Crucigenia quadrata and Cryptomonas ovata. The dominant species were cyanobacteria and chlorophyta, except for Cryptomonas ovata, which were cryptophyte (Table 2). Among them, the cell density of Leptolyngbya tenuis accounted for 40.1% of the total cell density, which was the most dominant phytoplankton in the submerged lake.
The phytoplankton diversity indices (H, J, D) varied from lake to lake, and the seven sunken lakes were classified as clean water bodies according to the environmental quality evaluation criteria of water bodies.

3.3. Relationship between Phytoplankton and Environmental Factors

3.3.1. Pearson Correlation Analysis
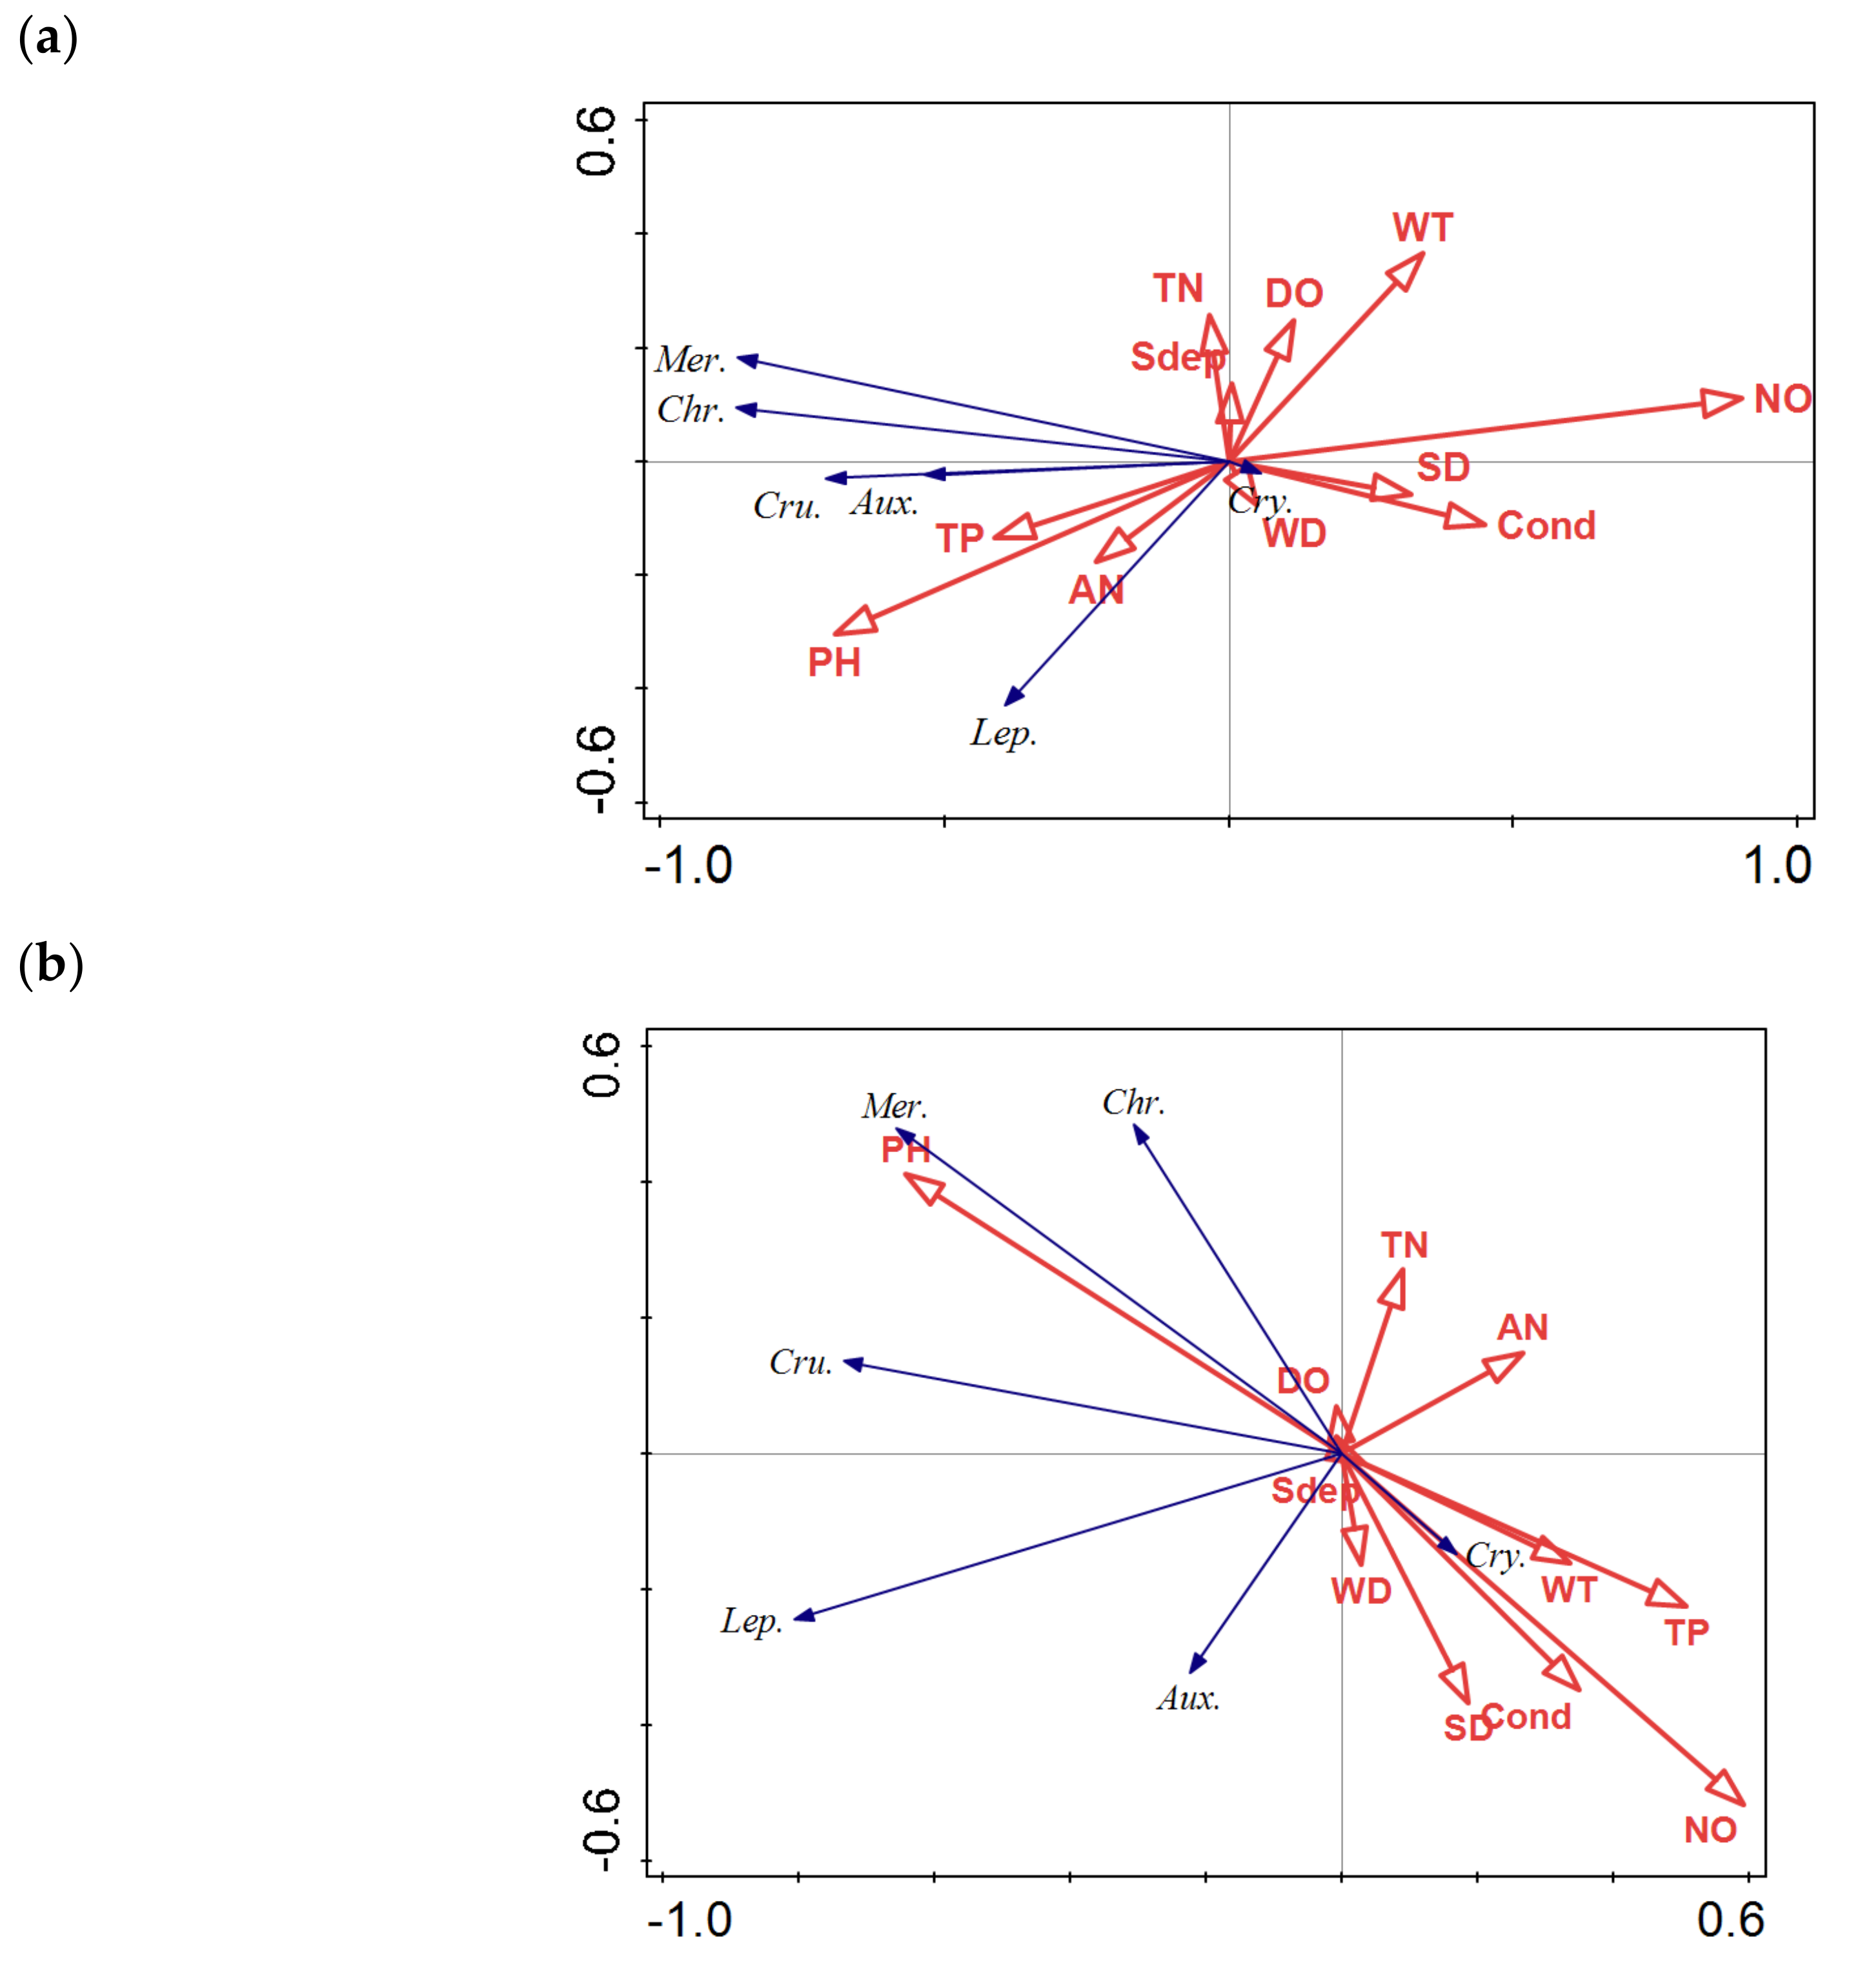
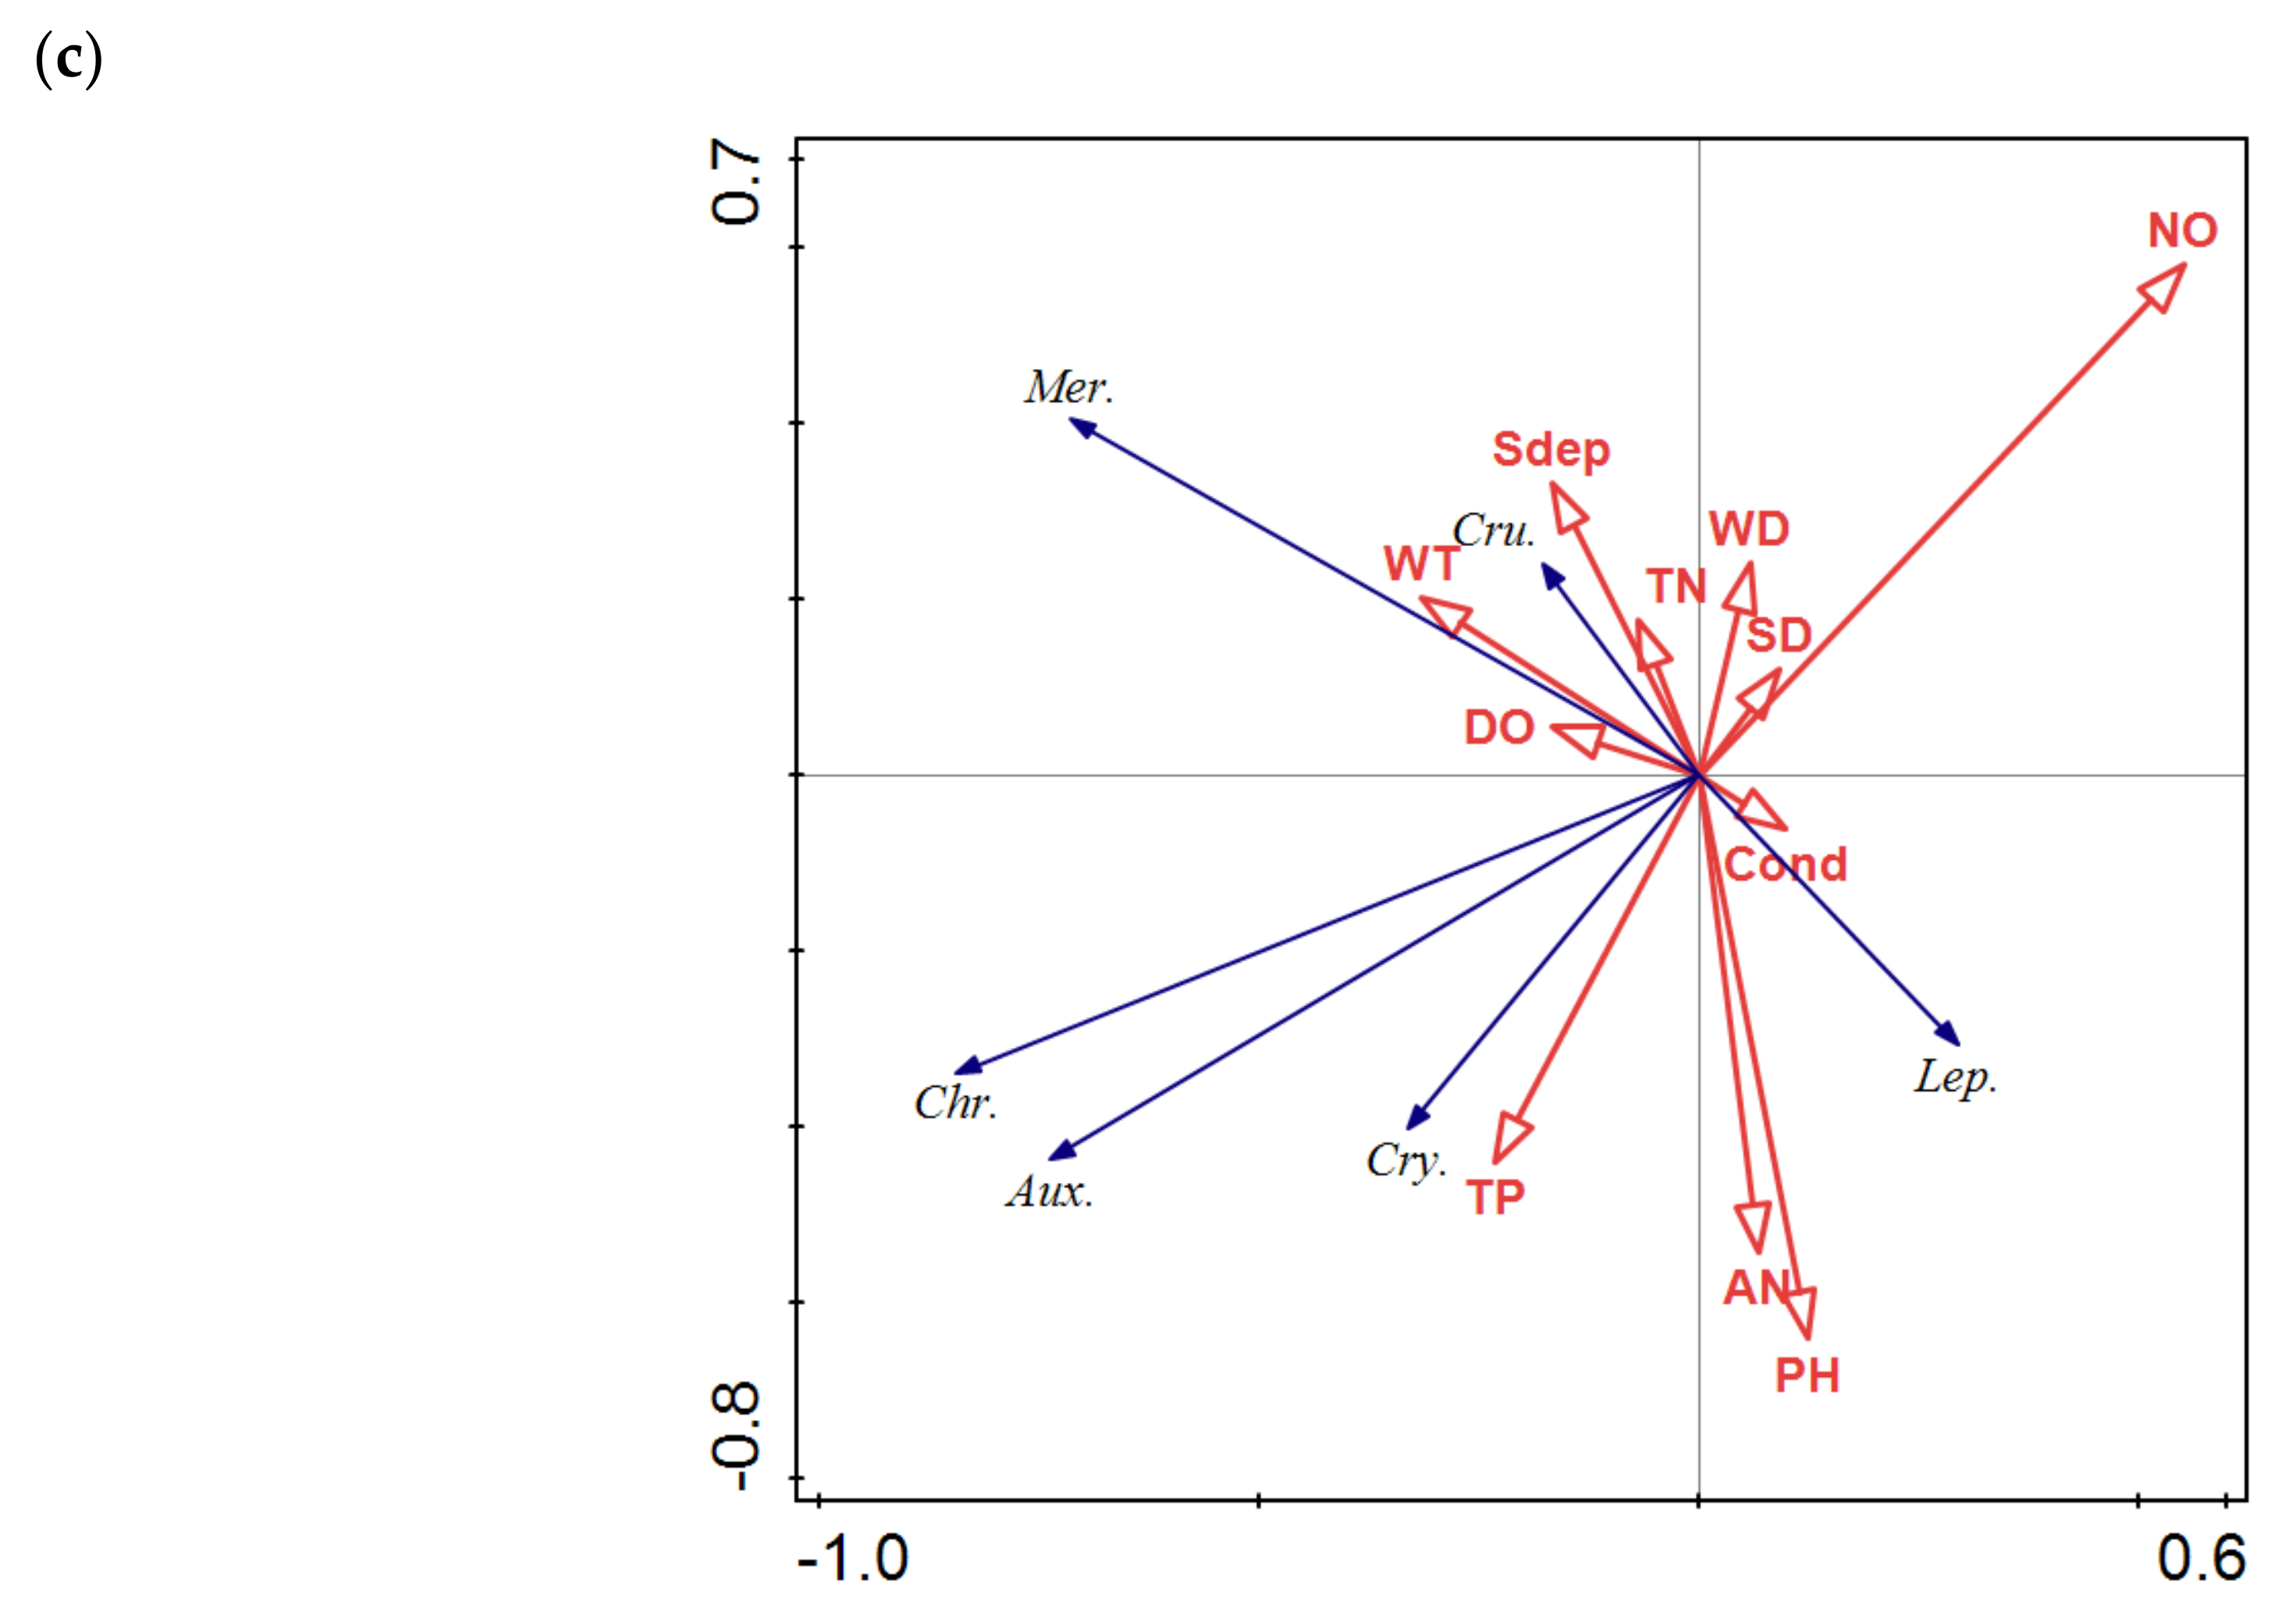
A Pearson correlation analysis was performed between the cell density environmental factors of phytoplankton (Table 3). The results showed that the cell abundance of phytoplankton demonstrated a highly significant positive correlation (p < 0.01) with AN and pH, a significant positive correlation (p < 0.05) with TP and a highly significant negative correlation (p < 0.01) with Cond, NO and WT.

3.3.2. RDA Analysis

RDA was used to assess the relationship between the dominant phytoplankton species and environmental factors. The cell density of six dominant species of phytoplankton in sunken lakes was selected for a redundancy analysis with aquatic parameters, such as WT, pH, DO, Cond, SD, WD, Sdep, NO, TP, TN and AN, which were closely related to the zooplankton community structure of the two lakes as determined by RDA pre-selection and Monte Carlo replacement test screening. We selected six dominant species: Leptolyngbya tenuis, Chroococcus minor, Merismopedia sinica, Auxenochlorella pyrenoidosa, Crucigenia quadrata and Cryptomonas ovata. The RDA results revealed that all selected parameters on the first two axes (0.4603 and 0.0611, respectively) explained 52.1% of the variation in the phytoplankton community of the sunken lake (Table 4). This truly establishes and clarifies the relationship between species and environmental factors (Figure 4a). The results showed that in the sinkhole lakes, Chroococcus minor and Merismopedia sinica had negative correlations with Cond and SD, Cryptomonas ovata responded positively to Cond and SD, Auxenochlorella pyrenoidosa and Crucigenia quadrata indicated negative correlations with NO and positive correlations with pH and TP and Leptolyngbya tenuis showed positive correlations with AN, pH and TP and negative correlations with WT and DO. We found that pH, WT, SD, Cond, DO, AN, NO and TP were the main factors affecting the taxonomic composition of phytoplankton.

3.3.3. Relationships between Phytoplankton and the Environmental Factors in Lakes with Different Stream Connectivity

According to the water system connectivity, the study lakes were divided into two groups. The first group was lakes with a good water system connectivity (G), including Y1, Y2 and Y3, and the second group was lakes that contained closed lakes and poor water system connectivity (B), including Y4, Y5, Y6 and Y7. To evaluate the relationship between phytoplankton dominance and environmental factors, we ran an RDA. The RDA ranking map includes dominant species and environmental variables. The RDA results demonstrated that the parameters selected in the first two axes explained 50.0% (Table 5) and 43.9% (Table 6) of the variances of the G and B phytoplankton groups, respectively. They also uncovered that the main environmental factors affecting the dominant species of phytoplankton in group G were PH, TP and NO (Figure 4b), and the main environmental factors impacting the dominant species of phytoplankton in group B were PH, TP, NO and AN (Figure 4c). The main environmental factors influencing the dominant species of phytoplankton in different groups of lakes were different. The results indicated that the connectivity of a water system would alter the phytoplankton community structure.
Abbreviations used in the figure: WT, water temperature; SDep, sampling depth; WD, water level; SD, Secchi depth; Cond, conductivity; DO, dissolved oxygen; TN, total nitrogen; TP, total phosphorus; NO, NO32−−N; AN, NH4+−N. Taxonomic groups: Lep., Leptolyngbya tenuis; Chr., Chroococcus minor; Mer., Merismopedia sinica; Aux., Auxenochlorella pyrenoidosa; Cru., Crucigenia quadrata; Cry., Cryptomonas ovata.

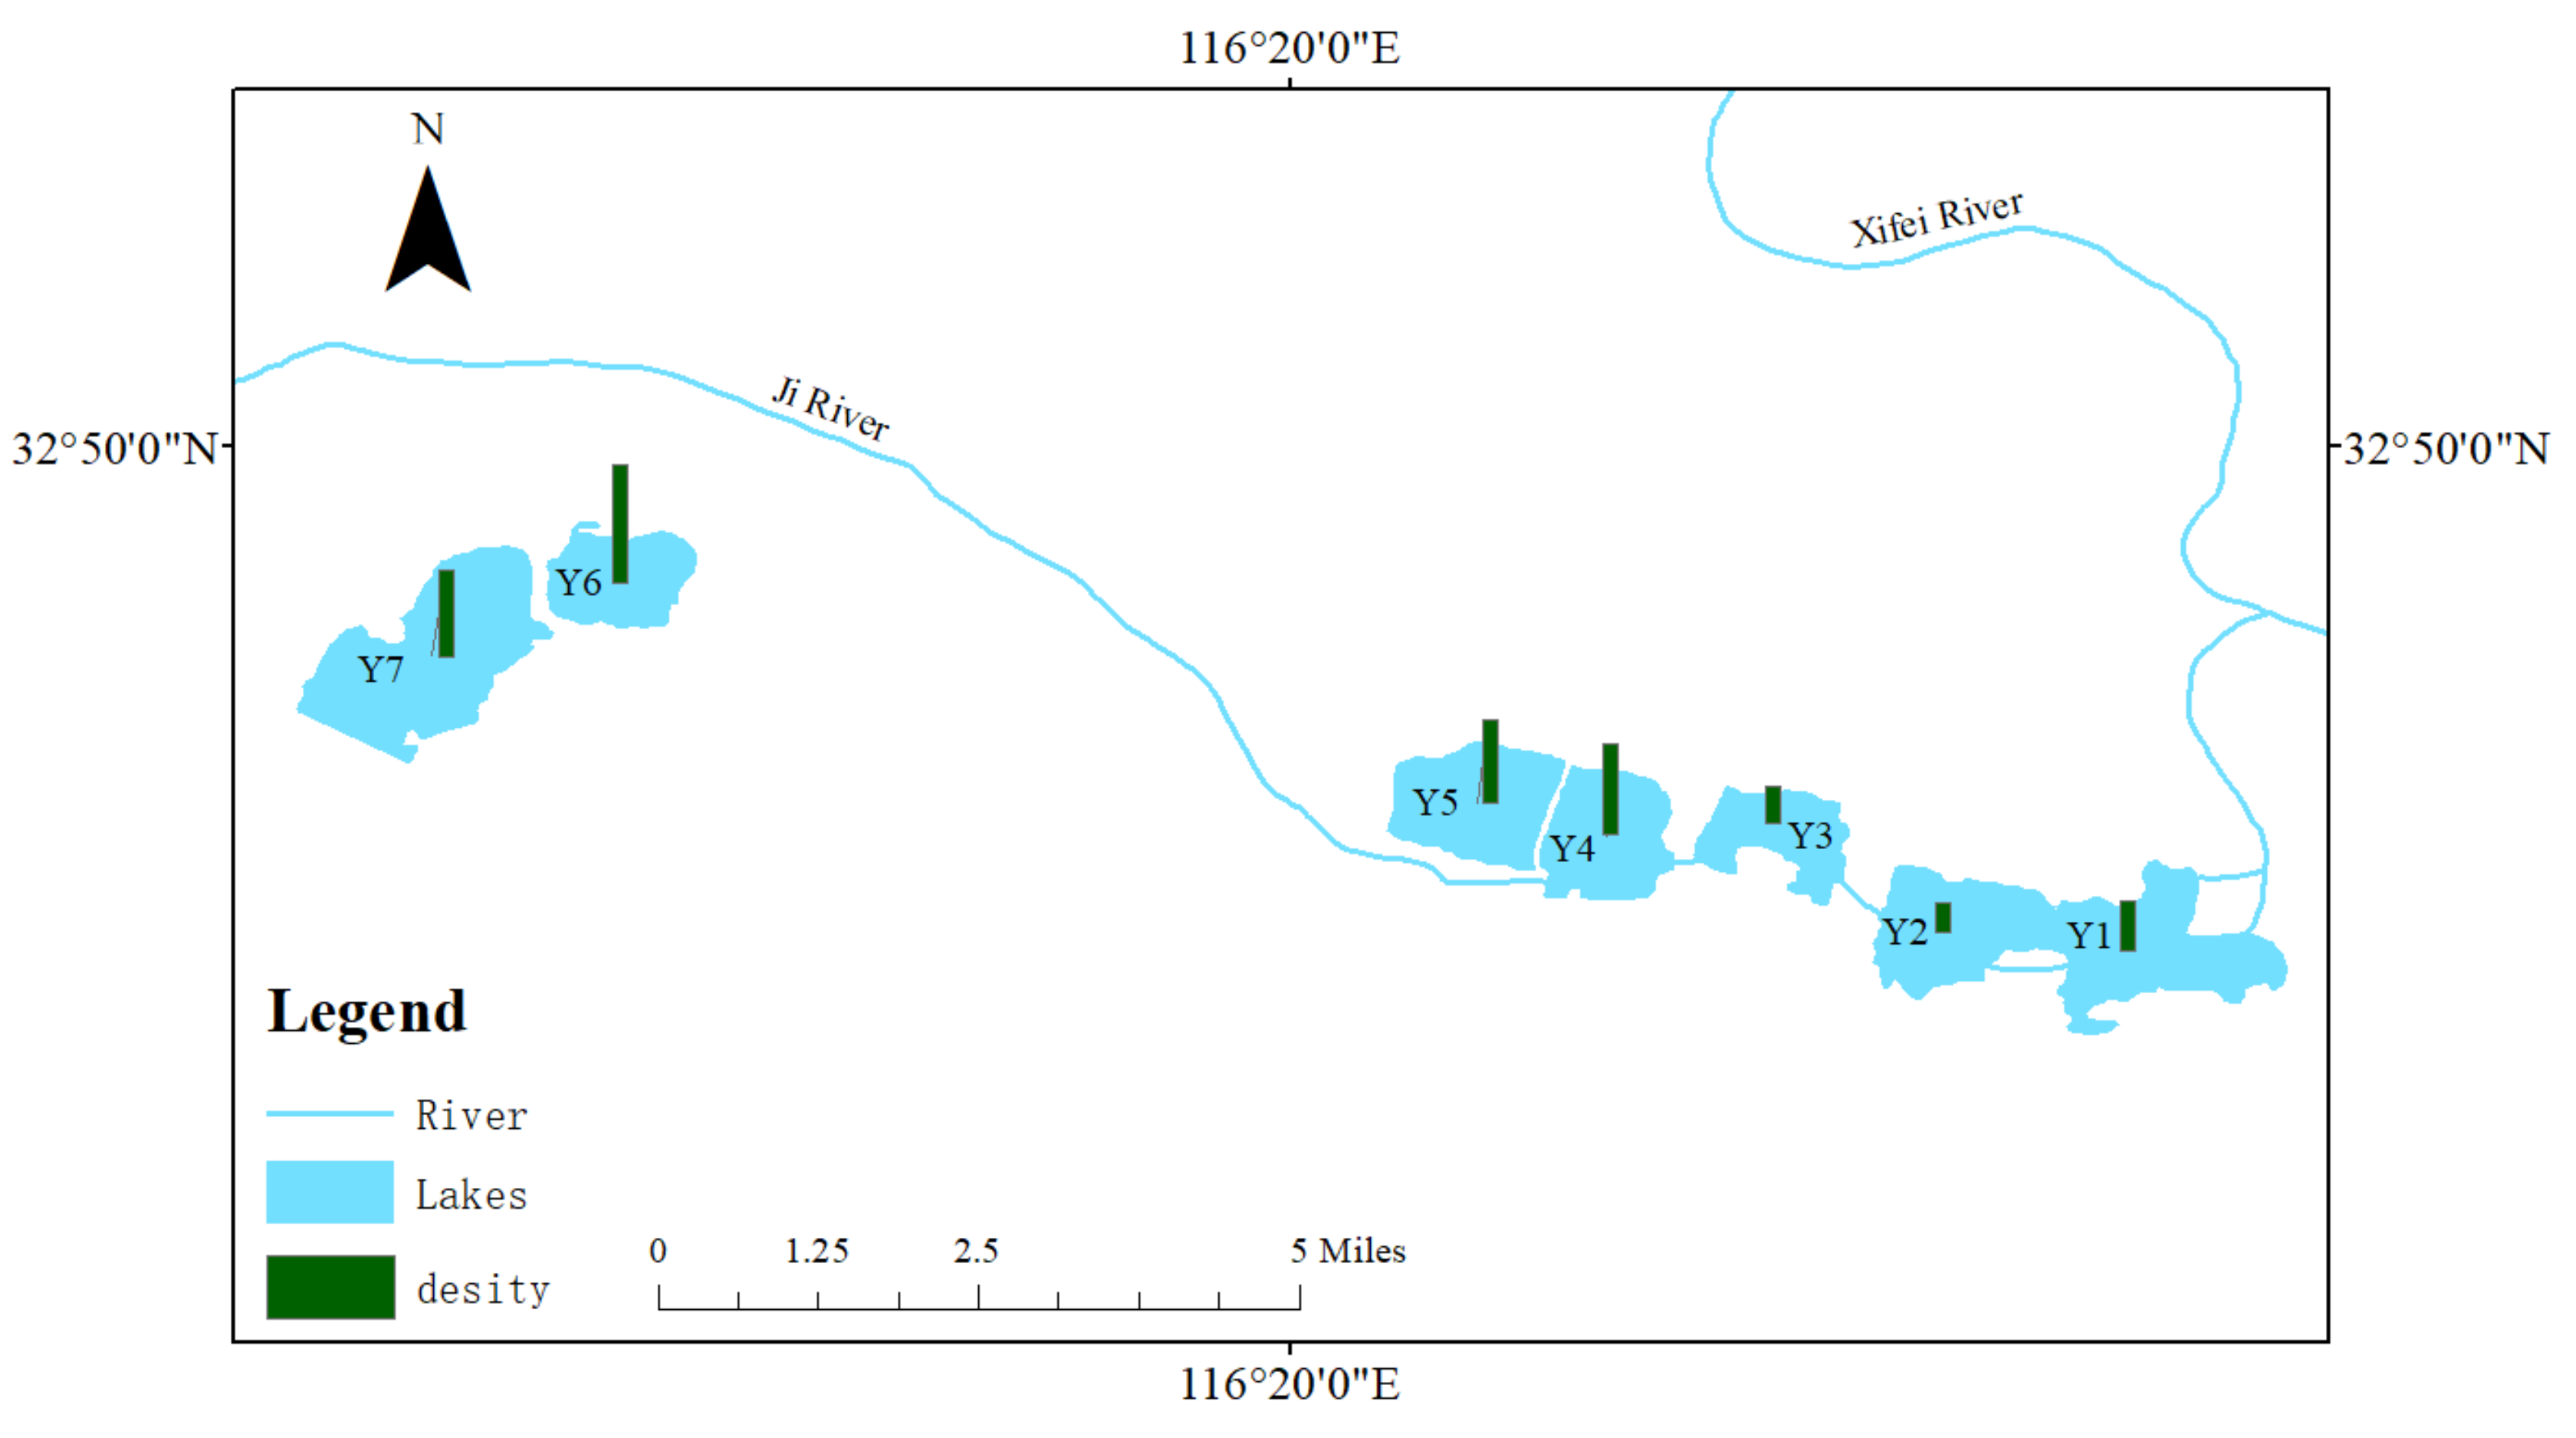
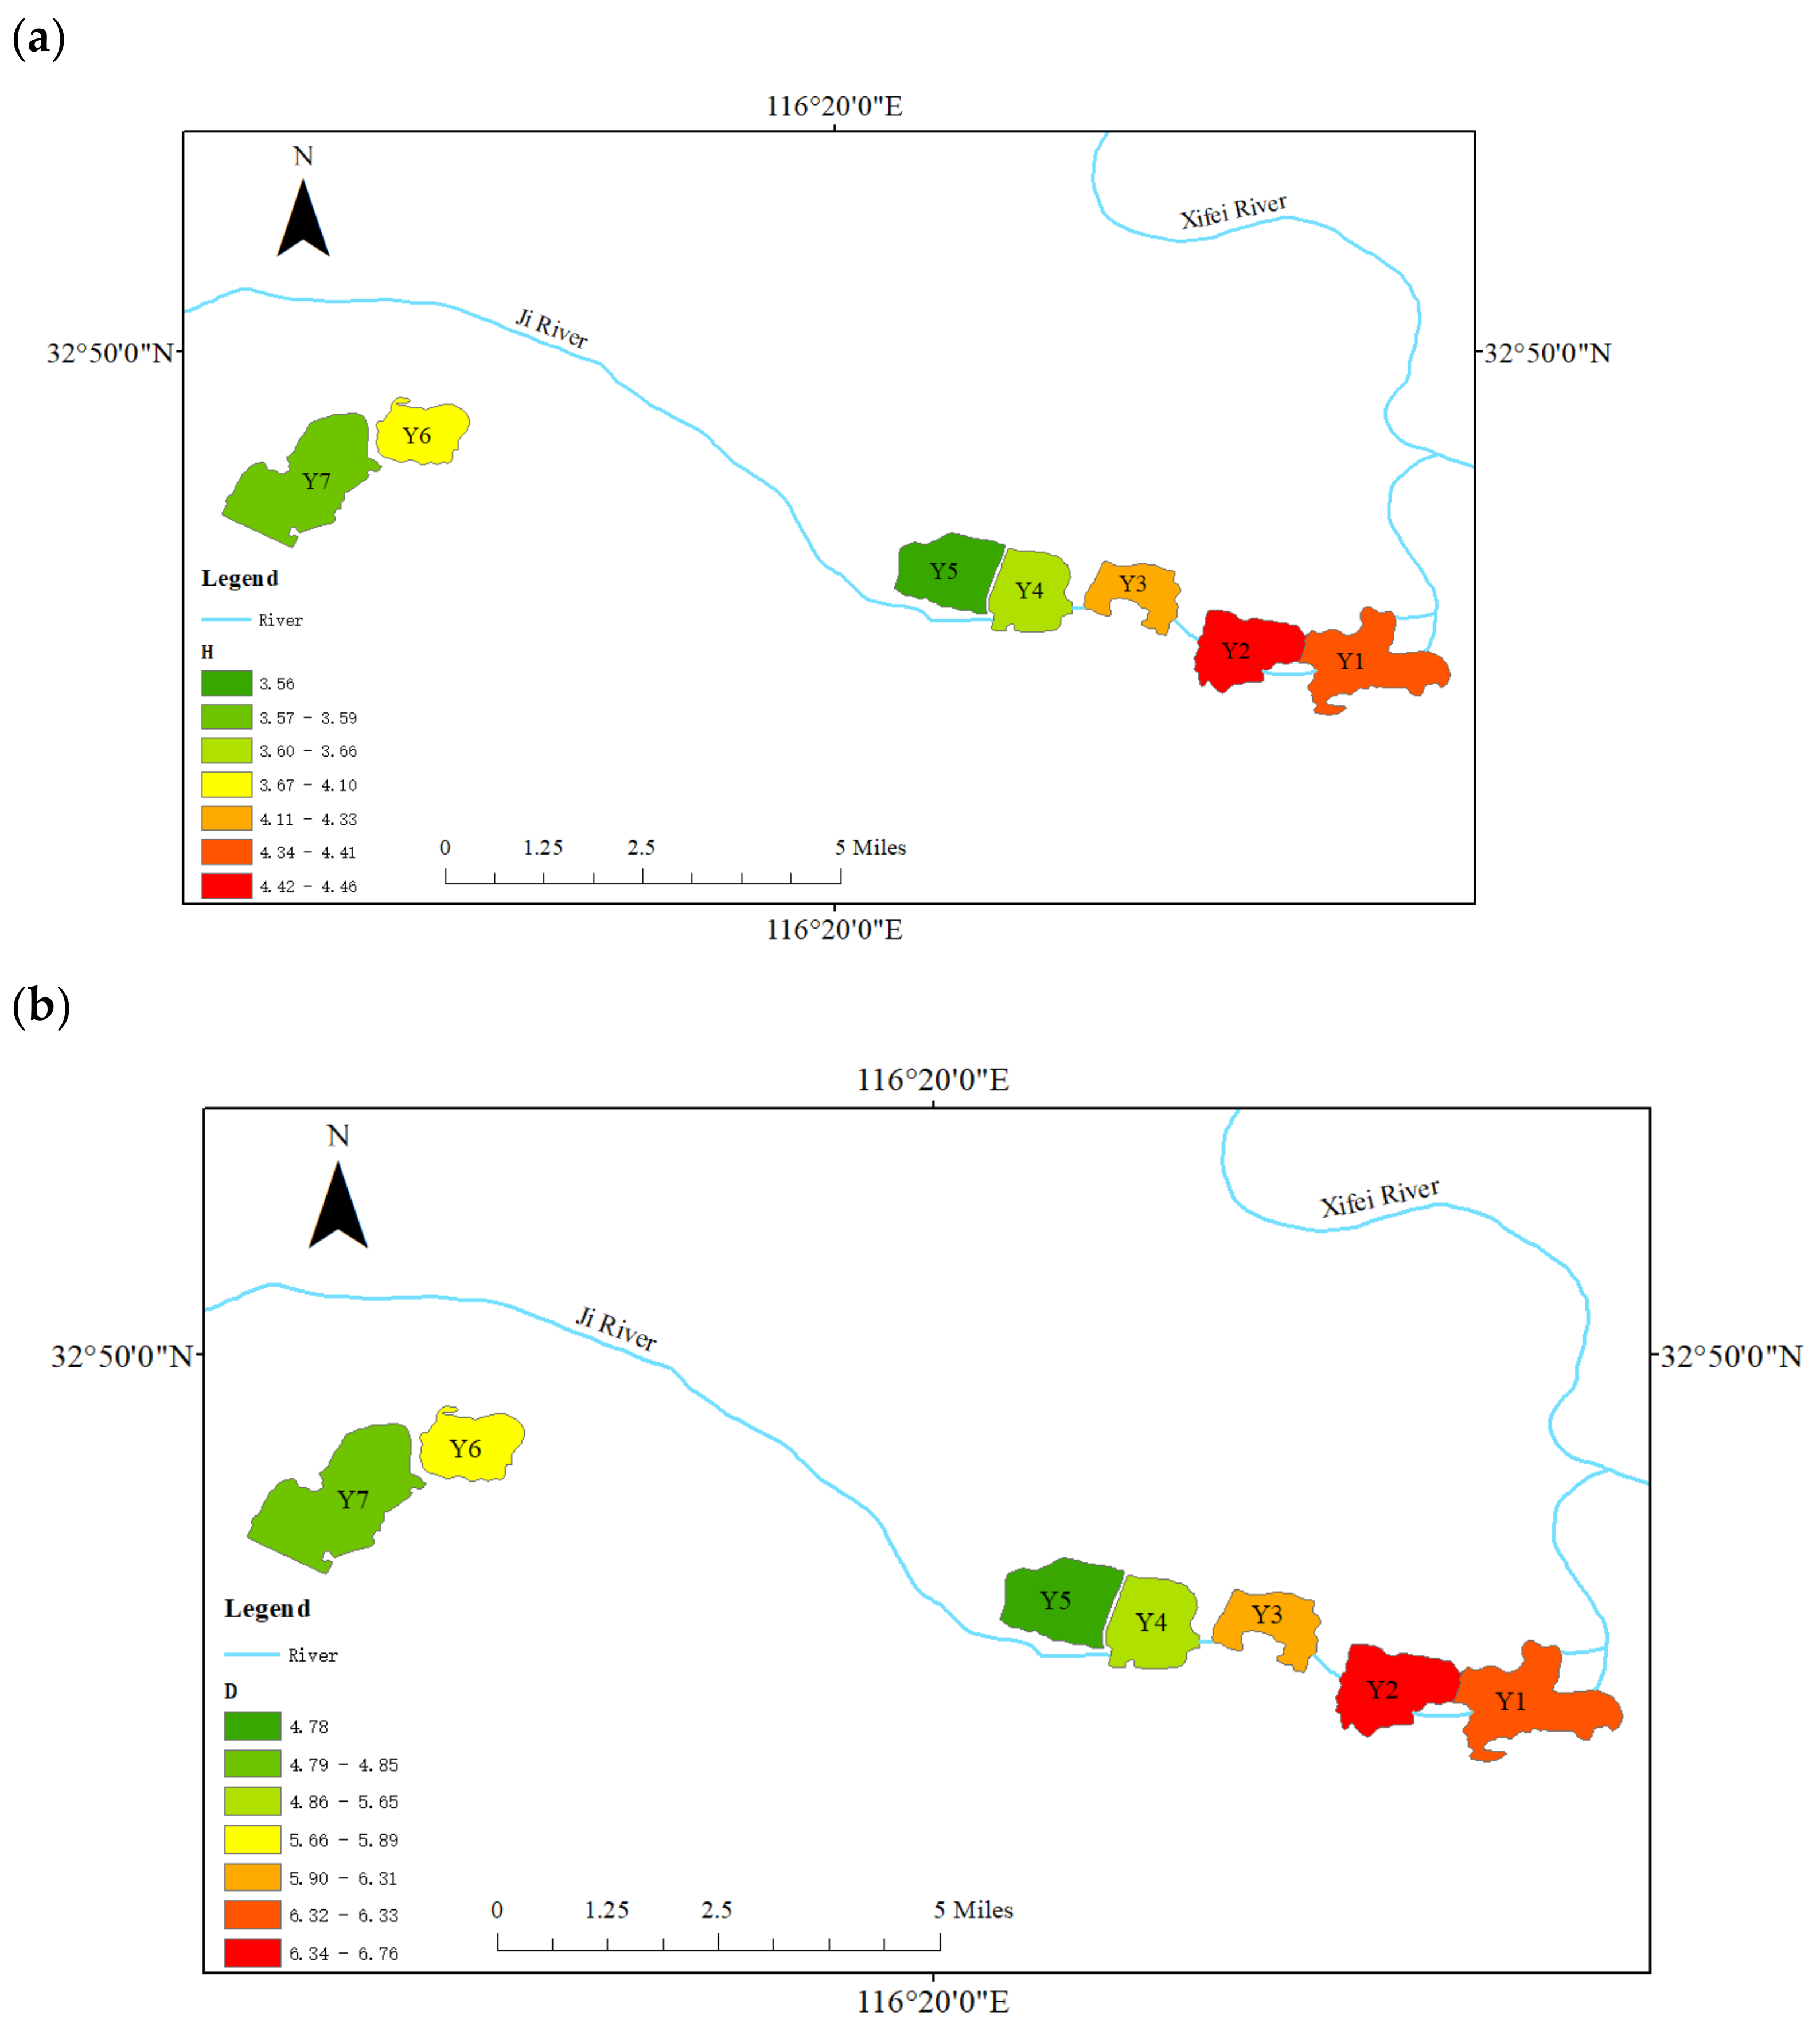
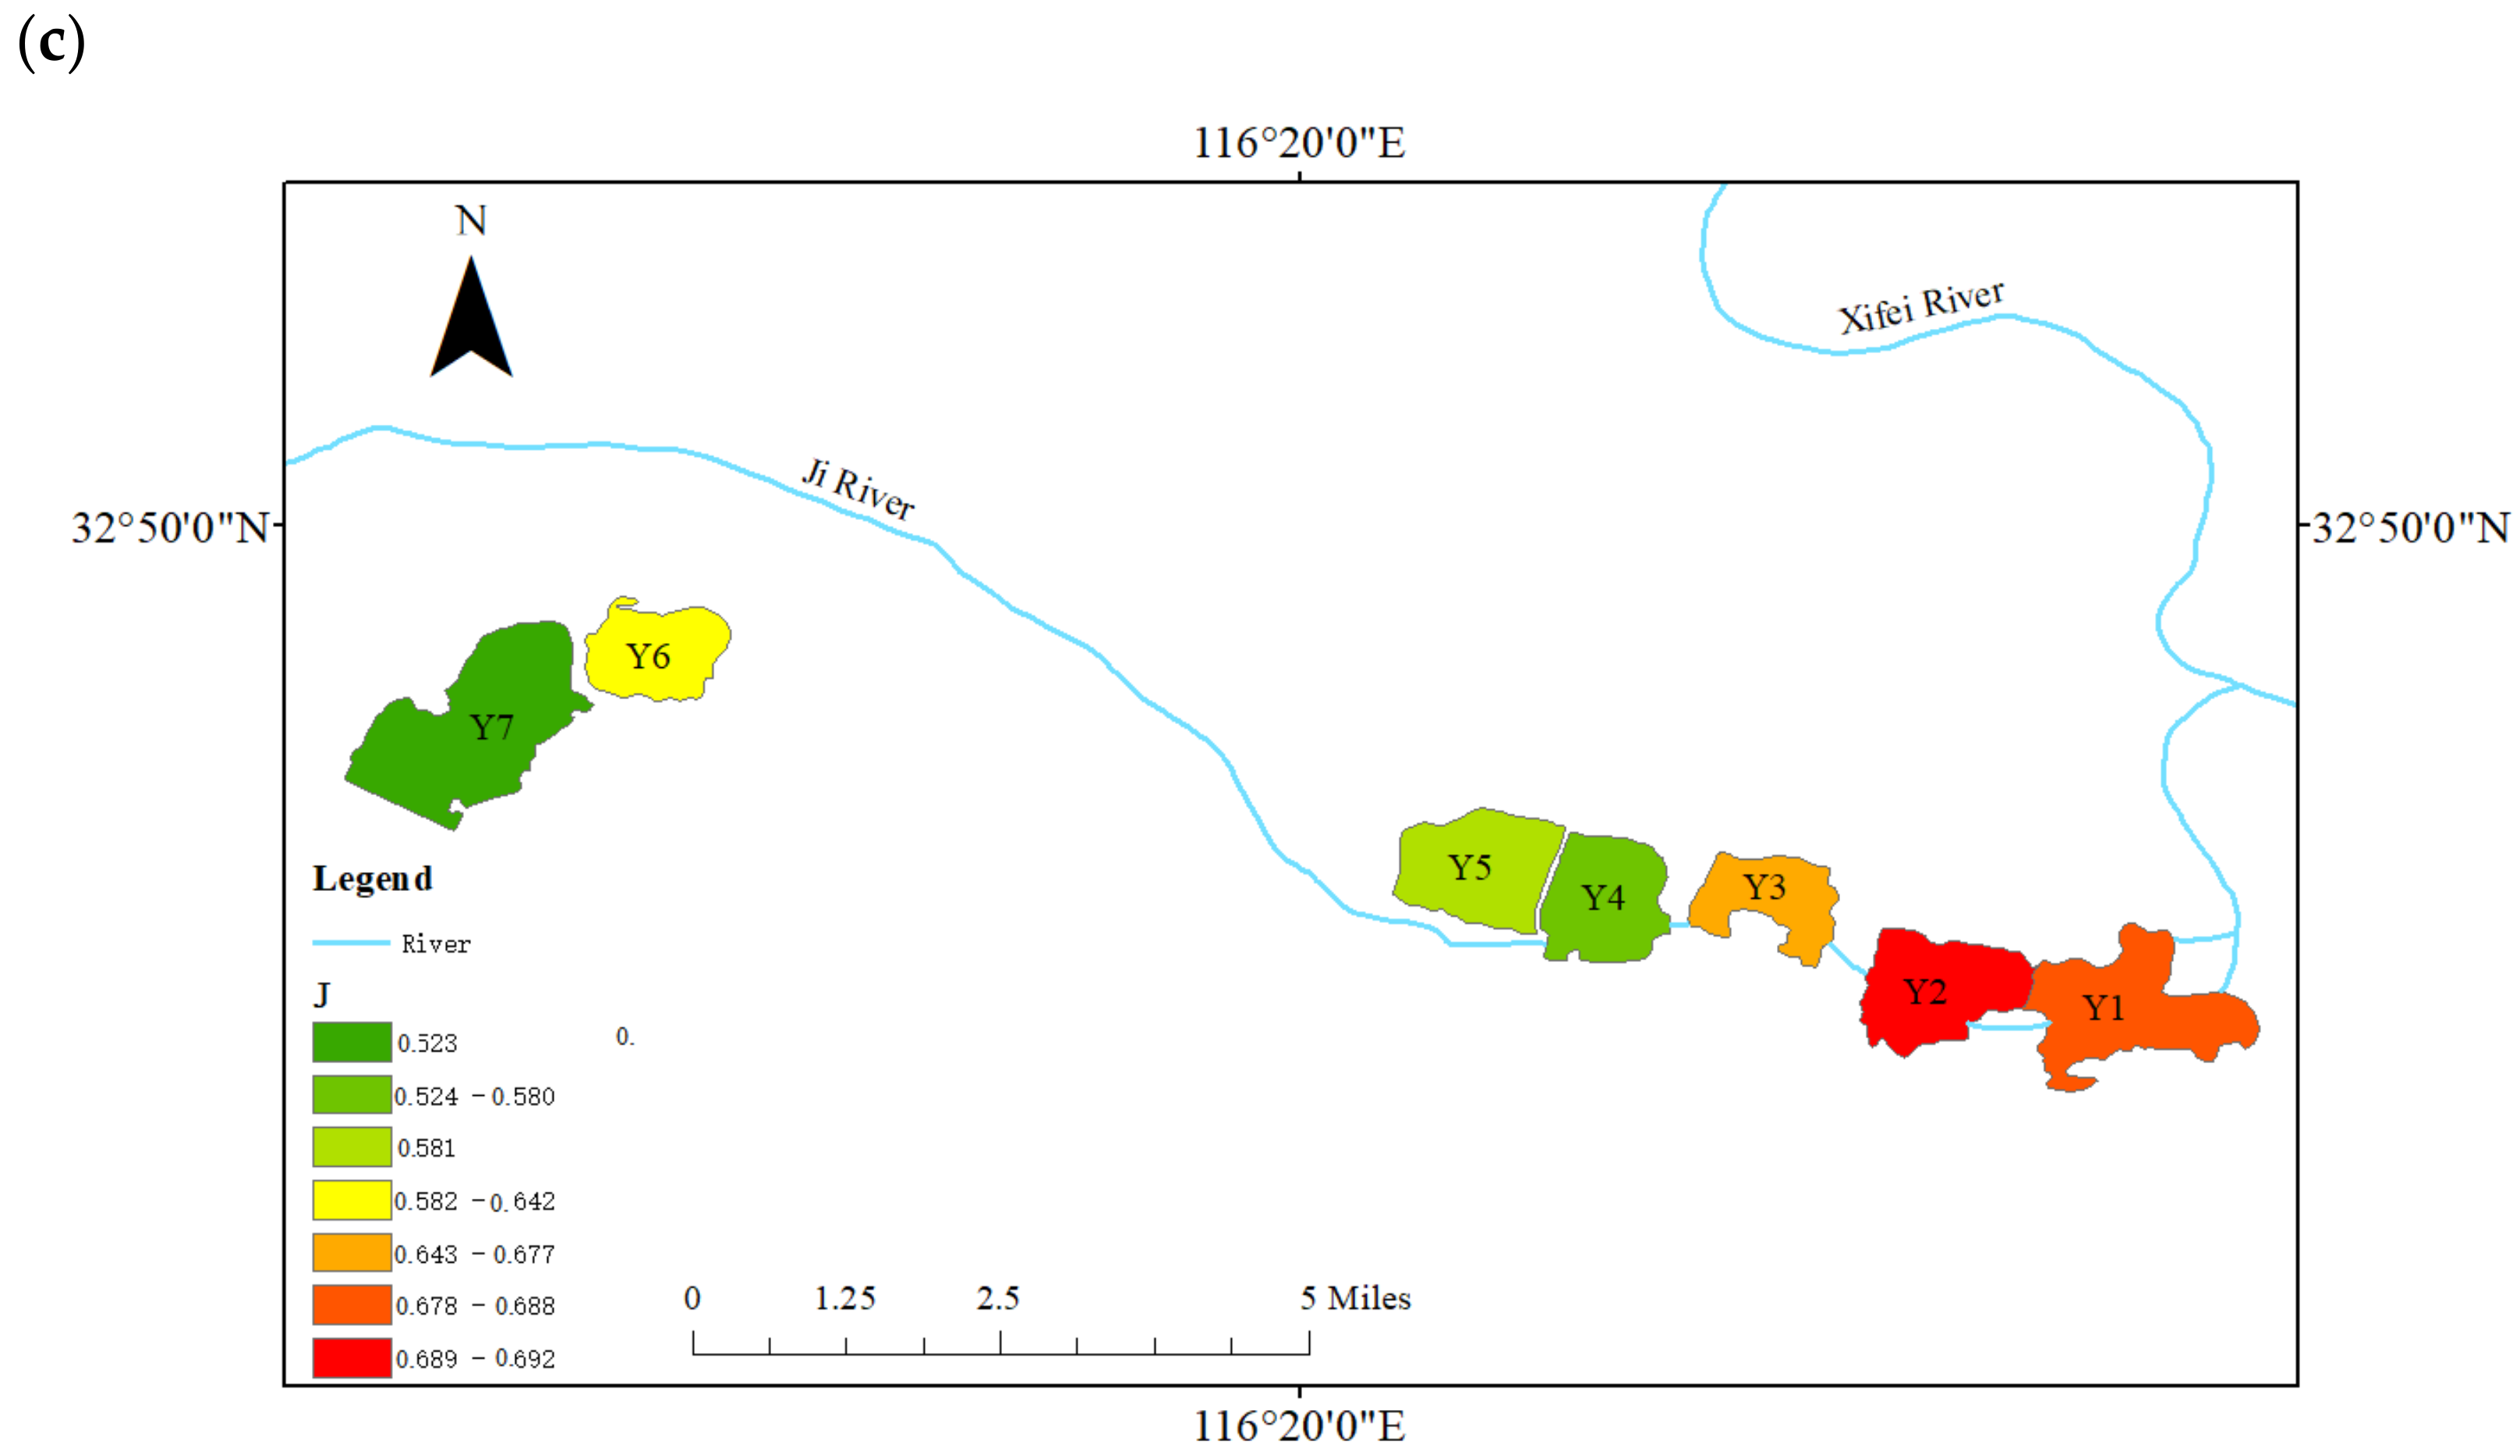
3.4. Spatial Distribution of Phytoplankton

There was a significant difference in the spatial distribution of the phytoplankton cell density (Figure 5). On the whole, the density of phytoplankton in the three closed lakes was higher than in the four lakes that are connected with the Ji River. The lowest value of the phytoplankton cell density was 19.23–74.55 × 10⁶ ind./L in Lake Y2, and the highest value was 74.55 × 10⁶ ind./L in Y6. The density of phytoplankton in the four lakes connected with the Ji River showed a high distribution in the west and a low distribution in the east. The lowest density of phytoplankton cells was found in Lake Y2, and the highest was found in Y4 (57.17 × 10⁶ ind./L).
The diversity indices of phytoplankton also showed a clear spatial distribution, with higher values in the three lakes (Y1, Y2, Y3) with good water connectivity (Figure 6).

4. Discussion

4.1. General Evaluation of Water Quality

The sinkhole lakes are mostly farmland and a small number of villages with many areas around the lakes being used as farmland. Pollutants such as pesticides and chemical fertilizers directly enter the water bodies from surface runoff, causing water quality pollution; in addition, local residents utilize the sinkhole lakes for long-term fishery farming and livestock farming around the water bodies, and the manure and domestic sewage produced directly enter the water bodies and affect the water quality [26]. According to the eutrophication grading standard of lakes, the average value of TN concentration in sunken lakes is above 1.3 mg/L, and the average value of total phosphorus concentration is above 0.7 mg/L, indicating that the sunken lakes are moderately eutrophic [27]. Many studies have shown that cyanobacteria and chlorophyta are the main dominant phylum in eutrophic lakes, and eutrophication increases the density of inedible cyanobacteria [28,29]. In our investigation, the sunken lakes formed a system of watershed algae with cyanobacteria as the dominant group in which the most dominant species was Leptolyngbya tenuis (40.90%, a multicellular group that belong to inedible algae). This finding was consistent with the above study. In addition, in general, among the seven sink lakes, the connected sink lakes (Y1, Y2, Y3, Y4) had lower levels of TP. This may be related to water system connectivity, which refers to the connectivity of water systems such as river trunks and tributaries, lakes and other wetlands, reflecting the continuity of water flow and the connectivity of water systems. The better the connectivity of a water system, the better the self-purification and pollution-holding capacity of the water flow. The flow of river water in the Ji River dilutes the content of total phosphorus in the water body, and Wang Yong’s study in Dongting Lake also illustrated that the overall trend of TP content decreases as the connectivity of a landscape improves [30]. Therefore, the water quality condition of the connected lakes was better than that of the closed lakes in terms of TP content. Phytoplankton diversity also reflects the pollution status of water bodies, and the results of this study show that the seven sunken lakes are clean water bodies or lightly polluted water bodies.

4.2. Effects of Environmental Factors on Phytoplankton Diversity and Cell Density

Environmental factors influenced both the phytoplankton diversity and cell density. The Pearson correlation analysis and the RDA analysis showed that the main physicochemical factors affecting phytoplankton community structure were WT, pH, Cond, AN, NO and TP. These were consistent with the results of many studies. Alkaline waters promote nitrification and nitrogen fixation in the nitrogen cycle of phytoplankton and facilitate photosynthesis [31]. A 19-year study on the Wuli River showed that the community structure and β-diversity of phytoplankton changed with global warming [32]. The relationship between nutrient ratios and nutrient limitation has been studied in Taihu Lake, and it was found that when TN:TP < 21.5~24.7, N is the nutrient limiting phytoplankton growth, while when TN:TP exceeds the above range, P is the limiting nutrient [33].
Temperature directly affects the growth and development of phytoplankton. The optimum temperature for cyanobacteria and chlorophyta is 25–30 °C [34]. The survey in this study was conducted in August 2021, and the water temperature was 24.5–27.9 °C. The dominant phylum investigated was the chlorophyta and the cyanobacteria phylum, also in accordance with the results of previous studies.
Nitrogen and phosphorus are key factors in controlling phytoplankton growth and eutrophication in water ecosystems [35,36]. Jiang et al. found that the main cause of large outbreaks of cyanobacteria in Chaohu Lake and surrounding rivers was the large amount of nutrients in the biological effluent discharged into the lake, phosphate was the key influencing factor, and there was a significant positive correlation between filamentous cyanobacteria and TP [37]. In addition, most domestic and international studies consider phosphorus as a priority factor for controlling phytoplankton growth [38,39]. In our investigation, it was demonstrated that the cell density of phytoplankton was significantly positively correlated with TP, and the RDA analysis results established that the cell density of the first dominant species, Leptolyngbya tenuis, was correlated with TP content, which also confirmed this conclusion.

4.3. Effects of Stream Connectivity on Phytoplankton Communities

Water system connectivity also changes the phytoplankton diversity and cell density. Y1, Y2, Y3 and Y4 in this study area are connected to rivers. The three lakes with better water system connectivity (Y1, Y2 and Y3), which is group G, have higher diversity indices than the other sunken lakes with significant consistency. This may be because water system connectivity not only improves water quality but also increases the landscape heterogeneity of the lakes, and lakes with higher landscape heterogeneity have higher phytoplankton biodiversity [40]. The water velocity of the Ji River is slow, and the scour effect of the water is insufficient in providing sufficient time for phytoplankton to occupy their adapted habitat. Some studies have shown that cyanobacteria easily become the dominant species in low velocity water [41].
Water retention time can directly influence the community structure and cell density of phytoplankton. In water bodies with longer hydraulic retention time, such as Y5, Y6 and Y7 in this study, the water exchange ability is weak, algae have a longer growth time, and the phytoplankton density is significantly higher [42]. Long-term water retention will lead to the weakening of nutrient exchange and the enrichment of nutrients and pollutants, thus indirectly affecting the growth of phytoplankton [43]. Our survey results exhibited that the closed lakes had higher TP content and higher phytoplankton cell density, confirming this conclusion.
In addition, the flow of river water through the Ji River brings aquatic plant propagules, which affect the existing amount and structure of aquatic vegetation in this water body and increase the aquatic vegetation cover of the water body. Aquatic plants can alleviate eutrophication and improve water quality, thus increasing the diversity of phytoplankton. Xu et al. observed that more coverage of Trapa bispinosa had a positive effect in decreasing TP. As shown in other studies, the increase in aquatic vegetation coverage led to a concurrent decrease in phytoplankton density [44]. Laboratory data have demonstrated that the aquatic macrophyte significantly inhibit phytoplankton by allelopathy [45,46]. For example, Chia et al. studied the effects of Nymphaea lotus L. and Polygonum limbatum Meisn. On the dynamic density changes of phytoplankton populations in a tropical artificial pond in Zaria, Nigeria. They recorded the highest density of phytoplankton species at a control station with no aquatic plants [47]. The growth of aquatic vegetation also provides different habitats for phytoplankton, which is conducive to the increase of phytoplankton diversity. Wang et al.’s research in the Huayang River revealed that the Huanghu Lake with richer aquatic vegetation had higher phytoplankton biodiversity [48]. Our results exhibited that the plankton density in the connected lakes was low, and the species of epiphytic diatoms (N. xigua and F. capucina) and green algae increased, while the species of cyanobacteria decreased. We speculated that the habitat diversification and allelopathy of aquatic vegetation in the connected lakes increased the diversity of phytoplankton and decreased the density of phytoplankton.

Author Contributions

Conceptualization: Z.Z.; data curation: L.J.; investigation: L.J., Y.Y., S.Z. and L.W.; methodology: Z.Z.; writing—original draft: L.J.; writing—review and editing: L.J. and Z.Z.; Funding acquisition: Z.Z. All authors have read and agreed to the published version of the manuscript.

Funding

This research was supported by the Aquatic Biological Resources Monitoring in KeyWatershed of Anhui Province (No. ZF2021-18-0786). This research was sponsored by Zhongze Zhou.

Institutional Review Board Statement

Not applicable.

Informed Consent Statement

Not applicable.

Data Availability Statement

The data presented in this study are available on request from Lingli Jiang.

Acknowledgments

Nature Reserve for their field support. We thank Mengfan Sun and Li Rui for their help and support in the experiment. We would like to thank Marci Baun from the University of California, Los Angeles, for editing the paper.

Conflicts of Interest

The authors declare no conflict of interest.

References

  1. Fu, Y.; He, Z.; Xi, W. Mining subsidence wetland and its ecological management in coal mine area with high diving level. Wetl. Sci. 2016, 5, 6. [Google Scholar]
  2. Custodio, E. Aquifer overexploitation: What does it mean? Hydrogeol. J. 2002, 10, 254–277. [Google Scholar] [CrossRef]
  3. Zhou, J.; Zhao, S.; Chai, B. Ecological Environment Management Model and Key Technologies of Coal Mining Subsidence Area in Huang-Huai-Hai Plain; China University of Geosciences Press: Wuhan, China, 2015. [Google Scholar]
  4. Zhang, B.; Yan, J.; Fan, T. Evaluation and analysis of water eutrophication in coalmine subsidence area. Coal Technol. 2012, 31, 159–161. [Google Scholar]
  5. Chen, X.; Gao, L.; Zhuo, L. Temporal and spatial distribution of nitrogen and phosphorus of Xieqiao coal mining subsided water area. Environ. Chem. 2013, 32, 446–450. [Google Scholar]
  6. Chen, J. Analysis and Evaluation of Heavy Metal Pollution in Water Bodies in Coal Mining Subsidence Area of Pan Coal Mine, Huainan, Anhui Province; Nanjing University: Nanjing, China, 2017. [Google Scholar]
  7. Lin, Z.; Wan, Y.; Xu, M.; Wang, C.; Wu, Q.; Zhou, Z. Metazoan zooplankton community structure and environmental drivers of Digou coal mining subsided lakes in Huainan. J. Lake Sci. 2018, 301, 171–182. [Google Scholar]
  8. Wang, L.; Wang, C.; Deng, D.; Zhao, X.; Zhou, Z. Temporal and spatial variations in phytoplankton: Correlations with environmental factors in Shengjin Lake, China. Environ. Sci. Pollut. Res. 2015, 22, 14144–14156. [Google Scholar] [CrossRef]
  9. Irigoien, X.; Harris, R.P.; Verheye, H.M. Copepod hatching success in marine ecosystems with high diatom concentrations. Nature 2002, 419, 387–389. [Google Scholar] [CrossRef]
  10. Cardinale, B.J. Biodiversity improves water quality through niche partitioning. Nature 2011, 472, 86–89. [Google Scholar] [CrossRef]
  11. Wang, C.; Wu, Q.; Wan, Y.; Lin, Z.; Xu, J.; Zhou, Z. Phytoplankton community structure of coal mining subsided area with environmental drivers in Linhuan Lake, Huaibei. J. Biol. 2019, 36, 37–43. [Google Scholar]
  12. Wan, Y.; Zhou, Z.; Wang, C.; Lin, Z.; Wu, Q. Community structure characteristics of phytoplankton in Digou coal mining subsidence lake. J. Biol. 2018, 35, 75–82. [Google Scholar]
  13. Arrigo, K.R. Erratum: Marine microorganisms and global nutrient cycles. Nature 2005, 437, 349–355. [Google Scholar] [CrossRef]
  14. Gilstad, M.; Sakshaug, E. Growth rates of ten diatom species from the Barents Sea at different irradiances and day lengths. Mar. Ecol. Prog. Ser. 1990, 64, 169–173. [Google Scholar] [CrossRef]
  15. Maguer, J.F.; l’Helguen, S.; Caradec, J.; Klein, C. Size-dependent uptake of nitrate and ammonium as a function of light in well-mixed temperate coastal waters. Cont. Shelf Res. 2011, 31, 1620–1631. [Google Scholar] [CrossRef] [Green Version]
  16. Zhang, O.; Bu, H.; Wang, C. The influence of water system connectivity of Yangtze River for river health. Yangtze River 2010, 41, 1–5. [Google Scholar]
  17. Junk, W. The Flood Pulse Concept in river-floodplain Systems. Can. J. Spec. Publ. Fish. Aquat. Sci. 1989, 106, 110–127. [Google Scholar]
  18. Gumiero, B.; Mant, J.; Hein, T. Linking the restoration of rivers and riparian zones/wetlands in Europe: Sharing knowledge through case studies. Ecol. Eng. 2013, 56, 36–50. [Google Scholar] [CrossRef]
  19. Hu, H.J.; Wei, Y.X. The Freshwater Algae of China: Systematics, Taxonomy and Ecology; Science Press: Beijing, China, 2006. [Google Scholar]
  20. State Environmental Protection Bureau (SEPB). Methods of Monitoring and Analysis for Water and Wastewater, 4th ed.; China Environmental Science Press: Beijing, China, 2002. [Google Scholar]
  21. Jin, X.C.; Tu, Q.Y. The Standard Methods for Observation and Analysis of Lake Eutrophication; China Environmental Science Press: Beijing, China, 1990. [Google Scholar]
  22. Shannon, C.E.; Wiener, W. The Mathematical Theory of Communication; University of Illinois Press: Urbana, IL, USA, 1949. [Google Scholar]
  23. Pielou, E.C. An Introduction to Mathematical Ecology; Wiley-Interscience, Inc.: New York, NY, USA, 1969. [Google Scholar]
  24. Margalef, R. Information theory in ecology. Gen. Syst. 1958, 3, 36–71. [Google Scholar]
  25. Wu, C.; Zhang, Q.G. Progress of freshwater plankton diversity and quantitative analysis methods. Anhui Agric. Bull. 2009, 15, 41–42. [Google Scholar]
  26. Liu, Y. Research on Coordinated Utilization of Water and Soil Resources in Coal Mine Area with High Diving Position; China University of Mining and Technology: Beijing, China, 2014. [Google Scholar]
  27. Jin, X.C.; Tu, Q.Y. Lake Eutrophication Investigation Specification; China Environmental Science Press: Beijing, China, 1990. [Google Scholar]
  28. Li, Y.; Geng, M.; Yu, J.; Du, Y.; Xu, M.; Zhang, W.; Chen, F. Eutrophication decrease compositional dissimilarity in freshwater plankton communities. Sci. Total Environ. 2022, 821, 153434. [Google Scholar] [CrossRef]
  29. Chao, C.; Lv, T.; Wang, L.; Li, Y.; Han, C.; Yu, W.; Liu, C. The spatiotemporal characteristics of water quality and phytoplankton community in a shallow eutrophic lake: Implications for submerged vegetation restoration. Sci. Total Environ. 2022, 821, 153460. [Google Scholar] [CrossRef]
  30. Wang, Y. Characteristics of Phytoplankton Community Structure in Dongting Lake under Different Landscape Connectivity; Hubei University of Technology: Wuhan, China, 2021. [Google Scholar]
  31. Dieter, L.; Andrew, F.; Brigitte, N. Experimental eutrophication of a shallow acidic mining lake and effects on the phytoplankton. Hydrobiologia 2003, 506, 753–758. [Google Scholar]
  32. Li, Y.; Shen, R.; Liu, X.; Su, H.; Wu, F.; Chen, F. Impacts of nutrient reduction on temporal β-diversity of rotifers: A 19-year limnology case study on Lake Wuli, China. Water Res. J. Int. Water Assoc. 2022, 216, 1–14. [Google Scholar] [CrossRef] [PubMed]
  33. Wang, X.; Lu, Y.; He, G.; Han, J.; Wang, T. Multivariate analysis of interactions between phytoplankton biomass and environmental variables in Taihu Lake, China. Environ. Monit. Assess. 2007, 133, 243–253. [Google Scholar] [CrossRef] [PubMed]
  34. Hinder, S.L.; Hays, G.C.; Edwards, M.; Roberts, E.C.; Walne, A.W.; Gravenor, M.B. Changes in marine dinoflagellate and diatom abundance under climate change. Nat. Clim. Change 2012, 2, 271–275. [Google Scholar] [CrossRef]
  35. Ma, J.; Qin, B.; Wu, P.; Zhou, J.; Niu, C.; Deng, J.; Niu, H. Controlling cyanobacterial blooms by managing nutrient ratio and limitation in a large hyper-eutrophic lake: Lake Taihu, China. J. Environ. Sci. 2015, 27, 80–86. [Google Scholar] [CrossRef]
  36. Smith, W.O.; Ainley, D.G.; Cattaneo-Vietti, R. Trophic interactions within the Ross Sea continental shelf ecosystem. Philos. Trans. R. Soc. B Biol. Sci. 2007, 362, 95–111. [Google Scholar] [CrossRef]
  37. Jiang, Y.; He, W.; Liu, W.; Qin, N.; Ouyang, H.; Wang, Q.; Kong, X.; He, Q.; Yang, C.; Yang, B.; et al. The seasonal and spatial variations of phytoplankton community and their correlation with environmental factors in a large eutrophic Chinese lake (Lake Chaohu). Ecol. Indic. 2014, 40, 58–67. [Google Scholar] [CrossRef]
  38. Howarth, R.W.; Marino, R. Nitrogen as the limiting nutrient for eutrophication in coastal marine ecosystems: Evolving views over three decades. Limnol. Oceanogr. 2006, 51, 364–376. [Google Scholar] [CrossRef] [Green Version]
  39. Chen, K.; Bao, X.; Shi, L. Reconstruction demonstration project of Wuli Lake in Taihu Lake (large-scale enclosure experiment). J. Lake Sci. 2006, 18, 139–149. [Google Scholar]
  40. Paul, W.J.; Hamilton, D.P.; Ostrovsky, I.; Miller, S.D.; Zhang, A.; Muraoka, K. Catchment land use and trophic state impacts on phytoplankton composition: A case study from the Rotorua lakes’ district, New Zealand. Hydrobiologia 2012, 698, 133–146. [Google Scholar] [CrossRef]
  41. Mitrovic, S.M.; Chessman, B.C.; Davie, A.; Avery, E.L.; Ryan, N. Development of blooms of Cyclotella meneghiniana and Nitzschia spp. (Bacillariophyceae) in a shallow river and estimation of effective suppression flows. Hydrobiologia 2008, 596, 173–185. [Google Scholar] [CrossRef]
  42. Zhang, S.; Li, C.; Fu, Y. Nutrient status and nutrient output of tributary bay of Three Gorges Reservoir. Environ. Sci. 2008, 29, 6. [Google Scholar]
  43. Wang, Y. Effect mechanism of hydrodynamic forces on algae. J. Anhui Agric. Sci. 2013, 41, 2. [Google Scholar]
  44. Xu, W.W.; Hu, W.P.; Deng, J.C.; Zhu, J.G.; Li, Q.Q. Effects of harvest management of Trapa bispinosa on an aquatic macrophyte community and water quality in a eutrophic lake. Ecol. Eng. 2014, 64, 120–129. [Google Scholar] [CrossRef]
  45. Mulderij, G.; Nes, E.H.V.; Donk, E.V. Macrophyte-phytoplankton interactions: The relative importance of allelopathy versus other factors. Ecol. Model. 2007, 204, 85–92. [Google Scholar] [CrossRef]
  46. Felpeto, A.B.; Roy, S.; Vasconcelos, V.M. Allelopathy prevents competitive exclusion and promotes phytoplankton biodiversity. Oikos J. Ecol. 2017, 127, 85–98. [Google Scholar] [CrossRef] [Green Version]
  47. Chia, A.M.; Iortsuun, D.N.; Stephen, B.J.; Ayobamire, A.E.; Ladan, Z. Phytoplankton responses to changes in macrophyte density in a tropical artificial pond in Zaria, Nigeria. Afr. J. Aquat. Sci. 2011, 36, 35–46. [Google Scholar] [CrossRef]
  48. Wang, Y.; Wang, W.; Zhou, Z.; Xia, W.; Zhang, Y. Effect of fast restoration of aquatic vegetation on phytoplankton community after removal of purse seine culture in huayanghe lakes. Sci. Total Environ. 2021, 768, 144024. [Google Scholar] [CrossRef]
Figure 1. Distribution of sunken lakes in Huainan.
Diversity 15 00291 g001
Figure 2. Changes in relative densities of different phytoplankton taxa in sunken lakes. Abbreviations used in the diagram: Bac: bacillariophyta; Cry: cryptophyte; Pyr: pyrrophyta; Cya: cyanobacteria; Chr: chrysophyta; Chl: chlorophyta; Eug: euglenophyta; Xan: xanthophyte.
Diversity 15 00291 g002
Figure 3. Average cell density of different phytoplankton in sunken lakes. Abbreviations used in the diagram: Bac: bacillariophyta; Cry: cryptophyte; Pyr: pyrrophyta; Cya: cyanobacteria; Chr: chrysophyta; Chl: chlorophyta; Eug: euglenophyta; Xan: xanthophyte.
Diversity 15 00291 g003
Figure 4. Phytoplankton species (red arrow) and environmental factor (blue arrow) biplot based on RDA: (a) all sunken lakes; (b) sunken lakes with good water system connectivity (G); (c) sunken lakes with closed lakes and poor water system connectivity (B).
Diversity 15 00291 g004aDiversity 15 00291 g004b
Figure 5. Density of phytoplankton in sunken lakes.
Diversity 15 00291 g005
Figure 6. Spatial variation in diversity indexes of phytoplankton in sunken lakes: (a) Shannon–Wiener index of phytoplankton in sunken lakes; (b) Pielou index of phytoplankton in sunken lakes; (c) Margalef index of phytoplankton in sunken lakes.
Diversity 15 00291 g006aDiversity 15 00291 g006b
Table 1. Physicochemical factors of sunken lakes (average value ± standard deviation).
Y1Y2Y3Y4Y5Y6Y7
WT/℃27.58 ± 0.2026.75 ± 0.2226.75 ± 0.4626.60 ± 0.1126.85 ± 0.2326.15 ± 0.6326.60 ± 0.16
pH7.57 ± 0.107.49 ± 0.097.57 ± 0.127.84 ± 0.047.94 ± 0.238.39 ± 0.218.17 ± 0.12
DO/(mg/L)6.43 ± 1.035.17 ± 0.916.41 ± 0.865.68 ± 0.625.19 ± 0.574.67 ± 1.056.04 ± 0.77
Cond/(Μs/cm)745.75 ± 2.59768.75 ± 11.16761.50 ± 11.59742.14 ± 0.99710.25 ± 3.19717.50 ± 12.06767.63 ± 1.80
SD/cm53.13 ± 14.9973.88 ± 11.9058.75 ± 10.4651.29 ± 7.2152.63 ± 9.4262.13 ± 7.9355.25 ± 7.45
WD/m5.23 ± 1.584.23 ± 1.465.58 ± 1.064.03 ± 2.375.18 ± 2.585.13 ± 2.364.65 ± 2.58
Sdep/m2.73 ± 2.502.24 ± 2.012.83 ± 2.441.56 ± 1.602.64 ± 2.852.65 ± 2.682.38 ± 2.58
NO/(mg/L)0.93 ± 0.101.50 ± 0.171.52 ± 0.160.62 ± 0.110.14 ± 0.020.07 ± 0.050.18 ± 0.02
TP/(mg/L)0.24 ± 0.020.32 ± 0.100.21 ± 0.070.20 ± 0.040.27 ± 0.040.45 ± 0.210.67 ± 0.07
TN/(mg/L)0.41 ± 0.471.62 ± 0.201.89 ± 0.481.47 ± 0.191.22 ± 0.271.07 ± 0.761.42 ± 0.43
AN/(mg/L)0.68 ± 0.070.20 ± 0.020.21 ± 0.110.20 ± 0.020.30 ± 0.051.15 ± 0.810.57 ± 0.04
Table 2. Dominant species of phytoplankton.
PhylumDominant SpeciesDominance of Phytoplankton Species (Y)Proportion of Densities of Different Species (%)
CyanobacteriaLeptolyngbya tenuis0.88140.90
Chroococcus minor0.0231.49
Merismopedia sinica0.2432.94
ChlorophytaAuxenochlorella pyrenoidosa0.4263.21
Crucigenia quadrata0.0514.45
CryptophytaCryptomonas ovata0.1331.80
Table 3. Relationship between the cell density of the phytoplankton and environmental factors.
ParameterCell Density
r
WT−0.412 **
pH0.554 **
DO−0.168
Cond−0.351 **
SD−0.255
WD−0.011
Sdep0.036
NO−0.713 **
TP0.335 *
TN−0.087
AN0.489 **
* represents a significant correlation (p < 0.05); ** represents a very significant correlation (p < 0.01).
Table 4. Summary of RDA analyses with environment variables explaining phytoplankton assemblage in sunken lakes.
Axes1234Total Variance
Eigenvalues0.46030.06110.02430.01641
Species–environment correlations46.0352.1454.5756.22
Cumulative percentage variance of species data0.89260.53990.65200.5346
Cumulative percentage variance of
species–environment relationship
80.1190.7594.9897.84
Sum of all eigenvalues 1
Table 5. Summary of RDA analyses with environment variables explaining phytoplankton assemblage in sunken lakes with good water system connectivity (G).
Axes1234Total Variance
Eigenvalues0.39100.10860.05790.02801
Species–environment correlations39.1049.9655.7558.55
Cumulative percentage variance of
species data
0.86910.82500.66040.5387
Cumulative percentage variance of
species–environment relationship
63.9481.6991.1695.73
Sum of all eigenvalues 1
Table 6. Summary of RDA analyses with environment variables explaining phytoplankton assemblage in sunken lakes with closed lakes and poor water system connectivity (B).
Axes1234Total Variance
Eigenvalues0.31700.12160.07570.05631
Species–environment correlations31.7043.8551.4357.06
Cumulative percentage variance of
species data
0.93280.77330.52220.8531
Cumulative percentage variance of
species–environment relationship
52.5272.6685.2194.54
Sum of all eigenvalues 1
Disclaimer/Publisher’s Note: The statements, opinions and data contained in all publications are solely those of the individual author(s) and contributor(s) and not of MDPI and/or the editor(s). MDPI and/or the editor(s) disclaim responsibility for any injury to people or property resulting from any ideas, methods, instructions or products referred to in the content.

