Article

Long-Term Succession on Offshore Wind Farms and the Role of Species Interactions

1
Marine Ecology and Management (MARECO), Royal Belgian Institute of Natural Sciences (RBINS), Vautierstraat 29, 1000 Brussels, Belgium
2
Marine Biology Research Group, Department of Biology, Ghent University, Krijgslaan 281/S8, 9000 Ghent, Belgium
*
Authors to whom correspondence should be addressed.
These authors contributed equally to this work.
Diversity 2023, 15(2), 288; https://doi.org/10.3390/d15020288
Submission received: 8 November 2022 / Revised: 24 January 2023 / Accepted: 30 January 2023 / Published: 16 February 2023

Abstract

:
The presence of biofouling communities in very large densities in offshore wind farms (OWFs) generates broad effects on the structure and functioning of the marine ecosystem, yet the mechanisms behind the temporal development of these communities remain poorly understood. Here, we use an 11-year series on biofouling fauna from OWFs installed in Belgian waters to determine succession patterns and to unravel the role of biological interactions in shaping community development. Our analysis shows that biological interactions, besides age and location, affect diversity patterns in OWFs. The abundance of foundation species, predators, and space occupiers was significantly related to richness and/or diversity. The trends in richness, diversity, and community composition suggest that no permanent stable climax is reached after 11 years, which can be linked to the dynamic and disturbance-prone environment of offshore fouling communities.

1. Introduction

The global and rapid proliferation of offshore wind farms (OWFs) is leading to the establishment of new types of artificial hard substrates spanning the entire water column in the open sea environment. The extent of this habitat will increase substantially in the next thirty years, as the current offshore wind installation capacity is expected to increase more than ten-fold in the race towards achieving net-zero greenhouse gas emissions by 2050 in the EU [1] and globally (e.g., [2]). The creation of these new habitats increases local habitat diversity, which in turn leads to increased species diversity and abundance. Much of the information documenting high biodiversity on OWFs is unfortunately derived from one-off sampling events or short-term series [3,4] and fails to describe the role of ecological succession therein.
Like any new substrate submerged in seawater, OWF foundations are rapidly colonized by organisms forming a dense biofouling community [5] which can largely affect the macrobenthos of the surrounding seafloor [6], demersal and benthopelagic fish [7,8] (i.e., the so-called reef effect, [9,10]), and food web structure [11]. In addition, this biofouling community filters large amounts of water [12], affecting primary productivity [13,14] and the redistribution of organic matter on the sea floor [15], ultimately impacting benthic ecosystem functioning [16]. The magnitude of the effects will likely change with time, as the abundance and diversity of the biofouling community are significantly related to the age of the installed structures [17]. However, to our knowledge, there is as of yet no formal analysis on how biofouling composition develops over time on OWFs and how biotic interactions might drive the diversity patterns of these communities.
The classical theory of ecological succession assumes that communities follow predictable stepwise changes in community composition over time to eventually reach a persistent stage called climax [18]. Contrary to newly exposed landforms where succession may take several hundreds of years, the succession of animals and algae on recently denuded rock walls in the marine subtidal zone has been said to take less time, approximately a decade [19]. However, few studies have monitored the development of fouling assemblages over such an extended time period, and a predictable, stable climax community has in fact rarely been described for marine biofouling communities [20,21,22,23,24]. The rare long-term studies investigating the development of biofouling assemblages on large artificial hard substrates indicate temporal changes in community composition after six [24] or even eleven years [23]. Alternative mechanisms have been proposed to explain succession patterns on marine hard substrates such as the theory of several possible stable or climax communities [21] or the theory of the repeated successional pathway of the ‘cycle climax’, in which a climax community develops repeatedly followed by seasonal and annual variations [25].
The initial pool of colonizing species on a marine artificial hard structure depends on both the location and the timing of its introduction and on the nature of the surface [26,27,28], making initial community development rather variable and relatively unpredictable. Subsequent changes in species composition are more driven by biological interactions and depend, in part, on the degree to which already established species modify the environment, either by facilitating or inhibiting species settlement and/or establishment (e.g., [29,30]).
Although recent research has identified food resource limitation as a driver for spatial patterns of biofouling fauna on offshore wind turbines [14], space availability is considered the key limiting resource for marine hard substrate communities [31,32]. Organisms that are able to modify the quality and availability of space can drive the development and structure of benthic communities. One of these types of organisms is foundation species (sensu [33]). Foundation species are important in maintaining and driving biodiversity in benthic communities as they modify their habitat or provide a suitable habitat for other species [34,35,36]. Mollusks and other calcifying organisms are typical examples of foundation species; their shells create new substrates for attachment and they provide refuge from predators (e.g., [37,38,39]). Another group of species important for diversity is top predators (e.g., echinoderms). Predation can have a major impact on local biodiversity through foraging activities [40], thereby structuring faunal composition [41]. Low to medium abundance of top predators may increase species diversity. In that case, they can be classified as keystone species (e.g., [42,43,44]). However, when predators become dominant, they may have a negative effect on species richness and diversity [44,45,46]. Where predators are absent or found in lower abundance, species with a competitive advantage (e.g., space occupiers such as ascidians and anemones [32]) can become dominant and often monopolize all of the space available. Consequently, this limits the arrival of any new propagules which affects the diversity of a community [32].
The influence of the biological interactions described above has rarely been considered in research on the succession of biofouling communities on artificial hard substrates (however, see [40]). Here, we investigate the possible impact of such species on the diversity patterns of the OWF fouling community. We use the blue mussel Mytilus edulis as a foundation species; the sea anemone Metridium senile, and tube-building amphipods Jassa herdmani and Monocorophium acherusicum, as space occupiers; and the sea star Asterias rubens and the sea urchin Psammechinus miliaris as predators. While these organisms thrive on offshore structures in the North Sea, mussels, anemones, amphipods, and echinoderms represent the main fauna in a variety of offshore biofouling communities worldwide (e.g., [47,48,49,50,51,52,53]).
Unraveling the role of species interactions of fouling community descriptors in OWFs would require manipulative experiments that are regularly performed in the shallow subtidal coastal environment [32,54]. Such experiments have not been performed yet in OWF environments because of logistical reasons and strict safety regulations. However, long-term data, reflecting the in situ consequences of species interactions and dedicated statistical analyses may help to understand succession patterns and processes on OWFs and guide future experimental research. In this paper, we analyze an 11-year series of the macrobenthic biofouling assemblage from the first two OWFs installed in Belgian waters. We use multivariate approaches to determine factors driving the general patterns of ecological succession in the two wind farms and use statistical modelling to explore the effects of foundation species, predators, and space occupiers in determining the diversity of the biofouling community during this succession. We hypothesize that the community composition in the two OWFs will converge over time despite initial differences. Additionally, we hypothesize that foundation species and predators will positively affect biodiversity patterns, while space occupiers will have a negative impact on the diversity of OWF.

2. Materials and Methods
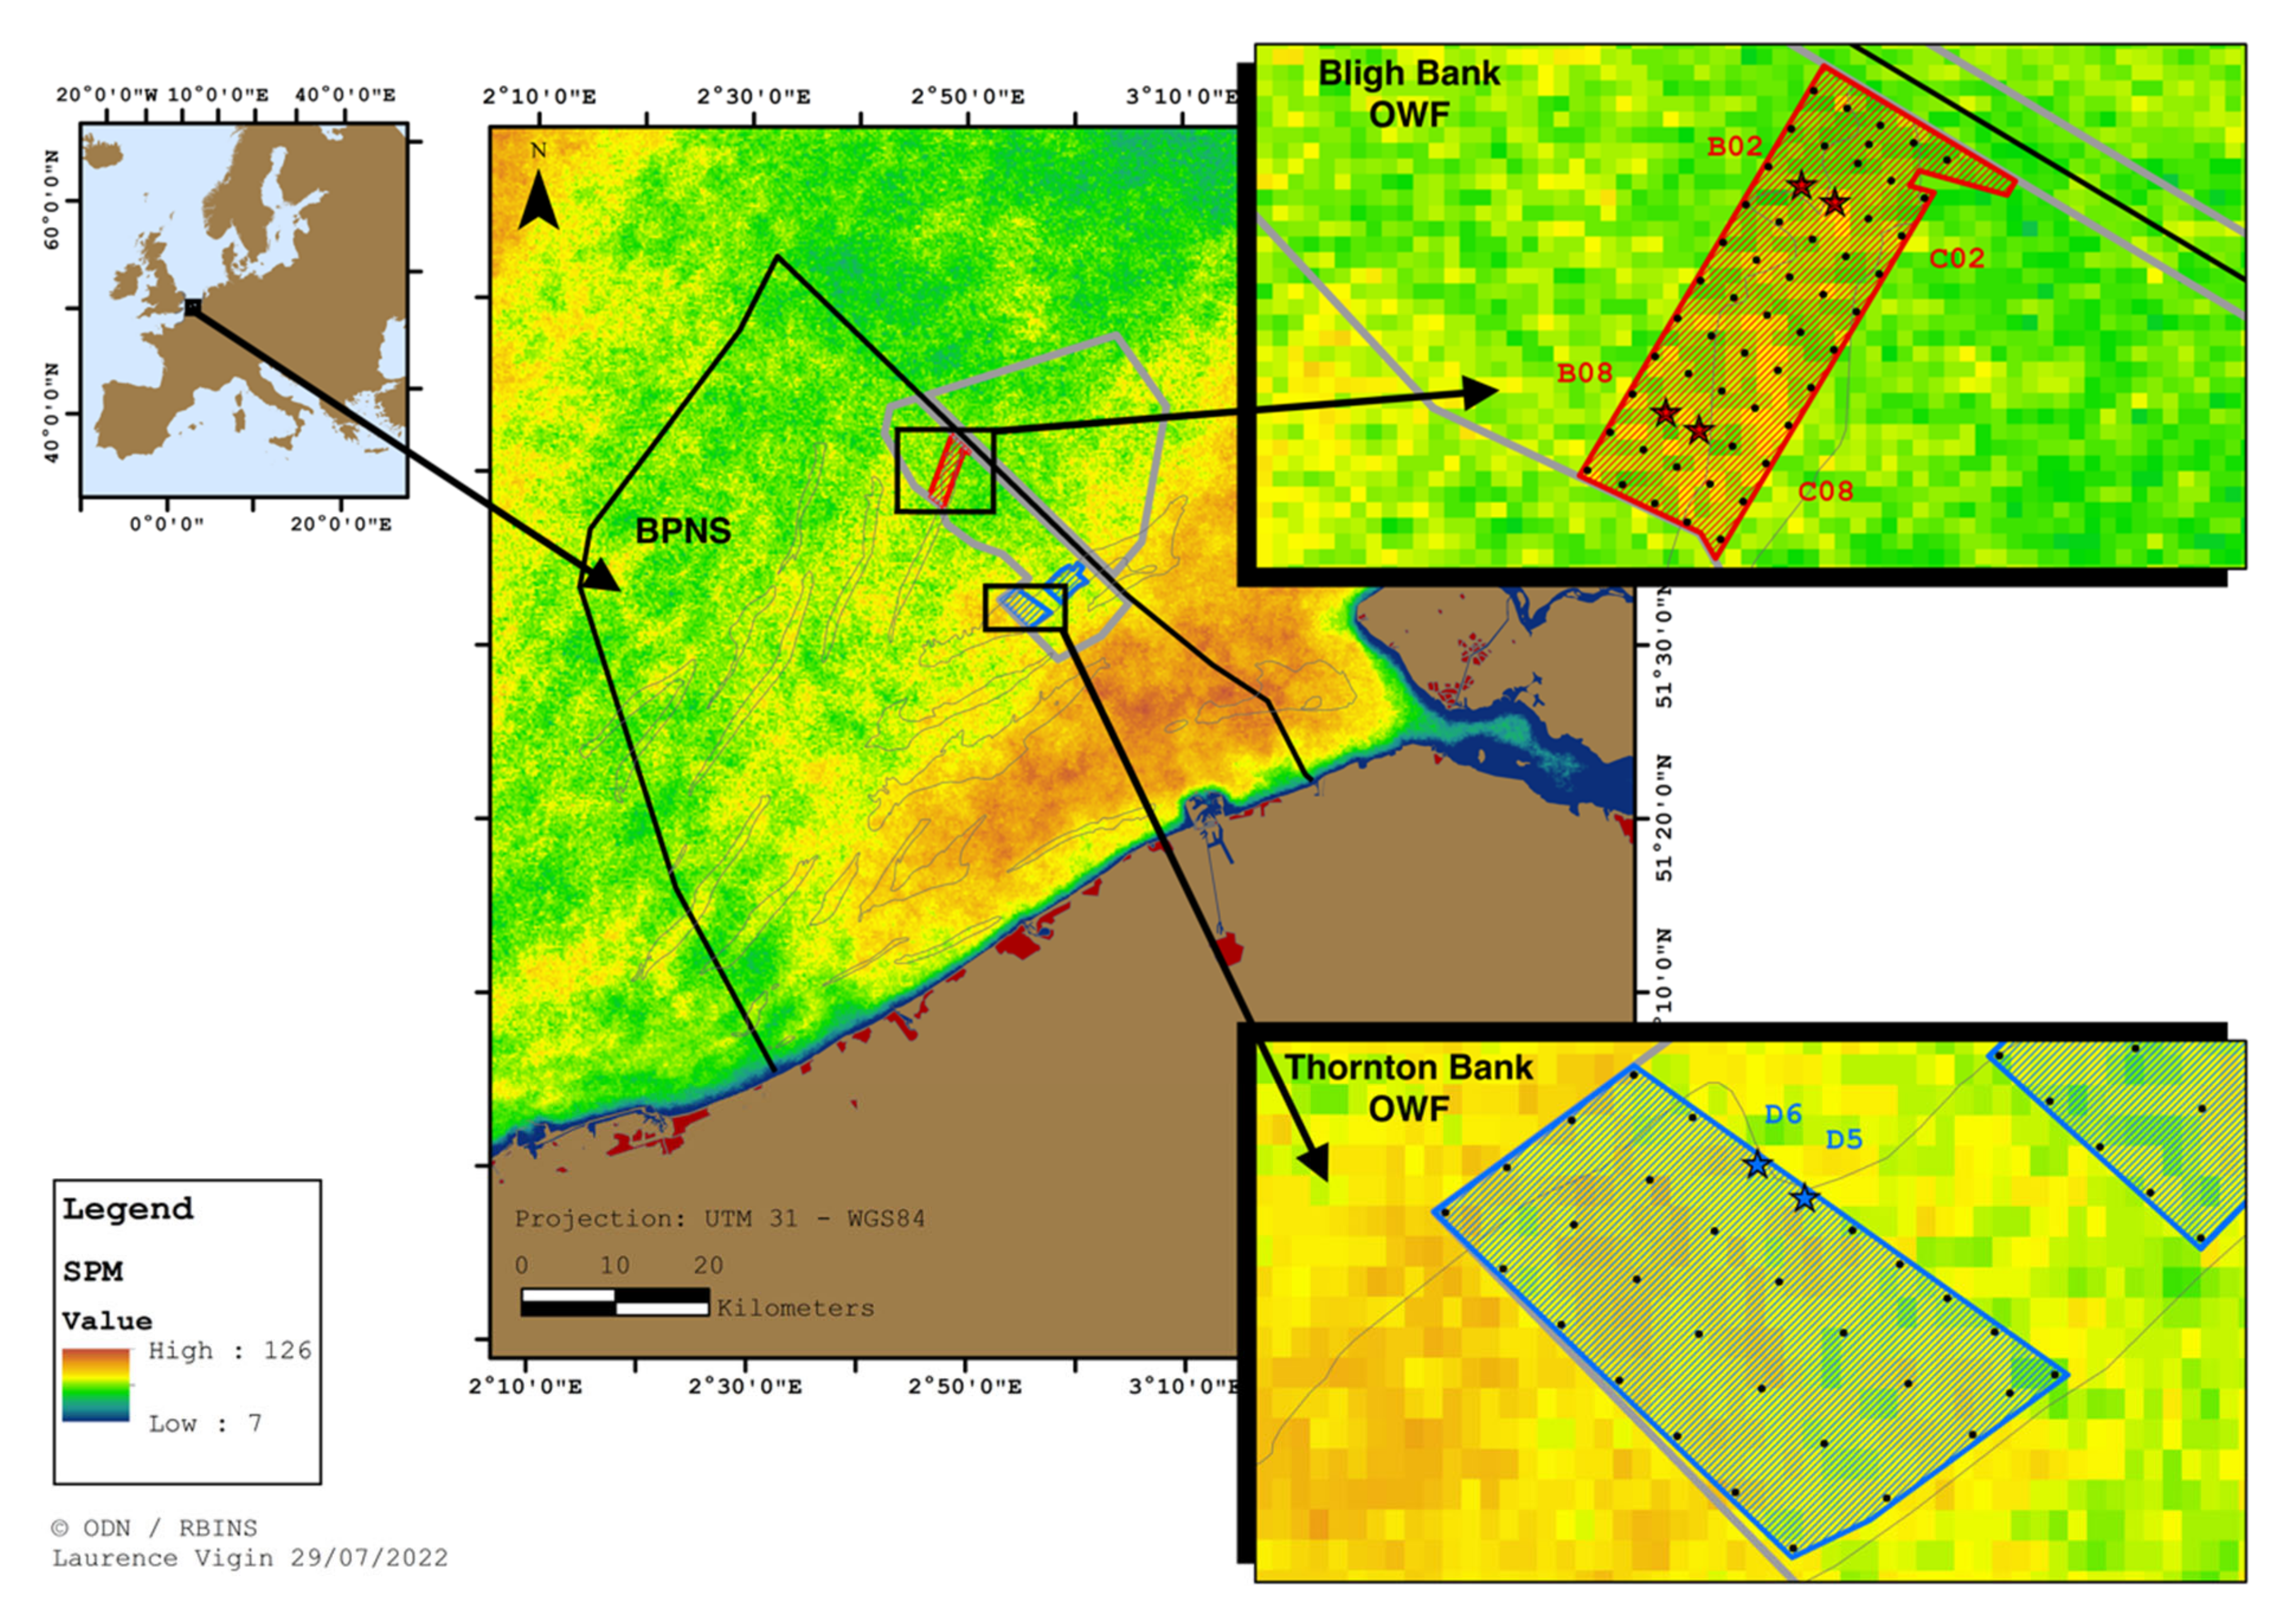
2.1. Study Site

The Belgian zone for offshore renewable energy in the Southern Bight of the North Sea is characterized by soft bottom sandy environments with a complex morphology comprising south–west–northeastwardly-oriented subtidal sandbanks and gullies and water depths ranging from 12 m to 40 m. In May 2008, the first six concrete gravity-based offshore wind turbine foundations were installed at ~25 m depth on the Thornton Bank approximately 30 km offshore and situated at the outer edge of well-mixed, turbid coastal waters (Figure 1). In autumn 2009, 56 steel monopile foundations were installed at ~30–35 m depth on the Bligh Bank approximately 50 km offshore in an area more subject to the influx of Atlantic water through the English Channel resulting in clearer and less productive waters [53]. Both locations are characterized by higher SPM concentrations in winter than in summer and a pronounced phytoplankton bloom in spring although the latter is less pronounced in the offshore area (the Chl-a concentration is up to 15 µg L−1 offshore vs. up to 35 µg L−1 l at the edge of the coastal waters, [55]). At both locations, the major axes of semidiurnal tidal current ellipses are oriented mainly northeast (flood)–southwest (ebb). The tidal range varies between 2.5 and 5 m, and depth-averaged current velocities easily reach 1 m s−1 with little or no difference in the renewable energy zone [56].

2.2. The Data Set

Scientific divers collected scrape samples from a total of six turbine foundations (two from the Thornton Bank and four from the Bligh Bank; Figure 1) at a depth of approximately 15 m, representative of the deeper subtidal community [57]. Weather permitting, in late summer to early autumn, samples were collected from at least one and a maximum of two turbines per year per OWF (Table 1). Sampling was not possible in year 7 and year 8 in the Bligh Bank OWF and in year 9 in the Thornton Bank OWF. Our final data set consists of 93 scrape samples; 38 samples were collected from the Bligh Bank OWF (2010–2020) and 55 samples originated from the Thornton Bank OWF (2008–2019; Supplementary Materials).
The samples were taken using a 0.0625 m2 metal frame placed on the foundation within which fauna was scraped and collected (Figure S1). The samples were preserved in 4% buffered formalin, stored, and later sieved over a 1 mm sieve. All of the retained organisms were identified to the lowest possible taxonomic level. To maintain taxonomic consistency, the species within the group Nudibranchia was kept on a higher level (i.e., Nudibranchia). Since sample preservation did not always allow for consistent identification of all of the Actiniaria, we grouped them into one taxon, M. senile, which was by far the most numerous species if species identification was possible. We used the World Register of Marine Species as a reference for taxonomic nomenclature [58].
We made a distinction between countable and colonial/encrusting species. For countable species, the total number of individuals in the sample was counted. Most of the colonial species (Hydrozoa, Bryozoa, Porifera, and Ascidiacea) were damaged during the collection of the samples and were excluded from all further analyses. The exception was the soft coral Alcyonium digitatum, where individual colonies could be identified and counted. As such, the following data analyses are based solely on the abundance data set from countable taxa.

2.3. Data Analysis

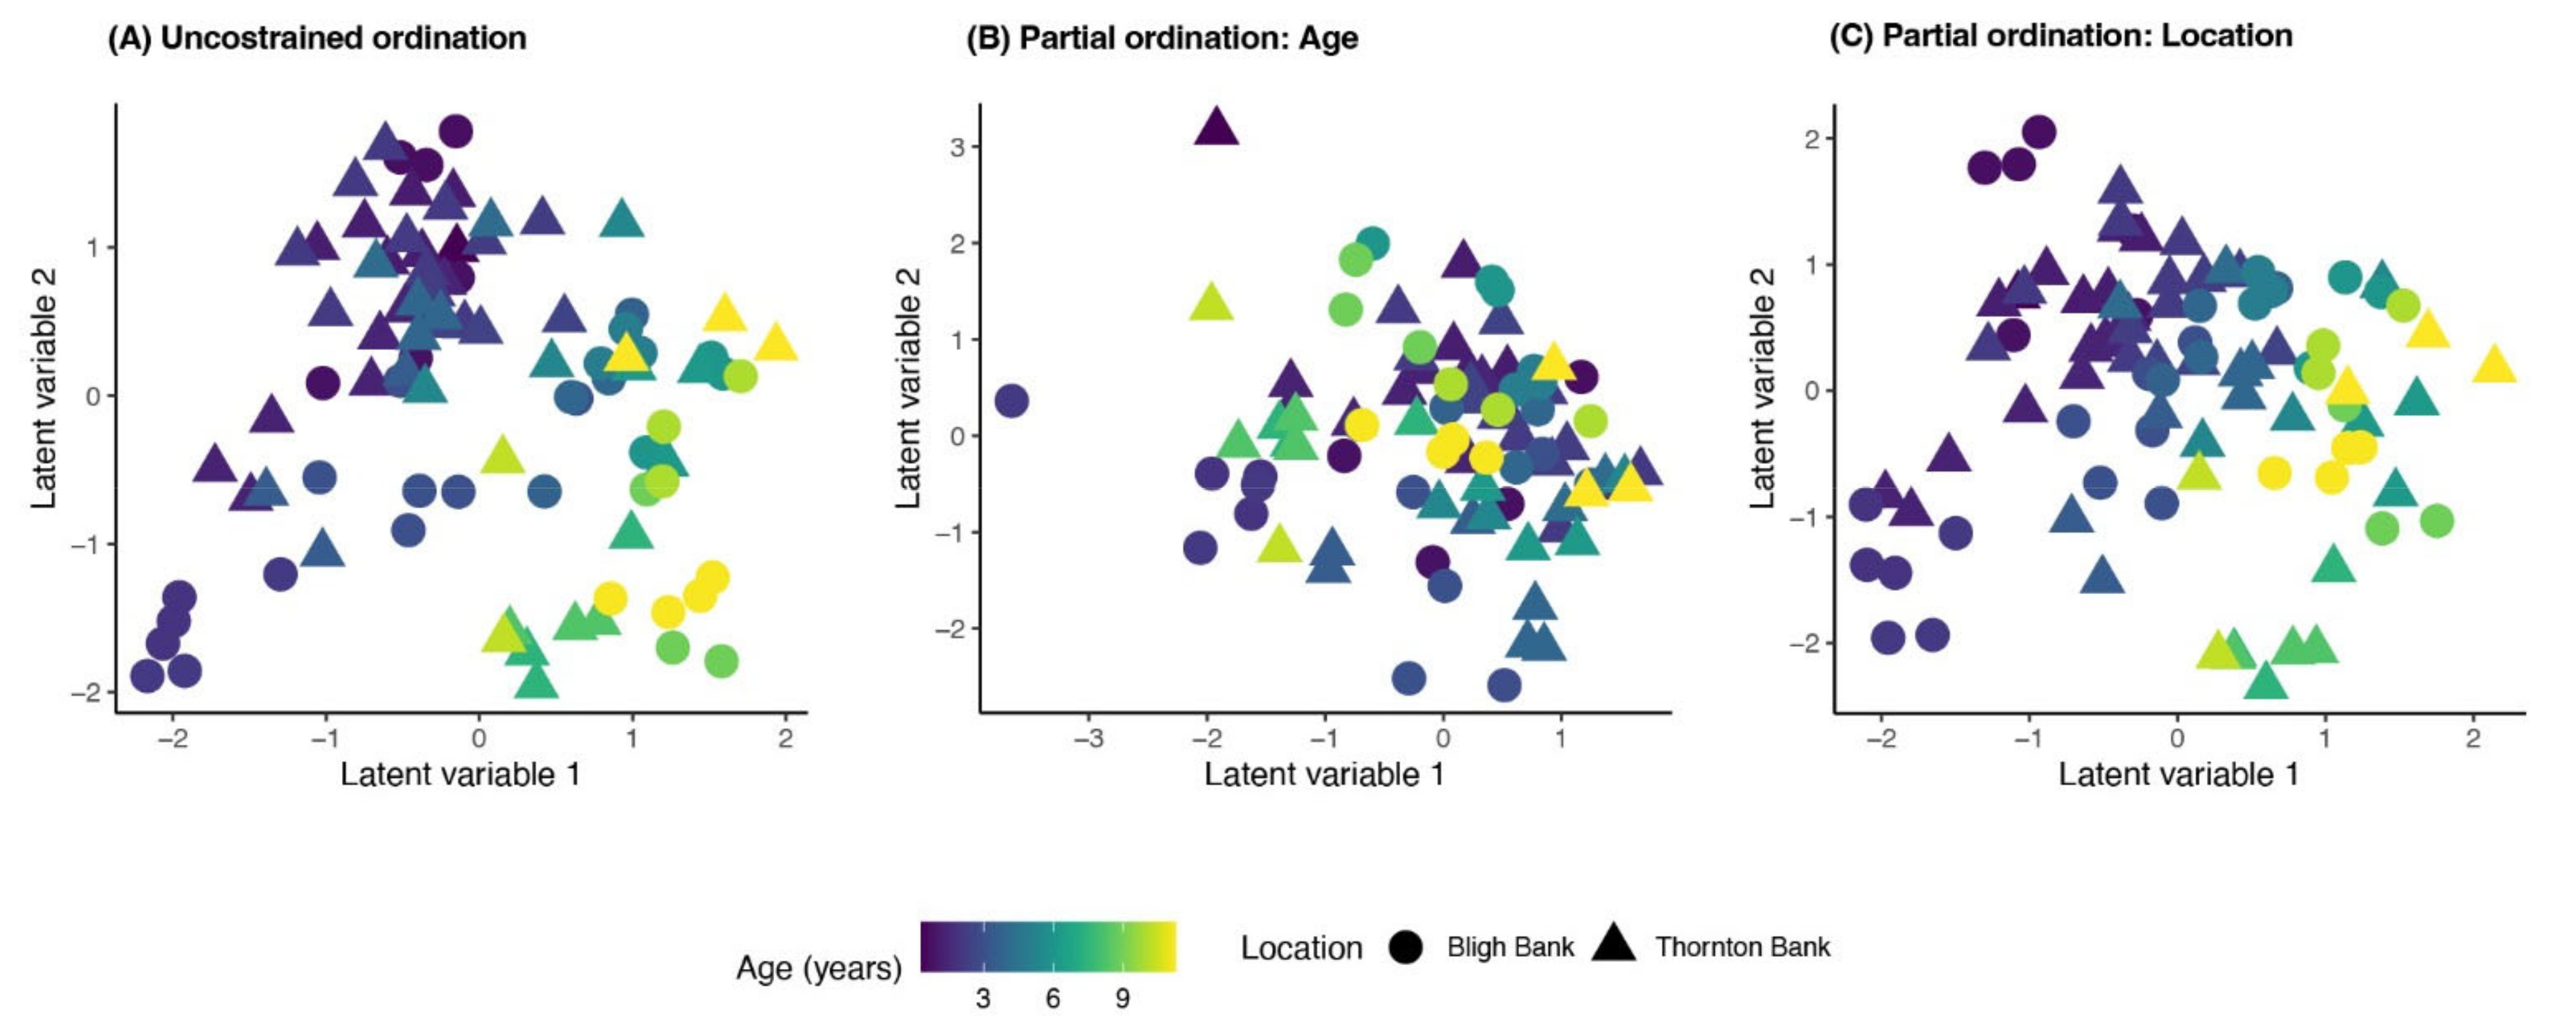
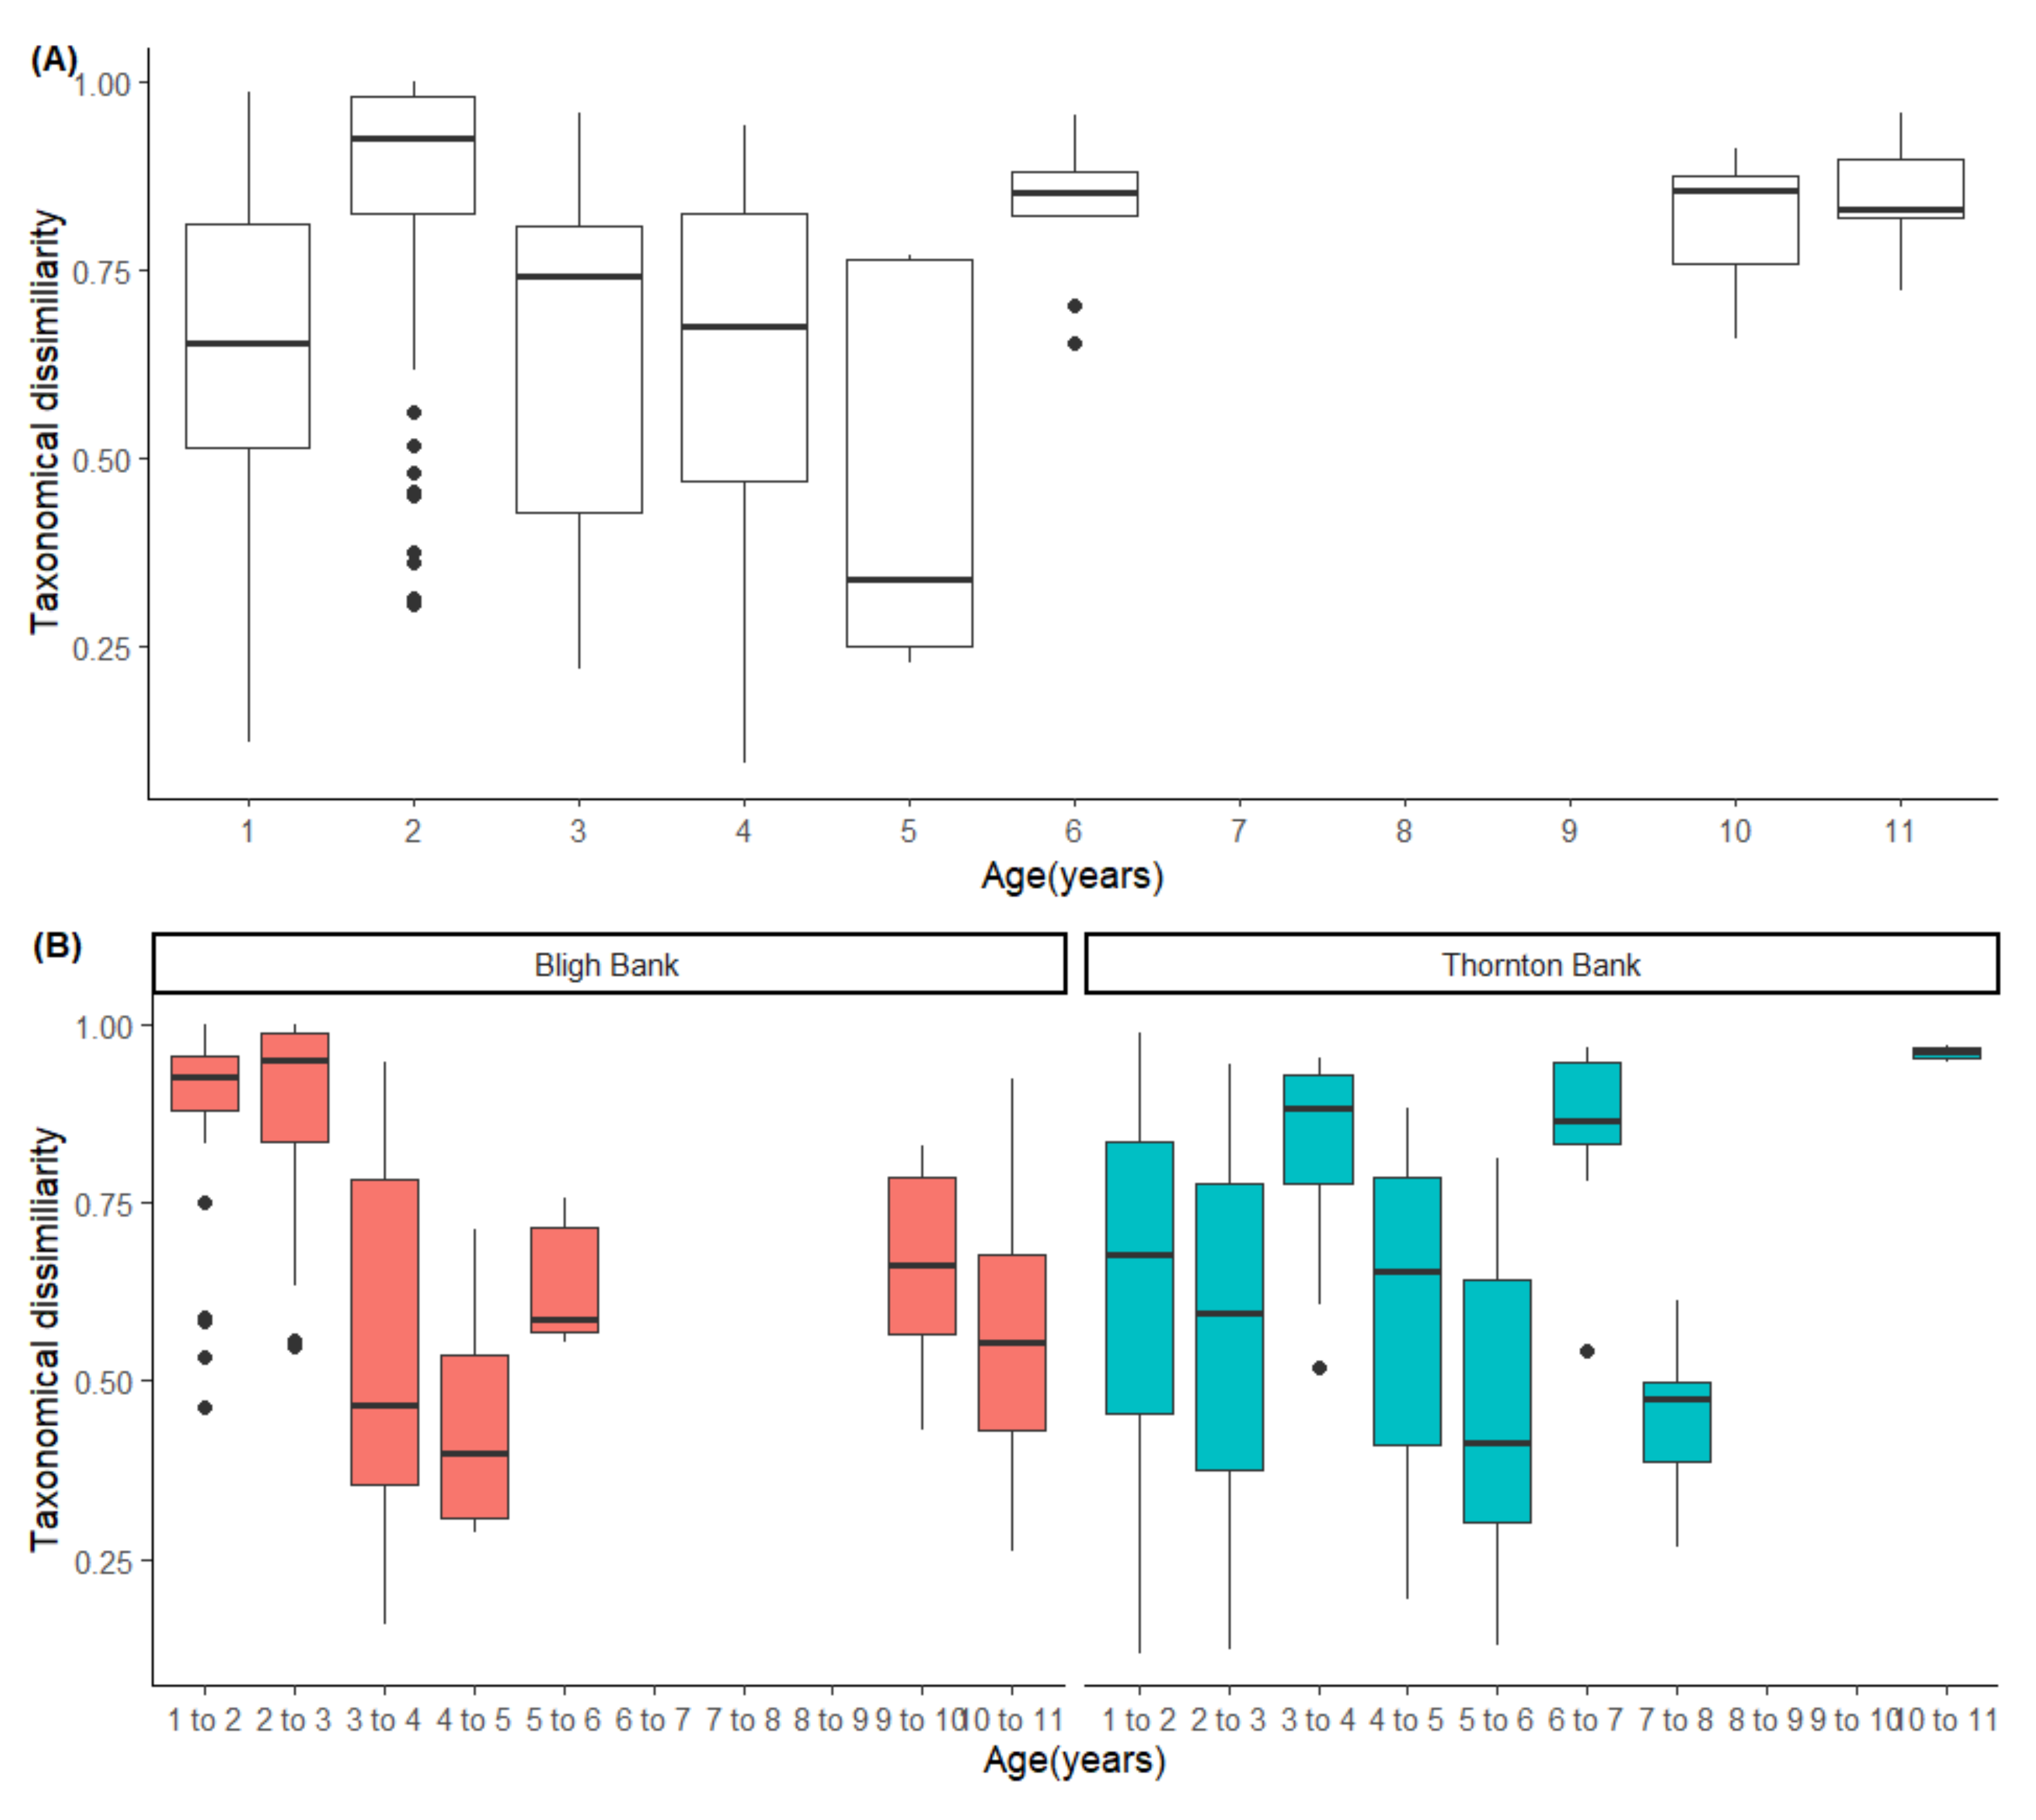
2.3.1. Multivariate Response Changes in Community Composition

The importance of explanatory variables (‘Location’ and ‘age’) on the biofouling communities was identified using generalized linear models (GLMs) with the manyglm function from the mvabund package [59]. The influence of these variables was visualized using a generalized linear latent variable model from the gllvm package [60].
Through the manyglm, we tested the effects of the explanatory variables. We tested whether ‘location’ (‘Bligh Bank’ versus ‘Thornton Bank’) ‘age’ (number of years since construction), and their interaction affect the development of the biofouling assemblages. Other variables (material and foundation type) were not included in the model because they were collinear with ‘location’.
The manyglm function fits specific generalized linear models (GLMs) to each species and uses resampling-based hypothesis testing to assess the significance of the explanatory variables. A preliminary data exploration showed that the abundance of data had a quadratic mean–variance relationship (Figure S2); hence, our model was fitted using a negative binomial distribution and a log-link function. The model distribution fit was assessed by inspecting Dun–Smyth residuals (Figure S3). We assessed the significance of the explanatory variables using the anova.manyglm function (likelihood ratio tests) using 999 bootstrap iterations via PIT-trap resampling. We identified the species contributing significantly to differences among ‘location’ and ‘age’ through univariate GLMs via the p.uni argument in mvabund.
To visualize the main trends in community composition between the two locations and over time, we first fitted an unconstrained ordination (generalized linear latent variable model) [61]. We then fitted and visualized a correlated response model to produce partial ordination of residuals (i.e., constrained ordination) for the environmental explanatory variables ‘location’ and ‘age’. Comparing the unconstrained ordination to the partial ordinations allows for visualization of how much of the community structure is explained by the environmental explanatory variables in the partial ordination [60]. When the constrained ordination resembles the patterns in the unconstrained ordination, the constraining predictor (i.e., age or location) is not strongly affecting the variation in the community composition. On the other hand, when the pattern of the constrained ordination differs from the unconstrained ordination, the involved predictor has a strong effect on the variation in the community composition. The model fit was restricted to two latent variables.

Temporal Trends in Community Dynamics

To allow for a more detailed comparison between the Bligh Bank and Thornton Bank OWF communities over time, we computed the Bray–Curtis dissimilarity to reflect pairwise taxonomic dissimilarity (i) between the two locations (i.e., Bligh Bank and Thornton Bank) separately for each sampling year when data were available from both locations (i.e., 1–6 and 10–11) and (ii) within each location between consecutive years. The Bray–Curtis dissimilarity index [62] was calculated using the vegdist function of the vegan package [63].
Visual inspection of the dissimilarity patterns between the two OWFs and over time can give insight into whether the communities are converging or diverging over time (i.e., an increase or decrease in dissimilarity indicates divergence or convergence, respectively; the inspection of dissimilarity patterns within the OWF can lead to predictions of an ‘equilibrium state’ or ‘cyclical’ change, amongst others (i.e., decreasing and stabilizing dissimilarity over time can indicate a climax, while a constantly changing index does not [64]).

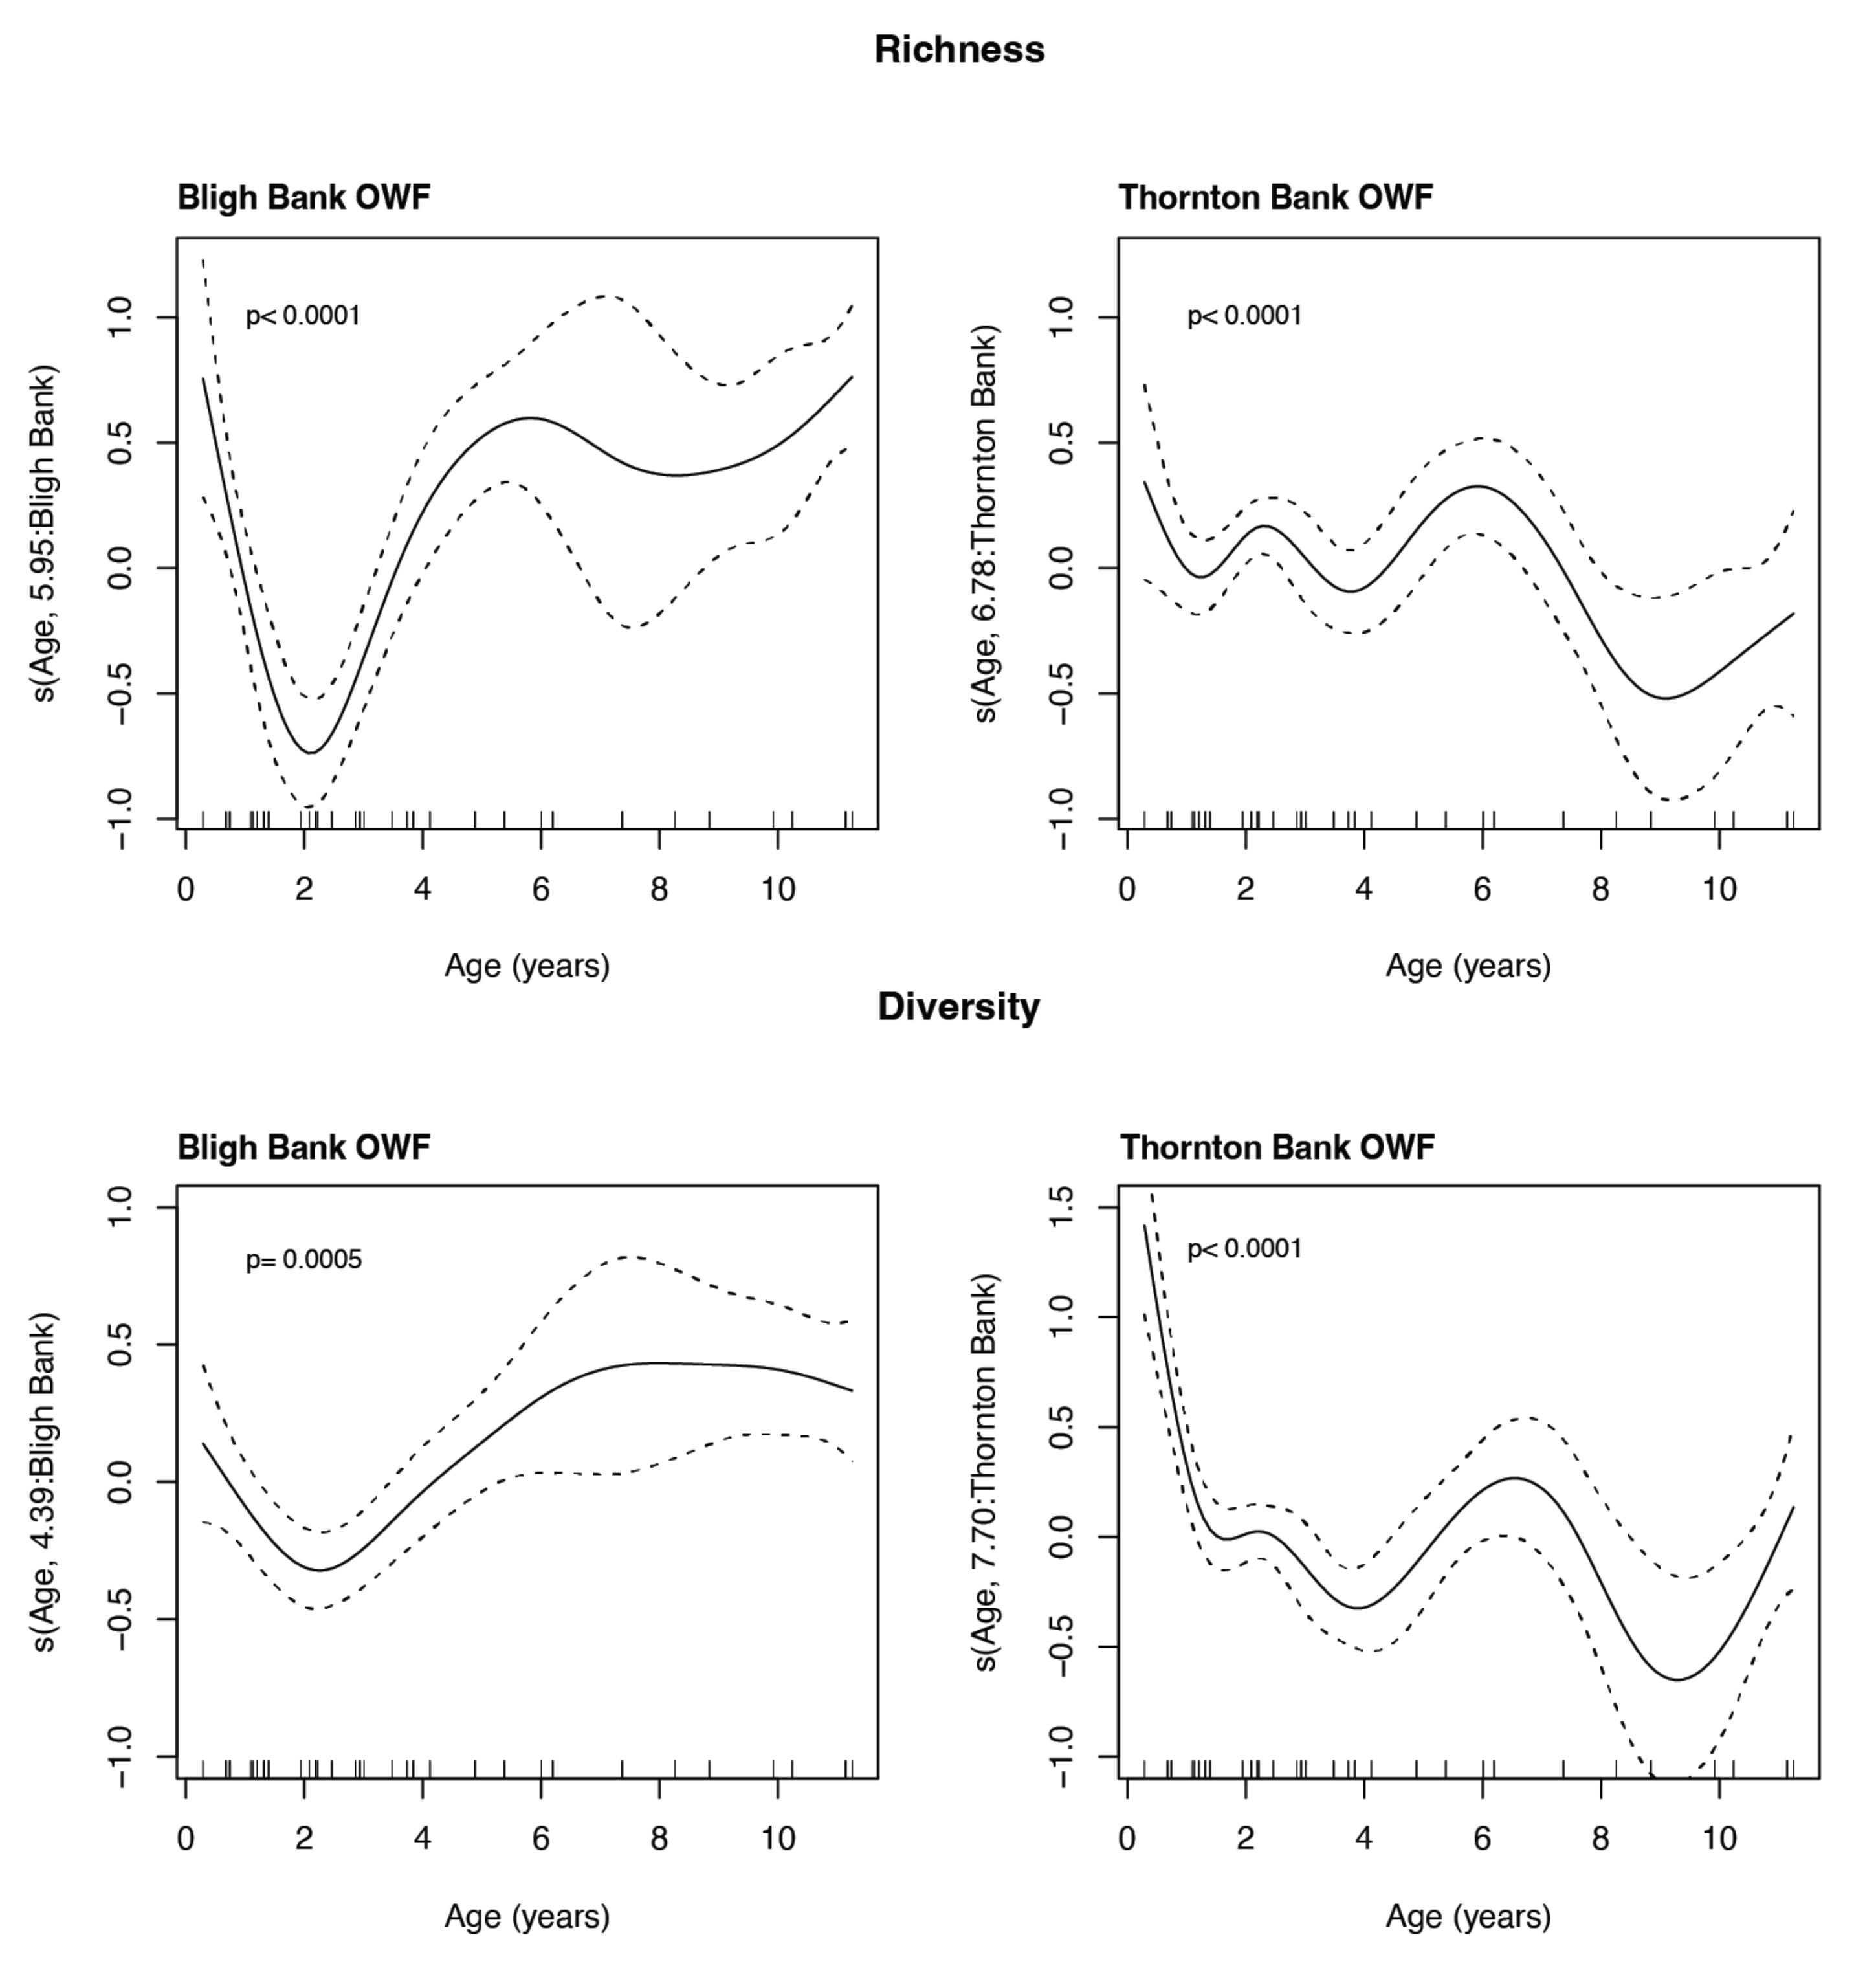
2.3.2. Univariate Response: Diversity Indices

To investigate changes in diversity, we examined changes in species richness (i.e., the number of unique taxa in each sample, hereafter called richness) and Shannon diversity (hereafter called diversity).
Due to the non-linear relationships between explanatory variables and response variables, we used generalized additive mixed effects models (GAMMs) to understand the influence of ‘location’ and ‘age’ as well as their interaction on the diversity of biofouling fauna communities. Turbine ID was added as a random effect to remove the dependency between samples. As biological explanatory variables, we selected the abundances (individuals >1 cm) of the aforementioned species: the foundation species M. edulis, the predators A. rubens and P. miliaris, and the ‘space occupiers’ M. senile and tube-building amphipods (here: J. herdmani and Monocorophium acherusicum).
We followed the data exploration protocol by Zuur et al. [65]. The presence of outliers, multicollinearity, and relations between ecological indices (richness and diversity) and explanatory variables (e.g., ‘age’ and ‘location’) were assessed using Cleveland dot plots, boxplots, pair plots, and the variance inflation factor. The variance inflation factor was calculated for each explanatory variable included in the global model using the function vif from the R package car [66]. None of the variance inflation factors were larger than 3, which allowed for the inclusion of all of the explanatory variables in the model [65].
For richness, we used a Poisson distribution and a log link function (the model was not over-dispersed; the ratio between the residual deviance and residual degrees of freedom was <1.1; [67]), and for diversity, we used models with a Gaussian distribution. The GAMM analyses were run using the gamm4 package [68].
We initially fitted a model using all of the explanatory variables as smoothers and used the estimated degrees of freedom (edf) to determine which explanatory variables showed a non-linear relationship with the response variables. When edf = 1, we added the explanatory variable as a linear factor in the model, which resulted in the following full models for richness and diversity:
RichnessA. rubens + M. senile + P. miliaris + f (M. edulis) + f (Amphipods) + Location + f (age, by = location), random = ~(1|Turbine.ID)
DiversityA. rubens + f (M. senile) + f (P. miliaris) + M. edulis + f (Amphipods) + Location + f (age, by = location), random = ~(1|Turbine.ID)
Following this, we ran several alternative models:
  • A full model with the sequential removal of each non-significant variable, until only significant variables were retained.
  • A model with only environmental explanatory variables.
  • A model with only biological explanatory variables.
  • A model with only the abundance of the predator species (A. rubens and P. miliaris) as the explanatory variable.
  • A model with only the abundance of the foundation species M. edulis as the explanatory variable.
  • A model with only the abundance of the space occupiers (M. senile and amphipods).
The alternative models were compared with the full model using the Akaike Information Criterion [69]. Only models with ΔAIC values >3 were considered in the subset of best models [70]. We additionally calculated the percentage of deviance explained by each final model, by removing the random effect [67,71]. We used both descriptors for the final model selection.
The final model was validated by inspecting the assumptions of normality and homoscedasticity. In addition, the residuals of the final fit model were plotted against all of the variables included in the model as well as those not included in the model to verify the absence of remaining patterns.
All data analyses were performed in R [72].

3. Results

Our data set consisted of 283,340 individuals comprising 91 countable taxa. We further recorded the presence of 26 colonial taxa, which were not included in the analyses (Supplementary Materials). Most taxa (n = 65) were found in both locations, yet 34 were unique to the Bligh Bank OWF and 18 were unique to the Thornton Bank OWF. The tubicolous amphipod J. herdmani was the most abundant species, representing ~80% of all the countable individuals in both OWFs across the entire data set. The other four numerically most dominant taxa in the Bligh Bank OWF were the decapod Pisidia longicornis (3.5%), the encrusting polychaete Spirobranchus triqueter (2.7%), the sea anemone M. senile (1.4%), and the blue mussel M. edulis (1.2%). In the Thornton Bank OWF data set, the second most abundant taxon was another tubicolous amphipod, M. acherusicum (11%), followed by the decapod P. longicornis (2%), the amphipod Stenothoe monoculoides (2.1%), and the sea anemone M. senile (1.2%). The sea star A. rubens and the sea urchin P. miliaris represented 0.5% and 0.6% of the total community composition, respectively.

3.1. Biofouling Community Composition

The results of the multivariate GLM indicated that ‘location’ and ‘age’ and their interaction significantly explained changes in the assemblage composition (Table 2, Figure 2A). The comparison of constrained versus unconstrained ordinations suggested that ‘age’ had a stronger effect than ‘location’; the pattern for the constrained ordination with the predictor ‘age’ (Figure 2B) differs more from the unconstrained ordination than the ordination constrained by ‘location’ (Figure 2C).
While only eight species contributed significantly to the deviance associated with ‘location’, 18 species contributed significantly to the deviance associated with ‘age’ (Table 2; Figures S4 and S5). Amongst them, the predators A. rubens and P. miliaris showed a significant decrease in abundance over time, while the abundance of the space-occupying sea anemone M. senile and the amphipod M. acherusicum increased with age. Monocorophium acherusicum was more abundant in the Thornton Bank OWF than in the Bligh Bank OWF (Figure S4). The abundance of the foundation species M. edulis increased up to year 6 and was followed by a decrease in abundance (Figure S5). The density of the space-occupying amphipod Jassa herdmani did not change significantly over time, but it still displayed non-linear changes in abundance over time (Figure S5). The barnacle Balanus perforatus contributed to the significant ‘location*age’ interaction effect (Table 2, Figure S5).

3.2. Temporal Trends in Community Dynamics

There is high variability in the mean pairwise taxonomic dissimilarity between the Bligh Bank OWF and the Thornton Bank OWF during the first five years after installation before reaching a more stable and high dissimilarity near the end of our long-term series (Figure 3A). Temporal patterns within the two OWFs seem to be non-linear, where short periods of decreased dissimilarity, within replicate samples of the same OWF, interrupt longer periods of higher dissimilarity (Figure 3B). In the Bligh Bank OWF, there is a high turnover in community composition during early colonization (years 1–3) and a more uniform change from year 6 (Figure 3B). The dissimilarity index within the Thornton Bank OWF displays no clear patterns and high variability in turnover between years (Figure 3B).

3.3. Univariate Response

The final models for richness and diversity explained 85.3 and 91.7% of the deviance, respectively, and both included significant non-linear trends with age (Table 3 and Table 4). At both locations, richness and diversity peaked ~6 years after installation (Figure 4 and Figure S6). Diversity remained high thereafter on the Bligh Bank OWF, whereas on the Thornton Bank OWF, it decreased at age 9 (Figure 4 and Figure S6).
Richness was significantly related to the abundance of the space-occupying amphipods and the predator A. rubens. Richness initially increased with the number of space-occupying amphipods up to a maximum value at amphipod densities of 5000 in sample−1, followed by a decline at higher amphipod densities (Figure 5). There was a linear increase in richness with increasing densities of A. rubens.
Diversity was significantly related to all of the biological variables, except for the sea urchin P. miliaris (Table 3 and Table 4; Figure 5). In contrast to richness, diversity was highest at a low number of space-occupying amphipods (Figure 5). Intermediate densities of the other space occupier M. senile were associated with the highest diversity values (Figure 5). Densities of the foundation species M. edulis were significantly and linearly included in the final model (Figure 5), where diversity increased with M. edulis densities. Similarly, increasing densities of the top predator A. rubens were significantly related to increasing diversity values (Figure 5).

4. Discussion

Our multivariate generalized linear modelling analysis shows that both location and age affect the subtidal biofouling community composition of the two OWFs. The abundances of foundation species, predators, and space occupiers significantly changed over time and had strong effects on diversity patterns, yet not always in the hypothesized way. Our analysis revealed that the community composition of the two OWFs diverged over time, rejecting our hypothesis about community convergence with time, and that no clear stable state has yet been reached 11 years after installation.

4.1. Local Differences in Biofouling Communities

Our multivariate analysis showed a small, yet significant effect of ‘location’ on species composition. As both communities were generally dominated by one amphipod species (i.e., Jassa herdmani), this difference can be attributed to other species occurring at lower densities. Although the effect of different material types (Thornton Bank: concrete and Bligh Bank: steel) and the timing of introduction (Thornton Bank: spring 2008 and Bligh Bank: autumn 2009) cannot be ruled out, we do suggest that the characteristics of the surrounding water masses play a role. Species with higher abundances at the more offshore Bligh Bank OWF (Alcyonium digitatum, Heteranomia squamula, Spirobranchus triqueter, and Verruca stroemia) have previously been identified as species typically found on offshore wrecks in the North Sea, surrounded by clear and less productive waters [73,74]. Similarly, the species with significantly higher abundances in the more nearshore Thornton Bank OWF (Monocorophium acherusicum and the predators Phyllodoce mucosa and Eulalia spp.) are distinctive taxa observed on hard substrates in well-mixed and turbid nearshore waters [73].

4.2. Temporal Trends of Influential Species and Their Effects on Diversity

While there were some species-specific differences between the Bligh Bank OWF and the Thornton Bank OWF, the dominant tube-building amphipods displayed similar temporal trends (Figure 6 and Figure S4). Numerically, the tube-building amphipods dominated the biofouling communities of both OWFs during the first five to seven years in Bligh Bank and Thornton Bank, respectively, where more than 100,000 ind m2 were observed. Such a massive dominance of amphipods is characteristic of other artificial hard substrates (e.g., wrecks) in the North Sea [73,75] and elsewhere in other fouling communities of the oil platforms in the Gulf of Mexico and offshore of the California coast (e.g., [47,53]). The dominant tube-building amphipods significantly and non-linearly affected richness and diversity. Richness increases until amphipod densities reach 80,000 ind m2 before decreasing again. In contrast, diversity strongly decreases with amphipod densities, from 8000 ind m2. Jassa individuals create their own microhabitat by trapping sediment and building tubes made of amphipod silk forming extensive turf mats, commonly known as Jassa-turf. Typically, several other species live in these mats, including predators such as Eulalia sp., Phyllodoce mucosa, and Oerstedia dorsalis, for whom amphipods are important prey [73], which can explain the positive effects on richness. Yet, the numerical over-representation of amphipods compared to other taxa (usually 42-fold higher than any other taxon) is the primary driver of the low diversity index, as it is strongly influenced by the evenness of the species in the sample [17,76].
The abundance of the predators (A. rubens and P. miliaris) decreased over time and remained low (max 2.7% and 3.7%, respectively %) over time. While A. rubens has been described as an opportunistic predator with a strong capacity for top-down control of bivalve populations [77], their effect on diversity in our study does not suggest such behavior on OWF foundations. We found a significant and positive effect of A. rubens on both diversity indices, but this was not the case for P. miliaris. As such, we do not classify P. miliaris as a top or keystone predator in the Belgian OWF environment. Increasing densities of A. rubens L led to an increase in richness and diversity, suggesting their role as keystone predators in this ecosystem. Other studies have demonstrated that by preying on a variety of biofouling fauna species, asteroids are important keystone species [42,45]. However, the high variability of the diversity indices values in the absence of A. rubens—including relatively high diversity values—questions the classification of A. rubens as a keystone predator in OWFs and calls for a controlled experimental approach to confirm the keystone predator status of A. rubens in OWF fouling communities.
Both OWFs are characterized by an increase in the abundance of the foundation species M. edulis and the space occupier M. senile, particularly after year 6. The mussels and anemones are typical late recruiters in the subtidal zone, known to be strong competitors, resistant to predation, and having higher longevity [23]. They have become the dominant taxa not only on a variety of offshore structures in the North Sea (e.g., [23,78,79]), but also worldwide (e.g., [47,50,51,52,80,81]).
The foundation species positively affected the diversity of the biofouling community. While M. edulis can dominate a substrate and prevent the settling of other benthic fauna (e.g., [82]), their presence is generally linked to increased diversity of both natural [83] and artificial hard substrates [40] and also sandy communities [84,85]. The foundation species is known to provide new bare substrate available for attachment for epibionts and to increase habitat complexity [86,87,88]. This was evident from our study during the later stage of succession as we observed several barnacle species (i.e., B. perforatus, B. crenatus., and V. stroemia) colonizing only on the shells of M. edulis (personal observation by F. Kerckhof).
The space-occupying sea anemone M. senile also affected diversity, but not in the expected way. Surprisingly, its abundance had no effect on richness and had a positive effect on diversity. Metridium senile is very abundant and often one of the dominant taxa in biofouling communities (e.g., [23]); it is a superior spatial competitor, attributed to its clonal reproduction, mobility, and locomotion [89]. Additionally, it actively predates larvae of other species, preventing their settlement on adjacent substrates, and actively kills new settlers by smothering them [89]. Several studies have demonstrated an association of low richness when the community is dominated by M. senile [40,90,91,92], which was not detected in the current study. The absence of any effect of M. senile abundance on richness in our study could be explained by the fact that they never reached sufficiently high abundances to monopolize the space. The positive effect on diversity can be attributed to the concurrent low abundance of tube-dwelling amphipods (Figure S7), rather than a positive effect of M. senile by itself. It remains to be seen whether the sea anemones will become dominant on the subtidal wind turbine foundation, just as it was observed from older oil and gas platforms (e.g., [23,40]) where their negative effect on species richness has been demonstrated [40].

4.3. Divergence in Community Composition and No Apparent Stable State

Both the multivariate and univariate analysis indicate that there is a change in community development years after the installation of the turbines. The dissimilarity between the two OWFs increased to a relatively high maximum associated with low within-year variability, suggesting that the communities diverged and remained different through the duration of our study. Additionally, richness and diversity peaked at approximately age 6 in both locations, which is consistent with age-diversity patterns across offshore structures in the North Sea [17]. Nonetheless, we detected a difference in temporal richness and diversity trends after this year; the Bligh Bank OWF diversity indices appear more stable compared to the cyclical patterns exhibited in the Thornton Bank OWF. The greater stability of the Bligh Bank OWF community compared to the fluctuations in the Thornton Bank OWF community is also visible from the patterns of the dissimilarity index between years within each community (Figure 3B). While the influential species exhibited similar temporal patterns at both locations, their relative contribution to community composition differed between the two OWFs. In particular, there was a relatively higher abundance of the foundation species in the Bligh Bank OWF community (from year 6 to 9) compared to a relatively higher abundance of the space-occupying sea anemone in the Thornton Bank OWF community (from year 8 to 10) (Figure 6). We suggest that the linear positive effect of the foundations species on diversity could have led to lower temporal dynamics in the Bligh Bank OWF compared to the Thornton Bank OWF.
The decreases and increases in dissimilarity over time suggest ongoing changes in community composition (i.e., a decrease in year 5, followed by an increase in years 10 and 11; Figure 3B), which is not an uncommon feature for biofouling communities (e.g., [26,93,94]). A sudden change in community composition occurred after year 10 at the Bligh Bank OWF and after year 11 at the Thornton Bank OWF, when the relative abundance of mussels and anemones decreased and there was a relative increase in amphipods at both locations (Figure 6). One hypothesis of this community composition change is that the mussels grew, and their shells became substrates for amphipods (e.g., at the Thornton Bank OWF, mussel abundances increased; Figure S4). Another possible explanation could be that the mussels became too heavy and fell from the turbine, creating empty space for amphipods to colonize (e.g., the decrease in the mussel abundance in the Bligh Bank OWF; Figure S4). Our study does not allow for discrimination between the two hypotheses or elimination of either of them. Nonetheless, our study does show that even after 10 years, the OWF communities are still changing.
Coolen et al. [17] suggest that a combination of inhibitory and facilitative interactions led to a ‘pseudo-equilibrium’ for a 7-year series on OWFs across the southern North Sea. In contrast, the trends in richness, diversity and community composition of our 11-year data series show that no such equilibrium was reached. The most important factors in driving changes in established communities are the ability of organisms to invade the occupied habitat and/or the mortality rate of resident adults [26]. Since both processes can change yearly or even seasonally, the fouling community changes constantly, making the direction of community development hard to predict. At present, there is no real basis to assume that the community will ever stop changing or reach a stable climax (e.g., [23,24,26]). However, even in the absence of a stable climax community, the biofouling community will continue to be dominated by suspension feeders (e.g., amphipods, bivalves, and anemones [47,48,49,50,51,52,53]) affecting both local [11,12] and more regional [13,15,16] ecosystem functioning and the associated ecosystem services [95]. Therefore, the planning of new structures and the decommissioning of existing ones will need to take into account not only the potential conservation value of the biofouling communities [96] but also the functional consequences of the presence/absence of large densities of suspension-feeding organisms.
In this study, we described the biofouling community using only countable species. The sampling of the foundation community was carried out by scrape sampling by divers, which is a well-established method for sampling offshore artificial structures (e.g., [40,75]). Whereas scrape sampling provided the necessary detailed species-level information we needed, it proved less suited for precise quantification of encrusting or branching taxa which were damaged during sampling. Intermittently, broken segments of hydrozoans and bryozoans were encountered in our samples, matching observations from scientific divers that these taxa are rarely present on the older sampled foundations. Hence, even if these taxa were included, we expect that the observed temporal patterns would be similar to those that are currently described here. Nonetheless, future work should aim at incorporating a combination of different sampling techniques (e.g., including image processing for determining species percentage cover) which would allow for an improved understanding of the assemblage structure (in addition across the entire vertical gradient).

5. Conclusions

Using the longest data set of biofouling fauna communities from OWFs, we demonstrate continuous changes in the biofouling fauna community composition driven, at least in part, by the abundance of influential species. Foundation species affected the structure and the development of the biofouling community by providing a new habitat causing an increase in species diversity. The space-occupying amphipods dominated the community resulting in lower diversity, while M. senile did not demonstrate its hypothesized negative effects on the communities. The predator A. rubens had some effect on biofouling diversity, yet their role as keystone predators still remains to be determined.
Our data further showed that as succession proceeded, the community composition of the two OWFs diverged over time. This divergence cannot be linked to a single species; instead, it is due to the different relative abundances of the influential species. The temporal changes detected even ten years after installation illustrate that (i) no equilibrium or climax has been reached at either OWF or that (ii) this climax stage also shows temporal and cyclical variation. Only continued observations will make it possible to distinguish between the different possible explanations, emphasizing the importance of continuous long-term monitoring for understanding ecological patterns on artificial structures.

Supplementary Materials

The following supporting information can be downloaded at: https://www.mdpi.com/article/10.3390/d15020288/s1. Figure S1: The 16x16cm (0.0625 m2) metal frame placed on the foundation from which the biofoulling fauna was scraped and collected. Picture credit: Bob Rumes—RBINS.; Figure S2: Figure S2: Preliminary data exploration showing a quadratic mean-variance relationship of our taxa. As a reference, the green line represents a Poisson distribution fit (mean= variance).; Figure S3: Model distribution (Abundance ~ Location*age, family = ’negative.binomial’) fit assessed using Dunn Smyth Residuals indicates that model assumptions are met.; Figure S4: Species with the strongest contribution to the community changes plotted by their abundance between the two offshore wind farms. Abundance scale differs per species.; Figure S5: Abundance of countable species over time and between the two offshore wind farms. The taxa presented here are those that were present in more than 10% of the samples (n = 9). Abundance scale differs per species.; Figure S6: Observed Richness (number of unique taxa) and Diversity (Shannon diversity) at the Bligh Bank OWF and Thornton Bank OWF over time.; Figure S7: The relationship between the abundance of tube-dwelling amphipods and the anemone Metridium senile.; as well as the raw data (in a separate file).

Author Contributions

Conceptualization, M.Z., B.R. and F.K.; methodology, M.Z., B.R. and F.K.; software, M.Z. and J.V.; validation, M.Z., B.R. and F.K.; formal analysis, M.Z. and J.V.; investigation, M.Z., B.R. and F.K.; data curation, M.Z., B.R., F.K. and J.V.; writing—original draft preparation, M.Z. and B.R.; writing—review and editing, M.Z., B.R., S.D., J.V. and F.K.; visualization, M.Z.; supervision, S.D., J.V. and F.K.; project administration, B.R.; funding acquisition, S.D. All authors have read and agreed to the published version of the manuscript.

Funding

Exploring options for nature-proof development of offshore wind farms inside a Natura 2000 area’ project (also known as EDEN2000) commissioned by the Marine Unit of the Directorate-General Environment, Federal Public Service Health, Food Chain Safety and Environment.

Institutional Review Board Statement

Not applicable.

Informed Consent Statement

Not applicable.

Data Availability Statement

The raw data are attached in the Supplementary Materials.

Acknowledgments

This paper contributes to EDEN2000, a study commissioned by the Marine Unit of the Directorate-General Environment, Federal Public Service Health, Food Chain Safety and Environment. The samples were collected in the framework of the long-term Belgian environmental offshore wind farm monitoring program, WinMon.BE, which started in 2008 (https://mareco-odnature-naturalsciences.be/project/winmon/ accessed on 20 July 2022). We thank the operators of the C-Power and Belwind OWFs for their willing cooperation throughout the monitoring process, in fulfilment of the monitoring requirements of their environmental permit. The field work could not have been completed without the help and smooth operation provided by the officers and crew of the RV Belgica, owned by the Belgian Ministry of Science Policy and coordinated by RBINS-OD Nature, and the RV Simon Stevin, property of the Flemish government and coordinated by VLIZ. The sampling could not have been completed without the help of the Belgian scientific diving team (coordinated by Alain Norro) which is part of RBINS’ contribution to EMBRC Belgium. We would like to thank the reviewers for their time and effort in reviewing the manuscript.

Conflicts of Interest

The authors declare no conflict of interest. The funders had no role in the design of the study; in the collection, analysis, or interpretation of data; in the writing of the manuscript; or in the decision to publish the results.

References

  1. North Seas Energy Cooperation. In Proceedings of the Joint Statement of North Seas Countries and the European Commission, Online, 6 July 2020; Available online: https://ec.europa.eu/info/news/progress-north-seas-energy-cooperation-2020-jul-06_en (accessed on 20 July 2022).
  2. GWEC Global Wind Energy Council. Global Offshore Wind Report; GWEC: Brussels, Belgium, 2021. [Google Scholar]
  3. Lindeboom, H.J.; Kouwenhoven, H.J.; Bergman, M.J.N.; Bouma, S.; Brasseur, S.; Daan, R.; Fijn, R.C.; De Haan, D.; Dirksen, S.; Van Hal, R.; et al. Short-term ecological effects of an offshore wind farm in the Dutch coastal zone; A compilation. Environ. Res. Lett. 2011, 6, 035101. [Google Scholar] [CrossRef] [Green Version]
  4. Vanagt, T.; Van de Moortel, L.; Faasse, M.A. Development of hard substrate fauna in the Princess Amalia Wind Farm. Monitoring 3.5 years after construction. eCoast Rep. 2013. Available online: https://core.ac.uk/download/pdf/80852871.pdf (accessed on 20 July 2022).
  5. Schröder, A.; Orejas, C.; Joschko, T. Benthos in the Vicinity of Piles: FINO 1 (North Sea). In Offshore Wind Energy: Research on Environmental Impacts; Köller, J., Köppel, J., Peters, W., Eds.; Springer: Berlin/Heidelberg, Germany, 2006; pp. 185–200. ISBN 978-3-540-34677-7. [Google Scholar]
  6. Coates, D.A.; Deschutter, Y.; Vincx, M.; Vanaverbeke, J. Enrichment and shifts in macrobenthic assemblages in an offshore wind farm area in the Belgian part of the North Sea. Mar. Environ. Res. 2014, 95, 1–12. [Google Scholar] [CrossRef] [PubMed]
  7. Reubens, J.T.; Degraer, S.; Vincx, M. The ecology of benthopelagic fishes at offshore wind farms: A synthesis of 4 years of research. Hydrobiologia 2014, 727, 121–136. [Google Scholar] [CrossRef]
  8. Mavraki, N.; Degraer, S.; Vanaverbeke, J. Offshore wind farms and the attraction–production hypothesis: Insights from a combination of stomach content and stable isotope analyses. Hydrobiologia 2021, 848, 1639–1657. [Google Scholar] [CrossRef]
  9. Petersen, J.K.; Malm, T. Offshore Windmill Farms: Threats to or Possibilities for the Marine Environment. Ambio 2006, 35, 75–80. [Google Scholar] [CrossRef]
  10. Degraer, S.; Carey, D.A.; Coolen, J.W.P.; Hutchison, Z.L.; Kerckhof, F.; Rumes, B.; Vanaverbeke, J. Offshore wind farm artificial reefs affect ecosystem structure and functioning: A Synthesis. Oceanography 2020, 33, 48–57. [Google Scholar] [CrossRef]
  11. Mavraki, N.; Degraer, S.; Vanaverbeke, J.; Braeckman, U. Organic matter assimilation by hard substrate fauna in an offshore wind farm area: A pulse-chase study. ICES J. Mar. Sci. 2020, 77, 2681–2693. [Google Scholar] [CrossRef]
  12. Voet, H.E.E.; Vlaminck, E.; Van Colen, C.; Bodé, S.; Boeckx, P.; Degraer, S.; Moens, T.; Vanaverbeke, J.; Braeckman, U. Organic Matter Processing in a [Simulated] Offshore Wind Farm Ecosystem in Current and Future Climate and Aquaculture Scenarios. Sci. Total Environ. 2023, 857, 159285. [Google Scholar] [CrossRef]
  13. Slavik, K.; Lemmen, C.; Zhang, W.; Kerimoglu, O.; Klingbeil, K.; Wirtz, K.W. The large-scale impact of offshore wind farm structures on pelagic primary productivity in the southern North Sea. Hydrobiologia 2019, 845, 35–53. [Google Scholar] [CrossRef] [Green Version]
  14. Mavraki, N.; De Mesel, I.; Degraer, S.; Moens, T.; Vanaverbeke, J. Resource Niches of Co-occurring Invertebrate Species at an Offshore Wind Turbine Indicate a Substantial Degree of Trophic Plasticity. Front. Mar. Sci. 2020, 7, 379. [Google Scholar] [CrossRef]
  15. Ivanov, E.; Capet, A.; Borger, E.D.; Degraer, S.; Delhez, E.; Soetaert, K.; Vanaverbeke, J.; Grégoire, M. Modelling of the offshore wind farm footprint on organic and mineral particle deposition flux. In Proceedings of the Copernicus Meetings, Online, 19–30 April 2021. [Google Scholar]
  16. De Borger, E.; Ivanov, E.; Capet, A.; Braeckman, U.; Vanaverbeke, J.; Grégoire, M.; Soetaert, K. Offshore Windfarm Footprint of Sediment Organic Matter Mineralization Processes. Front. Mar. Sci. 2021, 8, 632243. [Google Scholar] [CrossRef]
  17. Coolen, J.W.P.; Vanaverbeke, J.; Dannheim, J.; Garcia, C.; Birchenough, S.N.R.; Krone, R.; Beermann, J. Generalized changes of benthic communities after construction of wind farms in the southern North Sea. J. Environ. Manag. 2022, 315, 115173. [Google Scholar] [CrossRef]
  18. Clements, F.E. Plant Succession: An Analysis of the Development of Vegetation; Carnegie Institution of Washington: Washington, DC, USA, 1916; ISBN 978-0-598-48534-2. [Google Scholar]
  19. Hill, M.F.; Witman, J.D.; Caswell, H. Spatio-temporal variation in Markov chain models of subtidal community succession. Ecol. Lett. 2002, 5, 665–675. [Google Scholar] [CrossRef]
  20. Scheer, B.T. The development of marine fouling communities. Biol. Bull. 1945, 89, 103–121. [Google Scholar] [CrossRef]
  21. Sutherland, J.P. Multiple Stable Points in Natural Communities. Am. Nat. 1974, 108, 859–873. [Google Scholar] [CrossRef]
  22. Boyd, S.E.; Limpenny, D.S.; Rees, H.L.; Cooper, K.M.; Campbell, S. Preliminary observations of the effects of dredging intensity on the re-colonisation of dredged sediments off the southeast coast of England (Area 222). Estuar. Coast. Shelf Sci. 2003, 57, 209–223. [Google Scholar] [CrossRef]
  23. Whomersley, P.; Picken, G.B. Long-term dynamics of fouling communities found on offshore installations in the North Sea. J. Mar. Biol. Assoc. UK 2003, 83, 897–901. [Google Scholar] [CrossRef]
  24. Taormina, B.; Percheron, A.; Marzloff, M.P.; Caisey, X.; Quillien, N.; Lejart, M.; Desroy, N.; Dugornay, O.; Tancray, A.; Carlier, A. Succession in epibenthic communities on artificial reefs associated with marine renewable energy facilities within a tide-swept environment. ICES J. Mar. Sci. 2020, 77, 2656–2668. [Google Scholar] [CrossRef]
  25. Oshurkov, V.V. Succession and climax in some fouling communities. Biofouling 1992, 6, 1–12. [Google Scholar] [CrossRef]
  26. Sutherland, J.P.; Karlson, R.H. Development and Stability of the Fouling Community at Beaufort, North Carolina. Ecol. Monogr. 1977, 47, 425–446. [Google Scholar] [CrossRef]
  27. Roberts, D.; Rittschof, D.; Holm, E.; Schmidt, A.R. Factors influencing initial larval settlement: Temporal, spatial and surface molecular components. J. Exp. Mar. Biol. Ecol. 1991, 150, 203–221. [Google Scholar] [CrossRef]
  28. Fortič, A.; Mavrič, B.; Pitacco, V.; Lipej, L. Temporal changes of a fouling community: Colonization patterns of the benthic epifauna in the shallow northern Adriatic Sea. Reg. Stud. Mar. Sci. 2021, 45, 101818. [Google Scholar] [CrossRef]
  29. Nydam, M.; Stachowicz, J. Predator effects on fouling community development. Mar. Ecol. Prog. Ser. 2007, 337, 93–101. [Google Scholar] [CrossRef] [Green Version]
  30. Cifuentes, M.; Krueger, I.; Dumont, C.P.; Lenz, M.; Thiel, M. Does primary colonization or community structure determine the succession of fouling communities? J. Exp. Mar. Biol. Ecol. 2010, 395, 10–20. [Google Scholar] [CrossRef]
  31. Sandin, S.A.; McNamara, D.E. Spatial dynamics of benthic competition on coral reefs. Oecologia 2012, 168, 1079–1090. [Google Scholar] [CrossRef]
  32. Loureiro, T.G.; Peters, K.; Robinson, T.B. Light, shade and predation: Who wins and who loses in sessile fouling communities? Mar. Biodivers. 2021, 51, 94. [Google Scholar] [CrossRef]
  33. Dayton, P.K. Toward an understanding of community resilience and the potential effects of enrichments to the benthos at McMurdo Sound, Antarctica. In Proceedings of the Colloquium on Conservation Problems Allen Press, Lawrence, Kansas, 1 January 1972; pp. 81–96. [Google Scholar]
  34. Stachowicz, J.J. Mutualism, Facilitation, and the Structure of Ecological Communities. BioScience 2001, 51, 235. [Google Scholar] [CrossRef]
  35. Bruno, J.F.; Stachowicz, J.J.; Bertness, M.D. Inclusion of facilitation into ecological theory. Trends Ecol. Evol. 2003, 18, 119–125. [Google Scholar] [CrossRef]
  36. Yakovis, E.; Artemieva, A. Epibenthic predators control mobile macrofauna associated with a foundation species in a subarctic subtidal community. Ecol. Evol. 2019, 9, 10499–10512. [Google Scholar] [CrossRef] [Green Version]
  37. Gutiérrez, J.L.; Jones, C.G.; Strayer, D.L.; Iribarne, O.O. Mollusks as ecosystem engineers: The role of shell production in aquatic habitats. Oikos 2003, 101, 79–90. [Google Scholar] [CrossRef]
  38. Yakovis, E.; Artemieva, A. Cockles, barnacles and ascidians compose a subtidal facilitation cascade with multiple hierarchical levels of foundation species. Sci. Rep. 2017, 7, 237. [Google Scholar] [CrossRef] [Green Version]
  39. Searles, A.R.; Gipson, E.E.; Walters, L.J.; Geoffrey, S. Cook Oyster reef restoration facilitates the recovery of macroinvertebrate abundance, diversity, and composition in estuarine communities. Sci. Rep. 2022, 12, 8163. [Google Scholar] [CrossRef]
  40. Coolen, J.W.P.; van der Weide, B.; Cuperus, J.; Blomberg, M.; Van Moorsel, G.W.N.M.; Faasse, M.A.; Bos, O.G.; Degraer, S.; Lindeboom, H.J. Benthic biodiversity on old platforms, young wind farms, and rocky reefs. ICES J. Mar. Sci. 2020, 77, 1250–1265. [Google Scholar] [CrossRef]
  41. Mills, L.S.; Soulé, M.E.; Doak, D.F. The Keystone-Species Concept in Ecology and Conservation. BioScience 1993, 43, 219–224. [Google Scholar] [CrossRef] [Green Version]
  42. Paine, R.T. Food Web Complexity and Species Diversity. Am. Nat. 1966, 100, 65–75. [Google Scholar] [CrossRef]
  43. Menge, B.A.; Sutherland, J.P. Species Diversity Gradients: Synthesis of the Roles of Predation, Competition, and Temporal Heterogeneity. Am. Nat. 1976, 110, 351–369. [Google Scholar] [CrossRef]
  44. Sarnelle, O. Daphnia as keystone predators: Effects on phytoplankton diversity and grazing resistance. J. Plankton Res. 2005, 27, 1229–1238. [Google Scholar] [CrossRef]
  45. Navarrete, S.A.; Menge, B.A. Keystone Predation and Interaction Strength: Interactive Effects of Predators on Their Main Prey. Ecol. Monogr. 1996, 66, 409–429. [Google Scholar] [CrossRef]
  46. Mouquet, N.; Gravel, D.; Massol, F.; Calcagno, V. Extending the concept of keystone species to communities and ecosystems. Ecol. Lett. 2013, 16, 1–8. [Google Scholar] [CrossRef]
  47. Lewbel, G.S.; Howard, R.L.; Gallaway, B.J. Zonation of dominant fouling organisms on northern gulf of Mexico petroleum platforms. Mar. Environ. Res. 1987, 21, 199–224. [Google Scholar] [CrossRef]
  48. Venugopalan, V.P.; Wagh, A.B. Biofouling of an offshore oil platform: Faunal composition and biomass. Indian J. Mar. Sci. 1990, 19, 4. [Google Scholar]
  49. Richardson, C.A.; Seed, R. Predictions of mussel (Mytilus edulis) biomass on an offshore platform from single population samples. Biofouling 1990, 2, 289–297. [Google Scholar] [CrossRef]
  50. Sell, D. Marine Fouling. Proc. Royal Soc. Edinb. Sect. B Biol. Sci. 1992, 100, 169–184. [Google Scholar] [CrossRef]
  51. Relini, G.; Tixi, F.; Relini, M.; Torchia, G. The macrofouling on offshore platforms at Ravenna. Int. Biodeterior. Biodegrad. 1998, 41, 41–55. [Google Scholar] [CrossRef]
  52. Yan, T.; Yan, W.X. Fouling of Offshore Structures in China-a Review. Biofouling 2003, 19, 133–138. [Google Scholar] [CrossRef]
  53. Bram, J.B.; Page, H.M.; Dugan, J.E. Spatial and temporal variability in early successional patterns of an invertebrate assemblage at an offshore oil platform. J. Exp. Mar. Biol. Ecol. 2005, 317, 223–237. [Google Scholar] [CrossRef]
  54. Oricchio, F.; Dias, G. Predation and competition interact to determine space monopolization by non-indigenous species in a sessile community from the southwestern Atlantic Ocean. Aquat. Invasions 2020, 15, 127–139. [Google Scholar] [CrossRef]
  55. Fettweis, M.; Schartau, M.; Desmit, X.; Lee, B.J.; Terseleer, N.; Zande, D.V.d.; Parmentier, K.; Riethmüller, R. Organic Matter Composition of Biomineral Flocs and Its Influence on Suspended Particulate Matter Dynamics Along a Nearshore to Offshore Transect. J. Geophys. Res. Biogeosci. 2022, 172, e2021JG006332. [Google Scholar] [CrossRef]
  56. Baeye, M.; Fettweis, M. In situ observations of suspended particulate matter plumes at an offshore wind farm, southern North Sea. Geo. Mar. Lett. 2015, 35, 247–255. [Google Scholar] [CrossRef]
  57. De Mesel, I.; Kerckhof, F.; Norro, A.; Rumes, B.; Degraer, S. Succession and seasonal dynamics of the epifauna community on offshore wind farm foundations and their role as stepping stones for non-indigenous species. Hydrobiologia 2015, 756, 37–50. [Google Scholar] [CrossRef]
  58. Horton, T.; Kroh, A.; Ahyong, S.; Bailly, N.; Boyko, C.B.; Brandão, S.N.; Gofas, S.; Hooper, J.N.A.; Hernandez, F.; Holovachov, O.; et al. World Register of Marine Species (WoRMS); WoRMS Editorial Board: Oostende, Belgium, 2021. [Google Scholar]
  59. Wang, Y.; Naumann, U.; Wright, S.T.; Warton, D.I. Mvabund—An R package for model-based analysis of multivariate abundance data. Methods Ecol. Evol. 2012, 3, 471–474. [Google Scholar] [CrossRef]
  60. Niku, J.; Hui, F.K.C.; Taskinen, S.; Warton, D.I. Gllvm: Fast analysis of multivariate abundance data with generalized linear latent variable models in r. Methods Ecol. Evol. 2019, 10, 2173–2182. [Google Scholar] [CrossRef] [Green Version]
  61. Hui, F.K.C.; Taskinen, S.; Pledger, S.; Foster, S.D.; Warton, D.I. Model-based approaches to unconstrained ordination. Methods Ecol. Evol. 2015, 6, 399–411. [Google Scholar] [CrossRef]
  62. Bray, J.R.; Curtis, J.T. An Ordination of the Upland Forest Communities of Southern Wisconsin. Ecol. Monogr. 1957, 27, 326–349. [Google Scholar] [CrossRef]
  63. Oksanen, J.; Blanchet, F.G.; Friendly, M.; Kindt, R.; Legendre, P.; McGlinn, D.; Minchin, P.R.; O’Hara, R.B.; Simpson, G.; Solymos, P.; et al. Vegan: Community Ecology Package, R Package Version 2.5–7; University of Helsinki: Helsinki, Finland, 2020; Available online: https://CRAN.R-project.org/package=vegan (accessed on 15 June 2022).
  64. Buckley, H.L.; Day, N.J.; Case, B.S.; Lear, G.; Ellison, A.M. Multivariate methods for testing hypotheses of temporal community dynamics. bioRxiv 2019, 362822. [Google Scholar] [CrossRef] [Green Version]
  65. Zuur, A.F.; Ieno, E.N.; Elphick, C.S. A protocol for data exploration to avoid common statistical problems: Data exploration. Methods Ecol. Evol. 2010, 1, 3–14. [Google Scholar] [CrossRef]
  66. Fox, J.; Weisberg, S. An R Companion to Applied Regression, 3rd ed.; Sage: Thousand Oaks, CA, USA, 2019. [Google Scholar]
  67. Zuur, A.F.; Ieno, E.N.; Walker, N.; Saveliev, A.A.; Smith, G.M. Mixed Effects Models and Extensions in Ecology with R; Statistics for Biology and Health; Springer: New York, NY, USA, 2009; ISBN 978-0-387-87457-9. [Google Scholar]
  68. Wood, S.; Scheipl, F. Package ‘Gamm4′: Generalized Additive Mixed Models Using “mgcv” and “lme4”; CRAN: Online, 2020. [Google Scholar]
  69. Akaike, H. Information Theory and the Maximum Likelihood Principle in 2nd International Symposium on Information Theory; Petrov, B.N., Cs ä ki, F., Eds.; Akademiai Ki à do: Budapest, Hungary, 1973. [Google Scholar]
  70. Anderson, D.R. Model Based Inference in the Life Sciences: A Primer on Evidence; Springer: New York, NY, USA, 2008; ISBN 978-0-387-74073-7. [Google Scholar]
  71. Parsons, D.; Suthers, I.; Cruz, D.; Smith, J. Effects of habitat on fish abundance and species composition on temperate rocky reefs. Mar. Ecol. Prog. Ser. 2016, 561, 155–171. [Google Scholar] [CrossRef]
  72. R Core Team. R: A Language and Environment for Statistical Computing; R Core Team: Vienna, Austria. Available online: https://www.R-project.org/ (accessed on 15 June 2022).
  73. Zintzen, V.; Norro, A.; Massin, C.; Mallefet, J. Spatial variability of epifaunal communities from artificial habitat: Shipwrecks in the Southern Bight of the North Sea. Estuar. Coast. Shelf Sci. 2008, 76, 327–344. [Google Scholar] [CrossRef]
  74. Schutter, M.; Dorenbosch, M.; Driessen, F.M.F.; Lengkeek, W.; Bos, O.G.; Coolen, J.W.P. Oil and gas platforms as artificial substrates for epibenthic North Sea fauna: Effects of location and depth. J. Sea Res. 2019, 153, 101782. [Google Scholar] [CrossRef]
  75. Krone, R.; Gutow, L.; Joschko, T.J.; Schröder, A. Epifauna dynamics at an offshore foundation–Implications of future wind power farming in the North Sea. Mar. Environ. Res. 2013, 85, 1–12. [Google Scholar] [CrossRef] [PubMed]
  76. Todd, V.L.G.; Susini, I.; Williamson, L.D.; Todd, I.B.; McLean, D.L.; Macreadie, P.I. Characterizing the second wave of fish and invertebrate colonization of an offshore petroleum platform. ICES J. Mar. Sci. 2021, 78, 1131–1145. [Google Scholar] [CrossRef]
  77. Agüera, A.; Saurel, C.; Møller, L.F.; Fitridge, I.; Petersen, J.K. Bioenergetics of the common seastar Asterias rubens: A keystone predator and pest for European bivalve culture. Mar. Biol. 2021, 168, 48. [Google Scholar] [CrossRef]
  78. Hardy, F.G. Fouling on North Sea Platforms. Bot. Mar. 1981, 24, 173–176. [Google Scholar] [CrossRef]
  79. Forteath, G.; Picken, G.; Ralph, R.; Williams, J. Marine Growth Studies on the North Sea Oil Platform Montrose Alpha. Mar. Ecol. Prog. Ser. 1982, 8, 61–68. [Google Scholar] [CrossRef]
  80. Wolfson, A.; Van Blaricom, G.; Davis, N.; Lewbel, G. The Marine Life of an Offshore Oil Platform. Mar. Ecol. Prog. Ser. 1979, 1, 81–89. [Google Scholar] [CrossRef]
  81. Southgate, T.; Myers, A.A. Mussel fouling on the Celtic Sea Kinsale Field gas platforms. Estuar. Coast. Shelf Sci. 1985, 20, 651–659. [Google Scholar] [CrossRef]
  82. Suchanek, T. Mussels and their role in structuring rocky shore communities. In The Ecology of Rocky Coasts; Hodder & Stoughton: London, UK, 1985; pp. 70–96. [Google Scholar]
  83. Lintas, C.; Seed, R. Spatial variation in the fauna associated with Mytilus edulis on a wave-exposed rocky shore. J. Molluscan Stud. 1994, 60, 165–174. [Google Scholar] [CrossRef]
  84. Ragnarsson, S.Á.; Raffaelli, D. Effects of the mussel Mytilus edulis L. on the invertebrate fauna of sediments. J. Exp. Mar. Biol. Ecol. 1999, 241, 31–43. [Google Scholar] [CrossRef]
  85. Drent, J.; Dekker, R. Macrofauna Associated with Mussels, Mytilus edulis L., in the subtidal of the western Dutch Wadden Sea; NIOZ, Royal Netherlands Institute for Sea Research: Texel, The Netherlands, 2013; p. 56. [Google Scholar]
  86. Tsuchiya, M.; Nishihira, M. Islands of Mytilus as a habitat for small intertidal animals: Effect of island size on community structure. Mar. Ecol. Prog. Ser. 1985, 25, 71–81. [Google Scholar] [CrossRef]
  87. Norling, P.; Kautsky, N. Structural and functional effects of Mytilus edulis on diversity of associated species and ecosystem functioning. Mar. Ecol. Prog. Ser. 2007, 351, 163–175. [Google Scholar] [CrossRef] [Green Version]
  88. Miner, C.M.; Burnaford, J.L.; Ammann, K.; Becker, B.H.; Fradkin, S.C.; Ostermann-Kelm, S.; Smith, J.R.; Whitaker, S.G.; Raimondi, P.T. Latitudinal variation in long-term stability of North American rocky intertidal communities. J. Anim. Ecol. 2021, 90, 2077–2093. [Google Scholar] [CrossRef]
  89. Nelson, M.; Craig, S. Role of the sea anemone Metridium senile in structuring a developing subtidal fouling community. Mar. Ecol. Prog. Ser. 2011, 421, 139–149. [Google Scholar] [CrossRef] [Green Version]
  90. Zintzen, V.; Massin, C.; Norro, A.; Mallefet, J. Epifaunal inventory of two shipwrecks from the Belgian Continental Shelf. In Marine Biodiversity: Patterns and Processes, Assessment, Threats, Management and Conservation; Developments in, Hydrobiology; Martens, K., Queiroga, H., Cunha, M.R., Cunha, A., Moreira, M.H., Quintino, V., Rodrigues, A.M., Seroôdio, J., Warwick, R.M., Eds.; Springer: Dordrecht, The Netherlands, 2006; pp. 207–219. ISBN 978-1-4020-4697-1. [Google Scholar]
  91. Coolen, J.W.P.; Bos, O.G.; Glorius, S.; Lengkeek, W.; Cuperus, J.; van der Weide, B.; Agüera, A. Reefs, sand and reef-like sand: A comparison of the benthic biodiversity of habitats in the Dutch Borkum Reef Grounds. J. Sea Res. 2015, 103, 84–92. [Google Scholar] [CrossRef]
  92. Van der Stap, T.; Coolen, J.W.P.; Lindeboom, H.J. Marine Fouling Assemblages on Offshore Gas Platforms in the Southern North Sea: Effects of Depth and Distance from Shore on Biodiversity. PLoS ONE 2016, 11, e0146324. [Google Scholar] [CrossRef] [Green Version]
  93. Ardizzone, G.D.; Gravina, M.F.; Belluscio, A. Temporal Development of Epibenthic Communities on Artificial Reefs in the Central Mediterranean Sea. Bull. Mar. Sci. 1989, 44, 592–608. [Google Scholar]
  94. Butler, A.; Connolly, R. Assemblages of sessile marine invertebrates:still changing after all these years? Mar. Ecol. Prog. Ser. 1999, 182, 109–118. [Google Scholar] [CrossRef] [Green Version]
  95. Hooper, T.; Beaumont, N.; Hattam, C. The implications of energy systems for ecosystem services: A detailed case study of offshore wind. Renew. Sustain. Energy Rev. 2017, 70, 230–241. [Google Scholar] [CrossRef] [Green Version]
  96. Fowler, A.M.; Jorgensen, A.-M.; Svendsen, J.C.; Macreadie, P.I.; Jones, D.O.B.; Boon, A.R.; Booth, D.J.; Brabant, R.; Callahan, E.; Claisse, J.T.; et al. Environmental benefits of leaving offshore infrastructure in the ocean. Front. Ecol. Environ. 2018, 16, 571–578. [Google Scholar] [CrossRef]
Figure 1. Map of the Belgian part of the North Sea (BPNS: black polygon) showing the sampling locations and their position relative to Belgian and Dutch offshore wind farm (OWF) zones (grey polygons). The Bligh Bank OWF is represented in red and the Thornton Bank OWF is represented in blue. The sampled turbines are marked with a star. Mean annual surface suspended particulate matter (SPM) concentration derived from the Ocean and Land Colour Instrument as in [55].
Diversity 15 00288 g001
Figure 2. Graphical representation of the model-based ordinations derived from generalized linear latent variable models describing changes in assemblage structure across samples from Bligh Bank (circle) and Thornton Bank (triangle) and over time. The top left panel (A) shows the unconstrained ordination describing the general variation of the assemblage data. The top right (B) and bottom left (C) are partial ordinations describing the variation in assemblage data after adjusting for the effect of the environmental explanatory variables age and location. The more the patterns differ from the unconstrained version, the more the variation in assemblages is explained by the constraining explanatory variable.
Diversity 15 00288 g002
Figure 3. Temporal variation of taxonomic dissimilarity between (A) and within (B) the two offshore wind farms. The dissimilarity between the two wind farms increases, suggesting a divergence in community composition.
Diversity 15 00288 g003
Figure 4. Fitted smoothing curves for ‘age’ in the best-fitting generalized additive model explaining richness and diversity patterns at the Bligh Bank and Thornton Bank offshore wind farms.
Diversity 15 00288 g004
Figure 5. Fitted relationship for significant biological predictors in the best-fitting generalized additive model explaining richness and diversity from offshore wind farms. Richness is significantly correlated with the abundance of amphipods and the predator, Asterias rubens, while diversity is significantly correlated with the abundance of amphipods, A. rubens, Mytilus edulis, and Metridium senile. Smoothed or raw data is visualized based on non-linear or linear relationships, respectively.
Diversity 15 00288 g005
Figure 6. Temporal changes in relative abundances for biofouling taxa in the two offshore wind farms.
Diversity 15 00288 g006
Table 1. Annual number of scrape samples per turbine per year obtained in the Bligh Bank and Thornton Bank OWF over time. Sampling in the Bligh Bank OWF started in 2009 and in 2008 in the Thornton Bank OWF.
Years Since Installation1234567891011Total
Bligh BankBB B2 3 3
BB B8332 3 3 418
BB C233443 17
Thornton BankD5161132333 344
D6 3 3 3 2 11
Total 222099663335793
Table 2. Results of multivariate generalized linear models testing for the effects of location and age and their interaction on biofouling fauna community composition. Only those species with significant (p < 0.05) parameter terms are listed and the contribution (%) to the parameter deviance is provided in brackets.
ParameterResidual DFDFDeviancep-ValueSpecies with Significant Effect
Countable Species
(Abundance)
Location911352.30.001Heteranomia squamula (9.5%), Monocorophium acherusicum (7.8%), Spirobranchus triqueter (6.8%), Verruca stroemia (5.2%), Phyllodoce mucosa (5.1%), Alcyonium digitatum (4.5 %), Eulalia (4.3 %), and Amphipholis squamata (3.5%)
Age901766.30.001Asterias rubens (6.7%), Psammechinus miliaris (6.1%), Monocorophium acherusicum (6%), Corophium sextonae (4.9%), Phyllodoce mucosa (4.1%), Verruca stroemia (3.8%), Nudibranchia (3.8%), Metridium senile (3.6%), Mytilus edulis (3.2%), Gitana sarsi (3.12%), Lanice conchilega (2.8%), Heteranomia squamula (2.7 %), Sabellaria spinulosa (2.6%), Syllis gracilis (2.4%), Pisidia longicornis (2.2%), Nototropis swammerdamei (1.8%), Pilumnus hirtellus (1.7%), Eunereis longissima (1.7%), and Pagurus bernhardus (1.6%)
Location:Age891171.80.023Balanus perforatus (19.4%)
Table 3. Overview of the full model and alternative models considered (excluded variables indicated with -) for richness. The model with the best fit is highlighted. For richness, there were three models with the ΔAIC value <3, thus we choose the best-fitting model as the one with the highest percentage of deviance explained (i.e., 85.3%). p-value for all of the variables (p < 0.001: ***, p < 0.01: **, p < 0.05: *, p > 0.1: ns) and estimate for linear variables.
ModelParkpAge, BWAge, CPAsterias rubenspPsammechinus miliarispMytilus edulisMetridium senilepAmphipodsAICΔAIC% Deviance
Full0.11ns***ns0.013*−0.009nsns0.001ns***590485.8
Full simplified 10.21ns******0.016*−0.008ns*--*590485.3
Full simplified 20.18ns******0.019**--ns--*589385.3
Full simplified 3--*****0.021**--ns--*588282.7
Full simplified 4 --*****0.021***-----**586082.5
Environment0.20ns******--- ----6031776.9
Biological----0.026***−0.001ns***0.0024Ns***6546852.6
Predators----0.018***−0.016***----7461607
Foundation--- ----***---69510924.7
Space occupier---------0.004******71412529.9
Table 4. Overview of the full model and alternative models considered (excluded variables indicated with -) for diversity. The model with the best fit is highlighted. (All other models had a ΔAIC value >6 and explained only 2% of extra deviance). p-value for all of the variables (p < 0.001: ***, p < 0.01: **, p < 0.05: *, p < 0.1: ns) and estimate for linear variables.
ModelParkpAge, BWAge, CPAsterias rubensPsammechinus miliarisMytilus edulispMetridium senileAmphipodsAICΔAIC% Deviance
Full0.013ns********ns0.005*****1021292.2
Full simplified 1--********ns0.005*****97793.8
Full simplified 2--*******-0.005*****90091.7%
Environment0.005ns******--- --1172773
Biological- --*ns0.008*********1172773
Predators- --*ns- --1778816.8
Foundation- - --*** --1667615.1
Space occupier- ----- ******1485866.5
Disclaimer/Publisher’s Note: The statements, opinions and data contained in all publications are solely those of the individual author(s) and contributor(s) and not of MDPI and/or the editor(s). MDPI and/or the editor(s) disclaim responsibility for any injury to people or property resulting from any ideas, methods, instructions or products referred to in the content.

