Article

Lichen and Lichenicolous Fungal Communities Tested as Suitable Systems for the Application of Cross-Taxon Analysis

Department of Life Sciences, University of Trieste, via L. Giorgieri 10, 34127 Trieste, Italy
*
Author to whom correspondence should be addressed.
Diversity 2023, 15(2), 285; https://doi.org/10.3390/d15020285
Submission received: 13 December 2022 / Revised: 8 February 2023 / Accepted: 10 February 2023 / Published: 16 February 2023
(This article belongs to the Special Issue Recent Studies of Lichenized Fungi and Holobiomes)

Abstract

:
Lichens are outstanding examples of fungal symbioses that form long-lived structures, the lichen thalli, in which a multiplicity of other microorganisms are hosted. Among these, microfungi seem to establish diverse trophic relationships with their lichen hosts. The most specialised of these fungi are the parasitic lichenicolous fungi, of which the diversity has hardly been explained as a proxy for the diversity of lichen species. Here, we used an exemplar dataset of a well-studied alpine lichen community composed of 63 lichen and 41 lichenicolous fungal species and tested it to verify the strength of the co-occurrences of the two species groups with predictive co-correspondence analyses. The results showed that the distribution of lichen abundances affects the abundance and variation of lichenicolous fungi and supports our hypothesis to use lichens as surrogates for lichenicolous fungi in surrogacy analysis.

1. Introduction

Evolution is replete with examples of symbiotic life forms, which often include great strategies to survive environmental changes and explore new ecologies [1,2]. Lichen symbioses are among the best representatives of symbiotic species evolution processes, in which a multiplicity of organisms from different kingdoms are found and diversified [3,4,5,6]. Lichens are composed of a main fungal partner (the mycobiont) and one main population of photosynthetic partners (the photobiont), which are usually green algae or cyanobacteria [4,5]. The most recent research, however, has reappraised lichen symbioses as microecosystems in which an indeterminate number of other microorganisms are hosted [6].
Lichens can live and grow for up to centuries [7], and thus their thalli are stable microhabitats for many microorganisms, representing true biodiversity hotspots [6]. The stability and longevity of lichens may involve deeply complex relationships, with the establishment of species-specific communities of lichen-associated microorganisms [8,9,10]. Among these, fungal communities inhabiting lichen thalli are acknowledged to represent the lichen mycobiome [9,11,12]. Lichen mycobiomes comprise fungi that develop diverse trophic relationships with their lichen host(s), being parasitic, commensals, or saprobic. Since their discovery in the early 19th century, lichen-inhabiting fungi have been referred to as ’lichenicolous fungi‘. These fungi are usually recognized by symptomatic infection on the thalli (even causing necrotic patches) or by the formation of their reproductive bodies [8,13]. However, a century later, the presence of fungi cryptically occurring in lichen thalli has been shown [14,15,16], and these taxa were called ’endolichenic fungi‘. More recently, Hafellner [17] reappraised the definition of lichenicolous fungi including all fungi living in and on lichens, whether symptomatic or not. Due to their inconspicuous, microscopic mycelium, which makes their species recognition difficult, or the several attempts to isolate and grow them in culture, lichenicolous fungi are still poorly investigated, and their potential interaction with the major lichen symbionts, i.e., the mycobiont and the photobionts, are unknown. However, understanding their diversity and community structure within lichen communities could result in a comprehensive vision of species diversity.
So far, about 2000 species of lichenicolous fungi have been recognized, most of them belonging to the phylum Ascomycota [7,8]. Still, the number of lichenicolous fungal species is increasing, thanks to the publication of national checklists (e.g., Hungary, India, and holarctic regions such as North America, Russia, and Sweden) which, based on detailed morphological recognition of environmental samples, encompass species diversity in different environments and on different hosts [17,18,19,20,21,22]. A high diversity of lichenicolous fungi associated with lichens has been reported in natural unpolluted habitats, such as Klondike Gold Rush National Historic Park [22], or in regions that have represented nunataks in the past [19,21,23,24]. In these places, lichen communities had time to establish and consolidate, thus becoming suitable niches for the slow-growing lichenicolous microfungi. This latter is the case of alpine lichen communities of the Koralpe Massive, located in Austria at the edge of the Eastern Alps. The area is a nunatak and consists of an extended alpine elevation on which gneiss and occasional marble outcrops are scattered, which further contribute to the exceptionally rich lichen species diversity [23,24].
The cross-taxon method has been developed to evaluate the covariance of diversity patterns in space or in time between two taxa or groups of taxa and to explain the diversity pattern of one taxon using the diversity of another [25]. This approach finds a correlation between the diversity of multiple taxa and creates a surrogate model to predict their diversity patterns [26,27]. Congruence in species richness or composition between different taxa has been proven useful for identifying surrogate models [27,28,29] and hotspots of biodiversity [30,31]. There are case studies in which, using the cross-taxon method, weak evidence of consistent patterns justifies the use of one taxon as a surrogate to predict patterns for other taxonomic groups [26,32,33]. Only a pair of previous studies considered lichens in a cross-taxon analysis [34,35] but neither treated them as surrogate organisms. Here, we focus on the group of symptomatic lichenicolous fungi and their lichen host species and use the second as a predictor to infer the biodiversity of the first. Specifically, we conducted a cross-taxon analysis to determine how lichenicolous fungi co-vary with the lichen host community, aiming to create an estimation model of lichenicolous fungi diversity using lichens as a surrogate. In doing this, we refer to the data published by Fleischhacker et al. [24] comprising 63 lichen and 41 lichenicolous fungal species.

2. Materials and Methods

2.1. Data Collection

The sampling was conducted in 2012 by Fleischhacker et al. [24], and the detailed sampling methodology has been described by the authors [24]. The sampling sites were located in the Koralpe Mountain area (Table 1), in the south-eastern Alps (Austria), where ten plots were chosen between 1700 and 2100 m above sea level (a.s.l.) according to the following criteria: the plots were located in the same habitat on exposed sites, separated by wide areas of pastures or dwarf shrub formations, and were characterised by the presence of big boulders and cliffs of homogeneous sized siliceous schist/gneissic rocks. Lichens of three growth forms were considered in the sampling: i.e., crustose (90% of the whole sampling), foliose, and fruticose. Each plot comprised an area of about 300 m2, and the whole plot area was divided into three subplots of about 30 m2 spaced 10 to 15 m from each other. The authors collected up to six thalli visibly infected by symptomatic lichenicolous fungi together with about 20 neighbouring thalli devoid of visible fungal infections (i.e., considered uninfected by symptomatic lichenicolous fungi). Here, only infected thalli were considered for the analyses (Supplementary Material Table S1 and R scritp).

2.2. Analysis of Species Diversity Patterns at Different Spatial Scales

Spatially explicit rarefaction curves [36,37] were calculated to compare patterns of species accumulation in relation to the sampling area between both lichens and lichenicolous fungi. To achieve this result, firstly, we calculated a plot-to-plot distance matrix using Euclidean distances with the dist function in the stats package of the R statistical software; secondly, the function directionalSAC available in the Rarefy package [38] was used to compare the classic and spatially explicit rarefaction curves. The spatially explicit rarefaction curves were calculated for lichens and lichenicolous fungi and plotted together with the ggplot2 function.
To investigate patterns of species richness for the analysed communities, three classic diversity indices were calculated for each subplot (30 in total) for both the lichen and lichenicolous fungal species, i.e., species richness, Shannon, and evenness (Pielou index). A one-way analysis of variance (ANOVA) was performed to test for statistical differences in richness, abundance, and evenness among plots using the aov function in the R stats package. Correlation analyses based on the Spearman index were then performed to test for statistical associations among the diversity indices of lichen and lichenicolous fungal species. The function cor in the stats package was used for the correlation analyses, and a significance test was performed with the cor.mtest function in the corrplot package [39].
Additive partitioning of diversity components [40] was performed to quantify the contribution of diversity components, namely α and β diversity, at different spatial scales for the analysed taxa and to compare these patterns between the two communities. This analysis, by partitioning diversity into additive components at different hierarchical spatial scales, allows comparing α, β, and γ diversity [41] within and among communities [42] and across spatial scales. Here, three hierarchical spatial levels, I = 1, 2, and 3, were considered: level 1 represents the sampling site scale (subplot), level 2 represents the sampling area scale (plot), and level 3 represents the whole study area of the Koralpe Massive. For each taxonomic group, α1 represents the mean species richness found within the lower (subplot) spatial scale; γ (=α3) is the total species richness of the study area, while β1 and β2 are the variations in species composition found among sampling sites and areas, respectively. To perform additive partitioning analyses, the adipart function in the R package vegan was used [43].

2.3. Congruence in Species Composition

The congruence between fungi and lichen compositions was tested using different methods. Firstly, Mantel and partial Mantel tests were carried out using Spearman correlation coefficients and 999 permutations. This analysis aims at assessing the significance of the relationship between pairwise distance in species composition (both fungi and lichens) and those of a predictor [44,45]. Before performing the Mantel and partial Mantel tests, distance matrices for each group of variables were calculated as follows: (1) a Euclidean distance matrix was calculated considering plot coordinates and (2) for lichenicolous fungi and lichens separately, the Bray–Curtis distance was used [46]. The abundance data for communities of lichenicolous fungi and lichens were square root transformed prior to the analysis to down-weight the contribution of the most abundant species. Co-correspondence analysis (Co-CA) [47,48] was used to quantify the ability of lichen data to predict the fungi species composition. Here, we used the predictive version of Co-CA, which combines the maximisation of weighted covariance between the weighted averages of species scores and partial least squares methodology (PLS; [49]). A leave-one-out cross-validatory fit percentage was estimated to select the minimal adequate predictive models. Schaffers et al. (2008) [48] pointed out that, due to its predictive nature, any cross-validatory fit >0 implicitly validates the model, indicating that prediction is better than that obtained under the null model. A permutation test for predictive co-correspondence analysis models was applied to assess the significance of each Co-CA ordination axis (999 permutations). In addition, coordinate vectors were fitted onto ordination axes assessing the importance and significance of the spatial organization of plots using the envfit.coca function.
Differences in beta diversity between lichens and lichenicolous fungi assemblages were tested for the whole set of plots by comparing the average of the calculated dissimilarities (both the Bray–Curtis and the Jaccard matrices) between the two groups (lichens and lichenicolous fungi) using the betadispersion2 R function [50]. p-values were computed from 9999 permutations of the plot-to-plot dissimilarities between the two groups [50,51]. The analysis of differences in beta diversity allows us to observe the response and catch other possible patterns in the cross-taxon analysis. All the analyses (Mantel, partial Mantel Test, Co-CA, and beta dispersion) were re-run using the presence–absence data.
Mantel and partial Mantel tests were computed using the R package vegan [43], and the Co-CA and related analysis with the R package cocorresp [52]. All statistical analyses were performed using R 4.0.5 [53].

3. Results

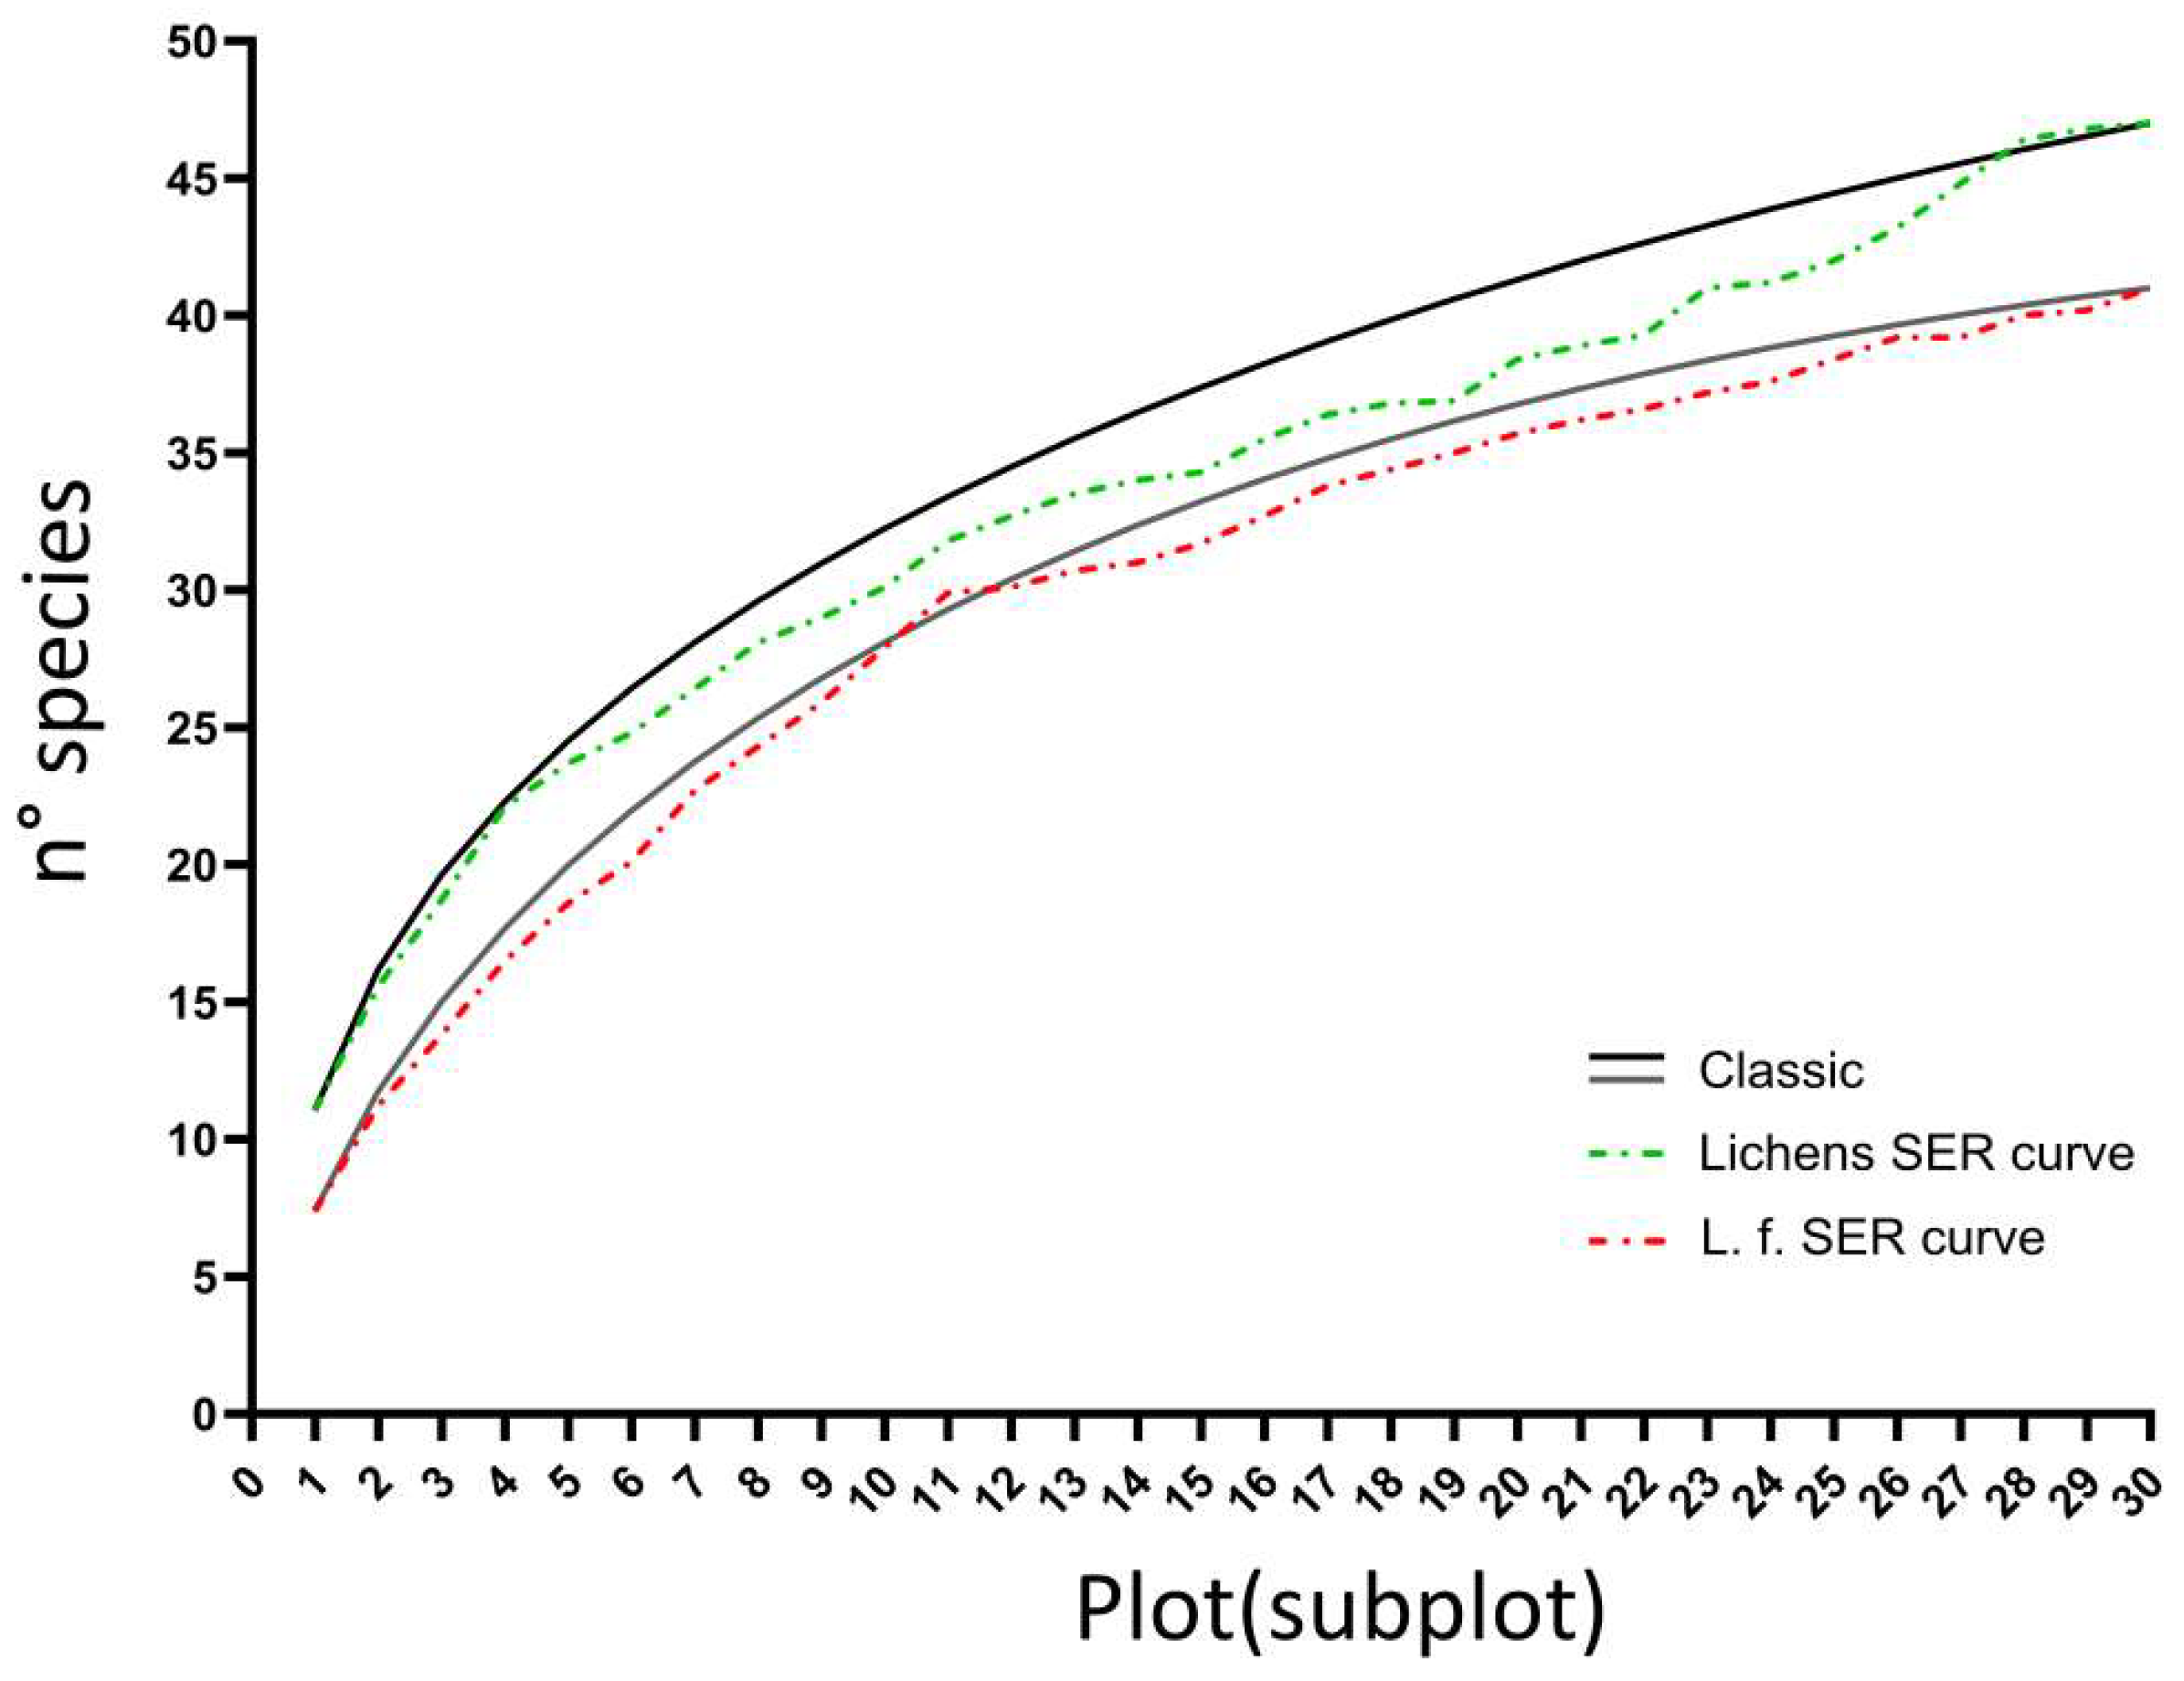
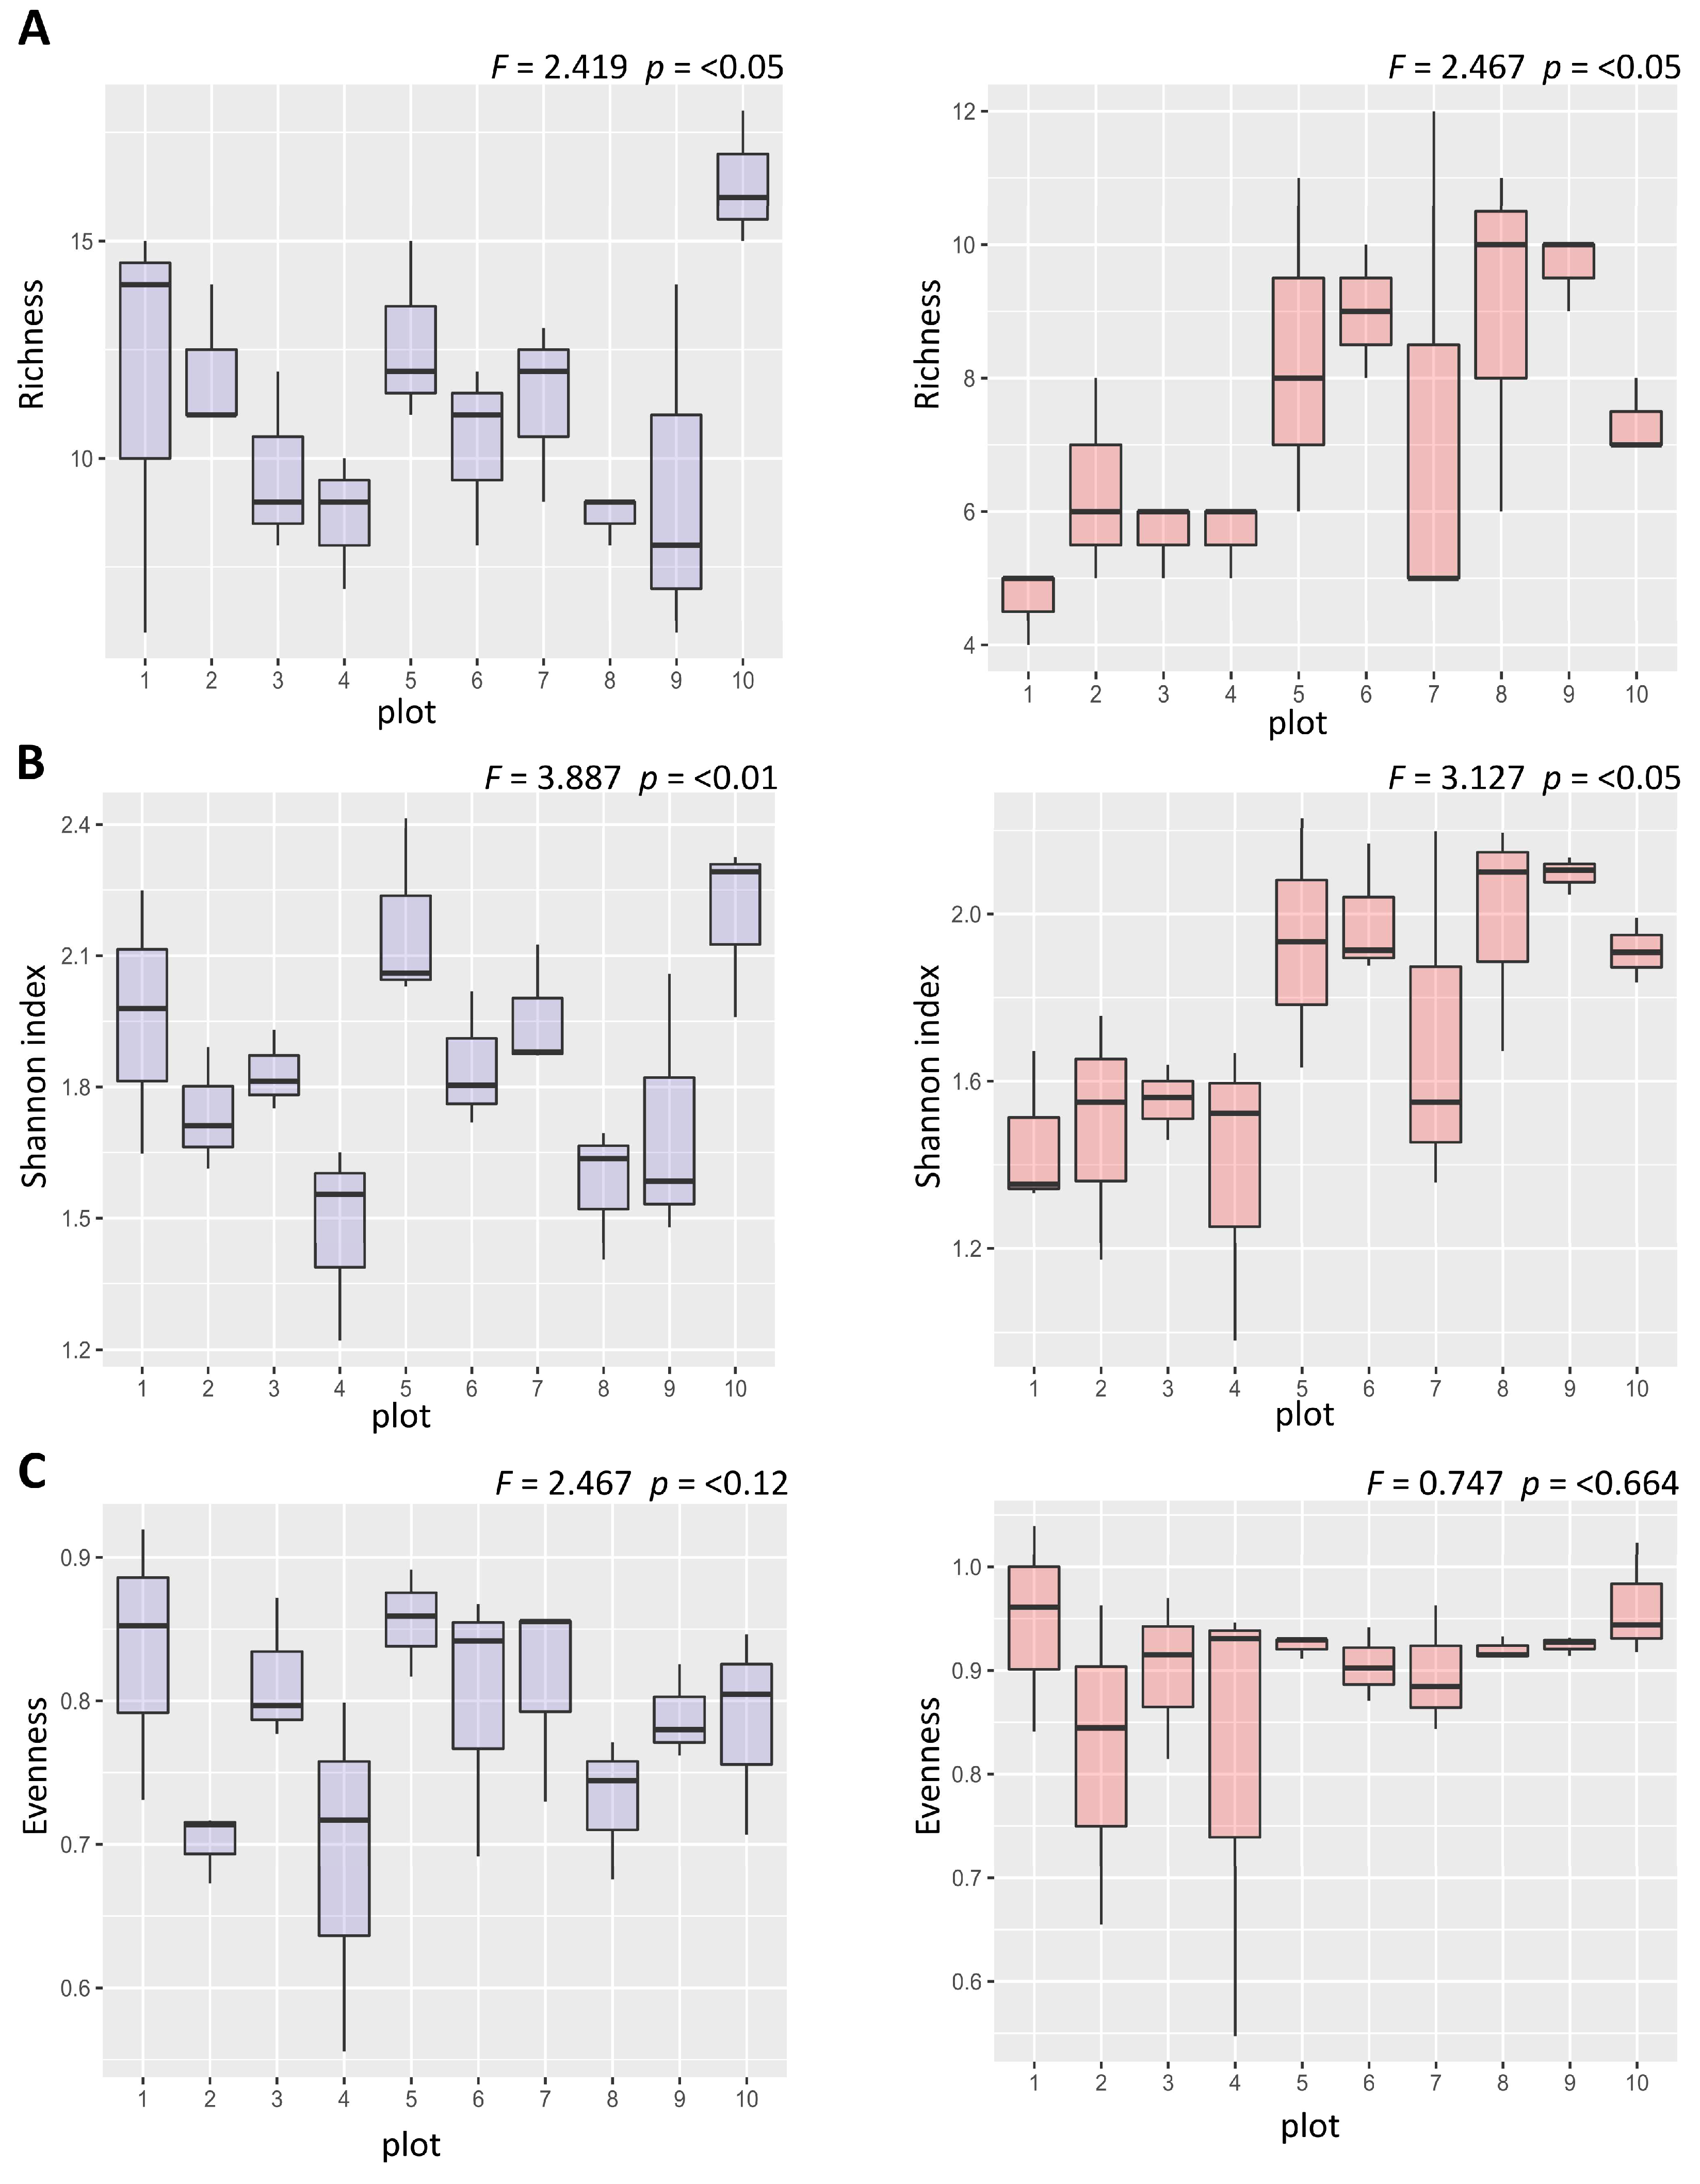
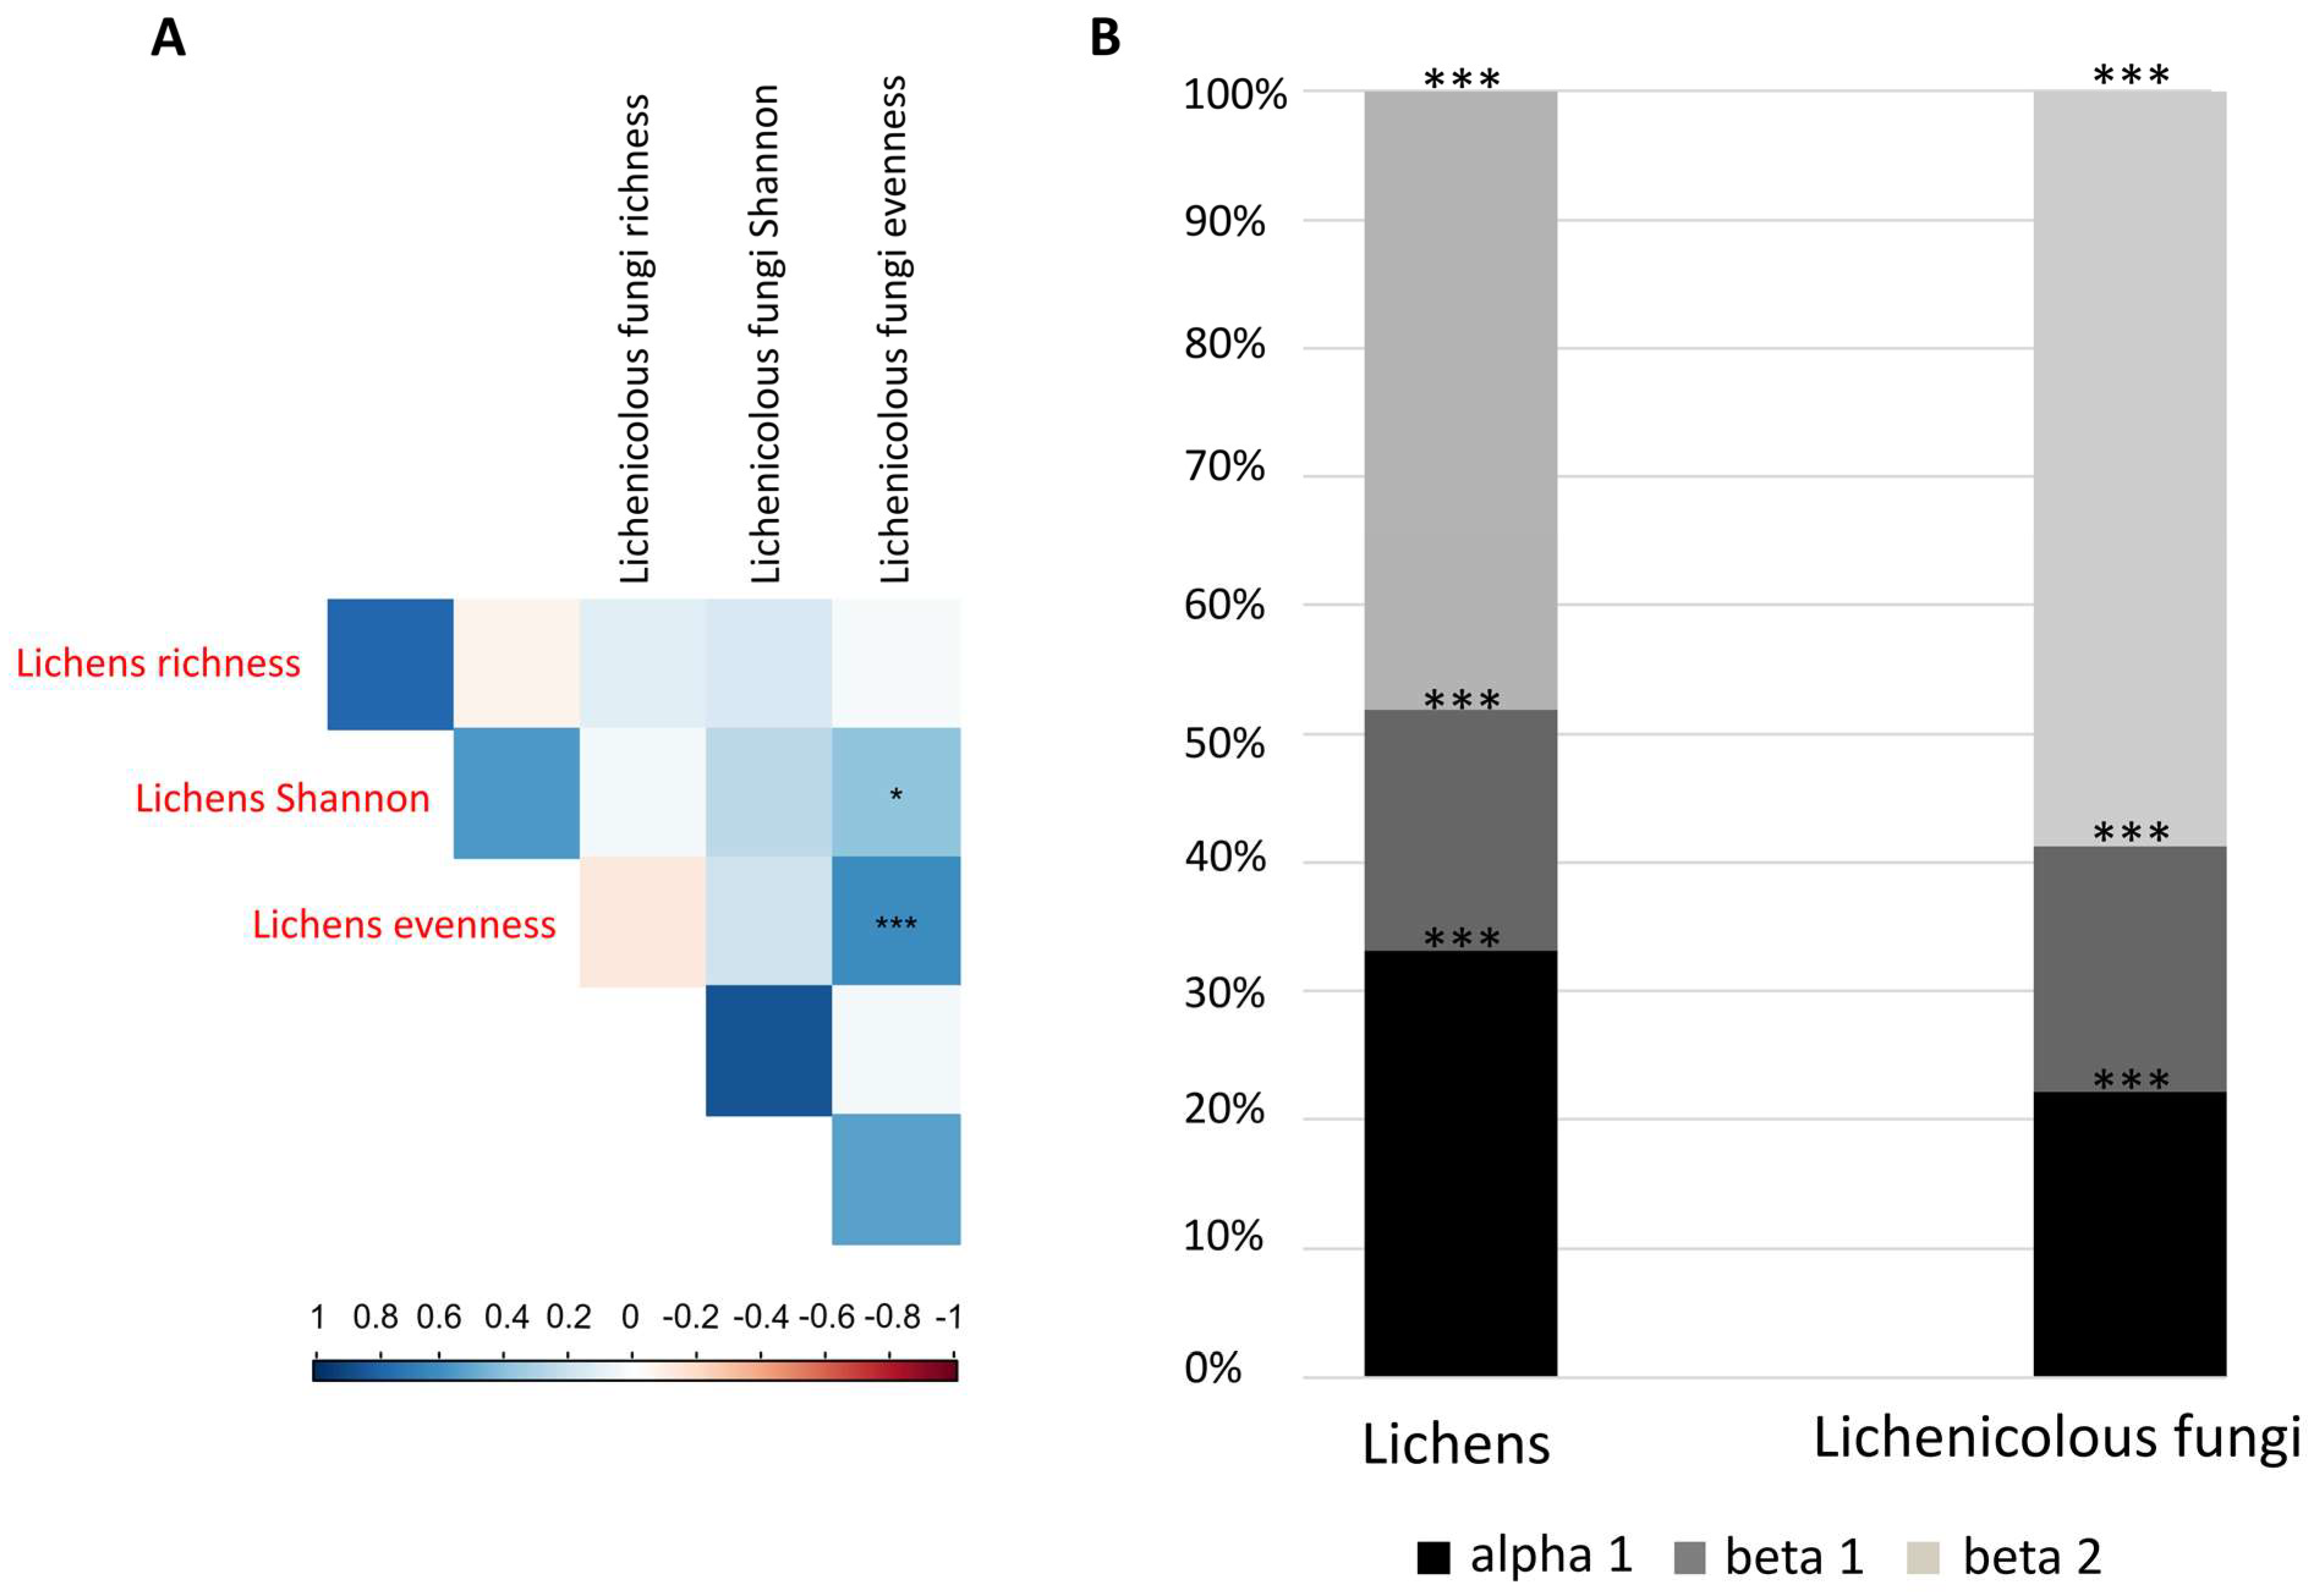
3.1. Diversity Patterns at Different Spatial Scales

The analyses of the rarefaction curves suggest that the SER curves are close to levelling off for both taxa, meaning that a fairly good representation of the diversity within the study area was reached (Figure 1).
The quantification of diversity was obtained using three diversity indices (species richness, Shannon, and Pielou indices; Figure 2). Biodiversity analysis revealed different patterns for both lichen and lichenicolous fungi among areas. Lichens showed the highest richness values in three plots (plots 1, 5, and 10) and the same pattern was recognized for lichen abundance; the evenness values instead were homogeneous across all plots (Figure 2A–C). The ANOVA test showed statistical differences in diversity index values among plots for the richness (p < 0.05 *) and Shannon (p < 0.01 **) indices but not for evenness. Lichenicolous fungi showed the highest richness and Shannon values in five plots (Figure 2); as for lichens, the ANOVA statistical analyses revealed significant diversity just for the richness (p < 0.05 *) and Shannon (p < 0.05 *) indices.
The analyses of β dispersion (the average dissimilarity from individual observation units to their group centroid in multivariate space), showed no significant differences in the dispersion of dissimilarity values neither for the presence/abundance analyses (F = 3.1832, p > 0.05) nor for abundance (F = 3.1832, p > 0.05).
The additive diversity partitioning analysis (Figure 3B) showed that the α1 level in lichens was higher than β1, and the same patterns were obtained in the analyses of the lichenicolous fungi; however, the β2 diversity component resulted in the highest for both lichens and lichenicolous fungi. All diversity components were statistically significant and thus, spatially structured.

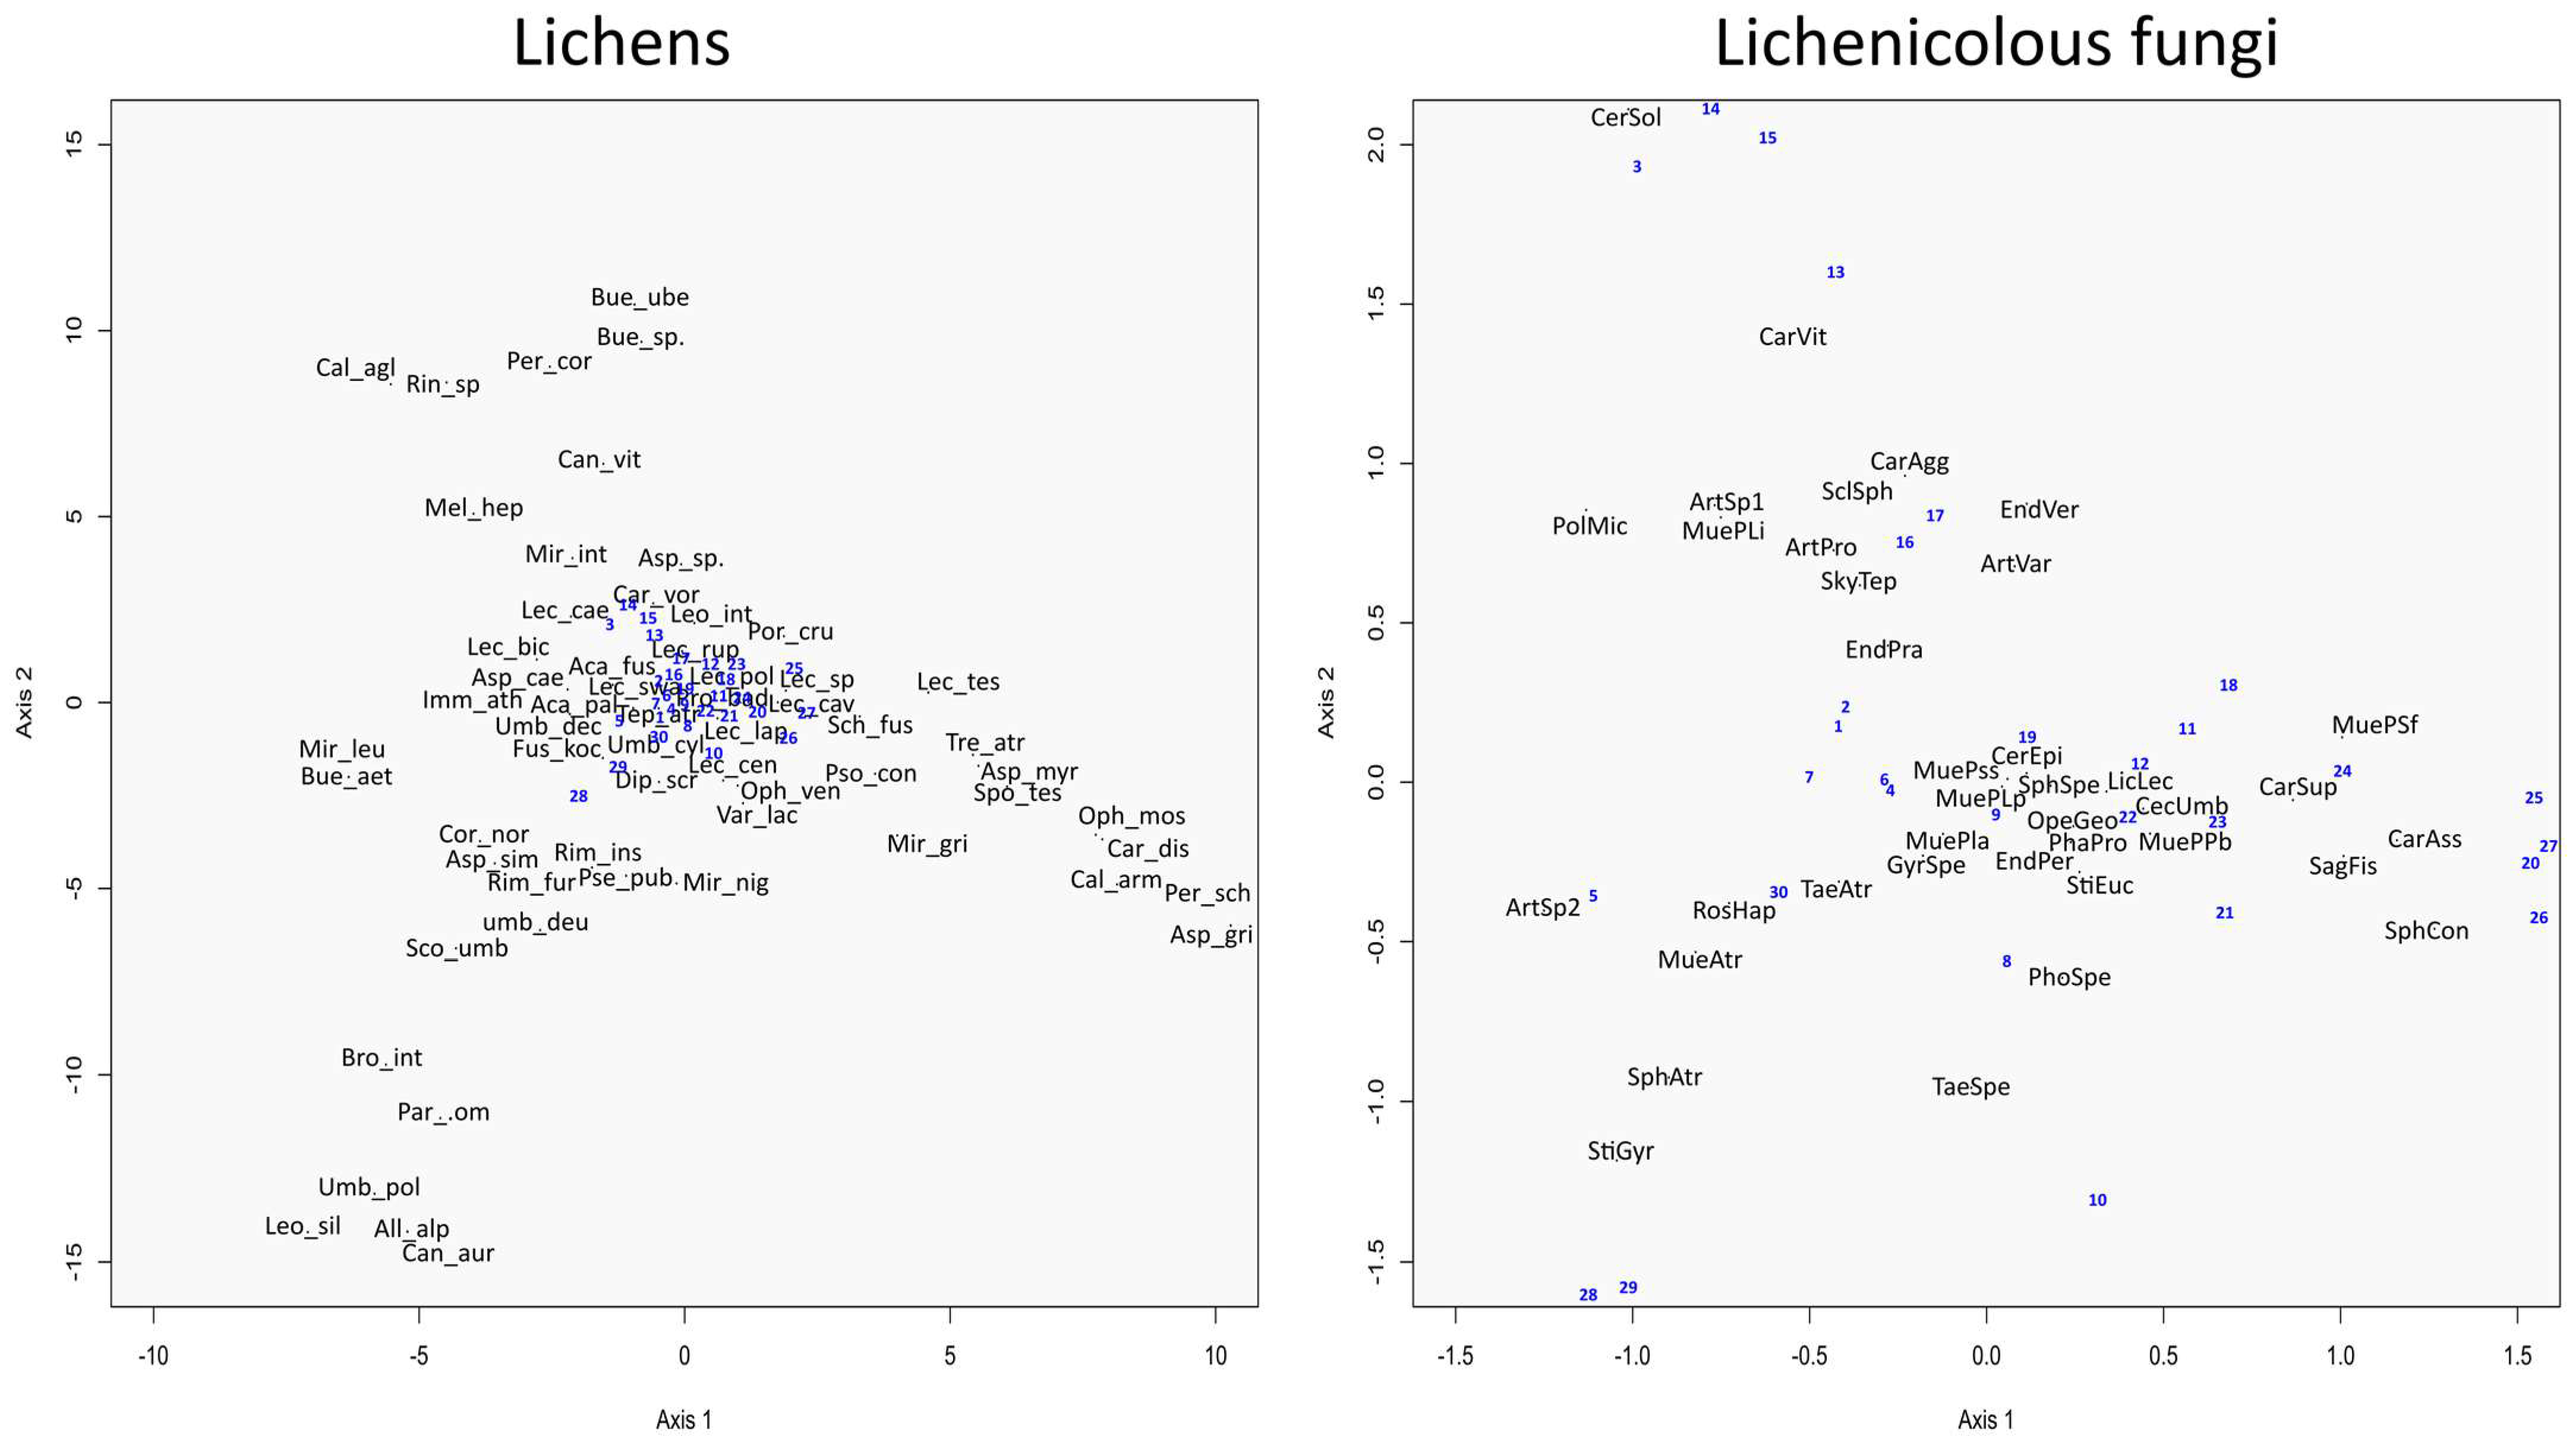
3.2. Congruence in Species Composition

Correlations between the two target communities, tested using Mantel tests, revealed a positive (and significant) correlation between lichens and lichenicolous fungi only when tested using the species abundance data (Table 2). The results concerning the Co-Ca performed with presence/absence data showed no increasing values above zero, and only the first axis was statistically significant. Regarding the Co-CA performed with the abundance data between lichens and lichenicolous fungi, only the first two axes showed increasing and above zero cross-validatory fit values, explaining a total variance of 13,06%; both axes were significant (Table 3). The first ordination axis explained 7.07% of the total variance.
The biplots derived using the Co-CA between lichen and lichenicolous occurrence data (Figure 4) showed that the main compositional patterns are distributed along the first axis, following an ecological gradient based on altitude. The second axis may reflect a functional gradient; indeed, foliose thalli—the minority in the dataset—are found only in the bottom-left of the second axis. The biplots allowed us to identify two clearly distinguishable associated groups of lichens and lichenicolous species. On the left side, we found lichens that were collected in plots at lower elevations, while on the right, we found lichens collected in those plots at higher elevations. In the middle of the biplots, we found lichens recovered in many plots, scattered in the sampling area, and thus were less affected by altitude. Lichenicolous fungi recovered on either lichen groups follow the same distribution as well (Figure 4). In most cases, the distribution of lichenicolous species fits with that of the lichen hosts. This gradient along the first axis is also maintained in the Co-CA performed on lichens–lichenicolous fungi presence/absence data.

4. Discussion

The observed co-variation of diversity patterns between lichens and their lichenicolous fungi confirmed the interconnection between them when environmental variables (see below) were considered. These results allowed us to test the potential of lichens as reliable predictors for lichenicolous fungal diversity.
The rarefaction curves described the sampling effort in the study area and indicated that most of the variation in species composition has been adequately collected for both taxonomic groups. Still, the species’ rarefaction curves only approached levelling off, indicating that a deeper sampling would have been needed to encompass the whole species diversity. Our results are different from those presented in Fleischhacker et al. [24] where the sampling effort was wide enough to collect most of the species variation for both lichens and lichenicolous fungi. This could be explained by the fact that here we analysed only the symptomatically infected thalli, thus including fewer samples for the same area than Fleischhacker et al. [24] did. The diversity indices provided a preliminary overview from which it emerged that lichen and lichenicolous fungal communities did not follow the same richness or abundance patterns; this result agrees with Fleishhacker et al. [24] who did not find any correlation between richness and abundance of the two taxa. However, considering evenness, the trends were similar with homogenous values in all plots for lichen and lichenicolous fungi. The evenness values for both taxa were in most of the cases above 0.8 and in some plots reached the value of 0.9, meaning that for both lichen and lichenicolous fungi, the abundances were equally distributed. However, in a few cases (plot 2 and plot 4), the evenness of communities seems to have lower values (0.6–0.7). This may reflect the presence in these spots of species that are more abundant than others. The presence of the most abundant species is in accordance with Fleishhacker et al. [24] who reported four most frequent species of lichens (Lecanora polytropa, Lecidea lapicida, Rhizocarpon geographicum, and Tephromela atra) and four species of lichenicolous fungi (Cercidospora epipolytropa, Endococcus macrosporus, Muellerella pygmaea, and Taeniolella atricerebrina). Furthermore, meaningful correlations were obtained for the lichen Shannon index and lichenicolous fungi evenness and between the evenness of the two groups. The distribution of lichenicolous fungi abundances is, therefore, influenced by the number of individuals of the most frequent host species rather than the richness of host species. The results of the diversity partitioning showed higher α diversity (diversity inside subplot) for both lichens and lichenicolous fungi than beta diversity (diversity within plots). This observation might be correlated with the conformation of the study area and of the individual plots, which may offer microniches for certain lichenicolous fungi and their lichen hosts. Indeed, the plots consist of big boulders, scattered in alpine grassland either more or less densely grouped together, that are exposed to slightly different wind and solar radiation. These boulders were the selected sub-plots where the major diversification of (micro)habitats would occur and offer some peculiar microniches.

Cross-Taxon Analysis

Considering the ecological importance of lichens and lichenicolous taxa as bioindicators, and given the difficulty of surveying them, the possibility of using a tool such as cross-taxon analysis represents a key step forward to study these communities and their diversity for the evaluation and conservation of endangered taxa. Although lichens have never been used as surrogate organisms, in this type of analysis, we found a positive correlation between lichens and lichenicolous fungal communities, which was confirmed by the significant p-value of the Mantel test. Even if the correlation coefficient r, which confirms an ecological group can be considered as a good surrogate, was in this case below the threshold of 0.7 [33], this does not affect the results. Indeed, as described by Harry et al. [54], it is impossible to reach a higher level of correlation than that obtained between two taxa in a natural system.
Previous studies [55,56] reported a correlation between the diversity of lichenicolous fungi and factors such as environmental conditions and/or the ecological preferences of the lichen hosts. Here, we improved the knowledge about this relationship showing that the diversity distribution of the lichenicolous fungi diversity seems to correlate with the distribution of their host’s diversity. The local scale, here considered, allowed us to reduce the impact of environmental variables and to focus the analyses on how the lichens distribution affects the lichenicolous distribution; however, the boulders scattered in alpine grasslands offer lichens many microniches and microhabitats to grow, and the environmental variables could affect the distributions of the two groups of taxa also at this scale. Moreover, although the altitudinal gradient is very shallow, it seems to influence the distribution of the lichens and lichenicolous fungi abundances together with host functional traits (thallus growth form). Our results well complement the conclusions traced previously by U’Ren et al. 2012 [55] and Oh et al. 2020 [56], who stated that lichen and lichenicolous fungi distributions are similarly affected by environments. However, as previously mentioned, the cross-taxon analysis revealed a significant co-variance between the abundance of the two studied taxa, meaning that lichen distribution affects lichenicolous fungi communities. The cross-taxon analysis revealed that lichens were good predictors for lichenicolous fungi, and their role as predictors was better explained when the most abundant lichen species and/or those species not affected by the environmental conditions were considered (i.e., Lecanora polytropa, Lecidea lapicida, Rhizocarpon geographicum, and Tephromela atra). We found that the distribution of lichen species which are specialized to narrow niches often did not cope with the distribution of the hosted lichenicolous fungi, except where the latter is host species-specific (i.e., Cercidospora solearispora parasitic on Aspicilia simoensis). This allows us to infer that, at the local scale, the interaction between lichen and lichenicolous fungal communities is strictly related to the specialization developed by lichenicolous fungi to their lichen hosts (specialist versus generalist) and to the abundance of lichen species.
In conclusion, lichens proved to be good predictors of lichenicolous fungal communities in the studied area. In general, as environmental variables can affect the distribution of lichens also at the local scale, particular attention is to be paid to the lichen species that best predict the distribution of lichenicolous fungi (which are the species less affected by environmental variables). Alpine lichen communities are relatively homogeneous in their species diversity according to the substrate on which they develop (undisturbed) especially when composed of mainly crustose lichens, whose thalli are individually well distinguishable. Such a study could be extended to other similar alpine (and not) lichen communities in areas presenting the same characteristics of the Koralpe Massive here considered. Multiple cross-taxon analyses conducted on similar communities of lichens and lichenicolous fungi would help clarify our understanding of their co-variance in relation to geographic parameters and functional scale (as also found in other taxa used in cross-taxon [31,57]), further increasing the robustness of the analysis.
In conclusion, this study presents a first and confident perspective of the application and suitability of the cross-taxon approach as a new tool to analyse lichen communities. Given the ecological importance and vulnerability of lichen communities in general, using lichens as predictor taxa for lichenicolous fungi will help to perform more reliable estimations and assessments of species diversity in the future.

Supplementary Materials

The following are available online at https://www.mdpi.com/article/10.3390/d15020285/s1, Table S1: Species of lichenicolous fungi, their lichen hosts, and numbers identifying plots and subplots in which the samples were collected and R script.

Author Contributions

L.M. and G.B. designed the study. L.M. performed the sampling. R.D.C. and G.B. performed the ecological analyses. L.M., G.B. and R.D.C. wrote the manuscript. All authors have read and agreed to the published version of the manuscript.

Funding

Funding for this study was provided by the Italian Ministry of University and Research (MIUR, Ministero dell’Università e della Ricerca) project PRIN2017 (project code 20177559A5) assigned to LM.

Institutional Review Board Statement

Not applicable.

Informed Consent Statement

Not applicable.

Data Availability Statement

The Rstudio script and the datasets used and/or analysed during the current study are available as supplementary materials. For any other information, contact the corresponding authors.

Acknowledgments

Josef Hafellner and Martin Grube are thanked for constructive discussion at the time of sampling.

Conflicts of Interest

The authors declare no conflict of interest.

References

  1. Margulis, L. Origin of Eukaryotic Cells; Yale University Press: New Haven, CT, USA, 1970. [Google Scholar]
  2. Gilbert, S.F.; Sapp, J.; Tauber, A.I. A symbiotic view of life: We have never been individuals. Q. Rev. Biol. 2012, 7, 325–341. [Google Scholar] [CrossRef] [PubMed] [Green Version]
  3. Grube, M.; Cardinale, M.; de Castro, J.V.; Müller, H.; Berg, G. Species-specific structural and functional diversity of bacterial communities in lichen symbioses. ISME J. 2009, 3, 1105–1115. [Google Scholar] [CrossRef] [PubMed] [Green Version]
  4. Hawksworth, D.L.; Hill, D.J.; Phil, D. The Lichen-Forming Fungi, 1st ed.; Springer: New York, NY, USA, 1984. [Google Scholar]
  5. Honegger, R. The lichen symbiosis—What is so spectacular about it? Lichenologist 1998, 30, 193–212. [Google Scholar] [CrossRef] [Green Version]
  6. Hawksworth, D.L.; Grube, M. Lichens redefined as complex ecosystems. New Phytol. 2020, 227, 1281. [Google Scholar] [CrossRef]
  7. Denton, G.H.; Karlén, W. Lichenometry: Its application to Holocene moraine studies in southern Alaska and Swedish Lapland. Arctic Alpine Res. 1973, 5, 347–372. [Google Scholar] [CrossRef]
  8. Lawrey, J.D.; Diederich, P. Lichenicolous fungi: Interactions, evolution, and biodiversity. Bryologist 2003, 106, 80–120. [Google Scholar] [CrossRef]
  9. Muggia, L.; Grube, M. Fungal diversity in lichens: From extremotolerance to interactions with algae. Life 2018, 8, 15. [Google Scholar] [CrossRef] [Green Version]
  10. Spribille, T.; Resl, P.; Stanton, D.E. and Tagirdzhanova, G. Evolutionary biology of lichen symbioses. New Phytol. 2022, 234, 1566–1582. [Google Scholar] [CrossRef]
  11. Fernández-Mendoza, F.; Fleischhacker, A.; Kopun, T.; Grube, M.; Muggia, L. ITS 1 metabarcoding highlights low specificity of lichen mycobiomes at a local scale. Mol. Ecol. 2017, 26, 4811–4830. [Google Scholar] [CrossRef]
  12. Banchi, E.; Stankovic, D.; Fernández-Mendoza, F.; Gionechetti, F.; Pallavicini, A.; Muggia, L. ITS2 metabarcoding analysis complements lichen mycobiome diversity data. Mycol. Prog. 2018, 17, 1049–1066. [Google Scholar] [CrossRef] [Green Version]
  13. Diederich, P.; Lawrey, J.D.; Ertz, D. The 2018 classification and checklist of lichenicolous fungi, with 2000 non-lichenized, obligately lichenicolous taxa. Bryologist 2018, 121, 340–425. [Google Scholar] [CrossRef]
  14. Harutyunyan, S.; Muggia, L.; Grube, M. Black fungi in lichens from seasonally arid habitats. Stud. Mycol. 2008, 61, 83–90. [Google Scholar] [CrossRef]
  15. Arnold, A.E.; Miadlikowska, J.; Higgins, K.L.; Sarvate, S.D.; Gugger, P.; Way, A.; Hofstetter, V.; Kauff, F.; Lutzoni, F. A phylogenetic estimation of trophic transition networks for ascomycetous fungi: Are lichens cradles of symbiotrophic fungal diversification? Syst. Biol. 2009, 58, 283–297. [Google Scholar] [CrossRef] [PubMed] [Green Version]
  16. Muggia, L.; Fleischhacker, A.; Kopun, T.; Grube, M. Extremotolerant fungi from alpine rock lichens and their phylogenetic relationships. Fun. Div. 2016, 76, 119–142. [Google Scholar] [CrossRef] [PubMed] [Green Version]
  17. Hafellner, J. Focus on lichenicolous fungi: Diversity and taxonomy under the principle “one fungus–one name”. Biosyst. Ecol. Ser 2018, 34, 227–243. [Google Scholar]
  18. Kumar, V.; Joseph, S.; Sharma, Y.P.; Nayaka, S. An annotated catalogue of the lichenicolous fungi of Jammu and Kashmir and Ladakh, India with new records and identification key. J. Asia-Pac. Biodiv. 2022, 15, 527–540. [Google Scholar] [CrossRef]
  19. Varga, N.; Lőkös, L.; Farkas, E. Annotated checklist of the lichenicolous fungi of Hungary. Diversity 2021, 13, 557. [Google Scholar] [CrossRef]
  20. Zhurbenko, M.P. Lichenicolous fungi from the Holarctic. Part IV: New reports and a key to species on Dermatocarpon. Opusc. Philolichenum 2021, 20, 44–53. [Google Scholar]
  21. Roux, C. Catalogue des lichens et champignons lichénicoles de France métropolitaine, 2nd ed.; Association française de lichénologie (A. F. L.): Fontainebleau, France, 2017; 1581p. [Google Scholar]
  22. Spribille, T.; Pérez-Ortega, S.; Tønsberg, T.; Schirokauer, D. Lichens and lichenicolous fungi of the Klondike Gold Rush National Historic Park, Alaska, in a global biodiversity context. Bryologist 2010, 113, 439–515. [Google Scholar] [CrossRef]
  23. Hafellner, J.; Herzog, G.; Mayrhofer, H. Zur Diversität von lichenisierten und lichenicolen Pilzen in den Ennstaler Alpen (Österreigh: Steiermark, Oberösterreich). Mitt. Naturwiss. Ver. Steiermark 2008, 137, 131–204. [Google Scholar]
  24. Fleischhacker, A.; Grube, M.; Kopun, T.; Hafellner, J.; Muggia, L. Community analyses uncover high diversity of lichenicolous fungi in alpine habitats. Microb. Ecol. 2015, 70, 348–360. [Google Scholar] [CrossRef]
  25. Toranza, C.; Arim, M. Cross-taxon congruence and environmental conditions. BMC Ecol. 2010, 10, 18. [Google Scholar] [CrossRef] [Green Version]
  26. Fattorini, S.; Dennis, R.L.; Cook, L.M. Use of cross-taxon congruence for hotspot identification at a regional scale. PLoS ONE 2012, 7, e40018. [Google Scholar] [CrossRef] [Green Version]
  27. Zara, L.; Tordoni, E.; Castro-Delgado, S.; Colla, A.; Maccherini, S.; Marignani, M.; Panepinto, F.; Trittoni, M.; Bacaro, G. Cross-taxon relationships in Mediterranean urban ecosystem: A case study from the city of Trieste. Ecol. Indic. 2021, 125, 107538. [Google Scholar] [CrossRef]
  28. Uboni, C.; Tordoni, E.; Brandmayr, P.; Battistella, S.; Bragato, G.; Castello, M.; Colombetta, G.; Poldini, L.; Bacaro, G. Exploring cross-taxon congruence between carabid beetles (Coleoptera: Carabidae) and vascular plants in sites invaded by Ailanthus altissima versus non-invaded sites: The explicative power of biotic and abiotic factors. Ecol. Indic. 2019, 103, 145–155. [Google Scholar] [CrossRef]
  29. Corcos, D.; Lami, F.; Nardi, D.; Boscutti, F.; Sigura, M.; Giannone, F.; Pantini, P.; Tagliapietra, A.; Busato, F.; Sibella, R.; et al. Cross-taxon congruence between predatory arthropods and plants across Mediterranean agricultural landscapes. Ecol. Indic. 2021, 123, 107366. [Google Scholar] [CrossRef]
  30. Prendergast, J.R.; Wood, S.N.; Lawton, J.H.; Eversham, B.C. Correcting for variation in recording effort in analyses of diversity hotspots. Biodiv. Lett. 1993, 1, 39–53. [Google Scholar] [CrossRef]
  31. Howard, P.C.; Viskanic, P.; Davenport, T.R.; Kigenyi, F.W.; Baltzer, M.; Dickinson, C.J.; Lwanga, J.S.; Matthews, R.A.; Balmford, A. Complementarity and the use of indicator groups for reserve selection in Uganda. Nature 1998, 394, 472–475. [Google Scholar] [CrossRef]
  32. Rodrigues, A.S.; Brooks, T.M. Shortcuts for biodiversity conservation planning: The effectiveness of surrogates. Ann. Rev. Ecol. Evol. Syst. 2007, 38, 713–737. [Google Scholar] [CrossRef]
  33. Heino, J. Are indicator groups and cross-taxon congruence useful for predicting biodiversity in aquatic ecosystems? Ecol. Indic. 2010, 10, 112–117. [Google Scholar] [CrossRef]
  34. Bacaro, G.; Tordoni, E.; Martellos, S.; Maccherini, S.; Marignani, M.; Muggia, L.; Petruzzellis, F.; Napolitano, R.; Da Re, D.; Guidi, T.; et al. Cross taxon congruence between lichens and vascular plants in a riparian ecosystem. Diversity 2019, 11, 133. [Google Scholar] [CrossRef] [Green Version]
  35. Santi, E.; Bacaro, G.; Rocchini, D.; Chiarucci, A.; Bonini, I.; Brunialti, G.; Muggia, L.; Maccherini, S. Methodological issues in exploring cross-taxon congruence across vascular plants, bryophytes and lichens. Folia Geobot. 2016, 51, 297–304. [Google Scholar] [CrossRef]
  36. Chiarucci, A.; Bacaro, G.; Rocchini, D.; Ricotta, C.; Palmer, M.W.; Scheiner, S.M. Spatially constrained rarefaction: Incorporating the autocorrelated structure of biological communities into sample-based rarefaction. Comm. Ecol. 2009, 10, 209–214. [Google Scholar] [CrossRef]
  37. Bacaro, G.; Altobelli, A.; Cameletti, M.; Ciccarelli, D.; Martellos, S.; Palmer, M.W.; Ricotta, C.; Rocchini, D.; Scheiner, S.M.; Tordoni, E.; et al. Incorporating spatial autocorrelation in rarefaction methods: Implications for ecologists and conservation biologists. Ecol. Indic. 2016, 69, 233–238. [Google Scholar] [CrossRef] [Green Version]
  38. Thouverai, E.; Pavoine, S.; Tordoni, E.; Rocchini, D.; Ricotta, C.; Chiarucci, A.; Bacaro, G. Rarefy: Rarefaction Methods, R Package Version 1.1. 2021. Available online: https://CRAN.R-project.org/package=Rarefy (accessed on 1 April 2022).
  39. Wei, T.; Simko, V. R Package ‘Corrplot’: Visualization of a Correlation Matrix, Version 0.92. 2021. Available online: https://github.com/taiyun/corrplot (accessed on 1 April 2022).
  40. Veech, J.A.; Summerville, K.S.; Crist, T.O.; Gering, J.C. The additive partitioning of species diversity: Recent revival of an old idea. Oikos 2002, 99, 3–9. [Google Scholar] [CrossRef] [Green Version]
  41. Whittaker, R.H. New Concepts of Kingdoms of Organisms: Evolutionary relations are better represented by new classifications than by the traditional two kingdoms. Science 1969, 163, 150–160. [Google Scholar] [CrossRef] [Green Version]
  42. Lande, R. Statistics and partitioning of species diversity, and similarity among multiple communities. Oikos 1996, 1, 5–13. [Google Scholar] [CrossRef]
  43. Oksanen, J.; Blanchet, F.G.; Kindt, R.; Legendre, P.; Minchin, P.R.; O’hara, R.B.; Simpson, G.L.; Solymos, P.; Stevens, M.H.; Wagner, H.; et al. Package ‘Vegan’. Community Ecology Package, Version. 2013. Available online: https://www.researchgate.net/publication/313502495_Vegan_Community_Ecology_Package/link/5c285a96458515a4c700bac2/download (accessed on 1 April 2022).
  44. Legendre, P.; Legendre, L. Numerical Ecology, 3rd ed.; Elsevier: Amsterdam, The Netherlands, 2012. [Google Scholar]
  45. Lários, M.C.; da Cunha, C.N.; Penha, J.; Landeiro, V.L.; Pinho, J.B.; Aragona, M.; Valerio, L.M.; Strüssmann, C.; Marques, M.I.; Lourenço, L.S.; et al. Evidence of cross-taxon congruence in Neotropical wetlands: Importance of environmental and spatial factors. Global Ecol. Cons. 2017, 12, 108–118. [Google Scholar] [CrossRef]
  46. Legendre, P.; Legendre, L. Numerical Ecology, 2nd ed.; Elsevier Science: Amsterdam, The Netherlands, 1998; 852p. [Google Scholar]
  47. ter Braak, C.J.F.; Schaffers, A.P. Co-correspondence analysis: A new ordination method to relate two community compositions. Ecology 2004, 85, 834–846. [Google Scholar] [CrossRef] [Green Version]
  48. Schaffers, A.P.; Raemakers, I.P.; Sýkora, K.V.; ter Braak, C.J.F. Arthropod assemblages are best predicted by plant species composition. Ecology 2008, 89, 782–794. [Google Scholar] [CrossRef]
  49. Martens, H.; Naes, T. Multivariate Calibration; Wiley: Chicester, UK, 1992. [Google Scholar]
  50. Bacaro, G.; Gioria, M.; Ricotta, C. Beta diversity reconsidered. Ecol. Res. 2012, 28, 537–540. [Google Scholar] [CrossRef]
  51. Anderson, M.J. Distance-Based Tests for Homogeneity of Multivariate Dispersions. Biometrics 2006, 62, 245–253. [Google Scholar] [CrossRef]
  52. Simpson, G.L. Co-Correspondence Analysis Ordination Methods, R PackageVersion 0.4-3. 2009. Available online: https://cran.r-project.org/package=cocorresp (accessed on 1 April 2022).
  53. R Core Team. R: A Language and Environment for Statistical Computing; R Foundation for Statistical Computing: Vienna, Austria, 2021. [Google Scholar]
  54. Harry, I.; Höfer, H.; Schielzeth, H.; Assmann, T. Protected habitats of Natura 2000 do not coincide with important diversity hotspots of arthropods in mountain grasslands. Insect Conserv. Div. 2019, 12, 329–338. [Google Scholar] [CrossRef]
  55. U’Ren, J.M.; Lutzoni, F.; Miadlikowska, J.; Laetsch, A.D.; Arnold, A.E. Host and geographic structure of endophytic and endolichenic fungi at a continental scale. Am. J. Bot. 2012, 99, 898–914. [Google Scholar] [CrossRef] [Green Version]
  56. Oh, S.-Y.; Yang, J.H.; Woo, J.-J.; Oh, S.-O.; Hur, J.-S. Diversity and distribution patterns of endolichenic fungi in Jeju Island, South Korea. Sustainability 2020, 12, 3769. [Google Scholar] [CrossRef]
  57. Jackson, D.A.; Harvey, H.H. Fish and benthic invertebrates: Community concordance and community–environment relationships. Can. J. Fish. Aquat. Scie. 1993, 50, 2641–2651. [Google Scholar] [CrossRef]
Figure 1. Rarefaction curves: classic (grey line) and spatially explicit rarefaction (SER) curves for the two species groups of lichens (red dotted line) and lichenicolous fungi (green dotted line).
Diversity 15 00285 g001
Figure 2. Diversity indices for lichen and lichenicolous fungal communities. In the charts, the boxplot of lichens (violet) and lichenicolous fungi (pink) indices are shown: (A) richness values, (B) Shannon index, and (C) evenness values t. The boxplots represent the first quartile, the median (in bold), and the third quartile. The F statistic and p-value of the ANOVA test are reported on top of each chart.
Diversity 15 00285 g002
Figure 3. (A) Correlation indices matrix: significant correlations are marked with black asterisks (*** = p-value < 0.001, * = p-value < 0.05); squares colours correspond to cor.mtest correlation coefficient values; colours are related to the test score. (B) Additive diversity partitioning among taxa at three hierarchical spatial levels: sampling site level (subplot, in black), sampling area level (plot, in dark grey), and study area level (light grey). Both α1 and β1 indicate α and β at a sampling site, respectively; β2 denotes β at the area level. *** = p-value < 0.001, * = p-value < 0.05.
Diversity 15 00285 g003
Figure 4. Predictive Co-CA plots of lichen (left) and lichenicolous fungi (right) species composition performed using abundance data. In the plots, species names (in black) are abbreviated up to six letters; numbers (in blue) refer to the sampling subplots.
Diversity 15 00285 g004
Table 1. Metadata of the collecting sites: plot number, geographic location (state, region), coordinates, and altitude (in meters above sea level).
PlotStateRegionMountainCoordinatesAltitude
1AustriaStyriaKoralpe46°50′20″ N/15°02′35″ Eca. 1760 m
2AustriaStyriaKoralpe46°50′38″ N/15°01′10″ Eca. 1800 m
3AustriaStyriaKoralpe46°49′22″ N/14°59′29″ Eca. 1910 m
4AustriaStyriaKoralpe46°48′23″ N/14°58′57″ Eca. 1980 m
5AustriaStyriaKoralpe46°48′23″ N/15°00′33″ Eca. 1790 m
6AustriaStyriaKoralpe46°46′50″ N/15°01′35″ Eca. 1800 m
7AustriaStyriaKoralpe46°46′47″ N/14°58′13″ Eca. 2070 m
8AustriaStyriaKoralpe46°46′29″ N/15°00′52″ Eca. 1760 m
9AustriaCarinthiaKoralpe46°47′39″ N/14°57′42″ Eca. 2000 m
10AustriaCarinthiaKoralpe46°48′54″ N/14°58′14″ Eca. 1860 m
Table 2. Pearson correlation coefficient (r) and its statistical significance among the taxa (** = p-value < 0.01, * = p-value < 0.05).
GroupsDatarp-Value
lichens vs. lichenicolous fungiSpecies richness (abundance)0.00680.486
Species richness (p/a)0.01300.376
lichens vs. lichenicolous fungiSpecies composition (abundance)0.25430.006 **
Species composition (p/a)0.19060.012 *
Table 3. Cross-validatory fit and cumulative explained variance of the predictive Co-CA axes for lichenicolous fungi (lichens are used as a predictor variable) reported both for presence/absence and abundance data. Significant p-values resulting from permutation tests are marked in bold.
DataTaxaAxesCross-Validation Fit (%)Cumulative Expl. Variance (%)p-Value
AbundanceLichenicolous fungi18.267.070.009
27.9113.060.002
P/ALichenicolous fungi1
2
7.91
6.63
7.27
14.50
0.002
0.085
Disclaimer/Publisher’s Note: The statements, opinions and data contained in all publications are solely those of the individual author(s) and contributor(s) and not of MDPI and/or the editor(s). MDPI and/or the editor(s) disclaim responsibility for any injury to people or property resulting from any ideas, methods, instructions or products referred to in the content.

