Article

Native Population Structure beyond Hatchery Introgression in the Endemic Sicilian Trout

1
Genetic Ichthyology Laboratory, Department of Biology, Faculty of Sciences, University of Girona, 17003 Girona, Spain
2
Independent Researcher, Via Saragat, 97100 Ragusa, Italy
3
Independent Researcher, Via Giordano Bruno 8, 97100 Ragusa, Italy
*
Author to whom correspondence should be addressed.
Diversity 2023, 15(2), 274; https://doi.org/10.3390/d15020274
Submission received: 23 December 2022 / Revised: 3 February 2023 / Accepted: 10 February 2023 / Published: 14 February 2023

Abstract

:
Brown trout populations living in the limit of the distribution of the species face challenging environmental conditions. In islands, this vulnerable situation is exacerbated by geographical isolation. Sicilian trout persist only in the south-eastern part of the island and, based on their morphological characteristics, they have been recognized as a distinct species named Salmo cettii. We present the most extensive genetic study on Sicilian trout, based on 213 individuals from nine different streams in four basins. Sequencing of the mitochondrial control region and genotyping of the LDH-C* locus and eight microsatellite markers were carried out to evaluate hatchery introgression from past stocking practices in natural populations and to estimate the gene diversity distribution in populations. Results showed that only trout from the Tellesimo River remained free of hatchery introgression. Gene diversity was low in this native population, but increased in the rest of the samples, probably because of the introduction of hatchery genes. Despite the high level of introgression, the distribution of gene diversity depicted a clear natural pattern of population structure related to the hydrographic hierarchy. Because they represent long evolutionary histories, Sicilian trout populations should be considered of high conservation priority and managed according to at least four different genetic units.

1. Introduction

Trout populations living in Mediterranean peninsulas and surrounding islands belong to old evolutionary lineages that persisted during Quaternary glaciations. Apart from the inestimable interest that they represent to elucidate the evolutionary history of this species, their genetic diversity contributes to enriching the Mediterranean basin’s biodiversity. Nevertheless, many of these populations inhabit marginal areas along the southern limit of the distribution of the species, where they face difficult environmental conditions (drought, high temperatures and sudden shifts in water flow) that could become worse due to anthropogenic activities and climate change [1,2]. In islands, this vulnerable situation is exacerbated by geographical isolation.
In Sicily, autochthonous brown trout populations inhabit only the eastern part of the island, probably due to the differences in topography and hydrology between the western and the eastern areas. Although, historically, the species was distributed both in the north and in the south, currently, Sicilian brown trout are confined to the southeast, in a few rivers of the Hyblean Plateau, in the Ragusa and Siracusa provinces [3]. Based on their morphological characteristics, these populations have been recognized as a distinct species named Salmo cettii Rafinesque 1810 [4,5,6]. Despite previous genetic (mitochondrial and nuclear) data that clearly related Sicilian brown trout with Atlantic brown trout from Morocco and the Iberian Peninsula [7,8,9,10,11], recently, Hashemzadeh et al. [12], combining SNPs genotyping and mitochondrial DNA sequences, supported the recognition of S. cettii as a distinct species. In any case, molecular analyses indicate high genetic singularity for Sicilian trout, as they are the unique Italian trout populations naturally derived from a South Atlantic lineage [7,8,13,14].
Salmo cettii is considered near-threatened in the IUCN Red List [15], and reported as critically endangered in Freyhof et al. [16] and the Italian Vertebrate Red List [17]. Apart from water abstraction, poaching, overfishing or pollution, one of the main threats to Sicilian populations is stocking with non-native brown trout [5,6,14]. As has occurred in other Mediterranean regions, stocking with hatchery-reared brown trout of Northern European origin has been a common practice to counteract the effects of overfishing in Sicilian rivers [8,18,19], which has inevitably lead to genetic consequences [7,8]. In the Ragusa province, the most studied area, stocking with hatchery brown trout of Northern European origin stopped at the end of the 1980s, when the artificial breeding of local trout was started at a local hatchery [19,20]. Bobbio et al. [21] were the first to describe the genetic distinction between Sicilian and other trout of Atlantic origin. Ten years later, Schöffmann et al. [7] showed the native Atlantic origin of Sicilian trout and found that native Sicilian populations harbor the *100 allele fixed at the lactate dehydrogenase locus (LDH-C*), as with other brown trout populations from the Mediterranean basin. These authors found the presence of the exogenous LDH-C1*90 allele in a single heterozygous individual in the Anapo and Irminio Rivers and detected mitochondrial DNA haplotypes of Northern European origin in Cassibile, confirming the stocking practices reported by Duchi [18]. Posteriorly, hatchery introgression related to high morphological variability was also indicated by Fruciano et al. [8] in brown trout from the Cassibile and Anapo Rivers.
None of the previous genetic studies assessed genetic diversity and its distribution in Sicilian trout populations. Only the recent study by Berrebi et al. [13] included two Sicilian trout populations (Anapo and Cassibile) to evaluate genetic diversity in brown trout around the Tyrrhenian Sea using microsatellite genotyping. Their results failed to detect hatchery introgression beyond a single heterozygous specimen in Anapo, and described high genetic diversity within Sicilian populations and high genetic differentiation between Anapo and Cassibile trout.
Our work represents the most comprehensive genetic study including most of the distribution of brown trout in Sicily. Based on the genetic analyses of 213 trout specimens in four river basins of the Ragusa and Siracusa provinces (Sicily), the main aims were (i) to evaluate whether past stocking practices have led to introgression in natural populations and whether there is any native population remaining, (ii) to estimate gene diversity and (iii) to elucidate the possible pattern of the population structure and its determining factors.

2. Methods

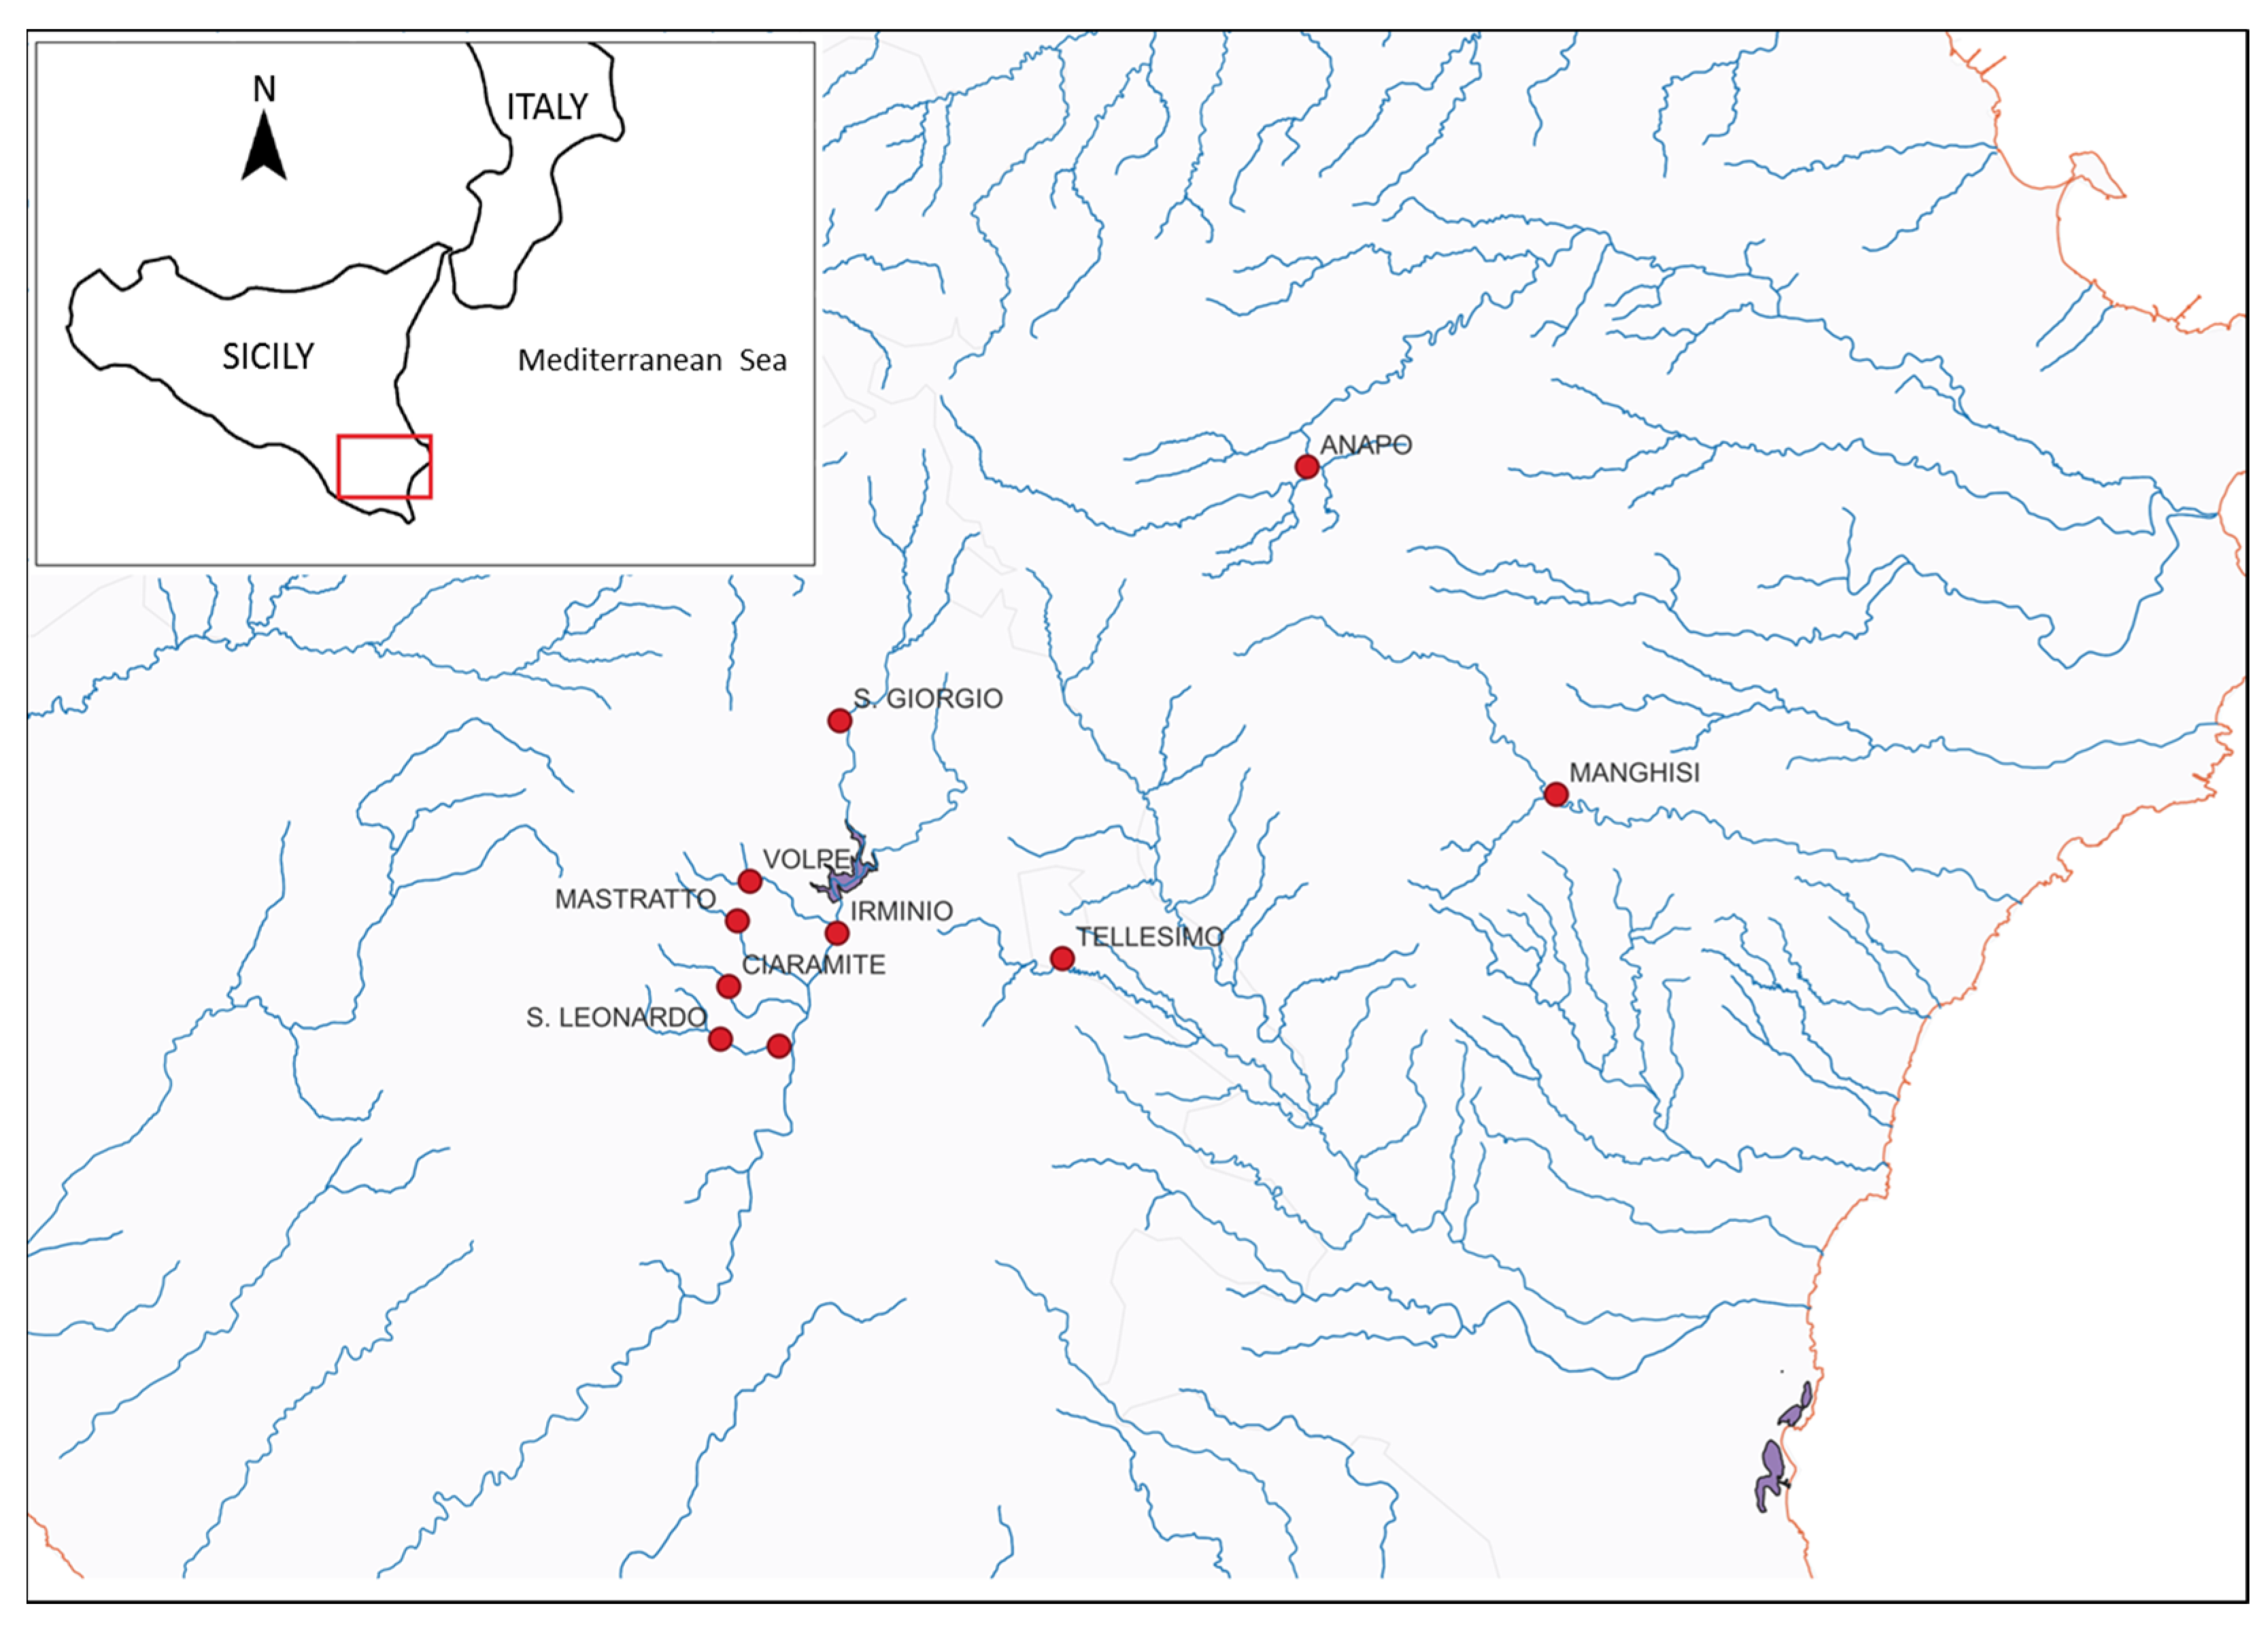
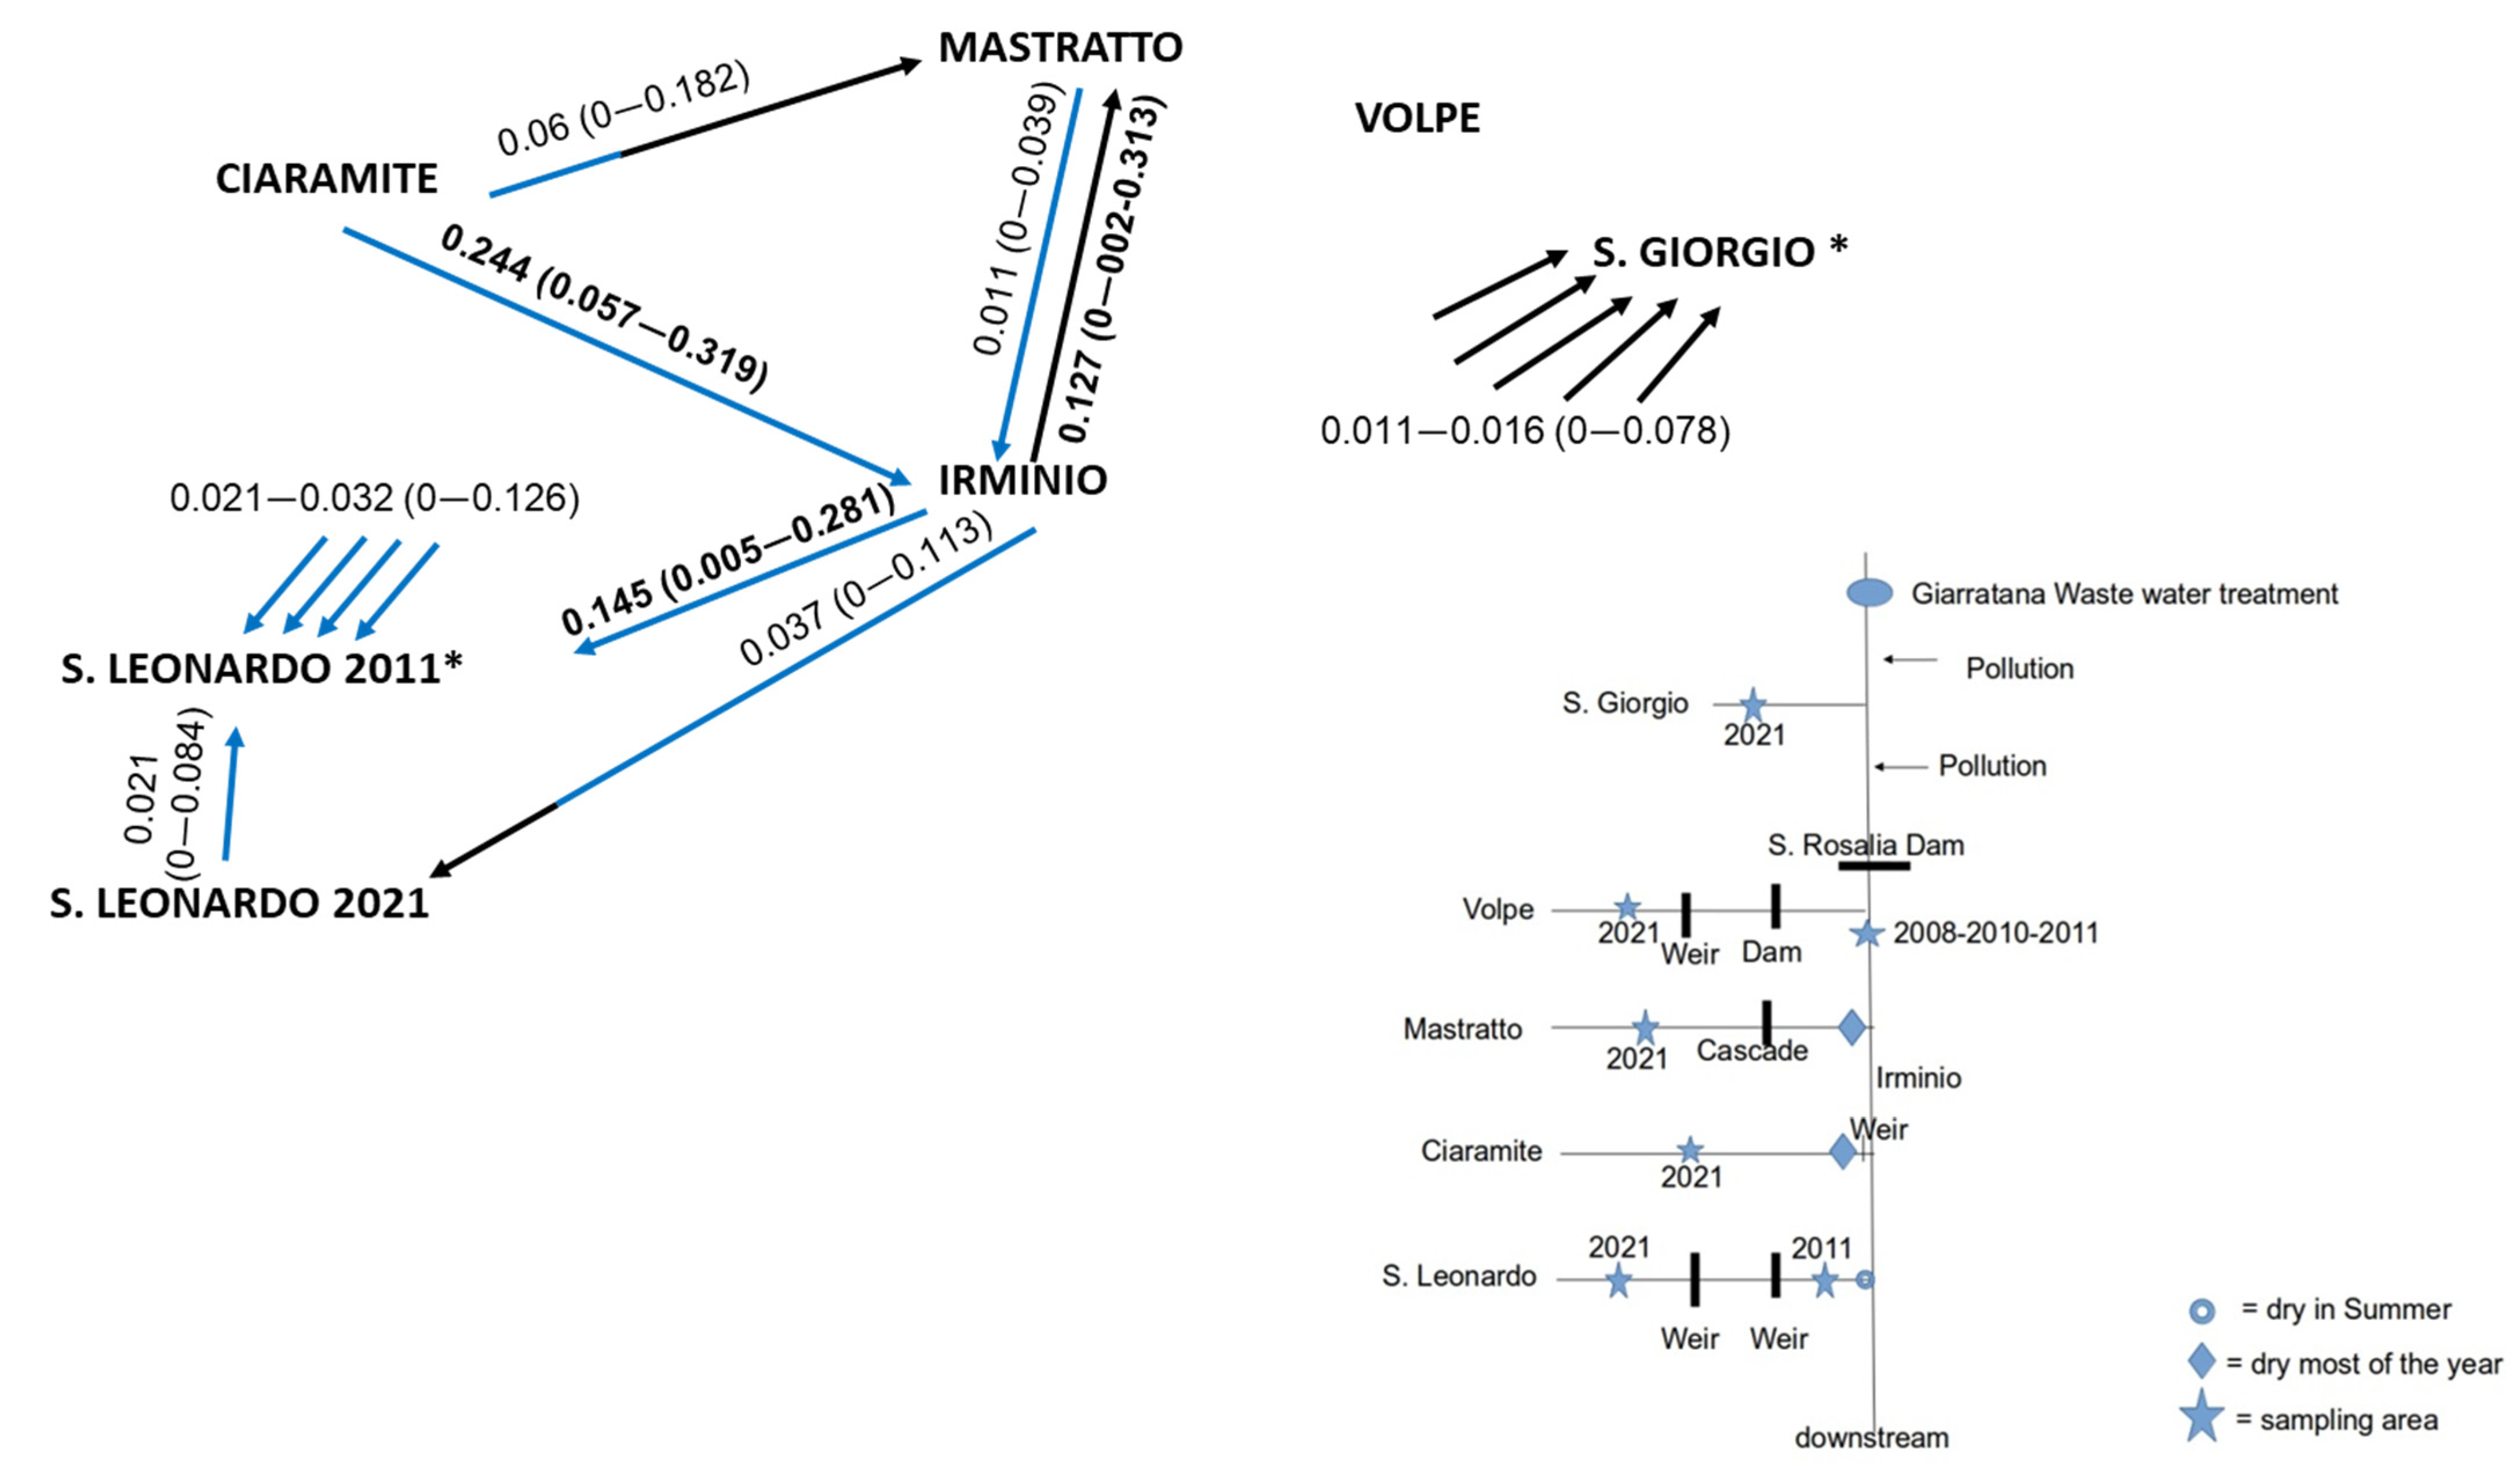
2.1. Studied Area and Sampling

Trout were sampled in nine streams from four river basins: Irminio (the main river and its tributaries, San Giorgio, Volpe, Mastratto, Ciaramite and S. Leonardo), Tellaro (its main tributary Tellesimo), Manghisi (upstream course of Cassibile) and Anapo (Figure 1). Fishing is allowed everywhere except in Tellesimo and in a stretch of the main Irminio River approximately 2 km downstream of the S. Rosalia Dam. Fishing is allowed in Cassibile and Anapo, but there are two natural reserves where angling is forbidden, downstream of these two sampling sites. Most sampling sites from Irminio tributaries were separated from the main river by dams, weirs or natural waterfalls. All Sicilian trout are resident, which implies that migration through the sea is impossible. The entirety of Irminio (main river and tributaries) has been stocked with fry produced in the hatchery using local Irminio breeders. This activity was started in 1992–1993, but the stocking activity with local fry was not continuous (e.g., from 1994 to 1999, no artificial breeding was produced). The last stocking activity with local breeds was in the winter of 2011–2012.
Most locations were sampled in 2021, but Tellesimo, San Leonardo and the Irminio Main River were sampled in 2008–2011. Fish were captured mainly by electrofishing, and baited hoop nets were also used in some rivers. After being anaesthetized with tricaine methanesulphonate, specimens were measured to the nearest mm and a piece of the caudal fin was removed and preserved in 96% ethanol for DNA extraction. All fishes were released into the river after recovering from anesthesia. In Mastratto, Anapo and Manghisi, fish were captured by anglers. Fin samples from Irminio in 2010 and 2011 (IR10 and IR11) and from San Leonardo in 2011 (SL11) were from wild breeders (mainly females) from the S. Rocco local hatchery (Ragusa).

2.2. Microsatellites and LDH-C Genotyping

Total DNA was extracted from the caudal fin tissue with the Realpure Genomic DNA Extraction Toolkit (Durviz SL, Valencia, Spain). Eight commonly used microsatellite loci (Str15, Str73, Str591, Ssa85, SsHaeIII14.20, SsoSL417, SsoSL438 and SSsp2213) were amplified and genotyped with two PCR multiplexes, as explained in Sanz et al. [22]. The LDH-C* locus was genotyped in all individuals using the RFLP method described by McMeel et al. [23], running the electrophoresis gel for an hour to separate the obtained fragments.

2.3. Data Analysis from Genotyping

To test for large allele dropout and null alleles, microsatellite data were analyzed using Micro-checker v 2.2.1 [24]. Allele frequencies and unbiased genetic diversity within samples were quantified based on the number of alleles and the expected heterozygosity (HS) with FSTAT 2.9.3 [25]. The software HR-RARE [26] was used to estimate the allelic richness (Ar) and the private allelic richness (PAr) in each sample by using the rarefaction method that standardizes the number of alleles to the smallest population sampled in our dataset. Rarefaction was also used to compare Ar and PAr values per river basin, standardizing the number of populations sampled per basin. Genotypic distributions at each location were tested for conformance to Hardy–Weinberg expectations by the exact test implemented in GENEPOP 4.0 [27]. The unbiased composite linkage disequilibrium measure provided by this software reveals putative gametic disequilibria for paired loci in each population. Significance levels were adjusted by the sequential Bonferroni technique [28]. Excess heterozygosity was tested for evidence of recent population bottlenecks with the BOTTLENECK software [29] using a two-phased model of mutation (TMP) with default values (70% single-step mutation and 30% multiple-step mutation).
Differences in allele frequencies among samples were evaluated with the exact probability test of GENEPOP 4.0. In addition, pairwise FST values and their significance were tested by randomizing genotypes between pairs of samples, performing 1000 permutations with FSTAT 2.9.3. Pairwise multilocus comparisons between samples were computed by Cavalli-Sforza and Edwards chord distance (CS) in MSA 4.05 [30]. Isolation by distance was tested within the Irminio basin by computing regression between both FST/(1-FST) statistics and CS genetic distance and hydrographical distances (distance between samples following the river trajectory) in a Mantel test with 1000 permutations in Genepop. Contemporary migration rates between populations within the Irminio basin were estimated by the BAYESASS 1.3 software [31].
The minimum number of homogeneous units (testing k = 1–12) was estimated using the Bayesian Markov chain Monte Carlo approach method of STRUCTURE v. 2.3.4 [32]. A second run was performed for each of the previously identified clusters to detect possible substructures. The optimal k value was selected following the recommendations of Falush et al. [32] and according to the method of Evanno et al. [33], implemented in STRUCTURE Harvester [34]. Analyses of admixtures with the optimal k value were then performed with the admixture model and correlated allele frequencies without prior population information and with a burn-in period of 200,000 steps followed by 1,000,000 Monte Carlo replicates.
We used the package Adegenet 2.1.3 [35], implemented in R 4.0.3 [36], to perform a discriminant analysis of principal components (DAPC) [37]. The a-score index was used to find the optimal number of principal components (PCs) that should be retained in the DAPC analysis to avoid over-fitting of the model.
Analysis of the molecular variance (AMOVA) was carried out with Arlequin3.1 [38] by testing different hierarchical models: grouping temporal samples, following a hydrographic pattern and assuming groups defined by STRUCTURE analyses.

2.4. Mitochondrial DNA Sequencing

The complete sequence of the mitochondrial DNA control region (mtDNA-CR) was obtained by 122 individuals. Amplifications and sequencing were carried out with primers described in Cortey and García-Marín [39], but PCRs were performed with the GoTaq Hot Start Colorless Master Mix (Promega, Madison, WI, USA) and PCR conditions modified accordingly. PCRs had a total volume of 25 µL with two μL of DNA extraction, 12.5 μL of Master Mix, 9.5 μL of nuclease-free water, 0.5 μL of forward primer and 0.5 μL of reverse primer 10 μM. Thermal cycling conditions consisted of four min of initial denaturation at 95 °C, followed by 30 cycles of 95 °C for 30 s, 59 °C for 1 min and 72 °C for 1 min, plus a final step of 72 °C for five minutes. The PCR products were purified with 1 U of Exonuclease I (Fermentas, Leon-Rot, Germany) and 0.5 U of Thermosensitive Alkaline Phosphatase (FastAPTM), Fermentas, Germany). Sequencing was then performed with both forward and reverse PCR primers at the Macrogen Company (Seoul, Republic of Korea). Sequences were manually edited, aligned and concatenated in the Geneious software, version 5.6 [40]. The length of the final alignment contained 984 base pairs (bp). We used the DnaSP v5 program [41] to estimate the number of variable sites and the number of different haplotypes.

3. Results

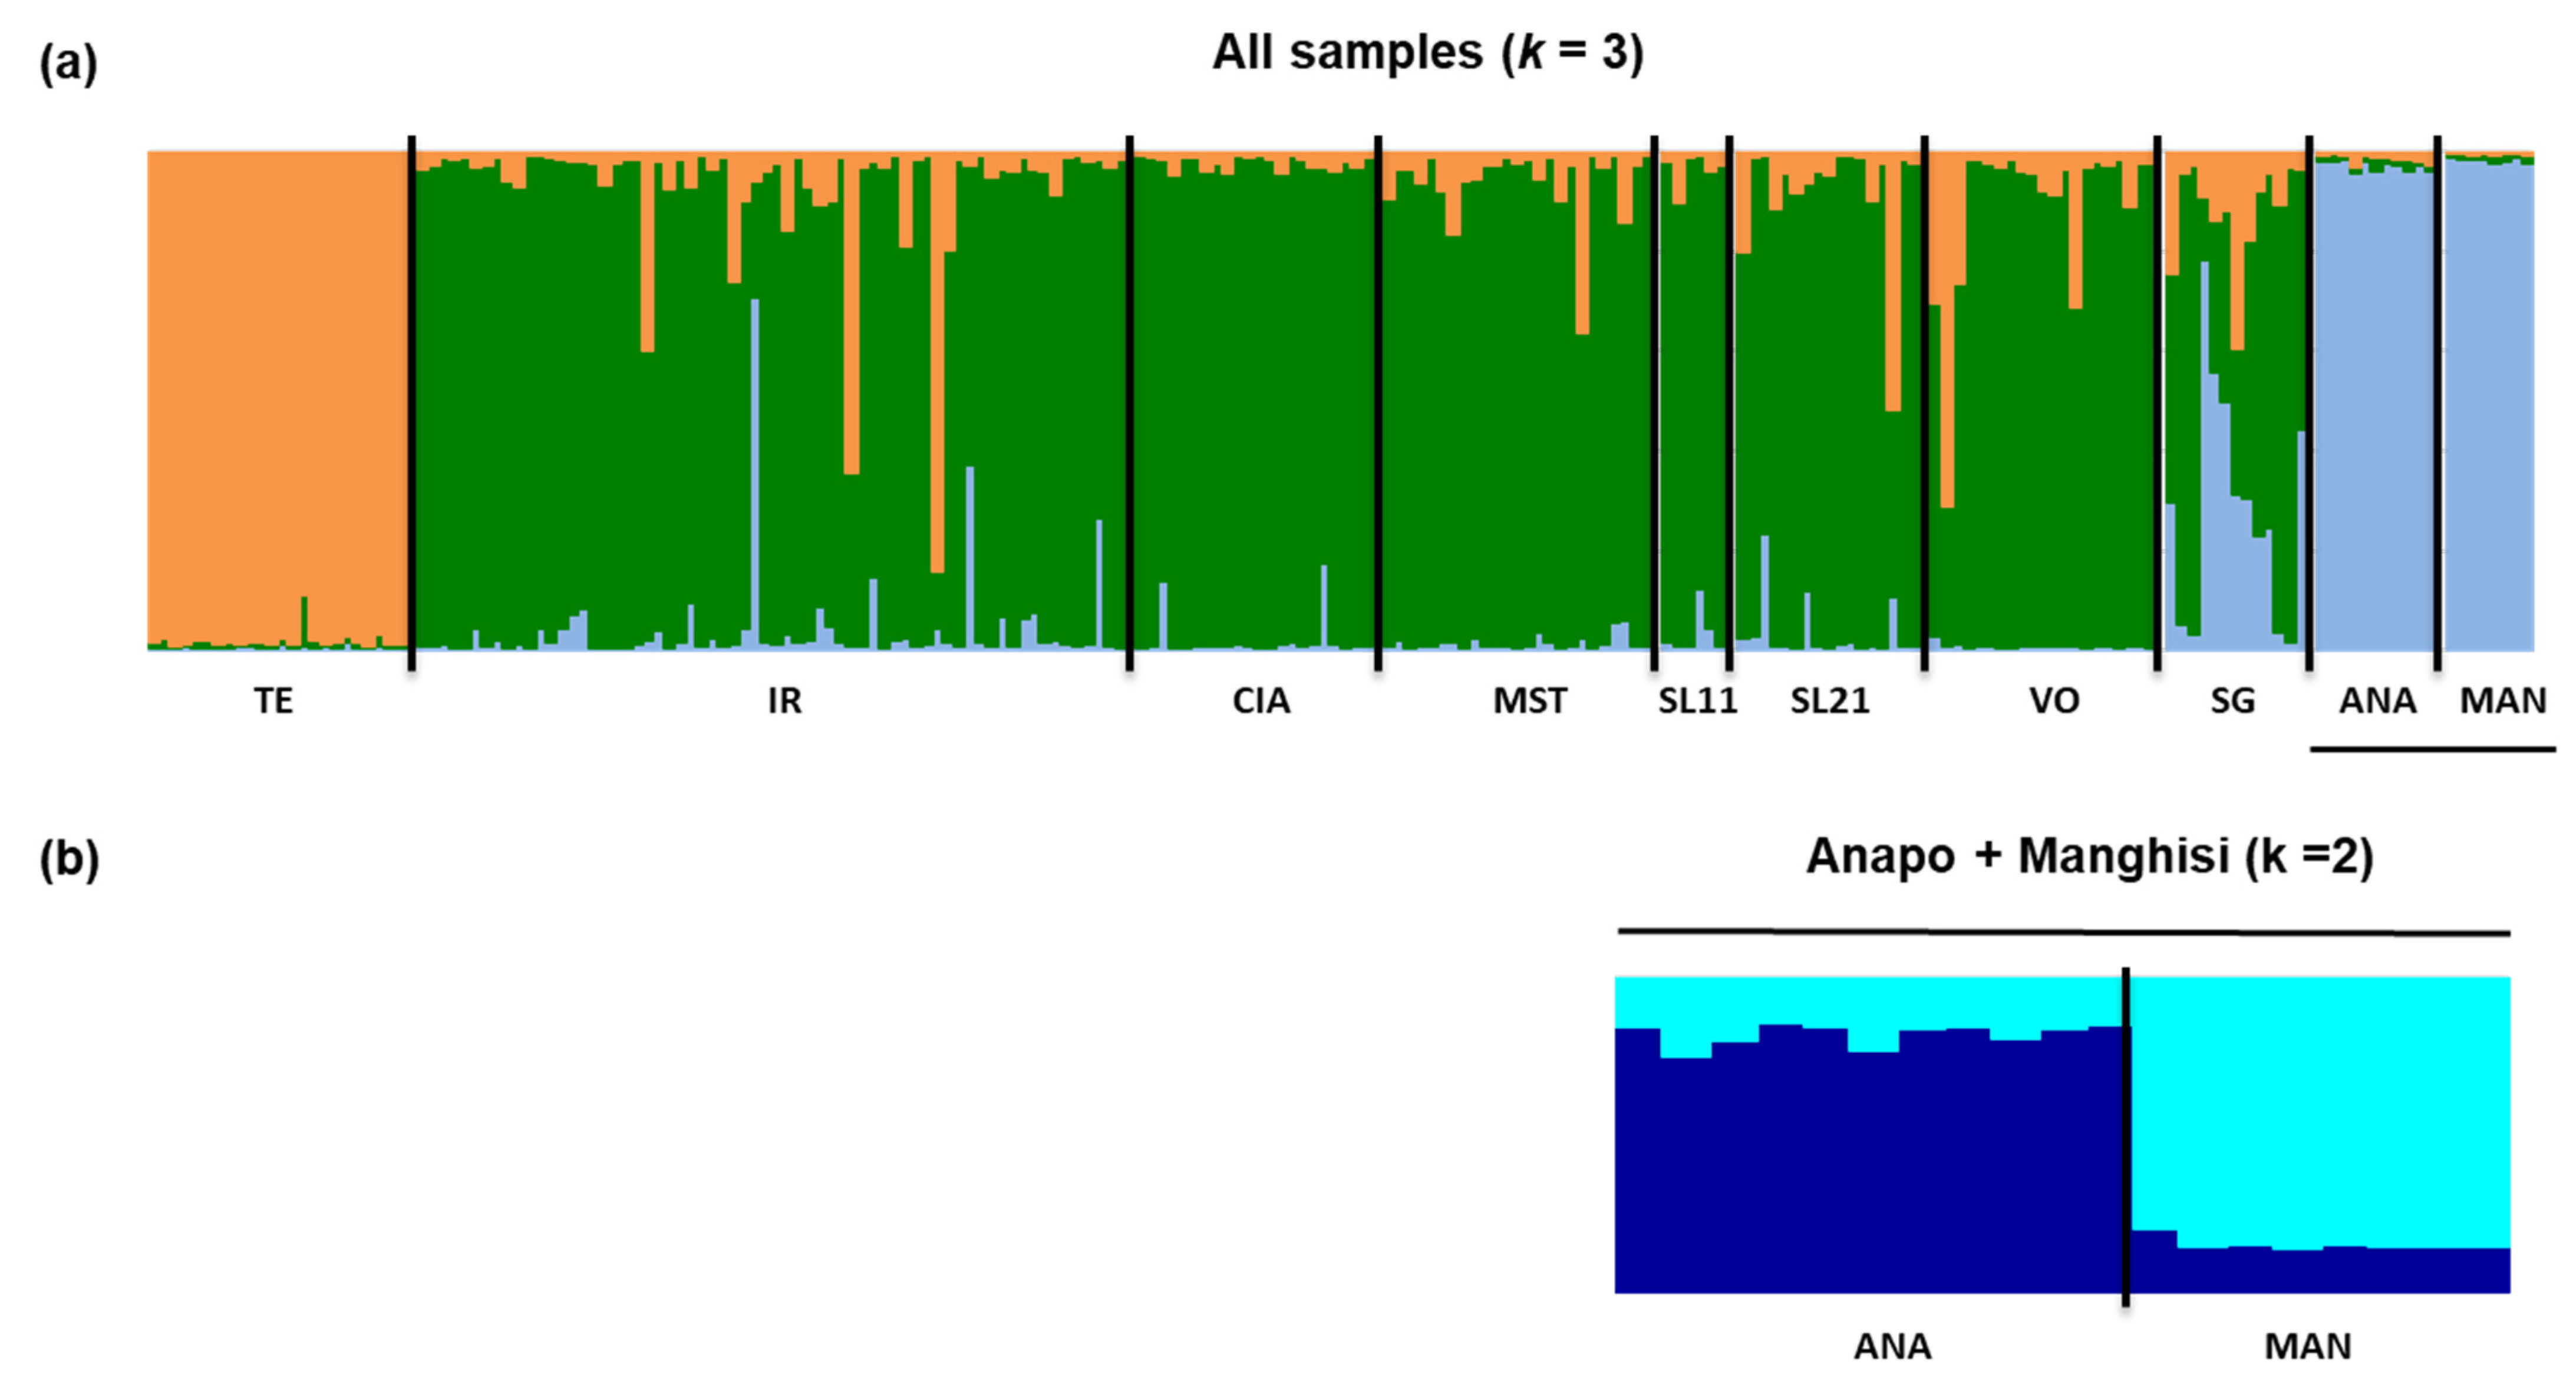
3.1. Hatchery Introgression and Gene Diversity within Populations

The exogenous hatchery allele LDH-C*90 was detected in all but the Tellesimo populations. Its frequency (q) ranged from 0.125 in Manghisi up to 0.409 in Ciaramite (Irminio). Hardy–Weinberg equilibrium was detected at this locus in all populations and no linkage disequilibrium was observed between LDH-C* and any microsatellite loci.
Micro-checker did not detect null alleles at any microsatellite loci. Deviation from Hardy–Weinberg equilibrium was only detected in the Irminio 2008 sample, but it was minimally significant (p = 0.0103) and disappeared after Bonferroni correction. Significant gametic disequilibrium was only found in Ciaramite, in two out of the 21 performed tests, but significance was low (0.001 < p < 0.01) and disappeared after Bonferroni.
Values of allelic richness (Ar) and gene diversity (Hs) ranged from 1.763 to 4.092 and from 0.228 to 0.607, respectively (Table 1). Allelic richness standardized by the number of populations sampled in each river basin was clearly lower in Tellesimo than in the rest of the streams, and an ANOVA test indicated that both Hs and Ar values differed significantly among the main rivers (Tellesimo, Irminio, Anapo and Manghisi) (0.001 < p < 0.05). The lowest Hs value also coincided with the lack of the exogenous hatchery allele LDH-C*90, and the gene diversity values and the frequency of this allele were significantly correlated among samples (0.001 < p < 0.05) (Table 1). In all populations, the heterozygosity excess test did not find any signal of recent bottlenecks.

3.2. Temporal Genetic Differentiation

Neither pairwise FSTs nor exact probability tests were significant between paired temporal samples from the Irminio Main River (Table 2). The analyses of molecular variance grouping temporal samples from Irminio (2008–2010–2011) assigned 2.18% of the total variance to differences among temporal samples (FSC = 0.025), and this value had a low but significant contribution to the total genetic variance (0.001 < p < 0.01) (Table 3).

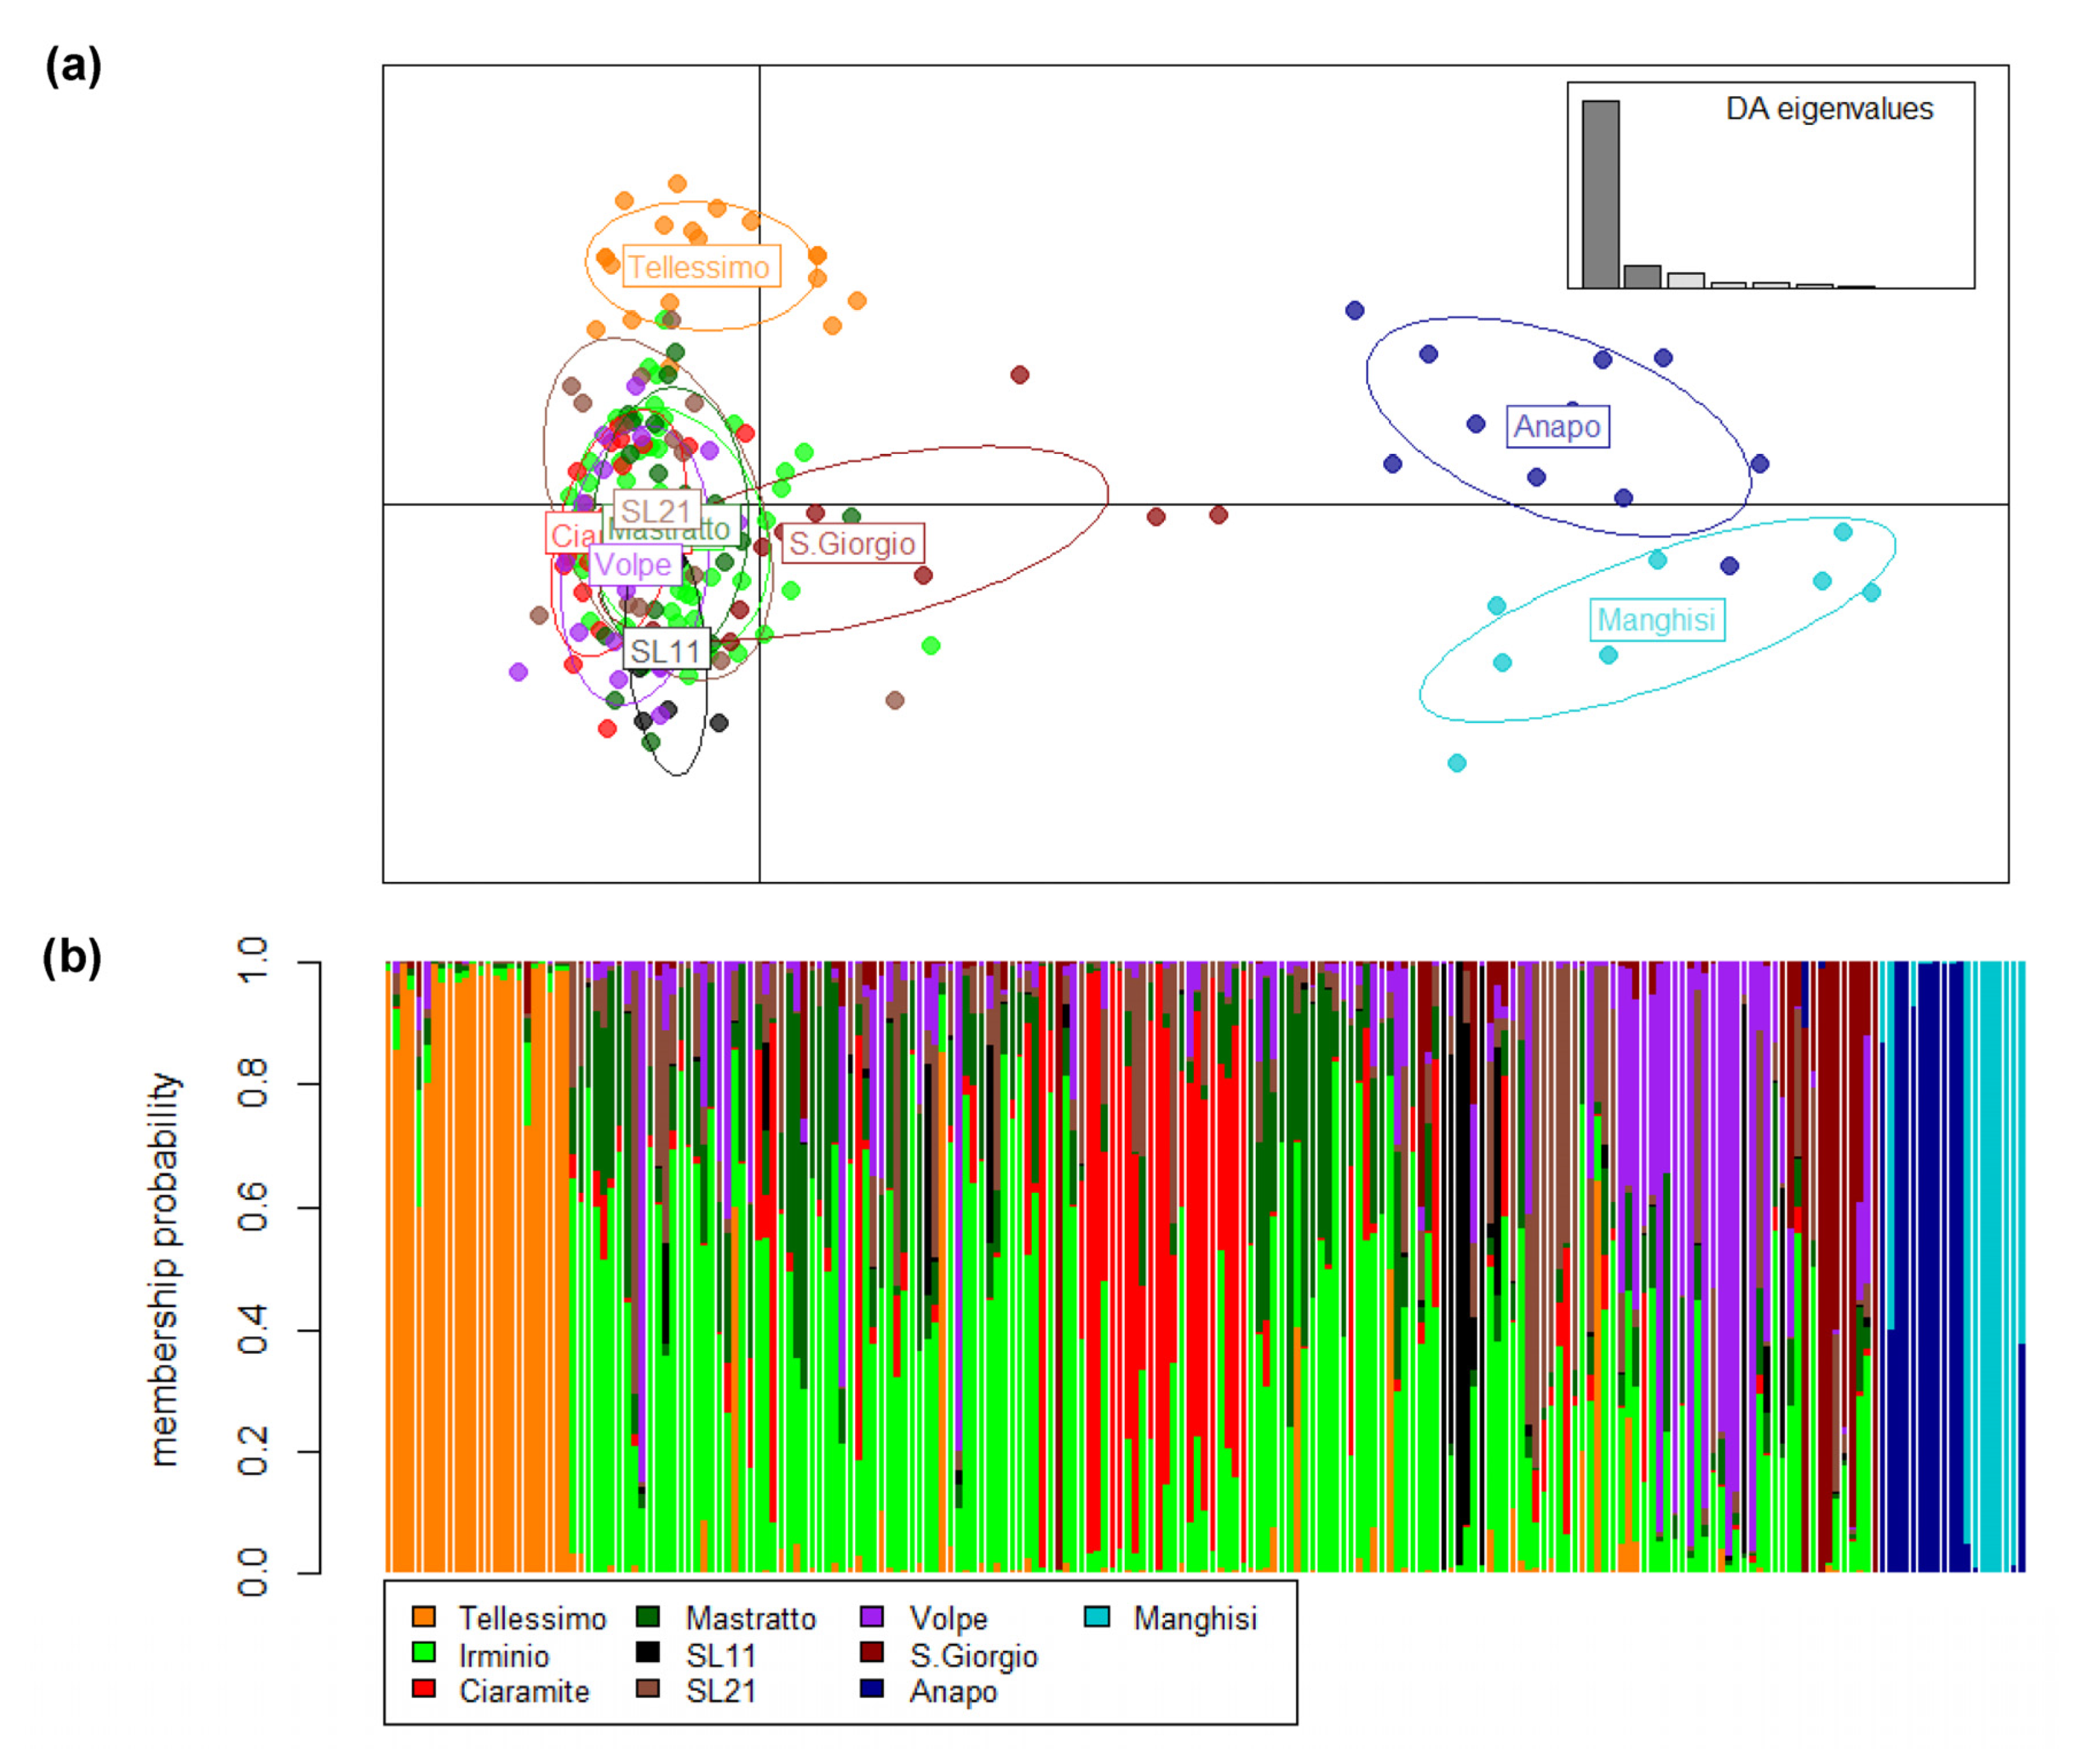
3.3. Genetic Differentiation and Population Structure

The overall genetic differentiation among samples was highly significant for all loci (p = 0.000). Overall, FST was 0.186, and the Str591 locus was the one that most contributed to the genetic differences (FST = 0.720). Pairwise FST resulted in high significance (p < 0.001) in all comparisons, except when temporal samples from Irminio were compared and when some samples from the Irminio basin were compared with Mastratto and San Leonardo (Table 2). The highest pairwise FST and CS distance values were found when comparisons included the Manghisi or Anapo Rivers, and the highest differentiation was found between Tellesimo and Manghisi (FST = 0.571, CS = 0.691). In the Irminio basin, low genetic differentiation occurred when pair-wise comparisons included samples from the main river (IR), but differentiation increased when samples from different Irminio tributaries were compared (Table 2). The Mantel test indicated a positive but non-significant correlation between the hydrographical and genetic distances between populations from Irminio (p = 0.177 and 0.125, by linearized FST and CS distance, respectively). Contemporary migration rates were low and occurred mainly downstream. The proportion of migrants only overpassed 10% from Ciaramite and Mastratto to Irminio and from Irminio to San Leonardo locations (Figure 2).
For overall samples, STRUCTURE Harvester yielded a model of four genetically homogeneous units that separated Tellesimo and grouped samples from Anapo and Manghisi. The other two clusters distributed equally among most individuals from the Irminio basin and did not depict a clear population structure within Irminio. However, when temporal samples from Irminio were pooled, STRUCTURE Harvester identified three genetically homogeneous units (k = 3) that separated Tellesimo, the Irminio basin and Anapo + Manghisi (Figure 3). In both cases (not pooling and pooling temporal samples), at a low level of hierarchy, all samples from the Irminio basin remained in a single cluster (k = 1), and two clusters separated Anapo from Manghisi (k = 2) (Figure 3). Therefore, we considered four genetically homogeneous units overall samples, which clearly related with a hydrographic pattern of genetic diversity distribution. This pattern was also supported by the DAPC analyses (Figure 4) and the hierarchical analysis of molecular variances (AMOVA), which assigned the highest genetic variance among groups when a hydrographic model was considered (Table 3).

3.4. mtDNA-CR Sequencing

Sequencing of the entire control region comprised only six variable sites that defined four haplotypes among the 122 sequenced individuals. All haplotypes have been described in previous studies. The most abundant haplotype was found in all but Manghisi populations and corresponded to the native Atlantic haplotype AtSic (JF297974), already described by Shöffmann et al. [7] and Snoj et al. [11] in the Anapo, Tellesimo and Irminio Rivers. All analyzed individuals from Manghisi showed a second native haplotype that corresponded to the South Atlantic JE1 haplotype (AF253557), described by Suárez et al. [42] in the Atlantic basin of the Iberian Peninsula and already found by Berrebi et al. [13] in the Manghisi River. The two remaining haplotypes were characteristic of Northern European brown trout populations, and therefore of hatchery origin: Atcs3 (AF274574 Cortey et al. [39]), found in some samples from the Irminio Main River and the tributaries of Mastratto and San Giorgio, and Atcs4 (AF274575 Cortey et al. [39]), found in a single individual from the Irminio 2010 sample.

4. Discussion

4.1. Hatchery Introgression and Disruption of Gene Diversity

Disentangling the proportion of native and exogenous hatchery genomes in wild populations is necessary to develop management strategies. This task becomes virtually impossible when stocking practices have been in place for a long time and hence introgression has occurred. In the Ragusa province, stocking with hatchery fish of Northern European origin stopped almost thirty years ago (1993), but these practices took place in Sicily for more than forty years [43]. In this situation, one may estimate an approximate level of introgression per population but can hardly distinguish pure hatchery/native and hybrid fish, as most of the individuals can be admixed to some degree [22].
According to records of stocking practices [18,44], and as Schöffmann et al. [7] and Fruciano et al. [8] indicated, our results confirmed that only Sicilian trout from the Tellesimo River remain completely free of hatchery introgression. In contrast, the present data showed an important level of introgression in all the other analyzed populations. In the Anapo River, the introgression rate was comparable to that detected by Fruciano et al. [8], who also found 20–30% of introgression in the Cassibile Main River and in the San Marco tributary. In Irminio, there are no previous genetic data on introgression in this basin, apart from one analyzed specimen from the main river that was a hybrid for the LDH-C* locus [7]. Our extensive sampling in this basin found an important level of hatchery introgression in both the Irminio Main River and all its tributaries (q = 0.167–0.409), which agrees with the intensive stocking practices reported [19].
Contrasting the above results, and based on nuclear and mitochondrial markers, Berrebi et al. [13] failed to detect introgression in the Anapo and Cassibile Rivers. Interestingly, these authors used data from a French hatchery (Isère) as a baseline to estimate hatchery introgression through microsatellite genotyping. They assumed that the hatchery fish released in Sicilian rivers should be similar to the Atlantic strain used in France, and then, based on the genetic differences between Sicilian populations and this hatchery stock, they concluded that trout in the Cassibile and Anapo Rivers were representative of pure native trout. Our present data demonstrate that this conclusion is wrong, as we have detected notable introgression in Manghisi (the uppermost course of the Cassibile) and Anapo using the LDH-C* locus. When using microsatellites, we also assumed that all hatchery stocks used along the Mediterranean region could have the same origin, and tried to estimate hatchery introgression using data from two Spanish hatcheries as a baseline. As with Berrebi et al. [13], using this incorrect approach, we also detected large genetic differences between our hatcheries and the introgressed Sicilian samples (Supplementary Figure S1). In conclusion, despite having only sampled eight individuals in Manghisi, we can confirm the hatchery introgression in Manghisi (Cassibile) and Anapo, as observed Fruciano et al. [8], and we can reject the hypothesis that populations from these rivers are pure native, as Berrebi et al. [13] suggested. Based on the above observations, we also advise the use of alternative hatchery baselines to estimate introgression by microsatellite data when no data about the true hatchery strain used to stock rivers are available, as this can lead to false conclusions.
Sequencing of the CR displayed limited power in estimating hatchery introgression in our samples. In most of the studied populations, mtDNA introgression was clearly lower than values from the LDH-C* locus, to the extent that we failed to find exogenous hatchery haplotypes in many of the introgressed samples (Table 1). Apart from Fruciano et al. [8], who detected the hatchery haplotype Atcs3 in the Cassibile River, previous studies from Shöffmann et al. [7] and Berrebi et al. [13] also failed to find hatchery haplotypes in Sicilian trout populations. Discrepancies in the introgression estimates from different markers might be due to the small sample sizes used for mtDNA analyses, but large discrepancies were also observed in collections with similar sample sizes for both markers (e.g., ANA, MAN). Genetic drift, due to the smaller mitochondrial effective population size, and sex-biased introgression could explain the lower performance of mitochondrial markers compared to nuclear data to estimate introgression [45,46,47,48]. In resident trout populations, such as the Sicilian ones, the lower contribution of female domestic trout to interbreeding has been related to differences in spawning times between Mediterranean and hatchery trout, which largely occur in hydrologically unstable southern streams [46]. Interestingly, introgression found in IR10 and IR11 samples, mainly composed of female breeders, would support the hypothesis of sex-biased introgression. Alternatively, lower introgression in Irminio breeders could also be the consequence of the morphological selection carried out before breeding stocks, which is performed with the aim of choosing native individuals [6]. Although we mostly failed to find a concordance between morphological and genetic classification at the individual level (Supplementary Table S1), the morphological classification carried out could have avoided breeding the most introgressed (or hatchery) individuals, which would result in a bias towards a major representation of native (or less introgressed) individuals among samples of breeders.
Another important finding in our data is the significantly lower gene diversity in the non-introgressed Sicilian trout population (Tellesimo). We found a positive and significant correlation between the frequency of the exogenous hatchery allele (LDH-C*90) and both HS and Ar values. Gene diversity increasing in proportion to hatchery introgression has been observed repeatedly in stocked populations because of the introduction of exogenous hatchery alleles into the native gene pools [22,49,50]. For instance, gene diversity values in Corsica populations were doubled in local domestic strains and introgressed samples compared to native Mediterranean ones [50]. In our region, this could mean that the extremely low diversity found in Tellesimo could be representative of the real value of diversity for native Sicilian trout, as diversity in the rest of the populations (Irminio, Anapo and Manghisi basins) is putatively over-estimated by the introduction of exogenous hatchery alleles. Certainly, the increase in the Hs values that we have detected (of two tenths approximately) has been reported in previous studies comparing values from native and introgressed trout populations [11,49,51]. Despite its Atlantic origin, intra-population diversity in Sicilian trout is more similar to that observed in Mediterranean populations inhabiting unstable streams than the diversity found in their phylogenetically closer Iberian Atlantic populations [49,52]. Similar, even lower genetic diversity values have been reported in Talembote (Morocco), an Atlantic population draining to the Mediterranean Sea [11], and in Corsica [13], and this is probably related to small population sized conditioned by the small sizes of streams under unstable environment conditions.
Additionally, extremely low gene diversity is also reported in the mtDNA data, with only two native haplotypes found among the 122 analyzed specimens. These results confirm the analyses of Berrebi et al. [13] using 12 specimens of Sicilian trout. However, they greatly contrast the 57 native haplotypes described by Fruciano et al. [8] from the analyses of 100 specimens in the Tellesimo, Anapo and Manghisi Rivers. Differences in the number of haplotypes cannot be the consequence of different sampling sizes, as we analyzed more individuals from more streams than Fruciano et al. [8]. Then, if the data from these authors are reliable, the immediate conclusion is that Sicilian trout has lost most of its gene diversity in the last seven years. In fact, the low number of haplotypes and its distribution resembles the situation described in trout populations from other Mediterranean islands [13].

4.2. Population Structure beyond Hatchery Introgression

The introgression of the same exogenous hatchery genes and the difference in the persistence of these genes in stocked brown trout populations have been related to the homogenization of populations and genetic differentiation among populations, respectively [45,52,53,54,55,56]. In this situation, the possibility to depict a natural pattern of population structure remains a challenge, as most trout populations have hatchery introgression. The lack of stocking in Tellesimo and the moderate hatchery introgression in all the remaining populations could explain the high level of differentiation between this sample and those from the Irminio, Anapo and Manghisi Rivers. However, similar, even higher genetic differentiation was found between Anapo and Manghisi samples, both with a comparable level of introgression, or between these two samples and the rest of the populations from the Irminio basin, which showed a similar proportion of exogenous hatchery genes. Thus, beyond introgression, a native pattern of population structure that differentiates populations from different river basins seems a more plausible framework for the Sicilian trout. Additionally, the high frequency (>0.1) of private alleles (which are presumably native as they were not found in other similarly introgressed populations) in the Anapo and Manghisi Rivers would support the existence of this native pattern of structure. The distribution of the genetic diversity according to a hydrographic pattern of structure was supported by all analyses of genetic differentiation, and similar FST values have been reported among populations from different river systems in previous studies [54,57]. This pattern is not surprising in resident trout because of the physical isolation among the different river basins [58].
Beyond the hydrographic pattern of population structure, we also found that the most important genetic differences occurred between the western (Tellesimo and Irminio) and the eastern rivers (Anapo and Manghisi) (Table 2 and Figure 3 and Figure 4). This stronger differentiation between regions could reflect the recent evolutionary history of Sicilian trout. Even if microsatellites are considered unsuitable for describing ancient evolution, they are useful to elucidate the recent genetic diversification of trout lineages [10,12,48]. Surprisingly, we observed the genetic isolation of the uppermost tributary of Irminio (San Giorgio) that showed some genetic relationship with Manghisi and Anapo (Table 2; Figure 3 and Figure 4). These observations could be explained by inland migration (headwater stream captures) during Quaternary climatic oscillations, but this could only be confirmed by extending sampling in these rivers. Otherwise, the uncontrolled translocation of fish from Manghisi or Anapo to San Giorgio cannot be ruled out.
Within river basins, a pattern of isolation by distance among trout populations has commonly been observed [49,54,59,60]. However, this pattern is often disrupted when artificial barriers interrupt the natural gene flow [52,56,61]. Within the Irminio basin, despite the lack of a clear pattern of population structure or isolation by distance, genetic differentiation among most paired populations was statistically significant and the DAPC analyses showed differences among some populations. Moreover, migration within the basin was extremely low and occurred mainly downstream, which means that most of the barriers (weirs, dams and waterfalls) were impassable for trout, at least upstream. This isolation is certainly exacerbated by the climatic conditions in dry some stretches of the Irminio tributaries throughout most of the year, restricting migration to flood episodes (Figure 2). Episodes of water flow fluctuations and harsh climatic conditions, promoting isolation and genetic drift, have been described in Iberian brown trout, leading to vulnerable situations and even to local extinctions [49,62,63]. Paradoxically, as occurred in brown trout from the Pasvik River [56], stocking along the entire Irminio basin for many years has distorted the pattern of migration and homogenized populations, mitigating the impact of the impassable barriers and preventing the complete isolation of populations. However, this genetic homogenization has been accompanied by the loss of unique native gene pools.

4.3. Conclusions and Conservation Management Strategies

As with many other trout populations living at the marginal limit of trout distribution, Sicilian trout face to two main threats: the introgression of exogenous hatchery genes because of past extensive stocking, and habitat fragmentation due to anthropogenic barriers to gene flow, exacerbated by harsh climatic conditions. Although stocking with Northern European brown trout stopped more than thirty years ago, an exogenous genome has become introduced into the native gene pools of native populations and many fish could now be admixed to some degree. Small populations living in unstable environments and unpredictable hydrological conditions, such as those from Sicily, are particularly prone to becoming introgressed and end up displaced by stocked hatchery trout [46,64,65]. Fortunately, although introgression has left its trace, we did not find naturalized populations entirely composed of exogenous hatchery fish, and some trout in Sicilian rivers still maintain native singular gene pools of S. cettii. Therefore, conservation strategies should be focused on the sustainability of current populations by supporting breeding with local stocks and habitat improvements. Supportive breeding should be necessarily accompanied by genetic monitoring, to ensure that these practices do not result in inbreeding and a loss of genetic variability [66]. The present genetic data prove a clear natural genetic distinction among trout from different river basins. This implies that pure native trout from Tellesimo cannot be used as a native baseline for all Sicilian trout [8]. Instead, at least four native stocks should be considered for supportive breeding. The moderate level of hybridization with exogenous hatchery trout in all but the Tellesimo River is another challenge to face when breeding local ‘native’ trout, as the assisted selection of the most native individuals would be necessary in these cases. Regarding phenotype selection as a management tool, our first comparisons with a few individuals from Irminio failed to find a correspondence between phenotype and the genetic identification of pure and hatchery (pure or hybrid) individuals. Thus, even if it seems that this selection could avoid breeding the most introgressed individuals, more extensive studies are necessary to prove this. Therefore, selection by genetic markers before breeding becomes strictly necessary. After years of hybridization, genetic markers cannot assure the identification of individuals as pure native [22], but they are more reliable to point out native genomes in trout individuals than phenotypic assessment [48,67,68].
Finally, habitat fragmentation due to anthropogenic barriers (dams and weirs) has been described as a major concern in freshwater fish conservation [69,70,71]. Removing these barriers, often redundant, permits us to restore connectivity, and it seems especially necessary when populations are subjected to persistent unfavorable conditions. Otherwise, the recolonization of some stream sections where recurrent local extinction can occur becomes a difficult task [52]. In the same way, a stocking program based on a single native stock for the entire river basin would also mitigate the effect of habitat fragmentation and reduce population isolation. Although we will have to assume some losses in the native genetic resources that could naturally exist in some remote tributaries, these stocking practices would maintain connectivity and hence gene diversity in trout populations, necessary to ensure their long-term survival.

Supplementary Materials

The following supporting information can be downloaded at: https://www.mdpi.com/article/10.3390/d15020274/s1, Figure S1: (A) Discriminant analysis of principal components (DAPC) including individuals from Iberian hatcheries (Escuelas and Bagà). (B) STRUCTURE analyses considering the most likely number of genetically homogeneous groups among wild Sicilian samples (k = 4) and including individuals from Iberian hatcheries as hatchery baselines. Table S1: Hatchery origin of specimens from the Irminio and San Leonardo Rivers according to genetics (presence of the exogenous hatchery allele LDH-C*90) and morphology [6]. In bold, individuals of pure hatchery or hybrid origin according to genetics or morphology. Discrepancies between the two methods are shaded in grey.

Author Contributions

Conceptualization, N.S. and A.D.; sampling, A.D. and M.G.; methodology, M.G. and R.-M.A.; software, R.-M.A. and N.S.; formal analysis, N.S.; investigation, A.D. and N.S.; writing—original draft preparation, N.S.; writing—review and editing, N.S. and A.D.; funding acquisition, A.D. All authors have read and agreed to the published version of the manuscript.

Funding

This work was partially funded by Provincia Regionale di Ragusa—now Libero Consorzio Comunale di Ragusa—(“Macrostigma Project”) and by Regione Siciliana, Assessorato Regionale Agricoltura, Sviluppo Rurale e Pesca Mediterranea—Dipartimento Pesca Mediterranea (Progetto di implementazione dell’incubatoio per l’allevamento, la salvaguardia, e la conservazione della trota macrostigma Salmo cettii, PO FEAMP 2014/2020—Misura a titolarità 2.51).

Institutional Review Board Statement

Ethical review and approval were not applicable because non-invasive methods were used during sampling.

Data Availability Statement

The genotype dataset generated during the current study is available from the corresponding author on reasonable request.

Acknowledgments

Thanks to the Fishing Guards of FIPSAS Ragusa (Gianni Dimartino, Alessandro Battaglia, Davide Criscione, Antonio Modica, Davide Pirruccio, Gianni Rosso, Andrea Scrofani) and to the anglers for their help in sampling, and to Cesca Rivas for her technical support in the lab tasks. Thanks to three anonymous reviewers for their constructive comments that improved our manuscript.

Conflicts of Interest

The authors declare no conflict of interest.

References

  1. Filipe, A.F.; Markovic, D.; Pletterbauer, F.; Tisseuil, C.; De Wever, A.; Schmutz, S.; Bonada, N.; Freyhof, J. Forecasting Fish Distribution along Stream Networks: Brown Trout (Salmo trutta) in Europe. Divers. Distrib. 2013, 19, 1059–1071. [Google Scholar] [CrossRef]
  2. Mostafavi, H.; Kambouzia, J. Impact of Climate Change on the Distribution of Brown Trout, Salmo trutta Linnaeus, 1758 (Teleostei: Salmonidae) Using Ensemble Modelling Approach in Iran. Iran. J. Ichthyol. 2019, 6, 73–81. [Google Scholar] [CrossRef]
  3. Zava, B.; Beller, P.; Chiari, P.; Nardi, P.A.; Violani, C.; Bernini, F. Faunistic and taxonomic notes on Salmo trutta macrostigma (Dum.) from Sicily. Atti IV Convegno Naz. A.I.I.A.D. Distrib. Fauna Ittica Ital. Riva Gard 1991, 413–422. [Google Scholar]
  4. Zava, B.; Beller, P.; Chiari, P.; Nardi, P.A.; Violani, C.; Bernini, F. Salmo cettii Rafinesque-Schmaltz, 1810, an early name for the Sicilian trout. Atti Soc. Ital. Sci. Nat. Mus. Civ. Stor. Nat. Milano 1996, 137, 65–66. [Google Scholar]
  5. Kottelat, M.; Freyhof, J. Handbook of European Freshwater Fishes; Publications Kottelat: Cornol, Switzerland, 2007. [Google Scholar]
  6. Duchi, A. Flank Spot Number and Its Significance for Systematics, Taxonomy and Conservation of the near-Threatened Mediterranean Trout Salmo Cettii: Evidence from a Genetically Pure Population. J. Fish Biol. 2018, 92, 254–260. [Google Scholar] [CrossRef]
  7. Schöffmann, J.; Sušnik, S.; Snoj, A. Phylogenetic Origin of Salmo trutta L 1758 from Sicily, Based on Mitochondrial and Nuclear DNA Analyses. Hydrobiologia 2007, 575, 51–55. [Google Scholar] [CrossRef]
  8. Fruciano, C.; Pappalardo, A.M.; Tigano, C.; Ferrito, V. Phylogeographical Relationships of Sicilian Brown Trout and the Effects of Genetic Introgression on Morphospace Occupation. Biol. J. Linn. Soc. 2014, 112, 387–398. [Google Scholar] [CrossRef]
  9. Sanz, N. Phylogeographic History of Brown Trout: A Review. In Brown Trout: Biology, Ecology and Management; John Wiley & Sons Ltd.: Hoboken, NJ, USA, 2018; pp. 17–63. [Google Scholar] [CrossRef]
  10. Snoj, A.; Marić, S.; Bajec, S.S.; Berrebi, P.; Janjani, S.; Schöffmann, J. Phylogeographic Structure and Demographic Patterns of Brown Trout in North-West Africa. Mol. Phylogenet. Evol. 2011, 61, 203–211. [Google Scholar] [CrossRef]
  11. Snoj, A.; Bravničar, J.; Marić, S.; Sušnik Bajec, S.; Benaissa, H.; Schöffmann, J. Nuclear DNA Reveals Multiple Waves of Colonisation, Reticulate Evolution and a Large Impact of Stocking on Trout in North-West Africa. Hydrobiologia 2021, 848, 3389–3405. [Google Scholar] [CrossRef]
  12. Hashemzadeh Segherloo, I.; Freyhof, J.; Berrebi, P.; Ferchaud, A.L.; Geiger, M.; Laroche, J.; Levin, B.A.; Normandeau, E.; Bernatchez, L. A Genomic Perspective on an Old Question: Salmo Trouts or Salmo trutta (Teleostei: Salmonidae)? Mol. Phylogenet. Evol. 2021, 162, 107204. [Google Scholar] [CrossRef]
  13. Berrebi, P.; Caputo Barucchi, V.; Splendiani, A.; Muracciole, S.; Sabatini, A.; Palmas, F.; Tougard, C.; Arculeo, M.; Marić, S. Brown Trout (Salmo trutta L.) High Genetic Diversity around the Tyrrhenian Sea as Revealed by Nuclear and Mitochondrial Markers. Hydrobiologia 2019, 826, 209–231. [Google Scholar] [CrossRef]
  14. Lobón-Cerviá, J.; Esteve, M.; Berrebi, P.; Duchi, A.; Lorenzoni, M.; Young, K.A. Trout and Char of Central and Southern Europe and Northern Africa. In Trout and Char of the World; Kershner, J., Williams, J., Gresswell, R., Lobón-Cerviá, J., Eds.; American Fisheries Society: Atlantic City, NJ, USA, 2019; pp. 379–410. [Google Scholar] [CrossRef]
  15. Freyhof, J.; Kottelat, M. Salmo cettii. IUCN Red List of Threatened Species Version 3.1. 2008. Available online: http://www.iucnredlist.org/details/135528/0 (accessed on 1 June 2022).
  16. Freyhof, J.; Bergner, L.; Ford, M. Threatened Fishes of the Mediterranean Basin Biodiversity Hotspot: Distribution, Extinction risk and impact of hydropower. EuroNatur RiverWatch 2020, I-viii, 1–348. [Google Scholar] [CrossRef]
  17. Rondinini, C.; Battistoni, A.; Peronace, V.; Teofili, C. Lista Rossa Dei Vertebrati Italiani. WWF Ital. Sett. Divers. Biol. 2013, 56, 56. [Google Scholar]
  18. Duchi, A. Preliminary data on the trouts of Torrent Tellesimo (Ragusa, Sicilia). Atti Soc. Ital. Sci. Nat. Mus. Civ. Stor. Nat. 1988, 129, 167–172. (In Italian) [Google Scholar]
  19. Duchi, A. Fecundity, Egg and Alevin Size in the River Irminio Population of the Threatened Salmo Cettii Rafinesque-Schmaltz, 1810 (Sicily, Italy). J. Appl. Ichthyol. 2011, 27, 868–872. [Google Scholar] [CrossRef]
  20. Duchi, A.; Occhipinti, G. Produzione sperimentale di novellame di trota macrostigma, Salmo (trutta) macrostigma Dum, in provincia di Ragusa (Sicilia). Atti V Conv. AIIAD-Montecchio Magg. (VI) 1994, 379–386. (In Italian) [Google Scholar]
  21. Bobbio, L.; Cannas, R.; Cau, A.; Deiana, A.M.; Duchi, A.; Gandolfi, G.; Tagliavini, J. Variabilità mitocondriale in specie di salmonidi, con particolare riferimento alle forme “macrostigma”. Atti Del VI Convegno Dell’ A.I.I.A.D. Varese Ligure 1996, 42–49. [Google Scholar]
  22. Sanz, N.; Araguas, R.M.; Fernández, R.; Vera, M.; García-Marín, J.L. Efficiency of Markers and Methods for Detecting Hybrids and Introgression in Stocked Populations. Conserv. Genet. 2009, 10, 225–236. [Google Scholar] [CrossRef]
  23. McMeel, O.M.; Hoey, E.M.; Ferguson, A. Partial Nucleotide Sequences, and Routine Typing by Polymerase Chain Reaction-Restriction Fragment Length Polymorphism, of the Brown Trout (Salmo trutta) Lactate Dehydrogenase, LDH-C1*90 And*100 Alleles. Mol. Ecol. 2001, 10, 29–34. [Google Scholar] [CrossRef]
  24. Van Oosterhout, C.; Hutchinson, W.F.; Wills, D.P.M.; Shipley, P. Micro-Checker: Software for Identifying and Correcting Genotyping Errors in Microsatellite Data. Mol. Ecol. Notes 2004, 4, 535–538. [Google Scholar] [CrossRef]
  25. Goudet, J. FSTAT (Version 1.2): A Computer Program to Calculate F-Statistics. J. Hered. 1995, 86, 485–486. [Google Scholar] [CrossRef]
  26. Kalinowski, S.T. HP-RARE 1.0: A computer program for performing rarefaction on measures of allelic richness. Mol. Ecol. Notes 2005, 5, 187–189. [Google Scholar] [CrossRef]
  27. Raymond, M.; Rousset, F. GENEPOP (version 1.2): Population genetics software for exact tests and ecumenicism. J. Hered. 1995, 86, 248–249. [Google Scholar] [CrossRef]
  28. Rice, W.R. Analyzing Tables of Statistical Tests. Evolution 1989, 43, 223–225. [Google Scholar] [CrossRef]
  29. Cornuet, J.M.; Luikart, G. Description and power analysis of two tests for detecting recent population bottlenecks from allele frequency data. Genetics 1996, 144, 2001–2014. [Google Scholar] [CrossRef]
  30. Dieringer, D.; Schlötterer, C. Microsatellite analyser (MSA): A platform independent analysis tool for large microsatellite data sets. Mol. Ecol. Notes 2003, 3, 167–169. [Google Scholar] [CrossRef]
  31. Wilson, G.A.; Rannala, B. Bayesian inference of recent migration rates using multilocus genotypes. Genetics 2003, 163, 1177–1191. [Google Scholar] [CrossRef]
  32. Falush, D.; Stephens, M.; Pritchard, J.K. Inference of population structure using multilocus genotype data: Dominant markers and null alleles. Mol. Ecol. Notes 2007, 7, 574–578. [Google Scholar] [CrossRef]
  33. Evanno, G.; Regnaut, S.; Goudet, J. Detecting the number of clusters of individuals using the software STRUCTURE: A simulation study. Mol. Ecol. 2005, 14, 2611–2620. [Google Scholar] [CrossRef]
  34. Earl, D.A.; VonHoldt, B.M. STRUCTURE HARVESTER: A website and program for visualizing STRUCTURE output and implementing the Evanno method. Conserv. Genet. Resour. 2012, 4, 359–361. [Google Scholar] [CrossRef]
  35. Jombart, T. Adegenet: A R package for the multivariate analysis of genetic markers. Bioinformatics 2008, 24, 1403–1405. [Google Scholar] [CrossRef]
  36. R Development Core Team. R: A Language and Environment for Statistical Computing; R Foundation for Statistical Computing: Vienna, Austria, 2020; ISBN 3-900051-07-0. Available online: https://www.R-project.org/ (accessed on 20 June 2022).
  37. Jombart, T.; Devillard, S.; Balloux, F. Discriminant Analysis of Principal Components: A New Method for the Analysis of Genetically Structured Populations. BMC Genet. 2010, 11, 94. [Google Scholar] [CrossRef]
  38. Excoffier, L.; Laval, G.; Schneider, S. Arlequin (version 3.0): An integrated software package for population genetics data analysis. Evol. Bioinform. 2005, 1, 47–50. [Google Scholar] [CrossRef]
  39. Cortey, M.; García-Marín, J.L. Evidence for Phylogeographically Informative Sequence Variation in the Mitochondrial Control Region of Atlantic Brown Trout. J. Fish Biol. 2002, 60, 1058–1063. [Google Scholar] [CrossRef]
  40. Kearse, M.; Moir, R.; Wilson, A.; Stones-Havas, S.; Cheung, M.; Sturrock, S.; Buxton, S.; Cooper, A.; Markowitz, S.; Duran, C.; et al. Geneious Basic: An integrated and extendable desktop software platform for the organization and analysis of sequence data. Bioinformatics 2012, 28, 1647–1649. [Google Scholar] [CrossRef]
  41. Librado, T.; Rozas, J. DnaSP v5: A software for comprehensive analyses of DNA polymorphism data. Bioinformatics 2009, 25, 1451–1452. [Google Scholar] [CrossRef]
  42. Suárez, J.; Bautista, J.M.; Almodóvar, A.; Machordom, A. Evolution of the Mitochondrial Control Region in Palaearctic Brown Trout (Salmo trutta) Populations: The Biogeographical Role of the Iberian Peninsula. Heredity 2001, 87, 198–206. [Google Scholar] [CrossRef]
  43. Sommani, E.; Sommani, E. Osservazioni sulla sistematica ed ecologia delle trote nell’Italia meridionale. Boll. Pesca Idrobiol. 1950, 5, 170–187. [Google Scholar]
  44. Duchi, A. Extant Because Important or Important Because Extant? On the Scientific Importance and Conservation of a Genetically Pure Sicilian Population of the Threatened Salmo cettii Rafinesque, 1810. Cybium 2020, 44, 41–44. [Google Scholar] [CrossRef]
  45. Sanz, N.; Cortey, M.; Pla, C.; García-Marín, J.L. Hatchery Introgression Blurs Ancient Hybridization between Brown Trout (Salmo trutta) Lineages as Indicated by Complementary Allozymes and MtDNA Markers. Biol. Conserv. 2006, 130, 278–289. [Google Scholar] [CrossRef]
  46. Splendiani, A.; Ruggeri, P.; Giovannotti, M.; Caputo Barucchi, V. Role of Environmental Factors in the Spread of Domestic Trout in Mediterranean Streams. Freshw. Biol. 2013, 58, 2089–2101. [Google Scholar] [CrossRef]
  47. Hansen, M.M.; Ruzzante, D.E.; Nielsen, E.E.; Mensberg, K.L.D. Microsatellite and Mitochondrial DNA Polymorphism Reveals Life-History Dependent Interbreeding between Hatchery and Wild Brown Trout (Salmo trutta L.). Mol. Ecol. 2000, 9, 583–594. [Google Scholar] [CrossRef] [PubMed]
  48. Vera, M.; Garcia-Marin, J.L.; Martinez, P.; Araguas, R.M.; Bouza, C. Identification and Conservation of Remnant Genetic Resources of Brown Trout in Relict Populations from Western Mediterranean Streams. Hydrobiologia 2013, 707, 29–45. [Google Scholar] [CrossRef]
  49. Sanz, N.; Fernández-Cebrián, R.; Casals, F.; Araguas, R.M.; García-Marín, J.L. Dispersal and Demography of Brown Trout, Salmo trutta, Inferred from Population and Family Structure in Unstable Mediterranean Streams. Hydrobiologia 2011, 671, 105–119. [Google Scholar] [CrossRef]
  50. Berrebi, P. Three Brown Trout Salmo trutta Lineages in Corsica Described through Allozyme Variation. J. Fish Biol. 2015, 86, 60–73. [Google Scholar] [CrossRef]
  51. Araguas, R.M.; Vera, M.; Aparicio, E.; Sanz, N.; Fernández-Cebrián, R.; Marchante, C.; García-Marín, J.L. Current Status of the Brown Trout (Salmo trutta) Populations within Eastern Pyrenees Genetic Refuges. Ecol. Freshw. Fish 2017, 26, 120–132. [Google Scholar] [CrossRef]
  52. Sanz, N.; Araguas, R.M.; Fernández-Cebrián, R.; Lobón-Cerviá, J. Factors modelling population structure in Brown trout Salmo trutta L.: Genetic monitoring of populations in Esva River (northwestern Spain). Hydrobiologia 2019, 837, 117–131. [Google Scholar] [CrossRef]
  53. García-Marín, J.L.; Utter, F.; Pla, C. Postglacial Colonization of Brown Trout in Europa Based on Distribuction of Allozyme Variants. Heredity 1999, 82, 46–56. [Google Scholar] [CrossRef]
  54. Pujolar, J.M.; Lucarda, A.N.; Simonato, M.; Patarnello, T. Restricted Gene Flow at the Micro- and Macro-Geographical Scale in Marble Trout Based on MtDNA and Microsatellite Polymorphism. Front. Zool. 2011, 8, 7. [Google Scholar] [CrossRef]
  55. Thaulow, J.; Borgstrøm, R.; Heun, M. Brown Trout Population Structure Highly Affected by Multiple Stocking and River Diversion in a High Mountain National Park. Conserv. Genet. 2013, 14, 145–158. [Google Scholar] [CrossRef]
  56. Klütsch, C.F.C.; Maduna, S.N.; Polikarpova, N.; Forfang, K.; Aspholm, P.E.; Nyman, T.; Eiken, H.G.; Amundsen, P.A.; Hagen, S.B. Genetic Changes Caused by Restocking and Hydroelectric Dams in Demographically Bottlenecked Brown Trout in a Transnational Subarctic Riverine System. Ecol. Evol. 2019, 9, 6068–6081. [Google Scholar] [CrossRef]
  57. Vera, M.; Martinez, P.; Bouza, C. Stocking Impact, Population Structure and Conservation of Wild Brown Trout Populations in Inner Galicia (NW Spain), an Unstable Hydrologic Region. Aquat. Conserv. Mar. Freshw. Ecosyst. 2018, 28, 435–443. [Google Scholar] [CrossRef]
  58. Sanz, N.; García-Marín, J.-L.; Pla, C. Divergence of Brown Trout (Salmo trutta) within Glacial Refugia. Can. J. Fish. Aquat. Sci. 2000, 57, 2201–2210. [Google Scholar] [CrossRef]
  59. Griffiths, A.M.; Bright, D.; Stevens, J.R.; Hashemzadeh Segherloo, I.; Farahmand, H.; Abdoli, A.; Bernatchez, L.; Primmer, C.R.; Swatdipong, A.; Karami, M.; et al. Phylogenetic Status of Brown Trout Salmo trutta Populations in Five Rivers from the Southern Caspian Sea and Two Inland Lake Basins, Iran: A Morphogenetic Approach. J. Fish Biol. 2009, 81, 1136–1142. [Google Scholar] [CrossRef]
  60. Vera, M.; Sanz, N.; Hansen, M.M.; Almodóvar, A.; García-Marín, J.-L. Population and Family Structure of Brown Trout, Salmo trutta, in a Mediterranean Stream. Mar. Freshw. Res. 2010, 61, 672–681. [Google Scholar] [CrossRef] [Green Version]
  61. Fumagalli, L.; Snoj, A.; Jesenšek, D.; Balloux, F.; Jug, T.; Duron, O.; Brossier, F.; Crivelli, A.J.; Berrebi, P. Extreme Genetic Differentiation among the Remnant Populations of Marble Trout (Salmo marmoratus) in Slovenia. Mol. Ecol. 2002, 11, 2711–2716. [Google Scholar] [CrossRef]
  62. Ayllon, F.; Moran, P.; Garcia-Vazquez, E. Maintenance of a Small Anadromous Subpopulation of Brown Trout (Salmo trutta L.) by Straying. Freshw. Biol. 2006, 51, 351–358. [Google Scholar] [CrossRef]
  63. Lobón-Cerviá, J. Why, When and How Do Fish Populations Decline, Collapse and Recover? The Example of Brown Trout (Salmo trutta) in Rio Chaballos (Northwestern Spain). Freshw. Biol. 2009, 54, 1149–1162. [Google Scholar] [CrossRef]
  64. García-Marín, J.L.; Sanz, N.; Pla, C. Proportions of Native and Introduced Brown Trout in Adjacent Fished and Unfished Spanish Rivers. Conserv. Biol. 1998, 12, 313–319. [Google Scholar] [CrossRef]
  65. Hansen, M.M. Estimating the Long-Term Effects of Stocking Domesticated Trout into Wild Brown Trout (Salmo trutta) Populations: An Approach Using Microsatellite DNA Analysis of Historical and Contemporary Samples. Mol. Ecol. 2002, 11, 1003–1015. [Google Scholar] [CrossRef]
  66. Hansen, M.M.; Nielsen, E.E.; Ruzzante, D.E.; Bouza, C.; Mensberg, K.-L.D. Genetic monitoring of supportive breeding in brown trout (Salmo trutta L.), using microsatellite DNA markers. Can. J. Fish. Aquat. Sci. 2000, 57, 2130–2139. [Google Scholar] [CrossRef]
  67. Meraner, A.; Baric, S.; Pelster, B.; Dalla Via, J. Microsatellite DNA Data Point to Extensive but Incomplete Admixture in a Marble and Brown Trout Hybridisation Zone. Conserv. Genet. 2010, 11, 985–998. [Google Scholar] [CrossRef]
  68. Marić, S.; Sušnik Bajec, S.; Schöffmann, J.; Kostov, V.; Snoj, A. Phylogeography of Stream-Dwelling Trout in the Republic of Macedonia and a Molecular Genetic Basis for Revision of the Taxonomy Proposed by S. Karaman. Hydrobiologia 2016, 785, 249–260. [Google Scholar] [CrossRef]
  69. Wofford, J.E.B.; Gresswell, R.E.; Banks, M.A. Influence of Barriers to Movement on Within-Watershed Genetic Variation of Coastal Cutthroat Trout. Ecol. Appl. 2005, 15, 628–637. [Google Scholar] [CrossRef]
  70. Raeymaekers, J.A.M.; Raeymaekers, D.; Koizumi, I.; Geldof, S.; Volckaert, F.A.M. Guidelines for Restoring Connectivity around Water Mills: A Population Genetic Approach to the Management of Riverine Fish. J. Appl. Ecol. 2009, 46, 562–571. [Google Scholar] [CrossRef] [Green Version]
  71. Birnie-Gauvin, K.; Larsen, M.H.; Nielsen, J.; Aarestrup, K. 30 Years of Data Reveal Dramatic Increase in Abundance of Brown Trout Following the Removal of a Small Hydrodam. J. Environ. Manag. 2017, 204, 467–471. [Google Scholar] [CrossRef] [Green Version]
Figure 1. Geographical location of Sicilian trout samples analyzed.
Diversity 15 00274 g001
Figure 2. Gene flow direction and migration rate (m) estimates, with its standard deviation in parentheses. Blue and black: downstream and upstream direction, respectively. Only values of m > 0.01 are indicated, and m > 0.1 are highlighted in bold. * Estimates from/to these locations could be highly biased because of its reduced sample size, and m rates were summarized in these cases (note that a low migration rate to San Giorgio (n = 13) comes from all but Volpe locations, whereas San Leonardo 2011 (n = 6) receives migration from all the other locations). A scheme of the Irminio River basin and the putative barriers to gene flow is also shown.
Diversity 15 00274 g002
Figure 3. Admixture analyses by STRUCTURE (a) at the highest level of hierarchy (k = 3) and (b) at the low level of hierarchy (Manghisi + Anapo k = 2; all samples k = 4). Each individual is represented as a vertical bar partitioned into segments according to the proportion of the genome belonging to each of the clusters identified (k).
Diversity 15 00274 g003
Figure 4. (a) Discriminant analysis of principal components (DAPC) of the 213 trout individuals. The right inset displays the DA eigenvalues in relative magnitude. (b) Probability of the cluster assignment for the DAPC with all individuals considering 11 populations. Each individual is represented as a vertical bar partitioned into segments colored according to its population ancestry.
Diversity 15 00274 g004
Table 1. Sample collections, geographic and genetic characterization.
Sample (Code)NA
(S.E.)
Ar
(S.E.)
PA
(freq > 0.1)
PAr
(S.E.)
HS
(S.E.)
qHAT
mtDNA*
Tellesimo (TE)242.125 (0.398)1.763 (0.257)00.12 (0.092)0.228 (0.077)00 (13)
Irminio 08 (IR08)104.5 (0.681)3.749 (0.523)00.23 (0.096)0.582 (0.096)0.350no data
Irminio 10 (IR10)336.125 (1.202)3.798 (0.524)1 (0)0.07 (0.031)0.575 (0.090)0.1670.150 (20)
Irminio 11 (IR11)235.25 (0.921)3.788 (0.533)1 (0)0.1 (0.090)0.587 (0.094)0.1960.176 (17)
Ciaramite (CIA)223.25 (0.526)2.832 (0.387)3 (0)0.02 (0.013)0.536 (0.082)0.4090 (10)
Mastratto (MST)255.375 (0.905)3.611 (0.506)3 (0)0.27 (0.157)0.558 (0.091)0.3330.25 (12)
San Leonardo 11 (SL11)63.25 (0.590)3.250 (0.590)00.02 (0.012)0.465 (0.105)0.1670 (5)
San Leonardo 21 (SL21)174.25 (0.559)3.701 (0.375)1 (0)0.05 (0.044)0.507 (0.082)0.1760 (7)
Volpe (VO)213.25 (0.559)2.666 (0.373)2 (0)0.13 (0.133)0.458 (0.085)0.2650 (12)
San Giorgio (SG)133.25 (0.13)2.923 (0.260)1 (1)0.15 (0.121)0.512 (0.064)0.3850.3 (10)
Irminio River1704.80
(0.37)
3.299 (0.393)10 (1)0.55 (0.185)0.531 (0.0116)0.2720.129 (93)
Anapo (ANA)114.625 (0.498)3.839 (0.374)6 (4)0.73 (0.299)0.607 (0.061)0.2270 (9)
Manghisi (MAN)84.625 (0.754)4.092 (0.613)3 (1)0.43 (0.229)0.567 (0.070)0.1250 (7)
N: sample size, A: average number of alleles per locus, Ar: allelic richness, PA: private alleles, PAr, private allele richness, HS: gene diversity, q: frequency of the exogenous hatchery allele LDH-C*90, HAT mtDNA*: proportion of mtDNA haplotypes of hatchery origin and sample size in parentheses.
Table 2. Pairwise genetic differentiation. Above diagonal: CS [30]. Below diagonal: FST and its significance in the permutation test. ***: p < 0.001, **: 0.001 < p < 0.01, *: 0.01 < p < 0.05 and ns: not significant. Sample codes refer to Table 1. Grey shading: comparisons between samples from the Irminio basin.
TEIR208IR10IR11CIAMSTSL11SL21VOSGANAMAN
TE-0.3950.3980.4120.4180.3880.4280.4020.3880.4320.5660.691
IR080.215 ***-0.2250.2150.2780.2350.4020.3240.3060.4010.5340.600
IR100.169 ***0.005 ns-0.1460.2510.2030.3370.2440.2810.3660.4920.548
IR110.186 ***−0.012 ns0.004 ns-0.2730.2090.3400.2400.2700.3860.5190.586
CIA0.293 ***0.042 *0.051 ***0.053 ***-0.3060.4180.2790.3280.4330.5560.646
MST0.184 ***−0.001 ns0.013 *0.012 ns0.077 ***-0.3630.3070.2910.3900.5330.601
SL110.361 ***0.134 **0.079 ***0.095 ***0.178 ***0.117 ***-0.3320.3530.4040.5900.614
SL210.237 ***0.056 **0.033 ***0.025 **0.068 ***0.065 ***0.112 ***-0.2820.3700.5230.595
VO0.258 ***0.063 **0.068 ***0.066 ***0.124 ***0.074 ***0.142 ***0.097 ***-0.3670.5750.669
SG0.294 ***0.090 ***0.060 ***0.080 ***0.137 ***0.098 ***0.107 **0.093 ***0.119 ***-0.5120.527
ANA0.453 ***0.253 ***0.240 ***0.253 ***0.267 ***0.273 ***0.306 ***0.280 ***0.356 ***0.259 ***-0.483
MAN0.571 ***0.326 ***0.300 ***0.317 ***0.347* **0.334 ***0.338 ***0.350 ***0.428 ***0.284 ***0.159 ***-
Table 3. AMOVA results of possible structures tested. Grouped samples are indicated in parentheses. Significance in the permutation test: ***: p < 0.001, **: 0.001 < p < 0.01; ns: not-significant.
Structure Tested (Samples Grouped)Variance Component% of TotalFixation Index
Temporal
(IR08 + IR10 + IR11)
Among groups0.32415.41FCT = 0.154 ***
Within groups0.0520.38FSC = 0.005 ns
k = 3, STRUCTURE
(Irminio basin; ANA + MAN)
Among groups0.51219.05FCT = 0.191 **
Within groups0.1595.93FSC = 0.073 ***
k = 4, STRUCTURE
(Irminio basin)
Among groups0.55620.52FCT = 0.205 **
Within groups0.1395.16FSC = 0.065 ***
Disclaimer/Publisher’s Note: The statements, opinions and data contained in all publications are solely those of the individual author(s) and contributor(s) and not of MDPI and/or the editor(s). MDPI and/or the editor(s) disclaim responsibility for any injury to people or property resulting from any ideas, methods, instructions or products referred to in the content.

