Article

The Effects of Vegetation and the Environment on Testate Amoeba Assemblages in Sphagnum Peatlands in the Northern Caucasus Mountains

by
Andrey N. Tsyganov
1,*,
Elena S. Chertoprud
2,
Natalia G. Mazei
1,
Anton S. Esaulov
3,4,
Ivan P. Sadchikov
5 and
Yuri A. Mazei
1,2,3
1
Department of General Ecology and Hydrobiology, Lomonosov Moscow State University, Leninskie Gory, Moscow 119991, Russia
2
A.N. Severtsov Institute of Ecology and Evolution, Leninsky Prospect, 33, Moscow 119071, Russia
3
Faculty of Biology, Shenzhen MSU-BIT University, Shenzhen 518100, China
4
Department of Microbiology, Epidemiology and Infectious Diseases, Penza State University, Krasnaya Str., 40, Penza 440068, Russia
5
Trofimuk Institute of Petroleum Geology and Geophysics, Siberian Branch, Russian Academy of Sciences, Pr. Akademika Koptyuga 3, Novosibirsk 630090, Russia
*
Author to whom correspondence should be addressed.
Diversity 2023, 15(2), 258; https://doi.org/10.3390/d15020258
Submission received: 30 December 2022 / Revised: 7 February 2023 / Accepted: 10 February 2023 / Published: 12 February 2023

Abstract

:
Understanding the interactions among the functional groups of living organisms within ecosystems is a main challenge in ecology. This question is particularly important in relation to the interactions between the above- and below-ground components of terrestrial ecosystems. We investigated the effects of macro- (geographic position and mire size) and micro-environmental (pH, water table depth, water mineralization and temperature) characteristics and vegetation composition (both vascular plants and bryophytes) on the species structure of testate amoeba assemblages in eight Sphagnum-dominated mires across the Northern Caucasus Mountains (Russia). In total, 97 testate amoeba species from 34 genera were identified. A multiple factor analysis indicated the strongest relationships between the species structure of the testate amoeba assemblages and the local vegetation, especially bryophytes, whereas the interaction with the micro-environmental characteristics was the weakest. Among the micro-environmental data, the strongest effects on the species composition of all the assemblages were detected for the pH followed by the water table depth and water temperature. The variance partitioning of the species structure of the testate amoeba assemblages in response to the abiotic and biotic data indicated that most of the variance was related to the bryophyte and vascular plant assemblages, whereas the contribution of the environmental data was lower. Moreover, most of the effects were highly related to each other, so that the proportion of the jointly explained variation was high, whereas the individual effects were much lower.

1. Introduction

Understanding the interactions among the functional groups of living organisms within ecosystems is a major challenge in ecology [1]. This question is particularly important when applied to the interactions between the above- and below-ground components of terrestrial ecosystems [2]. It has been shown that the above-ground vegetation influences the below-ground biological communities by driving changes in the litter quality, pH, soil moisture and other characteristics of the substrates [3,4]. On the other hand, the below-ground microbial diversity might affect a large number of ecosystem functions that influence the productivity, diversity and composition of plant communities [5,6]. The interrelations between the above- and below-ground communities attract considerable ecological interest and are well-investigated in many types of terrestrial ecosystems, including grasslands and forests [7,8,9,10], while peatlands remain considerably less studied [11,12].
Peatlands are ecosystems that accumulate large amounts of undecomposed organic material due to unbalanced production and decomposition processes [13]. As a result, mires play an important role in the global carbon cycle and store ca. 30% of the total organic carbon in the active part of the biosphere [14]. Pristine peatlands provide effective carbon sequestration through CO2 uptake from the atmosphere and its transformation into a long-lived pool of carbon as undecomposed peat [15]. The capture of CO2 by photosynthesis generally takes place at the mire surface, then some of the plant biomass dies and yields above-ground and below-ground litter and most of it is decomposed in situ, primarily by bacteria and fungi with the participation of protists and invertebrates [13]. Understanding the relationships between the above- and below-ground components in mires is especially urgent because these ecosystems are climate sensitive, and their carbon storage capacity might be greatly affected as a result of climate changes.
Testate amoebae represent the most abundant and diverse component of the belowground assemblages in peatlands [16]. Testate amoebae are a polyphyletic group of unicellular amoeboid eukaryotes with cells covered by a rigid shell [17]. In some ecosystems, they contribute up to 50% of the total microbial biomass [18] and represent a complex multilevel trophic system, including mixotrophic, bacterivorous and carnivorous organisms [19,20]. Testate amoebae have been used as model organisms for a wide range of ecological and bioindication studies, including those addressing questions of the iterations between the above- and below-ground components in mire and soil ecosystems [4,12,21,22,23,24]. In one of the first studies, Mitchell et al. [21] investigated the relationships among the testate amoebae, vegetation and water chemistry in five Sphagnum-dominated peatlands in Europe. A similar study was performed by Lamentowicz et al. [23], who focused on the relationships among a set of environmental variables, vegetation composition (vascular plants and mosses separately) and the species structure of moss-dwelling testate amoeba assemblages along a trophic gradient (from an oligotrophic bog to an extremely rich fen) in sub-alpine mires in the Upper Engagine (Swiss Alps). Koenig et al. [25] compared the relationships of testate amoebae, bryophytes and vascular plants with environmental variables (soil temperature, water table depth, micro-habitats and the carbon and nitrogen content of Sphagnum mosses) in four mires along a 1300 m altitudinal gradient in Switzerland. These studies have provided important estimates of the relationships between vascular plants, bryophytes and testate amoebae. However, they were geographically restricted.
The aim of the study is to describe the effects of the macro- and micro-environmental characteristics and vegetation composition (both vascular plants and bryophytes) on the species structure of testate amoeba assemblages in eight Sphagnum-dominated mires across the Northern Caucasus Mountains (Russia). The mires in the region are very diverse and characterized by a specific hydrological regime and mineral nutrition that results in a unique composition of mosses and vascular plants [26]. The previous studies on the testate amoeba assemblages in Sphagnum-dominated mires [27,28,29,30] and in water streams [31] in the region have revealed diverse assemblages of these microorganisms. The novelty of our study is the focus on the interactions among the functional groups of living organisms in the diverse Caucasus mires, which were not previously investigated to this respect.

2. Materials and Methods
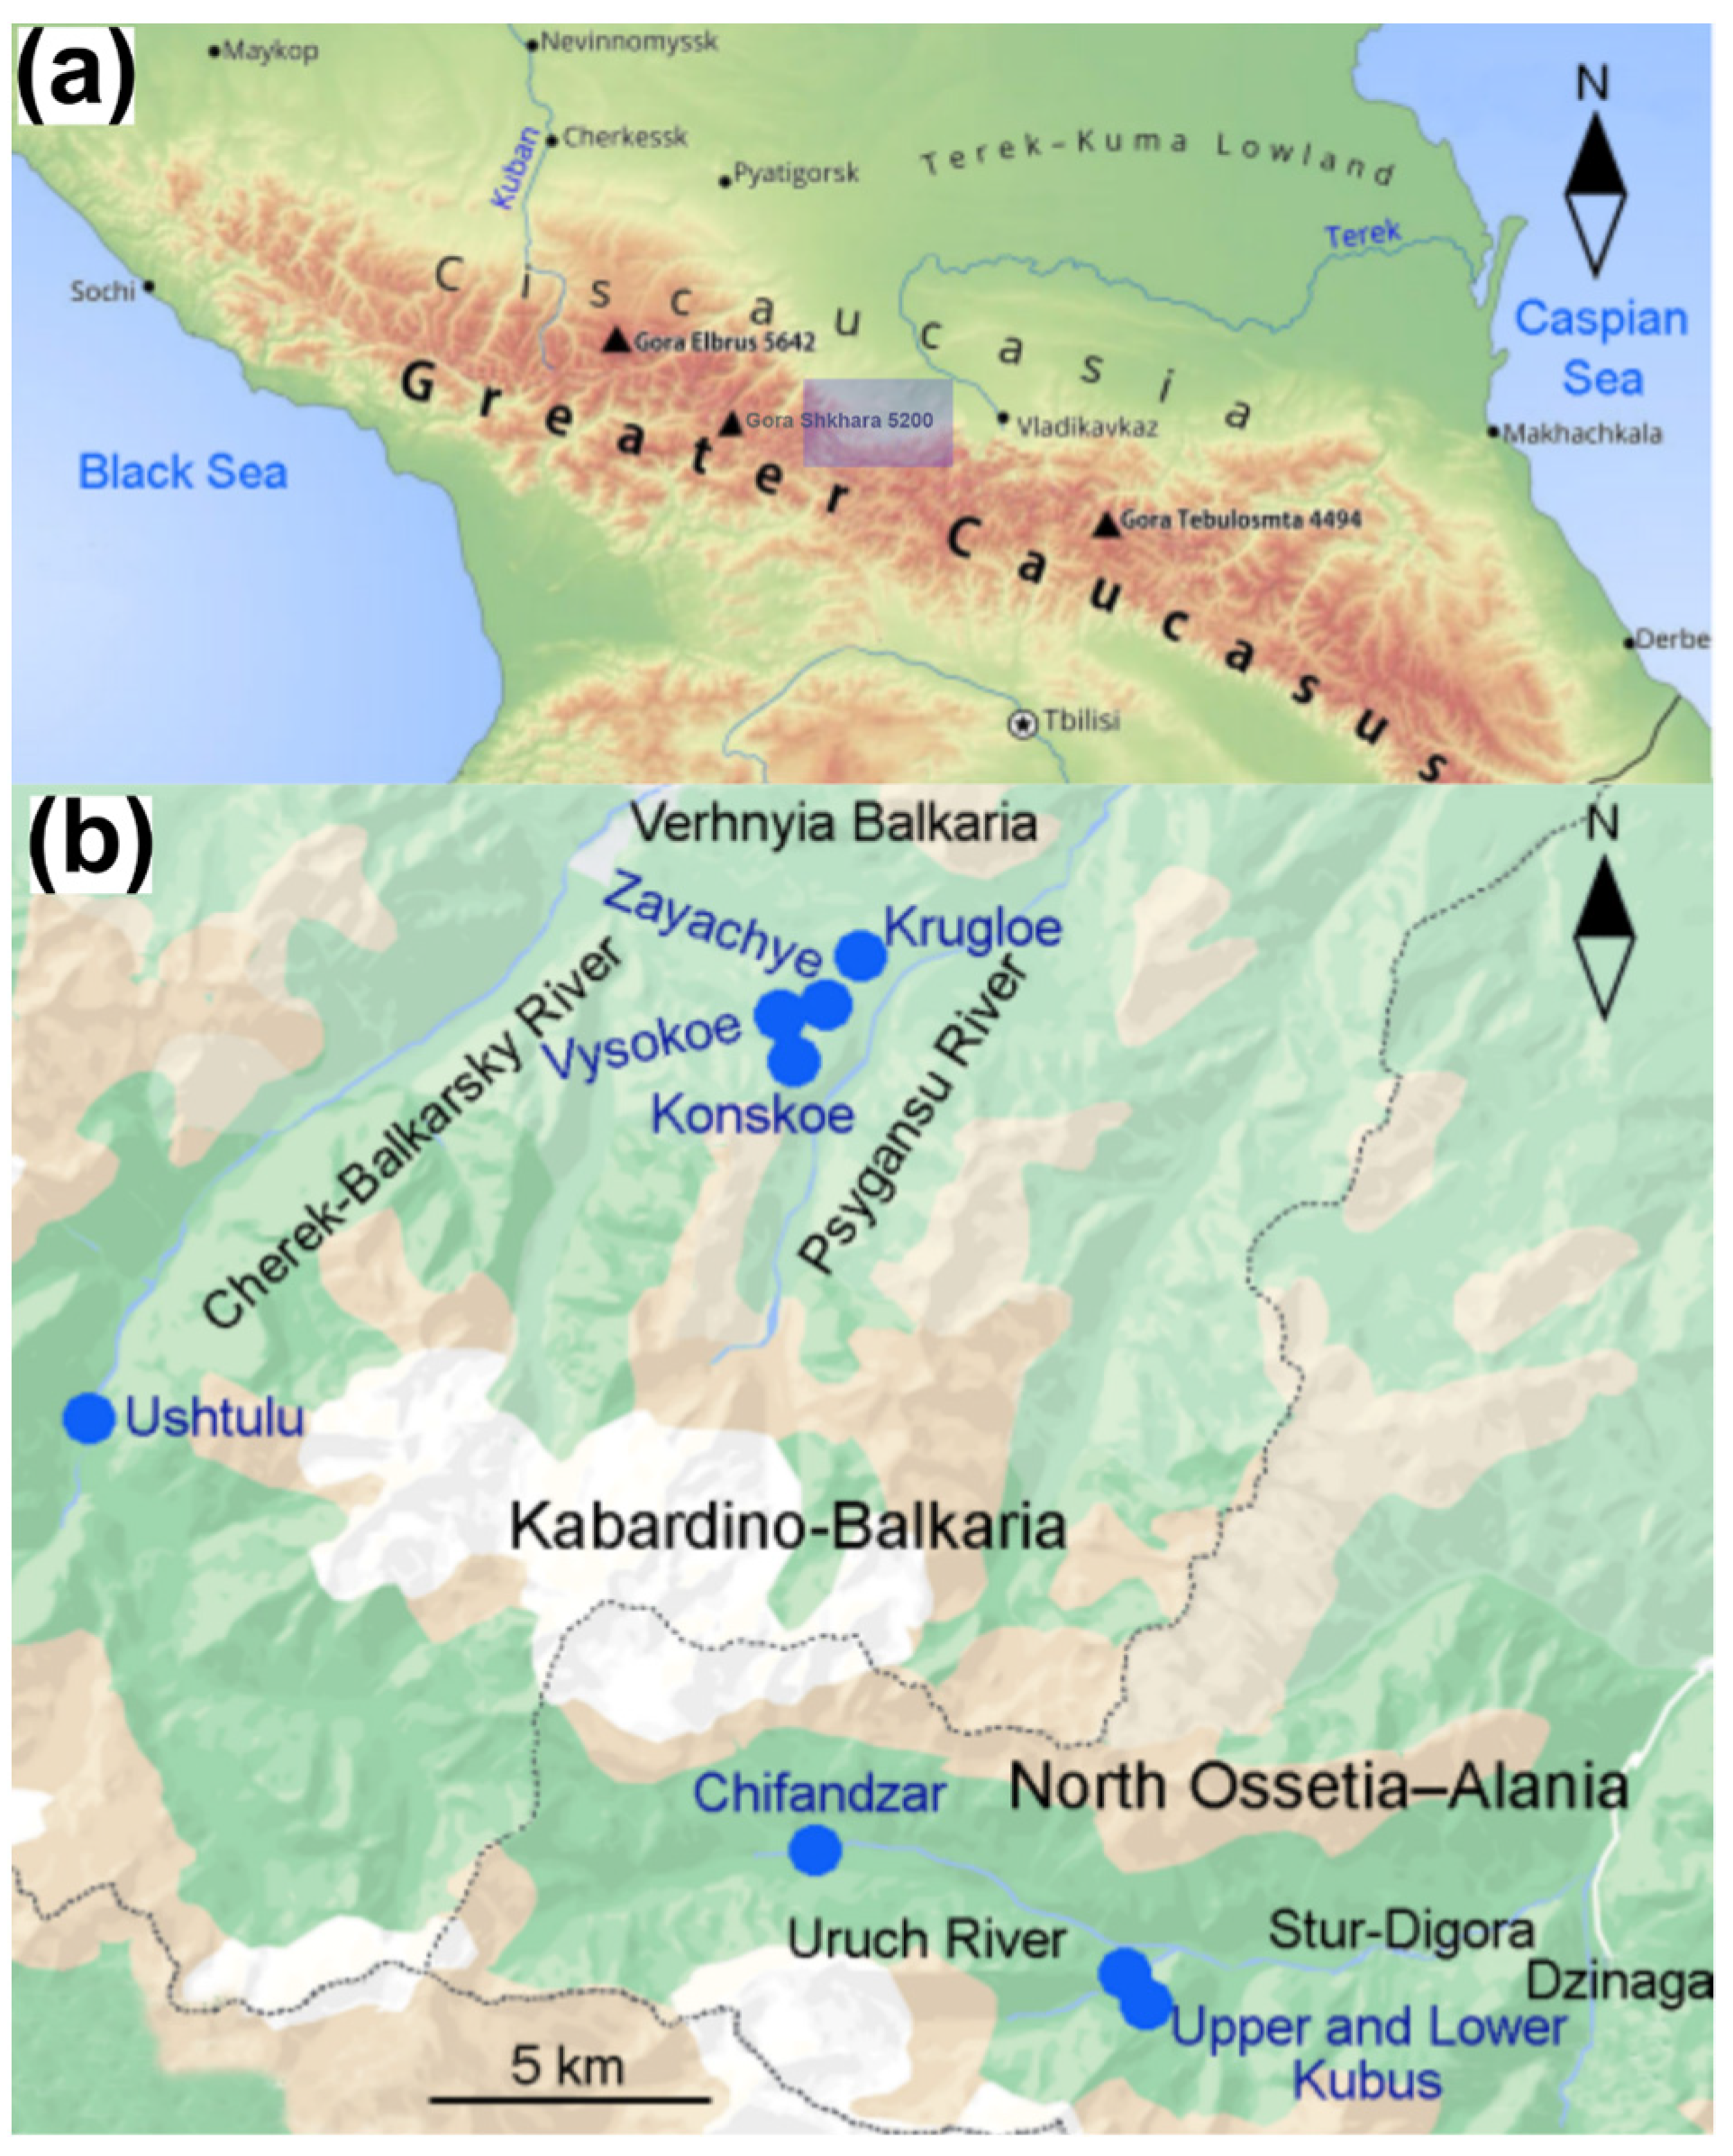
2.1. Study Region

The study was conducted in the Northern Caucasus Mountains (Figure 1a) in the territories of the Republic of North Ossetia-Alania and Kabardino-Balkaria. The climate of the region is moderately continental [32] with a mean annual air temperature of +8.6 °C and a mean annual precipitation of 540–670 mm yr−1. The mean air temperature of the coldest month (January) is −5 °C and the mean air temperature of the warmest month (July) is +21 °C [32]. The snow cover remains in the valleys for more than two months with an average depth of 5 cm [33]. The territory belongs to the Caucasus Mixed Forests ecoregion [34], which is characterized by a high biodiversity. Mountain mires occupy 0.1% of the area in the region and are generally located at the altitudes from 600 to 3400 m a.s.l. [35]. The mires are formed as a result of lake terrestrialization, overflows of mountain streams and waterlogging of mountain slopes [36], and were initiated between 4900–2500 years ago [37,38,39].

2.2. Study Sites

In total, eight Sphagnum-dominated mires were selected for the study (Figure 1b and Figure S1). The detailed description of most of the mires is provided in Prokin et al. [40]. The altitudes of the studied mires vary from 800 to 2300 m a.s.l. Three of them (Chifandzar and the Upper and Lower Kubus) are located in the National Park “Alania” (the Irafsky District, the Republic of North Ossetia-Alania). The Chifandzar mire was formed in the fluvial terrace above the floodplain on the left bank of the river Haresidon and is one of the largest mires in North Ossetia [40]. The vegetation is dominated by Carex spp., with a sparse Sphagnum cover [41], so the mire can be classified as eutrophic. This can be partly due to grazing at the mire itself and the adjacent slopes. The Upper and Lower Kubus mires are small, oligotrophic and dominated by Sphagnum mosses.
The other five mires are located in the in the Cherekskiy district of the Kabardino-Balkarian Republic. Four of them (Konskoe, Vysokoe, Zayachye and Krugloe) are near the village of Verkhnyaya Balkaria. All four mires are of lake origin [42] with remaining open water in the center of each of them. The vegetation is formed by Carex, Carex-Sphagnum and Sphagnum communities. These mires can be described as oligotrophic and partially meso-oligotrophic (Table 1). Sphagnum fuscum covers a considerable area in most of the mires, forming dense carpets on hummocks and in lawns. Molinia coerulea is present in the Konskoe and Zayachye mires, which might indicate recent fires. The Ushtulu mire is located in the Kabardino-Balkaria State High-Mountain Reserve and is dominated by Carex spp., Comarum sp. and Sphagnum spp. This mire was formed on a mountain slope and fed by mineral rich groundwater (so-called “hanging mire”).

2.3. Field Sampling and Measurements

The surface moss samples for the testate amoeba analysis were collected on 8–12 June 2020. In each mire, the main types of vegetation communities were identified (Table 1) and their vascular plant composition was recorded in the field as presence–absence (incidence data), according to Maevskiy [43]. Within each vegetation type, two biotopes (e.g., a hummock, a flat carpet/lawn or a depression) were sampled in three replicates (~10 m away from each other). The surface Sphagnum layers (undecomposed, to the depth of 6 cm) were carefully extracted from an area of 20 cm2 with scissors. The samples were placed in ziplock plastic bags and stored at +5 °C before the analysis. In total, 84 samples were collected. At each sampling site, the water table depth (WTD) was measured in a 0.5 m deep hollow in relation to the mire surface with a measuring tape. In addition to that, in the carpet/lawn biotopes where sufficient volumes of ground water could be collected, we measured the acidity (pH), mineralization (ppm) and temperature with a portable multi-parameter analyzer YIERYI (Shen Zhen Yage Technology Co., Ltd., Shenzhen, China). The geographical coordinates, altitude and area of the mires were defined with a handheld GPS receiver Etrex 30 (Garmin, Olathe, KS, USA). The species composition (presence–absence) of the bryophytes in the sampled substrate was determined in the laboratory following Ignatov and Ignatova [44,45].

2.4. Testate Amoeba Analysis

The samples for the testate amoeba analysis were prepared following the method based on suspension in water, physical agitation and subsequent sedimentation [46]. Three grams of the substrate were soaked in distilled water for 24 h, agitated on a flask shaker for 10 min, sieved and washed through a 0.5-mm mesh to remove coarse material and then left for sedimentation for 24 h. The supernatant was decanted off to concentrate the samples to the volume of 10 mL, the samples were mixed with neutralized formaldehyde and placed in glass vials for storage. A drop of the concentrate was placed on a microscopic slide, mixed with glycerol and inspected at 200× magnification. All the encountered testate amoebae were identified following the morphology-based approach and counted according to the identification guides [17,47] with the aim of 150 tests per sample. The identification of the testate were based on the following morphological criteria: shell shape, shell size (i.e., shell length, shell width, shell thickness), shell cover type, pseudostome shape and position and the presence of other taxonomical features. Most of these criteria have been shown to be directly linked to the phylogenetic divergence of the testate amoebae reconstructed using the molecular approach [48,49] and to be related to ecosystem functioning [50]. The identification was performed with the highest possible taxonomic resolution whenever possible [51].

2.5. Data Analyses

The data were analyzed and plotted using the R language environment [52] with the packages ‘vegan’ [53], ‘FactoMiner’ [54] and ‘ggplot2’ [55]. In total, five data sets were used in the analysis: (1) the macro-environmental variables (quantitative: latitude, degrees; longitude, degrees; altitude, m; and mire size, km2), (2) the micro-environmental characteristics (quantitative: water table depth, cm; acidity, pH; mineralization, ppm; and water temperature, °C), (3) the vascular plant species composition (presence–absence), (4) the bryophyte species composition (presence–absence) and (5) the species structure of the testate amoeba assemblages (relative abundances). The correlations between the micro-environmental variables were estimated with Spearman’s coefficient. To explore the relationships among the collected data sets, we used a multifactor analysis (MFA), which proposed a symmetrical, exploratory point of view, where the correlative structures were exposed without any reference to a directionality of the possible causal relationships [56]. The similarity between the geometrical representations derived from each group of variables was measured by the RV coefficients which varied between zero and one and could be tested by the permutations [57]. The MFA analysis was performed in two variants. The first one included the vegetation composition as a single data set and the second vegetation composition was split into vascular plants and bryophytes to estimate their contributions separately. The testate amoebae data were Hellinger-transformed [58].
The effects of the environmental variables on the species composition of testate amoebae were analyzed with a redundancy analysis (RDA). The contribution of each data set and the environmental variables for the explanation of the variance in the species structure of testate amoebae was tested in the variance partitioning procedure performed with a partial RDA. The effect of each data set or each factor in the model was assessed by partialling out the effects of all the other explanatory variables, which were added to the model as covariates [59]. The unadjusted R2 values were corrected following [60] with the function ‘RsquareAdj()’ in the package ‘vegan’ [53]. The significance of the models was tested with 999 Monte Carlo permutations.

3. Results

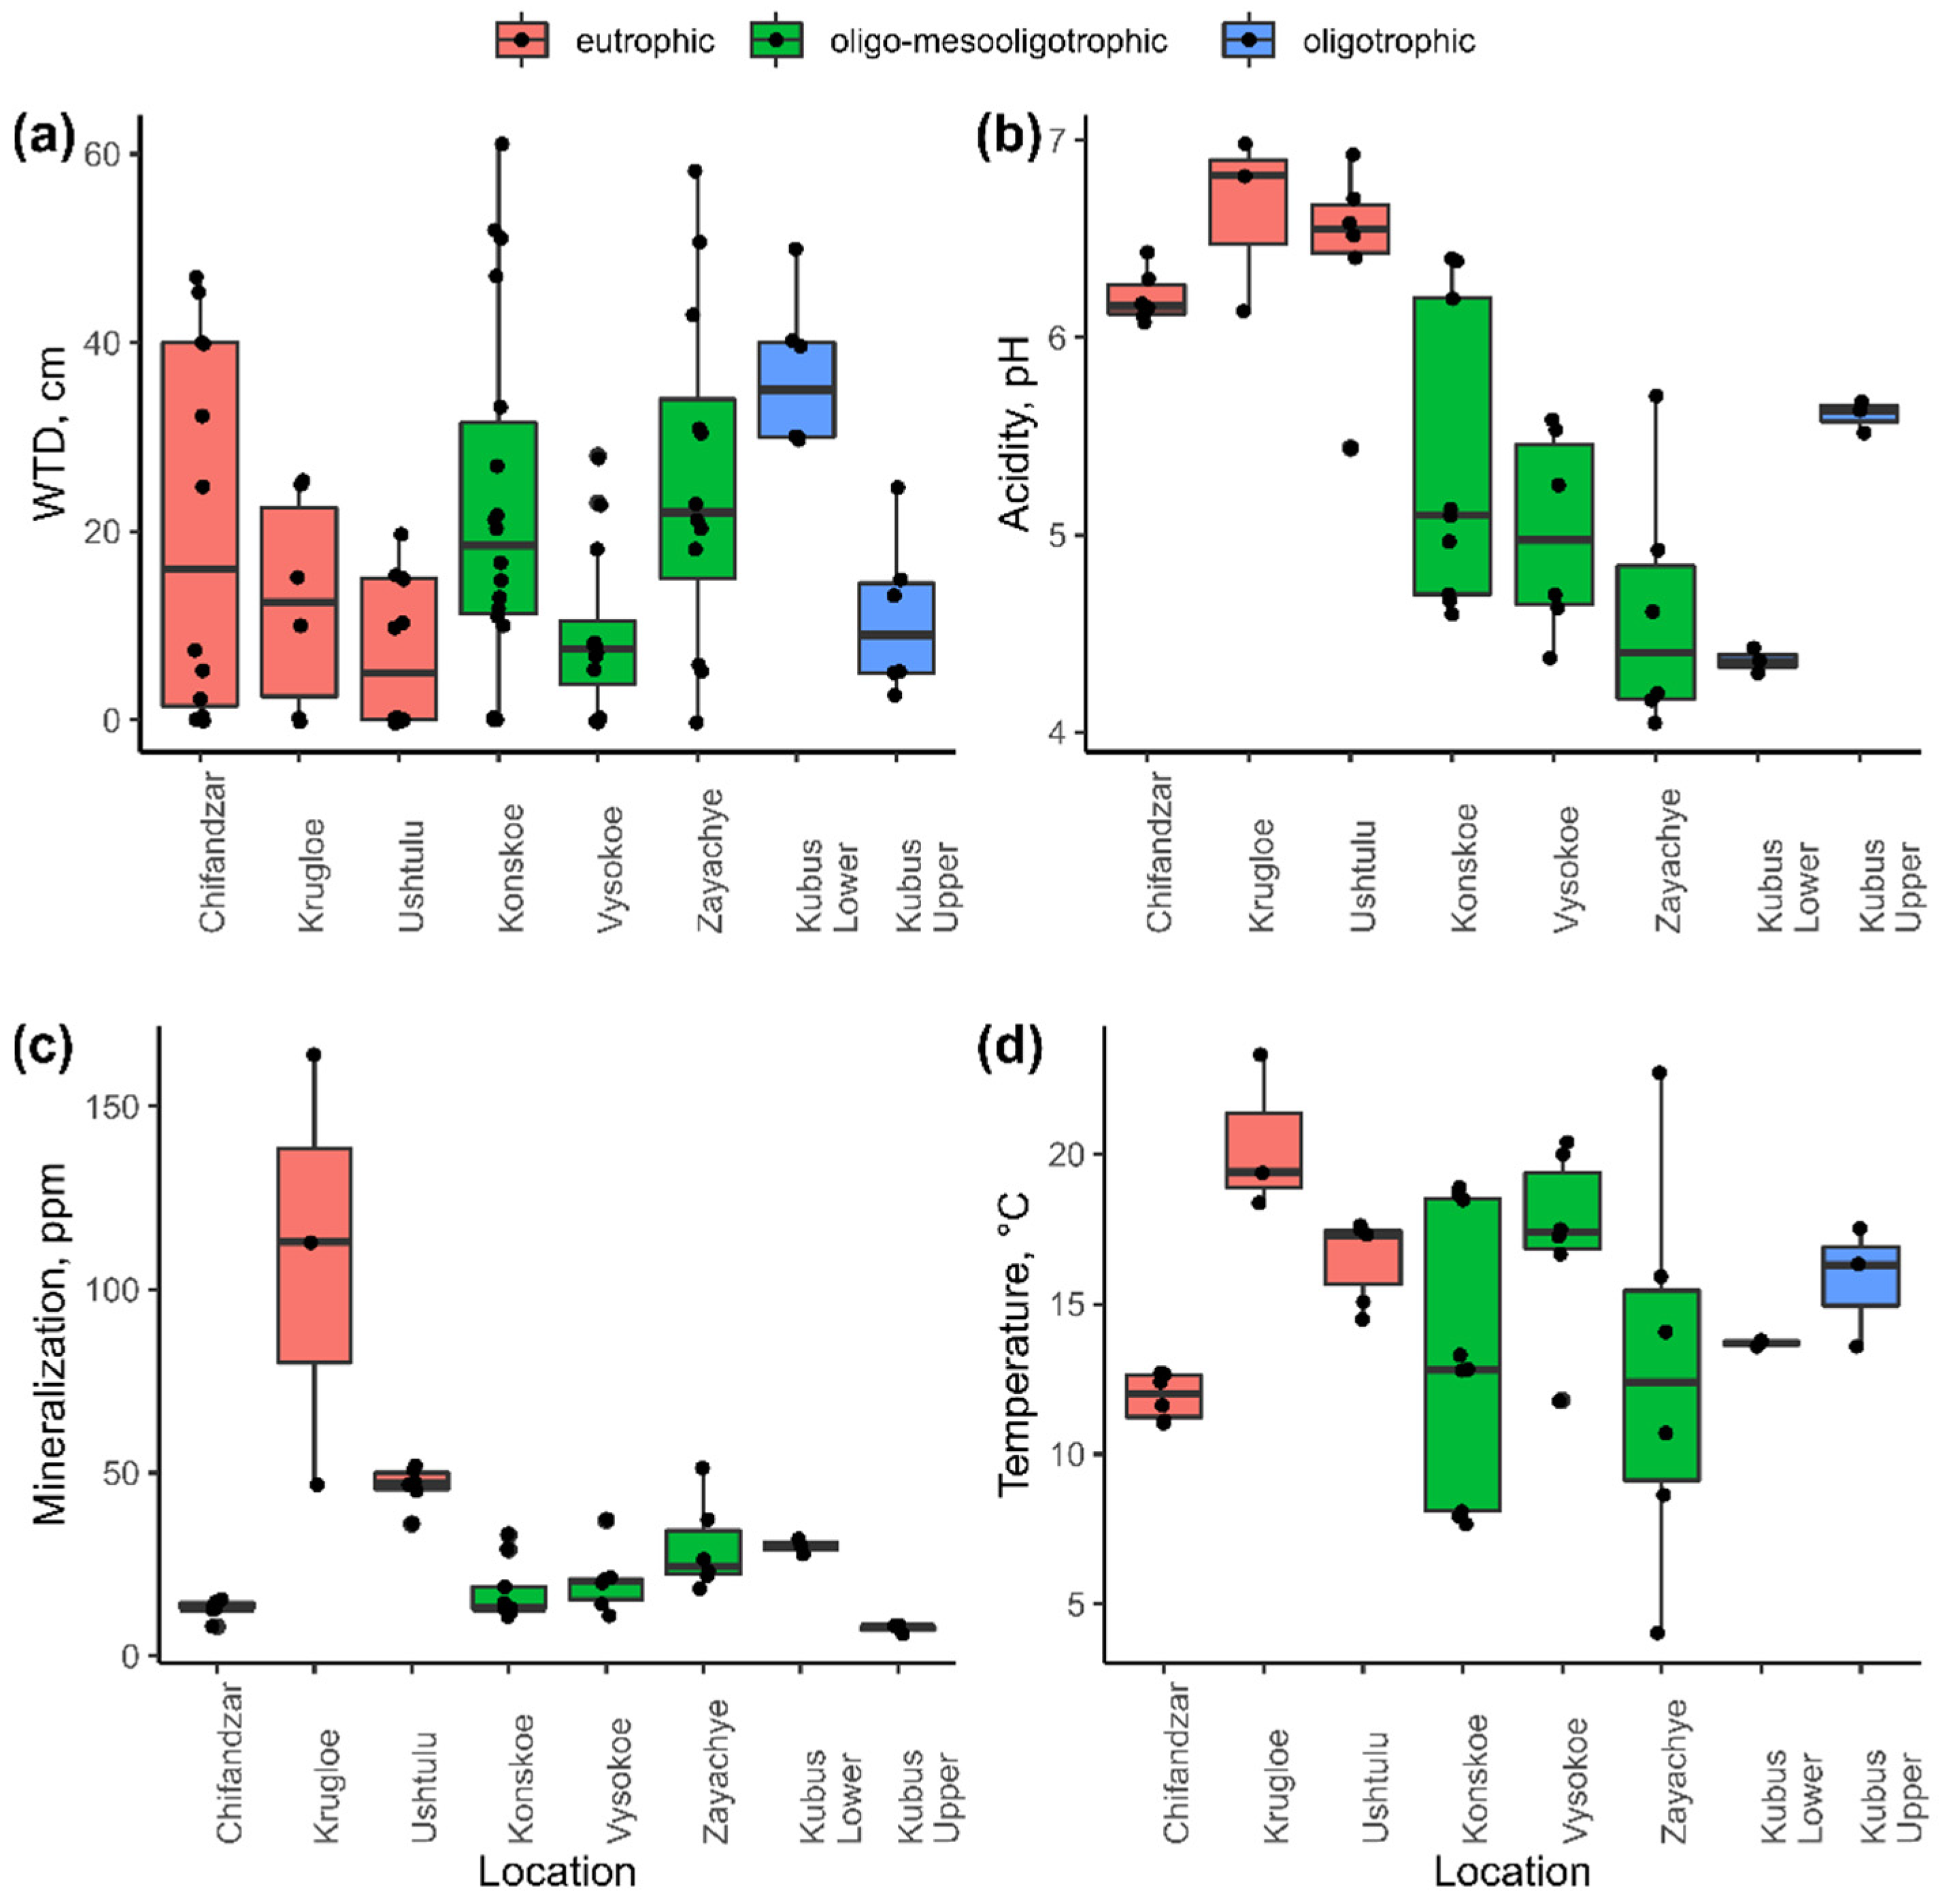
3.1. Variation in Environmental Characteristics

The water table depths in the studied locations varied from 0 to 61 cm with a considerable number (32 observations) of wet (WTD < 10 cm) biotopes (Figure 2 and Figure S2). The driest mire was the Lower Kubus (22.9 ± 18.8 cm, SD), whereas the other mires were characterized by lower average WTD values, which varied in the range from 7.10 to 36.7 cm. The acidity changed from 4.05 to 6.98 pH. The eutrophic mires were less acidic (pH 5.44–6.98) compared to the meso- and oligotrophic mires (pH 4.05–6.40). The mineralization, in general, wase low (<60 ppm), except for the Krugloe mire where it varied from 47 to 164 ppm, probably indicating local inputs of ions. The water temperature at the moment of sampling was variable, varying from 4.0 to 23.3 °C. The correlation analysis of the environmental variables (Table 2) indicated that the WTD was negatively related to the acidity and water temperature. Moreover, the water temperature was positively correlated to the mineralization and pH (Table 2), which can be explained by the fact that deep waters are typical for ombrotrophic bogs (with lower pH). As a result, water is warmed less there due to a thicker moss layer isolating it from the surface. Overall, the analysis of the variation of the environmental variables indicated a wide gradient of environmental variables in the studied biotopes covering the various trophic states of the mires.

3.2. General Characteristics of the Testate Amoeba, Vascular Plant and Bryophyte Assemblages

In total, 11,875 individuals of testate amoeba were found and identified. They belonged to 97 taxa and 34 genera (Table S1). The most abundant taxa (with a relative abundance to the total count greater than 3%) were Trinema lineare (22.7%), Assulina muscorum (15.3%), Cryptodifflugia oviformis (14.3%), Hyalosphenia papilio (11%), Trinema enchelys (10.2%), Corythion dubium (5.1%) and Euglypha rotunda (3.3%). The most common species (with an occurrence greater than 40% of the samples) were Trinema lineare (92.9%), Assulina muscorum (83.3%), Cryptodifflugia oviformis (63.1%), Trinema enchelys (54.8%), Corythion dubium (51.2%), Euglypha rotunda (44%) and Hyalosphenia papilio (40.5%). Twenty-three species were encountered in one sample only (the maximal relative abundance per sample was less than 0.1%). The number of testate amoeba taxa per sample varied from three to 24 with the mean value of 10.9 ± 5.44 (SD; n = 84).
The most common vascular plants (encountered in >10% of all samples) observed on the sampling sites were Carex spp. (51%), Eriophorum vaginatum (29%), Empetrum sp. (14%) and Calamagostris sp. (13%). Among the bryophytes, the most common were Polytrichum strictum (19%), Sphagnum capillifolium (15.5%), Sphagnum divinum (14.3%), Calliergon richardsonii (13.1%), Sphagnum teres (11.9%) and Sphagnum russowii (10.7%). Overall, the composition of the vascular plant, bryophyte and testate amoeba assemblages was diverse and typical for the Sphagnum-dominated mires.

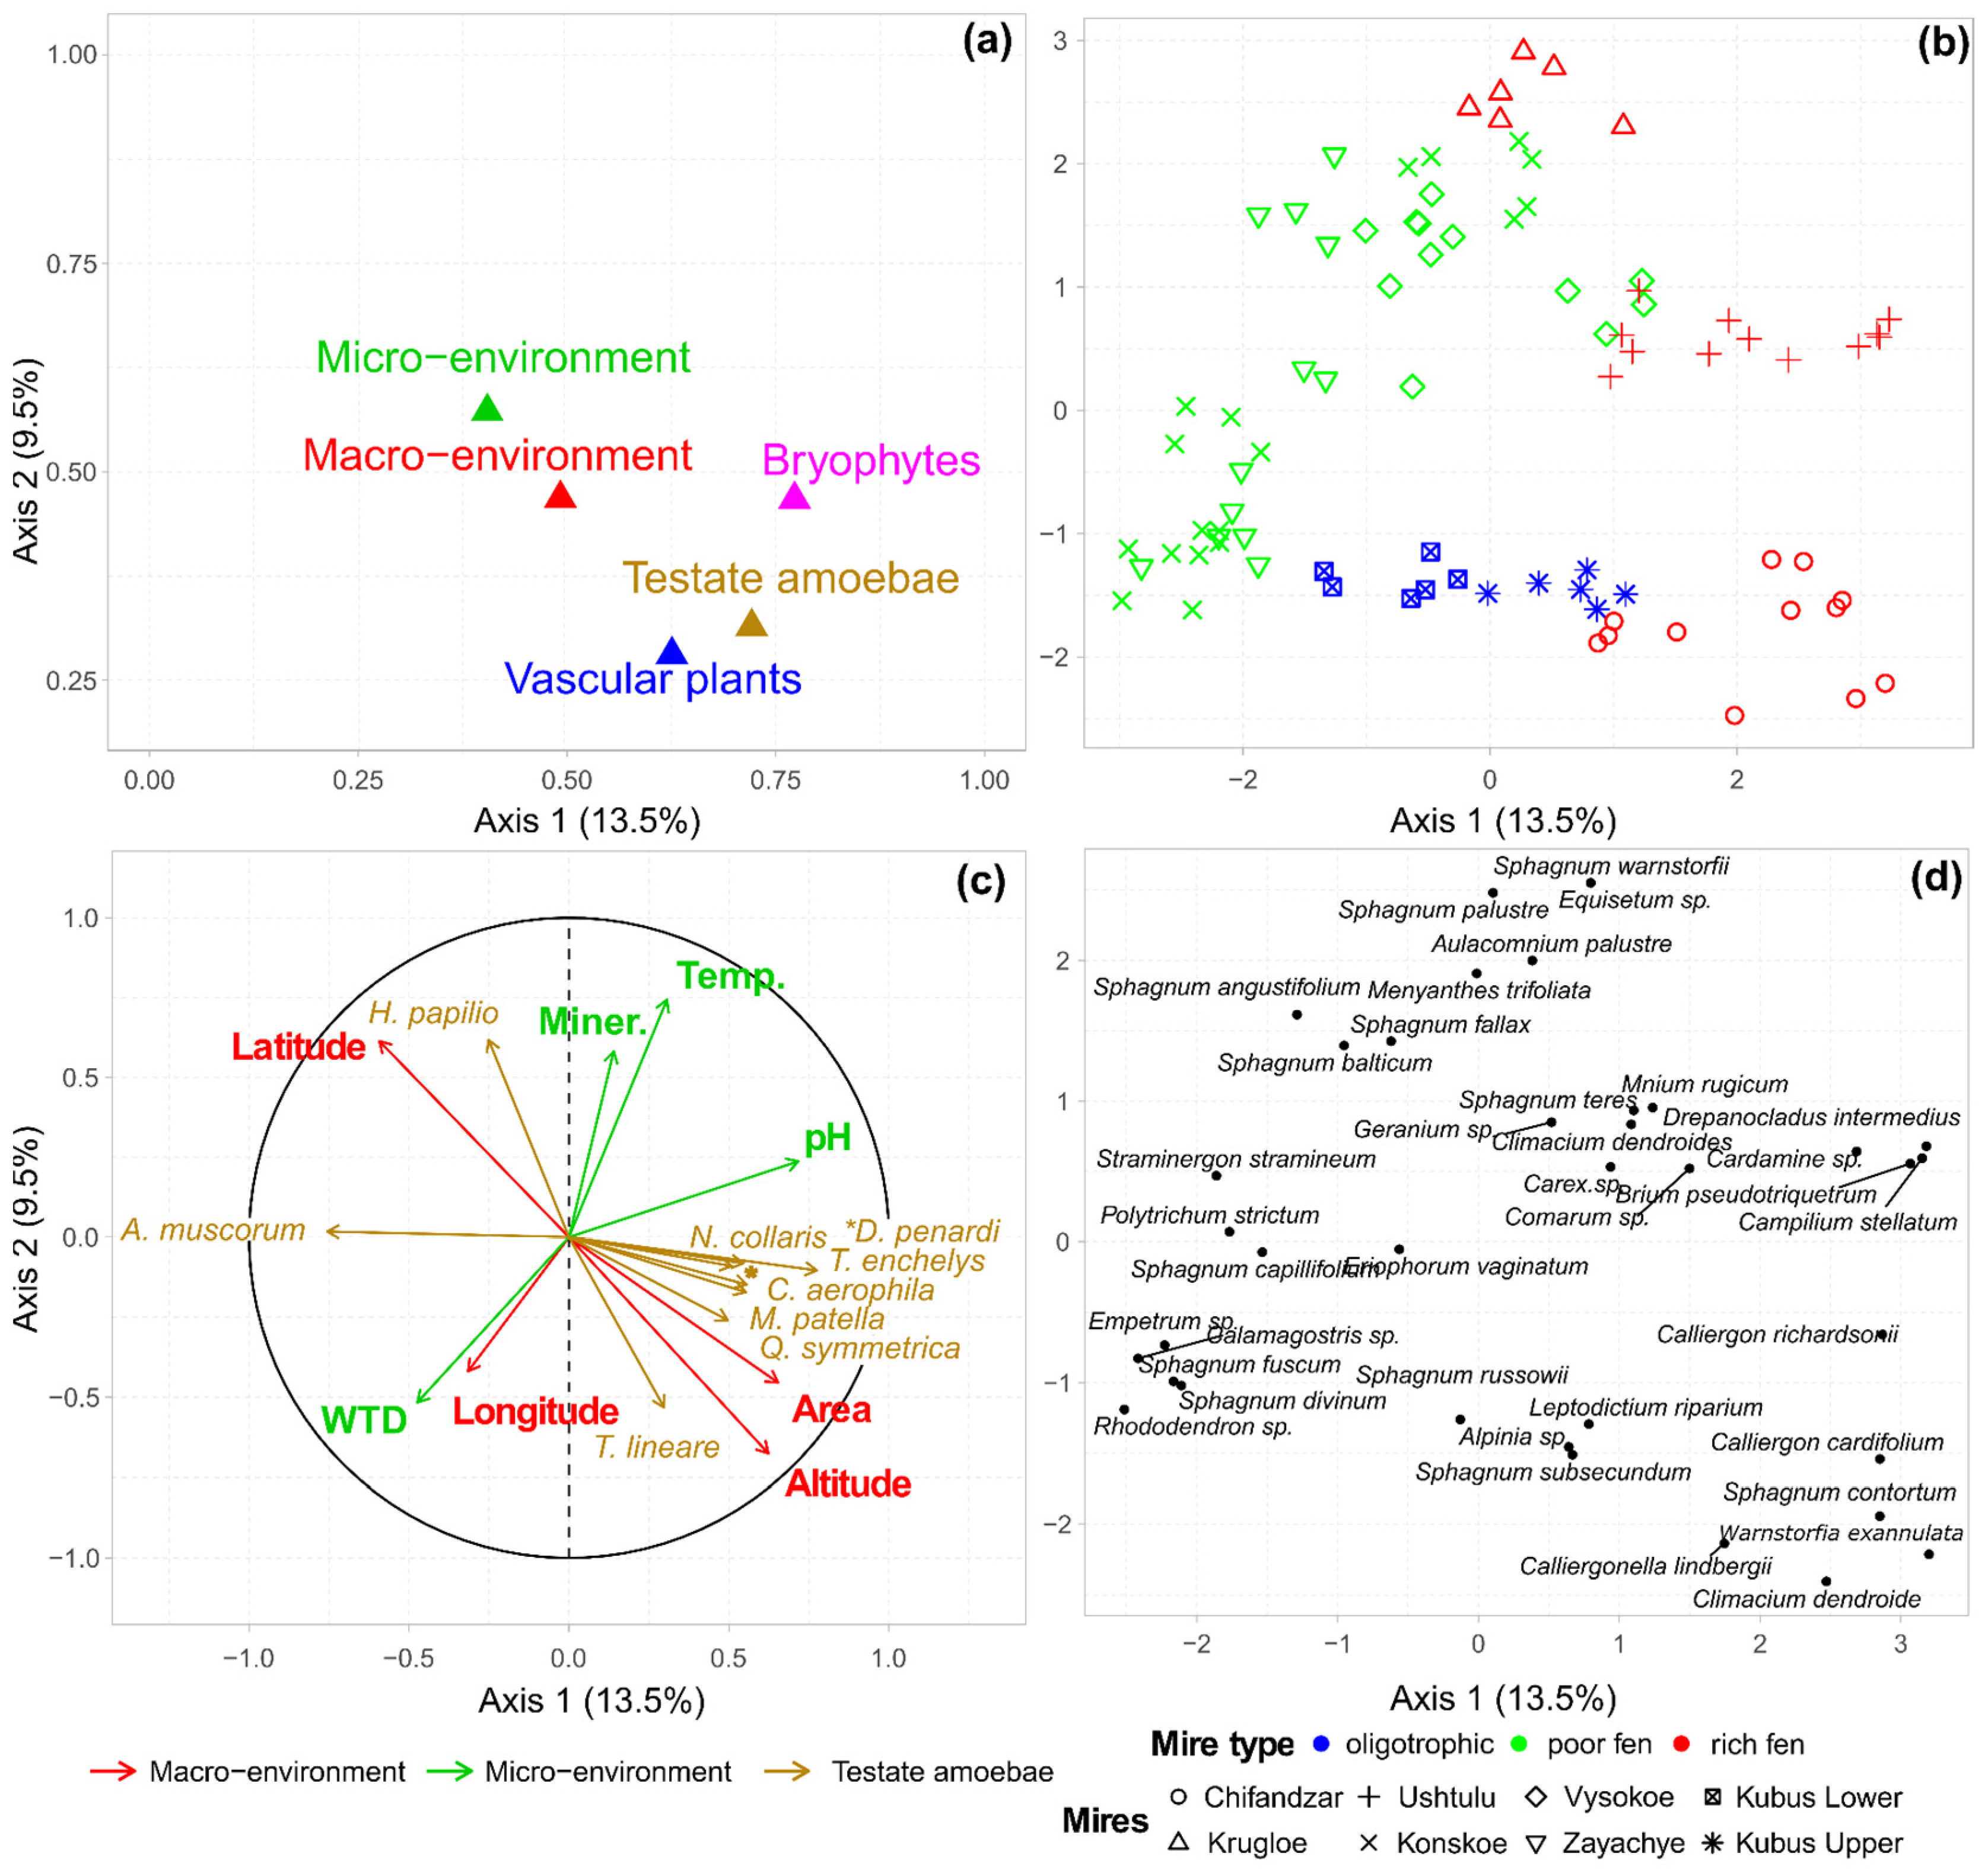
3.3. Multiple Factor Analysis of the Environment, Vegetation and Testate Amoeba Data

The variation in the vegetation (both vascular plants and bryophytes) and testate amoeba assemblages contributed the most to the results of the global MFA ordination (Table 3, the MFA line). These data sets mostly contributed to the first MFA axis, whereas the macro- and micro-environment data were associated with the second MFA axis (Figure 3a). The position of the samples in the multiple factor analysis (Figure 3b) shows the acidic and trophic gradients across the studied mires. The 1st axis explains 13.5% of the total variance and is generally related to the mire acidity with the most acidic mires (e.g., Zayachye, Lower Kubus, Kosnskoe and Vysokoe) located on the left side, whereas the sites characterized by greater pH values are on the right (Chifandzar and Ushtulu). This axis is also positively related to the size of the mires and the altitude. The 2nd axis explains 9.3% of the total variance and is positively related to the trophic gradient and water temperature, i.e., the samples with a lower mineralization and water temperature (Chifandzar and Upper Kubus) are located at the lower part of the plot, whereas the sites with a high mineralization and water temperature (Krugloe and Ushtulu) are at the top. The driest sites (Konskoe, Zayachye and Lower Kubus) are located in the bottom right corner of the plot and are positively related to the longitude.
The projections of the qualitative and quantitative biological data (Figure 3c,d) demonstrate that dry, acidic and oligotrophic sites (Konskoe, Zayachye and Lower Kubus) were associated with the vascular plants Eriophorum vaginatum, Calamagostris sp., Empetrum sp., Rhododendron sp.; mosses Polytrichum strictum, Sphagnum fuscum, Sphagnum russowii and Sphagnum divinum; and a testate amoeba taxon Assulina muscorum. The acidic sites with greater wetness and mineralization were characterized by Sphagnum balticum, Sphagnum angustifolium and Sphagnum fallax and a high abundance of a testate amoeba Hyalosphenia papilio. The wet and mineral rich biotopes were associated with the presence of Equisetum sp. and mosses Sphagnum wanstorfii and Aulacomnium palustre. The relatively dry sites with neutral environments in large mires were characterized by a number of mosses (Climaticum dendroide, Warnstrorfia exannulana, Caliergonella lindgergii etc.) and a testate amoeba Trinema lineare. In the wetter biotopes with neutral environments, the vascular plant Cardamine sp.; mosses Drepanocladus intermdius and Campilium stellatum; and testate amoebae Trinema enchelys, Nebela collaris, Difflugia penardi, Centropyxis aculeata and Quadrulella symmetrica were present.
The patterns of the species–environment relationships are further illustrated by the RV coefficients (Table 3). The first MFA, in which the vegetation data were included as a single set, indicated that the highest correlations were observed between the testate amoebae, macro-environmental variables (RV = 0.38) and vegetation (RV = 0.37), while the RV coefficients for the vegetation with the macro- and micro-environment were lower (RV = 0.33). In the second MFA, when the vegetation data set was split into vascular plants and bryophytes, the testate amoebae were more strongly correlated to the bryophytes (RV = 0.35) than to the vascular plants (RV = 0.27), whereas the vascular plants and bryophytes were characterized by the highest RV values (RV = 0.41). The RV values for the vascular plants and bryophytes on the one hand and the macro- and micro-environmental variables on the other were lower and varied in the range 0.25–0.30. Overall, these findings indicate a stronger effect of the local vegetation, especially mosses, on the species structure of the testate amoeba assemblages with a lower effect of the macro-environmental variables and the lowest values of the micro-environmental characteristics.

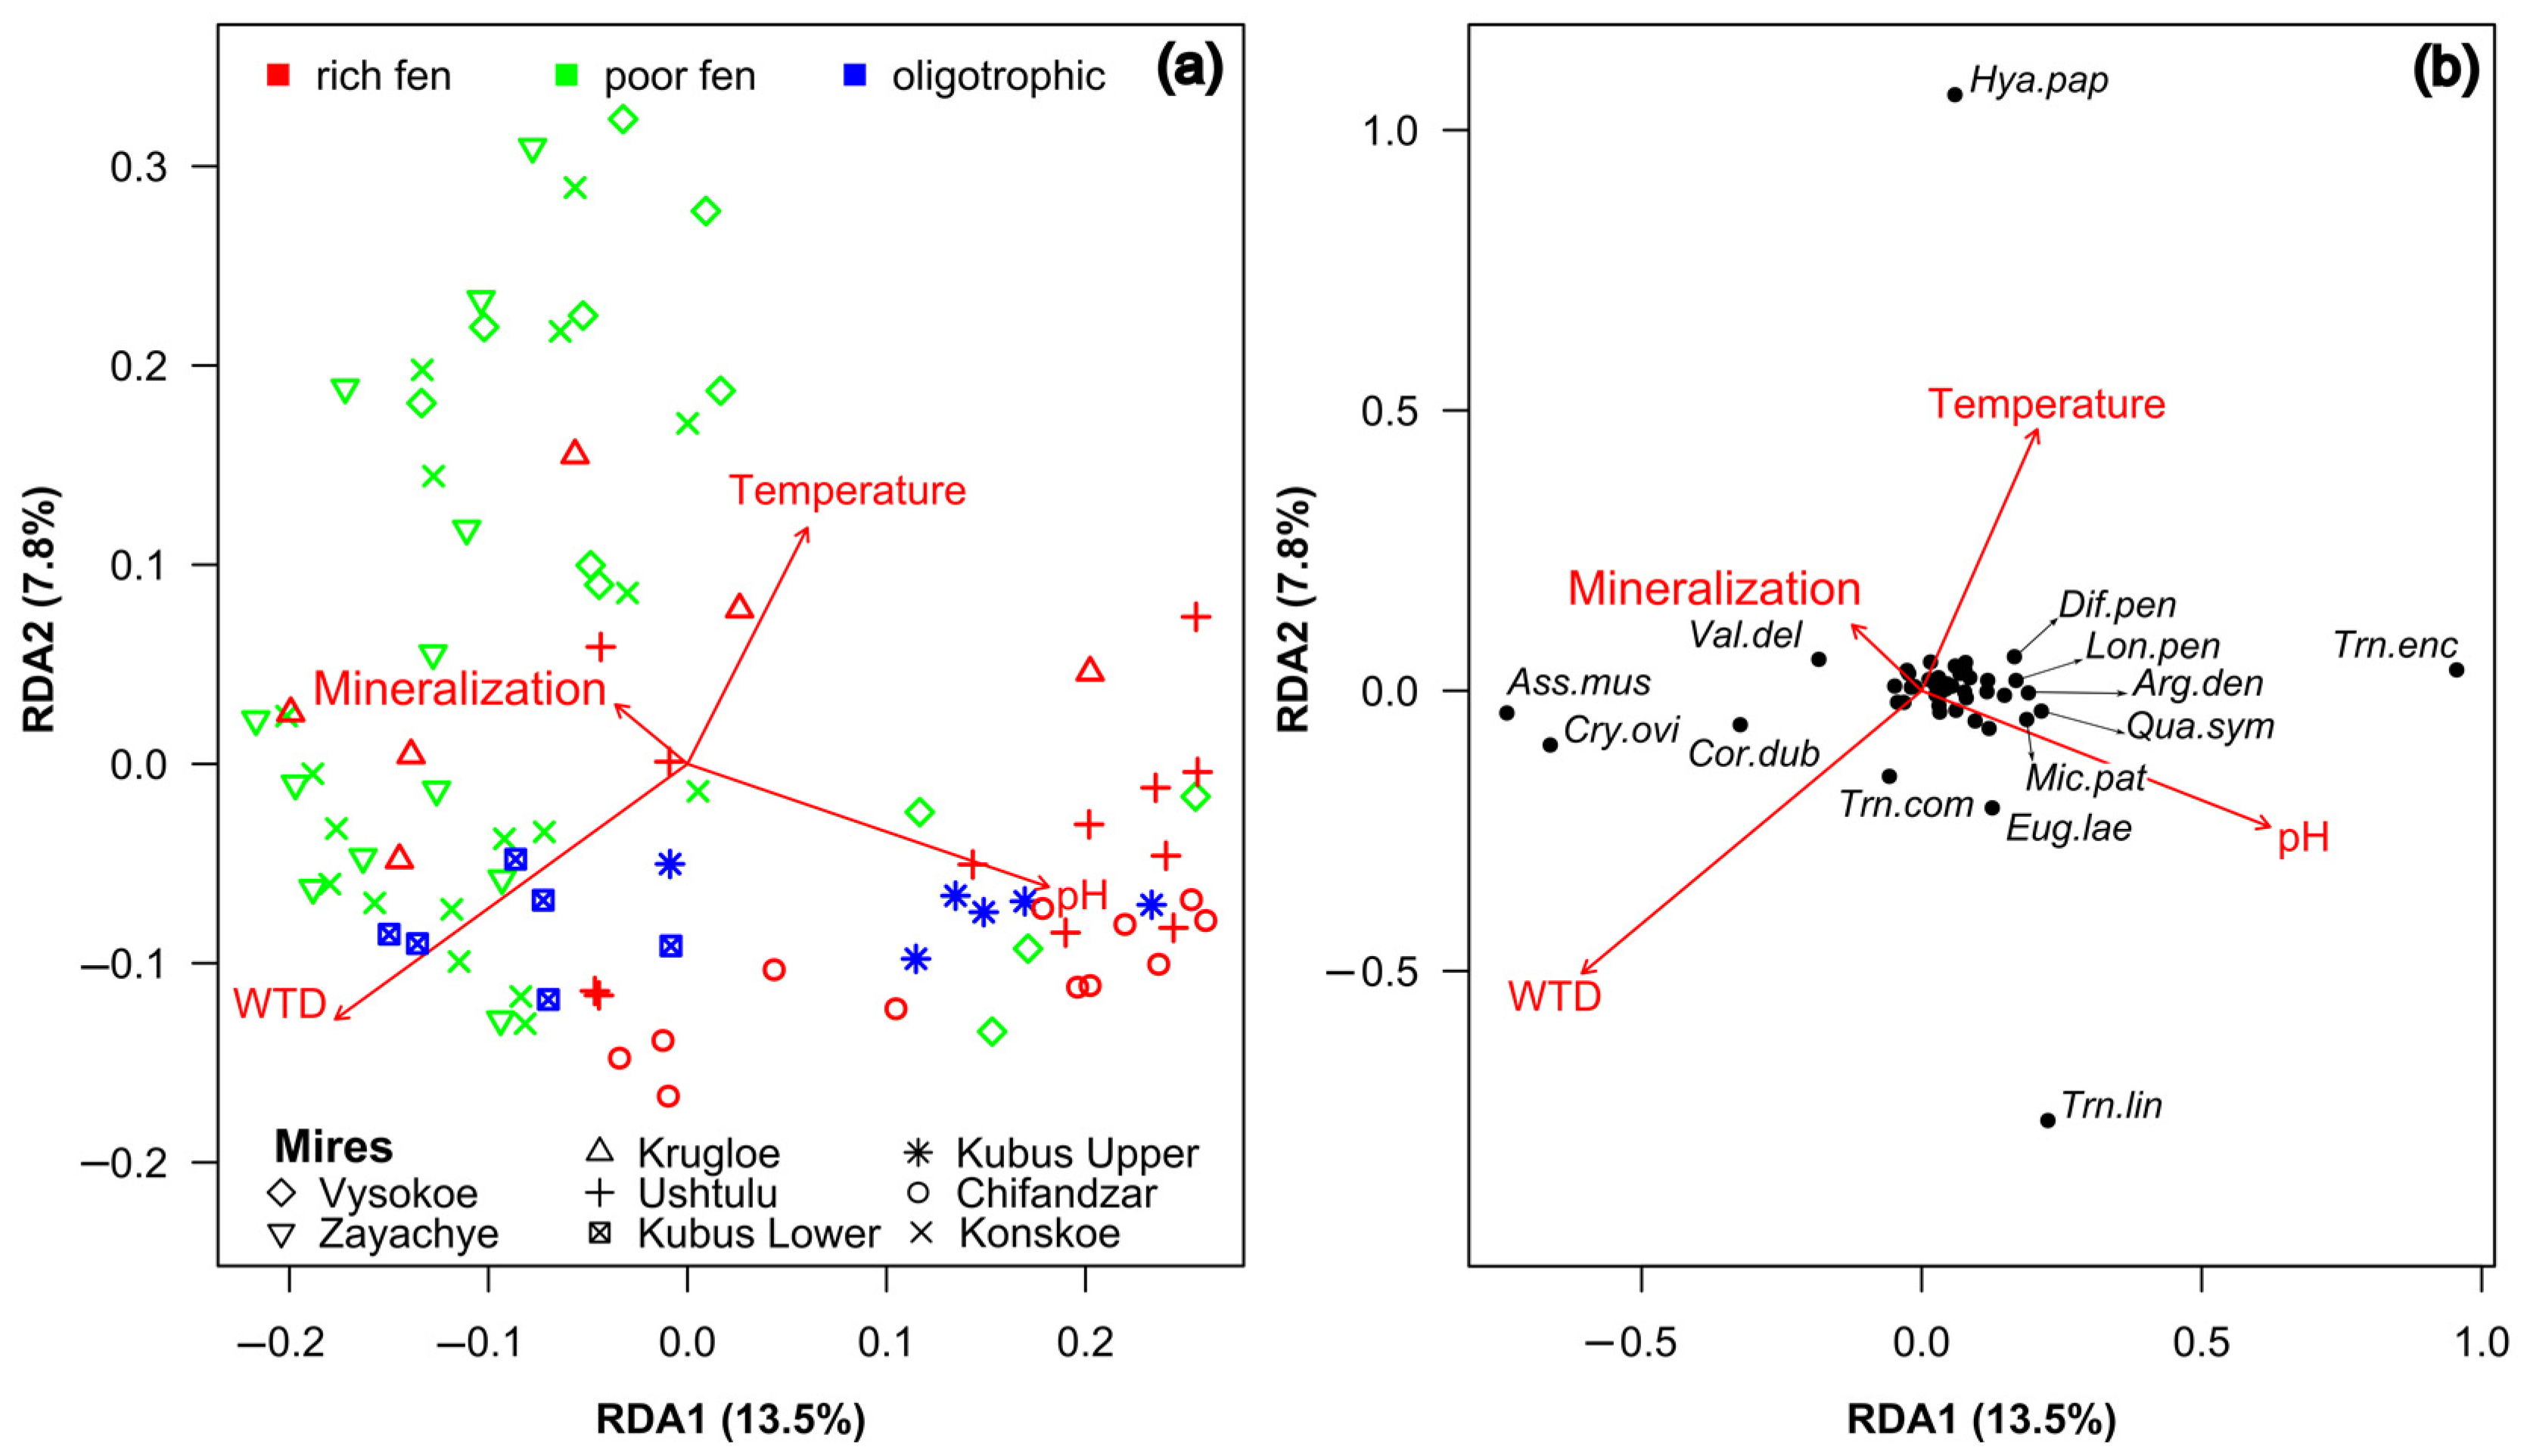
3.4. Effects of Abiotic Variables on Vegetation and Testate Amoeba Assembalges

The effects of the macro- and micro-environmental environmental data sets and the environmental variables included in them on the biotic assemblages (vegetation, vascular plants, bryophytes and testate amoebae) were further estimated using a variance partitioning analysis (Figure 4). Both the macro- and micro-environmental data sets significantly contributed to the variation in the species composition of the biotic assemblages, with the greatest proportion of variance being explained for the vascular plants (22–27%), whereas for the bryophytes and testate amoebae, the data sets explained no more than 12%. All the macro-environmental variables significantly affected the species composition of the biotic assemblages, with the greatest unique effects of the mire size (7.94%) and longitude (5.07%) on the vascular plants. The effects of the macro-environmental variables on the bryophytes and testate amoebae data were lower with the unique fractions less than 3.61%. Among the micro-environmental data, the strongest effects on the species composition of all the assemblages were detected for the pH (unique contribution 3.48–9.02%). The water table depth had the greatest unique effect on the testate amoebae (4.64%), whereas the water temperature was the most important factor for the vascular plants (5.9%). The effect of mineralization was moderate and did not exceed 3.29%.
The results of RDA testing the effect of the micro-environmental variables on the species structure of the testate amoeba assemblages showed that the first ordination axis (RDA1) was positively related to the water table depth and negatively to the pH (Figure 5a,b). The second axis (RDA2) was mainly associated with the water temperature, whereas the mineralization did not affect the results of the ordination. The wet biotopes were characterized by the presence of a typical hydrophilic taxon Hyalosphenia papilio. The dominant taxa in the dry biotopes differed depending on their acidity. The testate amoeba assemblages in the dry acidic biotopes were characterized by the small-sized xerophilic taxa Assulina muscorum, Cryptodifflugia oviformis, Corythion dubium and Valkanovia delicatula. In the dry and neutral biotopes, the dominant species was Trinema lineare, whereas Trinema enchelys preferred the wetter biotopes. Overall, these results illustrate a strong influence of the mire type gradient (i.e., minerotrophic to ombrotrophic) on the species composition of the testate amoeba assemblages.

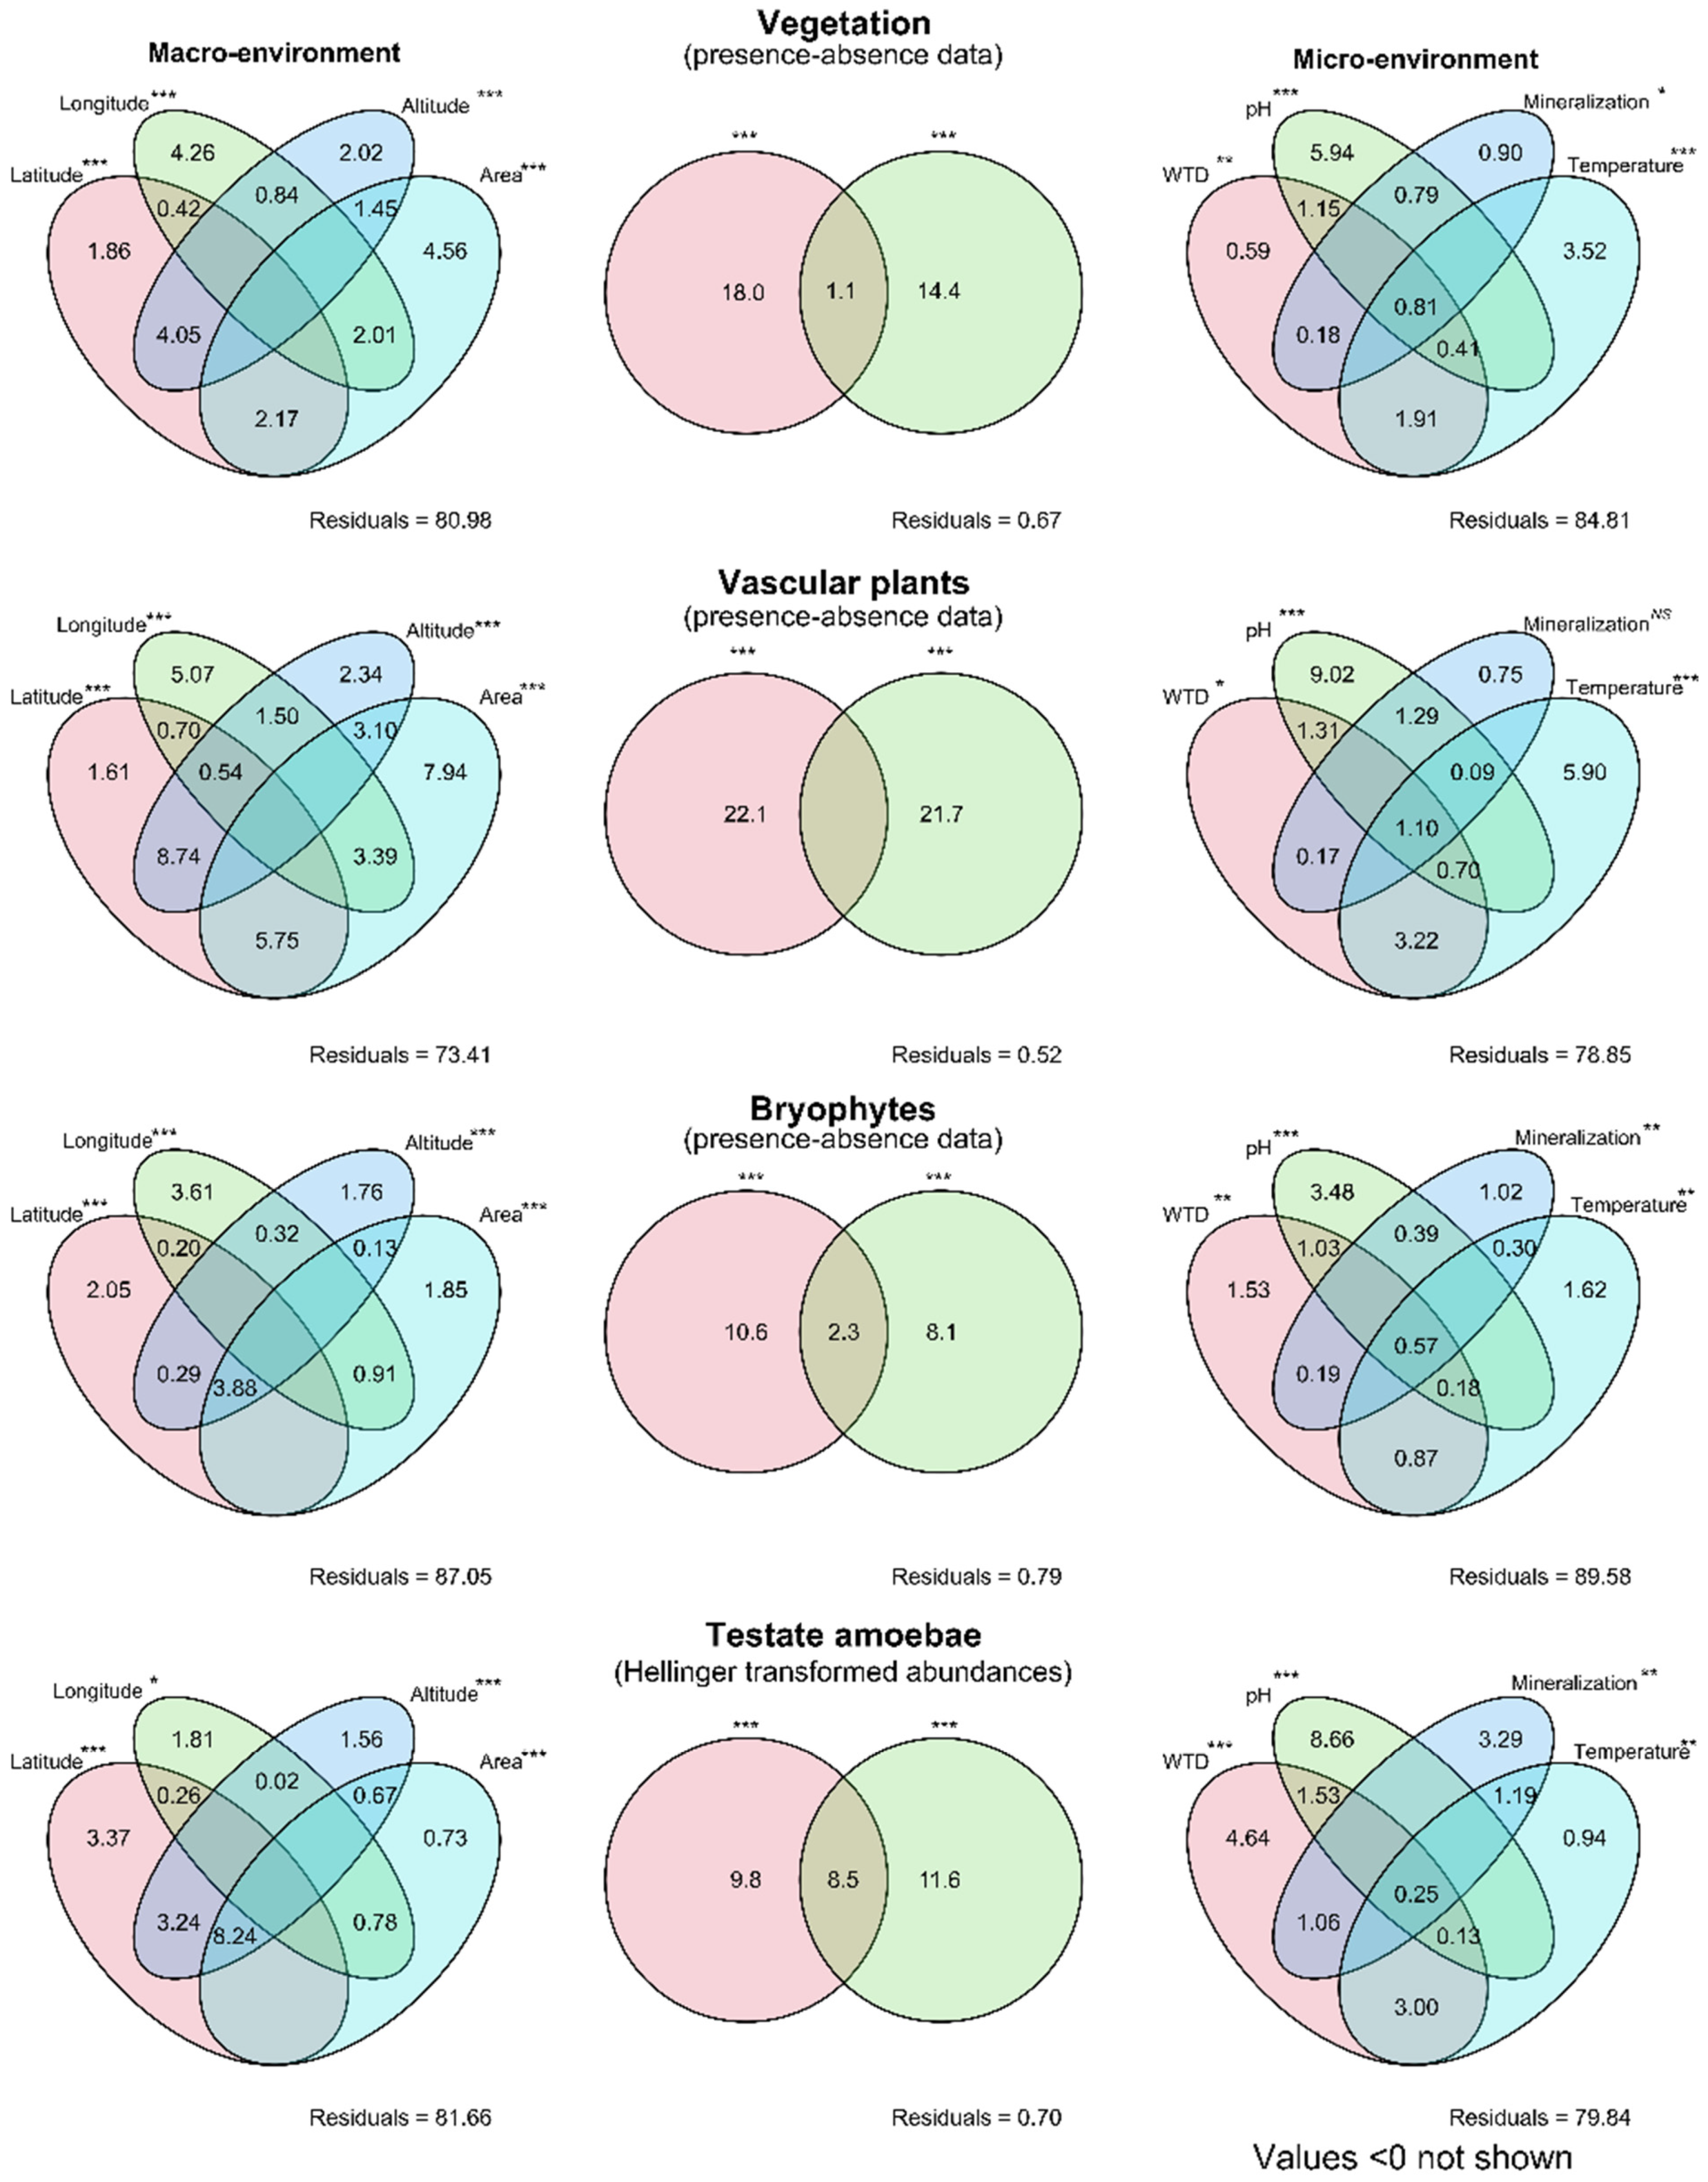
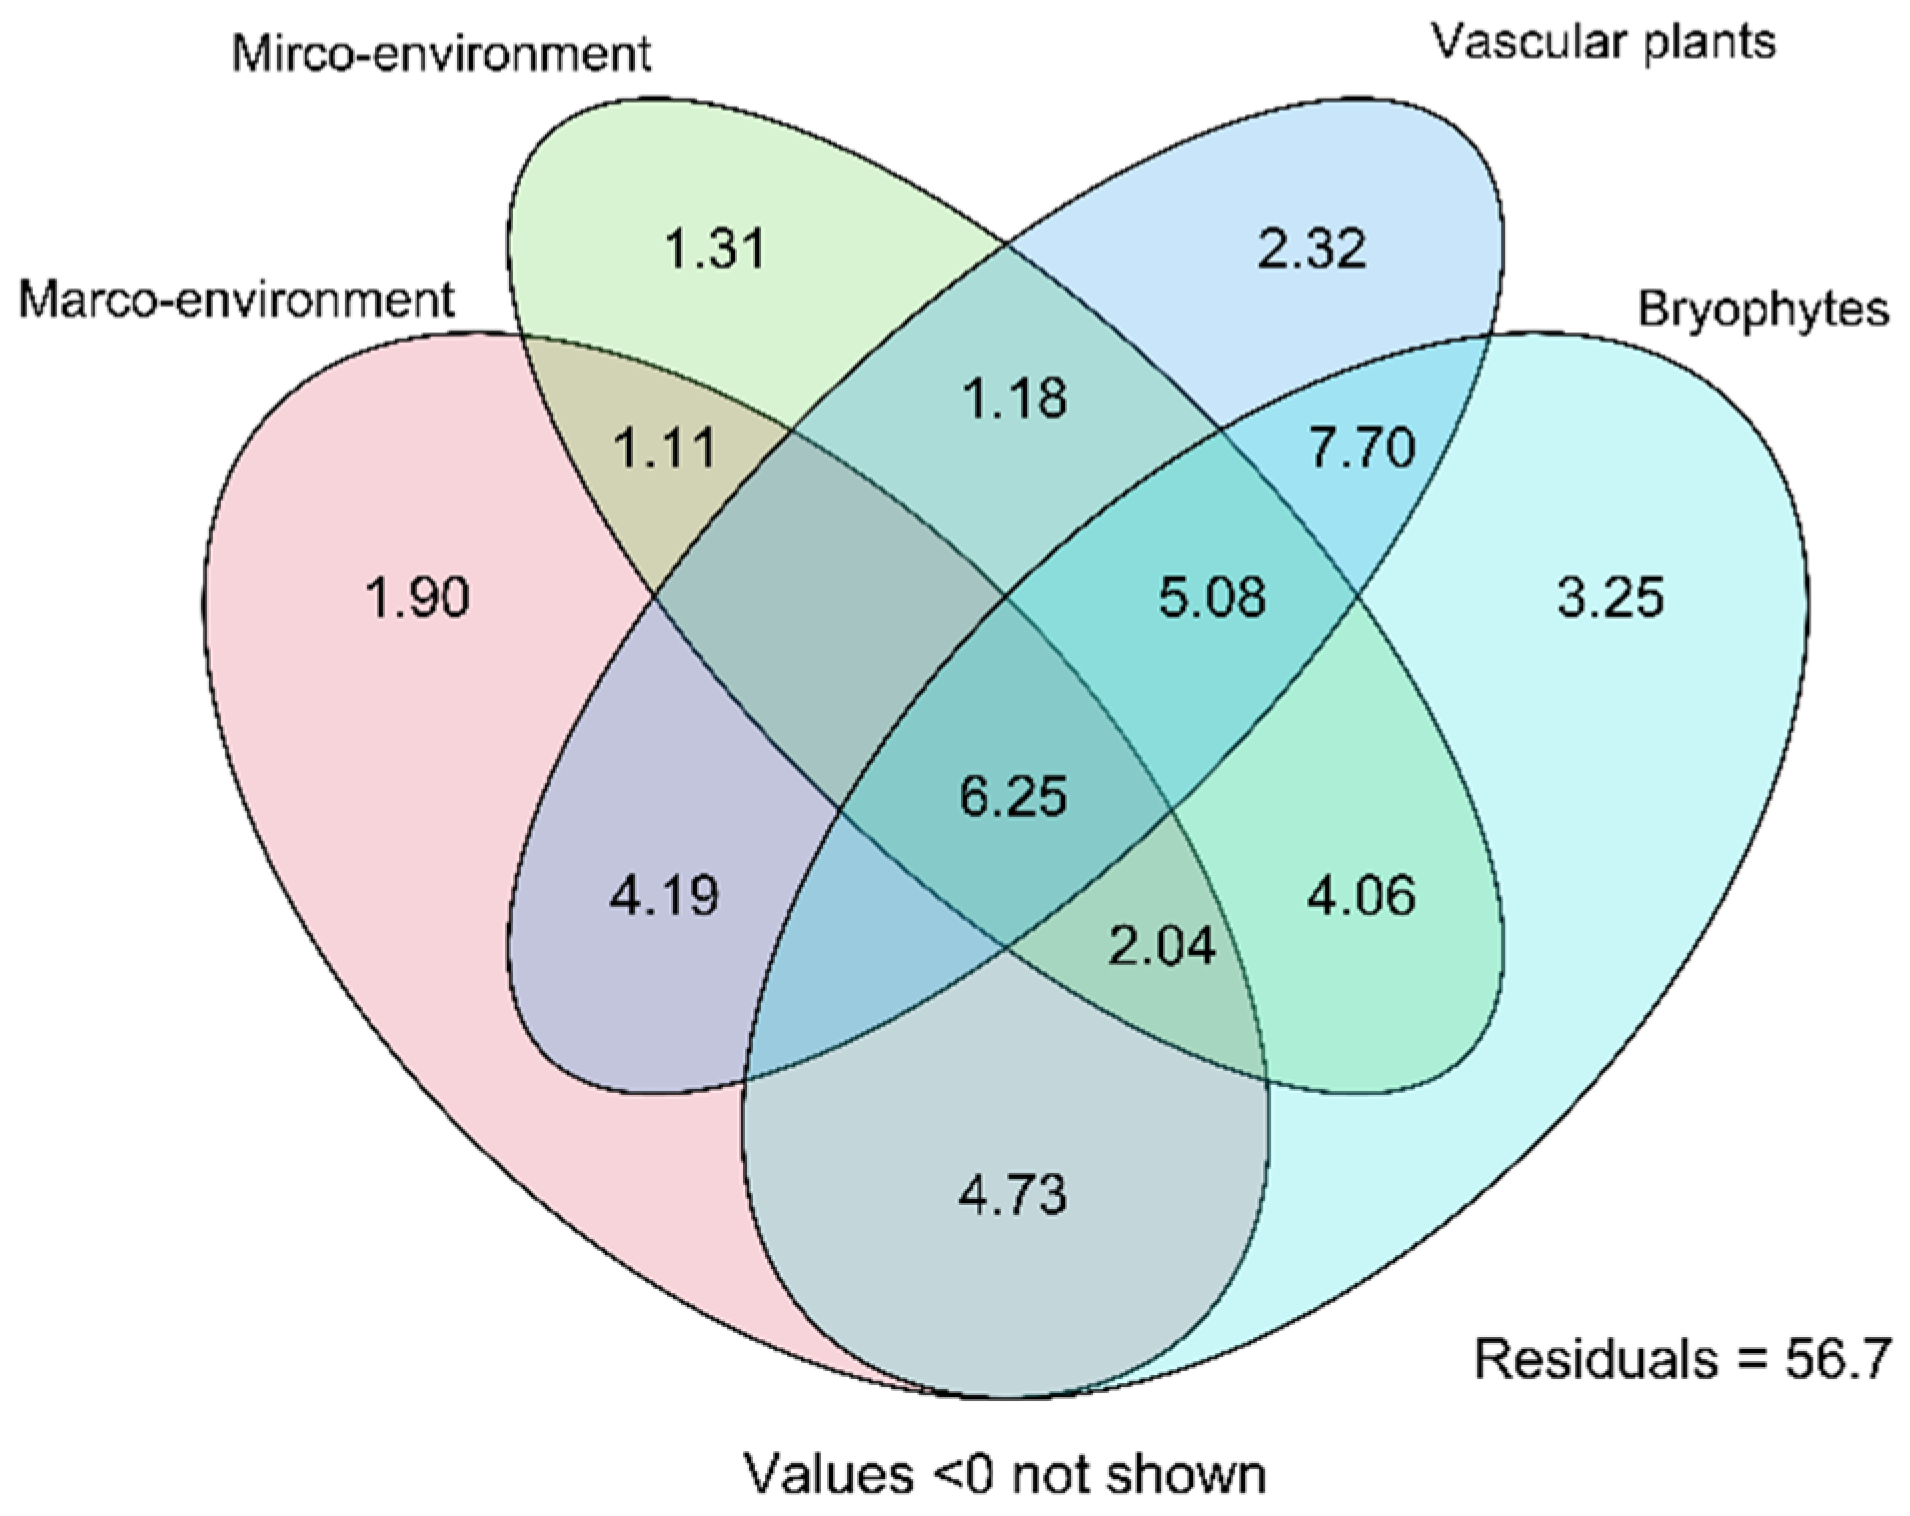
3.5. Variance Paritioning of the Environment and Vegetation Effects on the Species Composition of Testate Amoebae

The variance partitioning of the species structure of the testate amoeba assemblages in response to the abiotic (micro- and macro-environment) and biotic (vascular plants and bryophytes) data with a partial RDA indicated the four data sets that explained 43.3% of the total variance (Figure 6 and Table 4). Most of the variance was related to the bryophyte and vascular plant assemblages, whereas the contribution of the environmental data was lower. Most of the effects seemed to be highly related to each other, so that the proportion of the jointly explained variation was high, whereas the individual effects were much lower.

4. Discussion

4.1. Sphagnum-Dwelling Testate Amoebae in the Northern Caucasus Mountains

The results of our study have revealed diverse and abundant assemblages of Sphagnum-dwelling testate amoebae, which were, however, dominated by ubiquitous species with a wid ranging geographical distribution. The most abundant taxon in the studied mires Trinema lineare has been previously shown to be dominating in many types of biotopes around the world, including Sphagnum mosses elsewhere in Europe [61,62], soils in the Arctic [63,64,65] and Kamchatka [66] and aquatic biotopes in Antarctic [67]. The same applies to the second most abundant taxon Cryptodifflugia oviformis, which was commonly observed in Sphagnum biotopes across Europe [68,69], in Amazonian peatlands [70] and soils in Japan [71]. The other abundant taxa Assulina muscorum and Hyalosphenia papilio were generally considered as typical Sphagnum-dwellers, which would prefer dry and wet biotopes, respectively [69,72]. Despite being dominated by widely distributed taxa, the studied mires were characterized by a great diversity of testate amoebae, including 97 morphospecies. Our estimates are comparable to the previous relative intensive studies on the testate amoeba fauna of Sphagnum-dominated biotopes by Tarnogradsky [27,28,29,30] who revealed more than 140 species and subspecies. Overall, we can conclude that the Sphagnum-dominated mires in the Northern Caucasus Mountains represent an important hot spot for testate amoeba diversity.

4.2. The Relationships among the Environment, Vegetation and Testate Amoebae

The results of the MFA indicated that testate amoebae are strongly associated with the vegetation cover, and the strength of this correlation is comparable to the one with the macro-environmental data. Moreover, the relationships of testate amoebae with bryophytes were stronger than those with the vascular plants. The results of the variance partition of the species composition of the testate amoeba assemblages in response to the environmental and biotic data sets support these findings. These results are in line with the previous study of Mitchell et al. [21] who showed that Sphagnum-dwelling testate amoebae are ecologically more closely related to bryophytes than to the deep-rooted plants in five peatlands in Europe. This was later confirmed by Lamentowicz et al. [23] who also reported that testate amoebae were more strongly correlated to mosses (RV = 0.46) than to vascular plants (RV = 0.33) along a bog to extremely rich fen gradient in the sub-alpine peatlands of the Upper Engadine (Swiss Alps). The strong effects of both the species composition of the vegetation (involving vascular plants and bryophytes) and the bryophyte species composition on testate amoebae were revealed along a complete base–richness gradient in the fens [22]. This was explained by the fact that bryophytes and testate amoebae may experience ombrotrophic conditions at the mire surface while deep-rooted plants may have access to water rich in biogenic elements deeper in the peat deposits [21,23]. However, in soils, the effects of the vascular plants could be stronger, as it was shown by Carlson et al. [24] who reported that testate amoebae along a proglacial chronosequence (Kenai Fjords, AK, USA) were related to the vascular plants (RV = 0.71), location (RV = 0.59) and physical characteristics of biotopes (RV = 0.55). Altogether, these results point to the different contribution of vascular plants for the regulation of protist communities in soils and Sphagnum-dominated biotopes through leaf litter and root exudates.
Our results indicated that the influence of vegetation is comparable to the effects of the macro-environmental factors and greater than the effects the local environmental conditions. The relative contribution of the vegetation and environmental variables for the explanation of the variation in the species composition of the testate amoeba assemblages is still discussible. Mitchell et al. [21] reported that chemistry of the groundwater had a stronger effect on testate amoebae in comparison to the vegetation composition of the moss carpet in the acid Sphagnum mires. Similar patterns were observed by Lametowicz et al. [23] who reported that the effects of the environmental variables were consistently stronger (RV = 0.55), than the vegetation. In contrast, Oravilová and Hájek [22] showed that the species composition of the vegetation characterized the testate amoebae assemblages better than even long-term-measured water chemistry data. This might be greatly affected by the experimental design (i.e., the length of the studied environmental gradients), but it seems likely that the plant composition can be a substitute for the directly measured environmental characteristics and reflect the long-term development patterns and biotic interactions.

4.3. The Effect of Environmental Variables on the Species Structure of Testate Amoeba Assemblages

Our results indicated that, among the micro-environmental variables, the pH had a greater effect on the species structure of testate amoebae, vascular plants and bryophytes compared to the water table depth that can be explained by a considerable trophic gradient in the studied mires. These findings are in line with the results of Oravilová and Hájek [22] who found that the poor–rich fen gradient was primary governed by the pH and calcium, and the effect was almost three times stronger than surface wetness. The pH and calcium concentrations have been shown to be the major drivers of plant composition in mire, especially at the landscape level [73]. Similarly, Booth [74] found that the pH was a more important factor for the variation of the testate amoeba assemblages from the Sphagnum substrate than the water table depth when the entire data set, including the non-Sphagnum samples, was analyzed. The strong effects of the pH on the species structure of testate amoebae were reported by Amesbury et al. [69] for the pan-European training set, where the samples with a pH value greater than 5.5 were excluded from the analysis to study only the effects of the surface wetness in oligotrophic mires (pH 3–4.5). The strong effects of the acidity and the trophic gradient were used to build testate amoeba-based transfer functions to reconstruct these variables in paleoecological studies [75,76]. Overall, these data support the idea of a strong influence of the acidity on the species composition in mire communities.

4.4. The Ecological Preferences of Testate Ameoba Species

The ecological preferences of the dominant testate amoeba species observed in the Sphagnum-dominated biotopes in the Norther Caucuses Mountains correspond well to the previously published data [69,77]. Our results indicated that Hyalosphenia papilio prefers wet and acidic conditions, which is in line with the previous findings [22,74,75,78,79]. Assulina muscorum, Cryptodifflugia oviformis, Corythion dubium and Valkanovia delicatula were found in dry and acidic biotopes of the studied mires in the Northern Caucasus. Oravilová and Hájek [22] also showed, that Assulina muscorum and Corythion dubium were among the best indicators of acidic environments despite being generally regarded as ubiquitous. In our study, the species Trinema lineare, Trinema enchelys and Quadrulella symmetrica were generally observed in biotopes with a neutral pH. Interestingly, the first two species had a very similar morphology and differed mainly in size with the latter being larger and preferring wetter biotopes. This finding supports the important role of the shell size as a functional trait related to the substrate wetness, because many studies have reported a decrease in the shell size in response to the decreasing substrate wetness (see Marcisz et al. [50]).

5. Conclusions

The results of the study revealed a complex interaction among the environment, vegetation and testate amoebae in Sphagnum-dominated mires, which is important to better understand the links between the above- and below-ground components of ecosystems. Overall, the testate amoeba assemblages in the Northern Caucasus mires are diverse and abundant. Their species structure is greatly affected by vegetation, with bryophytes having a greater impact in comparison to the deep-rooted vascular plants. The influence of vegetation is comparable to the effects of the macro-environmental factors and is greater than the effects of the local environments. This might be related to the fact that both the macro-environment and vegetation represent complex ecological factors which can be used as a substitute for the environmental characteristics that are directly measured in the biotopes. However, the future studies should further investigate how the effects of these integrated factors can be disentangled to reveal the mechanisms of their impacts on the testate amoeba assemblages.

Supplementary Materials

The following supporting information can be downloaded at: https://www.mdpi.com/article/10.3390/d15020258/s1, Figure S1: Images of the studied mires. Kabardno-Balkaria: Zayachye (a), Vysokoe (b), Konskoe (c), Ushtulu (d); North Ossetia-Alania: Chifanzar (f) and Lower Kubus (f); Figure S2: Histograms of (a) water table depths (WTD, cm), (b) acidity (pH), (c) mineralization (ppm) and (d) water temperature (°C) in Sphagnum-dominated biotopes of eight mires in the Northern Caucasus Mountains; Table S1: An alphabetical list of the encountered testate amoebae taxa, their relative abundance (% to the total counts), occurrence (% to the total number of samples) and maximal relative abundance per sample (%); Table S2: Environmental characteristics and relative abundance of testate amoeba assemblages in Sphagnum-dominated biotopes of eight mires in the Northern Caucasus Mountains.

Author Contributions

Conceptualization and methodology, E.S.C., A.N.T. and Y.A.M.; fieldwork and identification of vascular plants, E.S.C. and I.P.S.; identification of bryophytes, N.G.M.; identification and counting of testate amoebae A.S.E.; data analysis and visualization, A.N.T.; writing—original draft preparation, A.N.T.; writing—review and editing, Y.A.M., E.S.C. and N.G.M.; funding acquisition, E.S.C. and Y.A.M. All authors have read and agreed to the published version of the manuscript.

Funding

This research was funded by the Russian Foundation for Basic Research (grant number 20-04-00145—field works, vegetation description) and the Russian Science Foundation (grant number 19-14-00102—testate amoebae identification, data analysis, manuscript writing).

Institutional Review Board Statement

Not applicable.

Data Availability Statement

The data supporting the reported results can be found in the Supplementary Materials of this paper.

Acknowledgments

The authors are deeply grateful to the staff of Alania National Park for their help in carrying out the research on mires in the Republic of North Ossetia. This research was performed according to the Development Program of the Interdisciplinary Scientific and Educational School of Lomonosov Moscow State University, “The future of the planet and global environmental change”.

Conflicts of Interest

The authors declare no conflict of interest. The funders had no role in the design of the study; in the collection, analyses or interpretation of the data; in the writing of the manuscript or in the decision to publish the results.

References

  1. Wardle, D.A. Communities and Ecosystems: Linking the Aboveground and Belowground Components (MPB-34); Princeton University Press: Princeton, NJ, USA, 2002; ISBN 0-691-07487-9. [Google Scholar]
  2. Hooper, D.U.; Bignell, D.E.; Brown, V.K.; Brussard, L.; Mark Dangerfield, J.; Wall, D.H.; Wardle, D.A.; Coleman, D.C.; Giller, K.E.; Lavelle, P.; et al. Interactions between Aboveground and Belowground Biodiversity in Terrestrial Ecosystems: Patterns, Mechanisms, and Feedbacks. BioScience 2000, 50, 1049. [Google Scholar] [CrossRef]
  3. Bezemer, T.M.; Lawson, C.S.; Hedlund, K.; Edwards, A.R.; Brook, A.J.; Igual, J.M.; Mortimer, S.R.; Van Der Putten, W.H. Plant Species and Functional Group Effects on Abiotic and Microbial Soil Properties and Plant-Soil Feedback Responses in Two Grasslands. J. Ecol. 2006, 94, 893–904. [Google Scholar] [CrossRef]
  4. Mitchell, R.J.; Hester, A.J.; Campbell, C.D.; Chapman, S.J.; Cameron, C.M.; Hewison, R.L.; Potts, J.M. Is Vegetation Composition or Soil Chemistry the Best Predictor of the Soil Microbial Community? Plant Soil. 2010, 333, 417–430. [Google Scholar] [CrossRef]
  5. Van der Heijden, M.G.A.; Bardgett, R.D.; van Straalen, N.M. The Unseen Majority: Soil Microbes as Drivers of Plant Diversity and Productivity in Terrestrial Ecosystems. Ecol. Lett. 2008, 11, 296–310. [Google Scholar] [CrossRef]
  6. Millard, P.; Singh, B.K. Does Grassland Vegetation Drive Soil Microbial Diversity? Nutr. Cycl. Agroecosyst. 2010, 88, 147–158. [Google Scholar] [CrossRef]
  7. Reynolds, H.L.; Packer, A.; Bever, J.D.; Clay, K. Grassroots Ecology: Plant-Microbe-Soil Interactions as Drivers of Plant Community Structure and Dynamics. Ecology 2003, 84, 2281–2291. [Google Scholar] [CrossRef]
  8. Cheng, D.-L.; Niklas, K.J. Above- and Below-Ground Biomass Relationships Across 1534 Forested Communities. Ann. Bot. 2007, 99, 95–102. [Google Scholar] [CrossRef] [PubMed]
  9. Ramirez, K.S.; Geisen, S.; Morriën, E.; Snoek, B.L.; van der Putten, W.H. Network Analyses Can Advance Above-Belowground Ecology. Trends Plant Sci. 2018, 23, 759–768. [Google Scholar] [CrossRef]
  10. Liu, Y.; Zhu, G.; Hai, X.; Li, J.; Shangguan, Z.; Peng, C.; Deng, L. Long-Term Forest Succession Improves Plant Diversity and Soil Quality but Not Significantly Increase Soil Microbial Diversity: Evidence from the Loess Plateau. Ecol. Eng. 2020, 142, 105631. [Google Scholar] [CrossRef]
  11. Artz, R.R.E.; Chapman, S.J.; Siegenthaler, A.; Mitchell, E.A.D.; Buttler, A.; Bortoluzzi, E.; Gilbert, D.; Yli-Petays, M.; Vasander, H.; Francez, A.-J. Functional Microbial Diversity in Regenerating Cutover Peatlands Responds to Vegetation Succession. J. Appl. Ecol. 2008, 45, 1799–1809. [Google Scholar] [CrossRef] [Green Version]
  12. Jassey, V.E.; Chiapusio, G.; Binet, P.; Buttler, A.; Laggoun-Défarge, F.; Delarue, F.; Bernard, N.; Mitchell, E.A.; Toussaint, M.-L.; Francez, A.-J.; et al. Above- and Belowground Linkages in Sphagnum Peatland: Climate Warming Affects Plant-Microbial Interactions. Glob. Chang. Biol. 2013, 19, 811–823. [Google Scholar] [CrossRef] [PubMed]
  13. Rydin, H.; Jeglum, J.K.; Bennett, K.D. The Biology of Peatlands, 2nd ed.; Oxford University Press: Oxford, UK, 2013; ISBN 978-0-19-960299-5. [Google Scholar]
  14. Yu, Z.C. Northern Peatland Carbon Stocks and Dynamics: A Review. Biogeosciences 2012, 9, 4071–4085. [Google Scholar] [CrossRef]
  15. Belyea, L.R.; Malmer, N. Carbon Sequestration in Peatland: Patterns and Mechanisms of Response to Climate Change. Glob. Chang. Biol. 2004, 10, 1043–1052. [Google Scholar] [CrossRef]
  16. Gilbert, D.; Mitchell, E.A.D. Chapter 13 Microbial Diversity in Sphagnum Peatlands. In Peatlands; Martini, I.P., Cortizas, A.M., Chesworth, W., Eds.; Developments in Earth Surface Processes; Elsevier: Amsterdam, The Netherlands, 2006; Volume 9, pp. 287–318. [Google Scholar]
  17. Mazei, Y.; Tsyganov, A. Freshwater Testate Amoebae, 1st ed.; KMK Scientific Press Ltd.: Moscow, Russia, 2006; ISBN 5-873317-336-2. [Google Scholar]
  18. Gilbert, D.; Amblard, C.; Bourdier, G.; Francez, A.-J. The Microbial Loop at the Surface of a Peatland: Structure, Function, and Impact of Nutrient Input. Microb. Ecol. 1998, 35, 83–93. [Google Scholar] [CrossRef]
  19. Gilbert, D.; Amblard, C.; Bourdier, G.; André-Jean, F.; Mitchell, E.A.D. Le régime alimentaire des Thécamoebiens (Protista, Sarcodina). L’Année Biol. 2000, 39, 57–68. [Google Scholar] [CrossRef]
  20. Potapov, A.M.; Rozanova, O.L.; Semenina, E.E.; Leonov, V.D.; Belyakova, O.I.; Bogatyreva, V.Y.; Degtyarev, M.I.; Esaulov, A.S.; Korotkevich, A.Y.; Kudrin, A.A.; et al. Size Compartmentalization of Energy Channeling in Terrestrial Belowground Food Webs. Ecology 2021, 102, e03421. [Google Scholar] [CrossRef]
  21. Mitchell, E.A.D.; Buttler, A.; Grosvernier, P.; Rydin, H.; Albinsson, C.; Greenup, A.L.; Heijmans, M.M.P.D.; Hoosbeek, M.R.; Saarinen, T. Relationships among Testate Amoebae (Protozoa), Vegetation and Water Chemistry in Five Sphagnum-Dominated Peatlands in Europe: Testate Amoeba, Vegetation and Water Chemistry in Bogs. New Phytol. 2000, 145, 95–106. [Google Scholar] [CrossRef]
  22. Opravilová, V.; Hájek, M. Others The Variation of Testacean Assemblages (Rhizopoda) along the Complete Baserichness Gradient in Fens: A Case Study from the Western Carpathians. Acta Protozool. 2006, 45, 191. [Google Scholar]
  23. Lamentowicz, M.; Lamentowicz, Ł.; van der Knaap, W.O.; Gąbka, M.; Mitchell, E.A.D. Contrasting Species—Environment Relationships in Communities of Testate Amoebae, Bryophytes and Vascular Plants Along the Fen–Bog Gradient. Microb. Ecol. 2010, 59, 499–510. [Google Scholar] [CrossRef]
  24. Carlson, M.L.; Flagstad, L.A.; Gillet, F.; Mitchell, E.A.D. Community Development along a Proglacial Chronosequence: Are above-Ground and below-Ground Community Structure Controlled More by Biotic than Abiotic Factors?: Above- and below-Ground Communities in Succession. J. Ecol. 2010, 98, 1084–1095. [Google Scholar] [CrossRef]
  25. Koenig, I.; Feldmeyer-Christe, E.; Mitchell, E.A.D. Comparative Ecology of Vascular Plant, Bryophyte and Testate Amoeba Communities in Four Sphagnum Peatlands along an Altitudinal Gradient in Switzerland. Ecol. Indic. 2015, 54, 48–59. [Google Scholar] [CrossRef]
  26. Katz, N.Y. Swamps of the Earth; Nauka: Moscow, Russia, 1971. [Google Scholar]
  27. Tarnogradsky, D. Microflora and microfauna of the peat bogs of the Caucasus. 2. Tarskoe peaty moor. Proc. North-Cauc. Hydrobiol. Stn. North-Ossetia Agrar. Inst. 1947, 5, 19–34. [Google Scholar]
  28. Tarnogradsky, D. Microflora and microfauna of the peat bogs of the Caucasus. 6. Devdorakskoe Sphagnum peatland. Proc. North-Cauc. Hydrobiol. Stn. North-Ossetia Agrar. Inst. 1957, 6, 3–56. [Google Scholar]
  29. Tarnogradsky, D. Microflora and microfauna of the peat bogs of the Caucasus. 8. Sedge-Sphagnum lakes in the upper course of Balkarskiy Cherek River. Proc. North-Cauc. Hydrobiol. Stn. North-Ossetia Agrar. Inst. 1959, 6, 3–91. [Google Scholar]
  30. Tarnogradsky, D. Microflora and Microfauna of the Peat Bogs of the Caucasus. 5. Sphagnetum of the Makhar Gorge (Karachaevo-Cherkesskaya A. Republic). Proc. North-Cauc. Hydrobiol. Stn. North-Ossetia Agrar. Inst. 1961, 7, 3–33. [Google Scholar]
  31. Malysheva, E.A.; Mazei, N.G.; Shapovalov, M.I.; Saprykin, M.A.; Mazei, Y.A. Freshwater Testate Amoebae in the Belaya River Basin (Northwestern Caucasus). Inland Water Biol. 2017, 10, 92–96. [Google Scholar] [CrossRef]
  32. Mischenko, A.L. General characteristics of the Norther Caucasus region and its wetlands. In Wetlands in Russia. Wetlands in the North Caucasus; Mischenko, A.L., Ed.; Wetlands International: Moscow, Russia, 2006; Volume 6, p. 316. ISBN 978-90-5882-028-0. [Google Scholar]
  33. Komarov, Y.V. Republic of North Ossetia-Alania. In Wetlands in Russia. Wetlands in the North Caucasus; Mischenko, A.L., Ed.; Wetlands International: Moscow, Russia, 2006; Volume 6, p. 316. ISBN 978-90-5882-028-0. [Google Scholar]
  34. Olson, D.M.; Dinerstein, E.; Wikramanayake, E.D.; Burgess, N.D.; Powell, G.V.N.; Underwood, E.C.; D’amico, J.A.; Itoua, I.; Strand, H.E.; Morrison, J.C.; et al. Terrestrial Ecoregions of the World: A New Map of Life on Earth. BioScience 2001, 51, 933. [Google Scholar] [CrossRef]
  35. Botch, M.S.; Mazig, V.V. Mire Ecosystems in the USSR; Nauka: Leningrad, Russia, 1979. [Google Scholar]
  36. Katz, N.Y. Mires and Peatlands; UCHPEDGIZ: Moscow, Russia, 1941. [Google Scholar]
  37. Kvavadze, E.V.; Efremov, Y.V. Palynological Studies of Lake and Lake-Swamp Sediments of the Holocene in the High Mountains of Arkhyz (Western Caucasus). Acta Palaeobot. 1996, 36, 107–120. [Google Scholar]
  38. Connor, S.E.; Kvavadze, E.V. Modelling Late Quaternary Changes in Plant Distribution, Vegetation and Climate Using Pollen Data from Georgia, Caucasus. J. Biogeogr. 2009, 36, 529–545. [Google Scholar] [CrossRef]
  39. Knyasev, A.; Savinetsky, A.; Gey, N. Holocene History of Vegetation in North Ossetia. In Historical Ecology of Wild and Domestic Ungulates: History of Pasture Ecosystems; Nauka: Moscow, Russia, 1992; pp. 84–108. [Google Scholar]
  40. Prokin, A.A.; Sazhnev, A.S.; Philippov, D.A. Water Beetles (Insecta: Coleoptera) of Some Peatlands in the North Caucasus. Nat. Conserv. Res. 2019, 4, 57–66. [Google Scholar] [CrossRef]
  41. Doroshina, G.Y.; Nikolajev, I.A. Sphagnum mosses (Sphagnaceae, Bryophyta) of mires Chefandzar and Masota in North Ossetia (Caucasus). Nov. Sist. Nizshikh Rastenii 2018, 52, 455–462. [Google Scholar] [CrossRef]
  42. Busch, E.A. On the mires limnogeneus origin of the Balkaria and Digoria. Proc. Bot. Mus. USSR 1932, 25, 7–16. [Google Scholar]
  43. Maevsky, P.F. Flora of the Middle Zone of the European Part of Russia, 11th ed.; Scientific Press Ltd. KMK: Moscow, Russia, 2014; ISBN 978-5-87317-958-9. [Google Scholar]
  44. Ignatov, M.S.; Ignatova, E.A. Moss Flora of the Middle European Russia. Vol. 1: Sphagnaceae—Hedwigiaceae.; KMK Scientific Press Ltd.: Moscow, Russia, 2003; Volume 1, ISBN 5-87317-104-1. [Google Scholar]
  45. Ignatov, M.S.; Ignatova, E.A. Moss Flora of the Middle European Russia. Vol. 2: Fontinalaceae—Amblystegiaceae; KMK Scientific Press Ltd.: Moscow, Russia, 2004; Volume 2, ISBN 5-87317-149-1. [Google Scholar]
  46. Mazei, Y.A.; Chernyshov, V.A. Testate Amoebae Communities in the Southern Tundra and Forest-Tundra of Western Siberia. Biol. Bull. 2011, 38, 789–796. [Google Scholar] [CrossRef]
  47. Todorov, M.; Bankov, N. An Atlas of Sphagnum-Dwelling Testate Amoebae in Bulgaria, 1st ed.; Pensoft Publishers: Sofia, Bulgaria, 2019; ISBN 978-954-642-972-8. [Google Scholar]
  48. Lahr, D.J.G.; Kosakyan, A.; Lara, E.; Mitchell, E.A.D.; Morais, L.; Porfirio-Sousa, A.L.; Ribeiro, G.M.; Tice, A.K.; Pánek, T.; Kang, S.; et al. Phylogenomics and Morphological Reconstruction of Arcellinida Testate Amoebae Highlight Diversity of Microbial Eukaryotes in the Neoproterozoic. Curr. Biol. 2019, 29, 991–1001.e3. [Google Scholar] [CrossRef]
  49. Macumber, A.L.; Blandenier, Q.; Todorov, M.; Duckert, C.; Lara, E.; Lahr, D.J.G.; Mitchell, E.A.D.; Roe, H.M. Phylogenetic Divergence within the Arcellinida (Amoebozoa) Is Congruent with Test Size and Metabolism Type. Eur. J. Protistol. 2020, 72, 125645. [Google Scholar] [CrossRef] [PubMed]
  50. Marcisz, K.; Jassey, V.E.J.; Kosakyan, A.; Krashevska, V.; Lahr, D.J.G.; Lara, E.; Lamentowicz, Ł.; Lamentowicz, M.; Macumber, A.; Mazei, Y.; et al. Testate Amoeba Functional Traits and Their Use in Paleoecology. Front. Ecol. Evol. 2020, 8, 340. [Google Scholar] [CrossRef]
  51. Mitchell, E.A.D.; Lamentowicz, M.; Payne, R.J.; Mazei, Y. Effect of Taxonomic Resolution on Ecological and Palaeoecological Inference—A Test Using Testate Amoeba Water Table Depth Transfer Functions. Quat. Sci. Rev. 2014, 91, 62–69. [Google Scholar] [CrossRef] [Green Version]
  52. R Core Team. R: A Language and Environment for Statistical Computing; R Foundation for Statistical Computing: Vienna, Austria, 2022. [Google Scholar]
  53. Oksanen, J.; Simpson, G.L.; Blanchet, F.G.; Kindt, R.; Legendre, P.; Minchin, P.R.; O’Hara, R.B.; Solymos, P.; Stevens, M.H.H.; Szoecs, E.; et al. Vegan: Community Ecology Package. Available online: https://CRAN.R-project.org/package=vegan (accessed on 30 October 2022).
  54. Lê, S.; Josse, J.; Husson, F. FactoMineR: A Package for Multivariate Analysis. J. Stat. Softw. 2008, 25, 1–18. [Google Scholar] [CrossRef]
  55. Wickham, H. Ggplot2: Elegant Graphics for Data Analysis; Springer: New York, NY, USA, 2016; ISBN 978-3-319-24277-4. [Google Scholar]
  56. Borcard, D.; Gillet, F.; Legendre, P. Numerical Ecology with R.; Use R! Springer: New York, NY, USA, 2011; ISBN 978-1-4419-7975-9. [Google Scholar]
  57. Josse, J.; Pagès, J.; Husson, F. Testing the Significance of the RV Coefficient. Comput. Stat. Data Anal. 2008, 53, 82–91. [Google Scholar] [CrossRef]
  58. Legendre, P.; Gallagher, E.D. Ecologically Meaningful Transformations for Ordination of Species Data. Oecologia 2001, 129, 271–280. [Google Scholar] [CrossRef]
  59. Legendre, P.; Anderson, M.J. Distance-Based Redundancy Analysis: Testing Multispecies Responses in Multifactorial Ecological Experiments. Ecol. Monogr. 1999, 69, 1–24. [Google Scholar] [CrossRef]
  60. Peres-Neto, P.R.; Legendre, P.; Dray, S.; Borcard, D. Variation Partitioning of Species Data Matrices: Estimation and Comparison of Fractions. Ecology 2006, 87, 2614–2625. [Google Scholar] [CrossRef]
  61. Bobrov, A.A.; Charman, D.J.; Warner, B.G. Ecology of Testate Amoebae (Protozoa: Rhizopoda) on Peatlands in Western Russia with Special Attention to Niche Separation in Closely Related Taxa. Protist 1999, 150, 125–136. [Google Scholar] [CrossRef] [PubMed]
  62. Marcisz, K.; Lamentowicz, Ł.; Słowińska, S.; Słowiński, M.; Muszak, W.; Lamentowicz, M. Seasonal Changes in Sphagnum Peatland Testate Amoeba Communities along a Hydrological Gradient. Eur. J. Protistol. 2014, 50, 445–455. [Google Scholar] [CrossRef]
  63. Trappeniers, K.; Kerckvoorde, A.V.; Chardez, D.; Nijs, I.; Beyens, L. Testate Amoebae Assemblages from Soils in the Zackenberg Area, Northeast Greenland. Arct. Antarct. Alp. Res. 2002, 34, 94–101. [Google Scholar] [CrossRef]
  64. Mazei, Y.A.; Tsyganov, A.N.; Chernyshov, V.A.; Ivanovsky, A.A.; Payne, R.J. First Records of Testate Amoebae from the Novaya Zemlya Archipelago (Russian Arctic). Polar Biol. 2018, 41, 1133–1142. [Google Scholar] [CrossRef]
  65. Mazei, Y.A.; Lebedeva, N.V.; Taskaeva, A.A.; Ivanovsky, A.A.; Chernyshov, V.A.; Tsyganov, A.N.; Payne, R.J. What Role Does Human Activity Play in Microbial Biogeography?: The Revealing Case of Testate Amoebae in the Soils of Pyramiden, Svalbard. Pedobiologia 2018, 67, 10–15. [Google Scholar] [CrossRef] [Green Version]
  66. Payne, R.J.; Bobrov, A.A.; Tsyganov, A.N.; Babeshko, K.V.; Sloan, T.J.; Kay, M.; Kupriyanov, D.A.; Surkov, N.V.; Novenko, E.Y.; Andreev, A.A.; et al. First Records of Contemporary Testate Amoeba Assemblages from the Kamchatka Peninsula, Russia and Potential for Palaeoenvironmental Reconstruction. Boreas 2021, 50, 998–1010. [Google Scholar] [CrossRef]
  67. Beyens, L.; Chardez, D.; De Baere, D.; Verbruggen, C. The Aquatic Testate Amoebae Fauna of the Strømness Bay Area, South Georgia. Antarct. Sci. 1995, 7, 3–8. [Google Scholar] [CrossRef]
  68. Heal, O.W. The Abundance and Micro-Distribution of Testate Amoebae (Rhizopoda: Testacea) in Sphagnum. Oikos 1962, 13, 35. [Google Scholar] [CrossRef]
  69. Amesbury, M.J.; Swindles, G.T.; Bobrov, A.; Charman, D.J.; Holden, J.; Lamentowicz, M.; Mallon, G.; Mazei, Y.; Mitchell, E.A.D.; Payne, R.J.; et al. Development of a New Pan-European Testate Amoeba Transfer Function for Reconstructing Peatland Palaeohydrology. Quat. Sci. Rev. 2016, 152, 132–151. [Google Scholar] [CrossRef]
  70. Swindles, G.T.; Reczuga, M.; Lamentowicz, M.; Raby, C.L.; Turner, T.E.; Charman, D.J.; Gallego-Sala, A.; Valderrama, E.; Williams, C.; Draper, F.; et al. Ecology of Testate Amoebae in an Amazonian Peatland and Development of a Transfer Function for Palaeohydrological Reconstruction. Microb. Ecol. 2014, 68, 284–298. [Google Scholar] [CrossRef]
  71. Tsyganov, A.N.; Bobrov, A.A.; Shimano, S.D.; Mitchell, E.A.D.; Hagiwara, Y.; Wall, A.A.J.; Mazei, N.G.; Chernyshov, V.A.; Wanner, M.; Zhong, Y.; et al. Distribution of Soil Testate Amoeba Assemblages along an Elevation Gradient on Mount Fuji (Japan). Eur. J. Protistol. 2022, 84, 125894. [Google Scholar] [CrossRef] [PubMed]
  72. Qin, Y.; Li, H.; Mazei, Y.; Kurina, I.; Swindles, G.T.; Bobrov, A.; Tsyganov, A.N.; Gu, Y.; Huang, X.; Xue, J.; et al. Developing a Continental-Scale Testate Amoeba Hydrological Transfer Function for Asian Peatlands. Quat. Sci. Rev. 2021, 258, 106868. [Google Scholar] [CrossRef]
  73. Tahvanainen, T. Water Chemistry of Mires in Relation to the Poor-Rich Vegetation Gradient and Contrasting Geochemical Zones of the North-Eastern Fennoscandian Shield. Folia Geobot. 2004, 39, 353–369. [Google Scholar] [CrossRef]
  74. Booth, R.K. Ecology of Testate Amoebae (Protozoa) in Two Lake Superior Coastal Wetlands: Implications for Paleoecology and Environmental Monitoring. Wetlands 2001, 21, 564–576. [Google Scholar] [CrossRef]
  75. Lamentowicz, M.; Mitchell, E.A.D. The Ecology of Testate Amoebae (Protists) in Sphagnum in North-Western Poland in Relation to Peatland Ecology. Microb. Ecol. 2005, 50, 48–63. [Google Scholar] [CrossRef] [PubMed]
  76. Sim, T.G.; Swindles, G.T.; Morris, P.J.; Baird, A.J.; Charman, D.J.; Amesbury, M.J.; Beilman, D.; Channon, A.; Gallego-Sala, A.V. Ecology of Peatland Testate Amoebae in Svalbard and the Development of Transfer Functions for Reconstructing Past Water-Table Depth and PH. Ecol. Indic. 2021, 131, 108122. [Google Scholar] [CrossRef]
  77. Tsyganov, A.N.; Babeshko, K.V.; Novenko, E.Y.; Malysheva, E.A.; Payne, R.J.; Mazei, Y.A. Quantitative Reconstruction of Peatland Hydrological Regime with Fossil Testate Amoebae Communities. Russ. J. Ecol. 2017, 48, 191–198. [Google Scholar] [CrossRef]
  78. Tolonen, K.; Warner, B.G.; Vasander, H. Ecology of Testaceans (Protozoa: Rhizopoda) in Mires in Southern Finland: I. Autecology. Arch. Für Protistenkd. 1992, 142, 119–138. [Google Scholar] [CrossRef]
  79. Heal, O. The Distribution of Testate Amoebae (Rhizopoda: Testacea) in Some Fens and Bogs in Northern England. Zool. J. Linn. Soc. 1961, 44, 369–382. [Google Scholar] [CrossRef]
Figure 1. The map of the study region (a) and the study sites (blue circles) (b). The blue rectangle in (a) marks the area covered by (b).
Diversity 15 00258 g001
Figure 2. Variation in the water table depth, cm (a); acidity, pH (b); mineralization, ppm (c); water temperature, °C, (d) in the Sphagnum-dominated biotopes of eight mires in the Northern Caucasus Mountains.
Diversity 15 00258 g002
Figure 3. Multiple factor analysis (MFA) of macro- and micro-environmental characteristics, vascular plants (presence–absence), bryophytes (presence–absence) and testate amoebae (relative abundances, Hellinger-transformed data, not scaled) from eight mires in the Northern Caucasus Mountains: (a) group representation plot displaying the link between each table and the MFA ordination results; (b) individual factor map showing the positions of the samples in the MFA (points are the centroids of the sample coordinates based on all four data sets); (c) correlation circle map of the MFA for the quantitative variables, i.e., macro-, micro-environment and testate amoebae (for clarity, only the variables with cos2 > 0.2 are represented); (d) projection of the centroids of the qualitative variables (plant species).
Diversity 15 00258 g003
Figure 4. Venn diagrams of the variance partitioning analysis illustrating the percentage of variance in the species composition of the biotic assemblages (vegetation, vascular plants, bryophyte and testate amoebae) explained by the macro- (left) and micro- (right) environmental data sets and the environmental variables within them. The values show the percentages of the unique and shared variation of each data set or variable (computed from adjusted R2). The analysis is based on the results of the RDA (covariance matrix). The stars mark the significance of the individual effects (the sum of the unique and all the shared contributions) of each data set or variable: ***—p < 0.001, **—p < 0.01, * p < 0.05, NS—not significant. WTD—water table depth.
Diversity 15 00258 g004
Figure 5. RDA ordination diagrams illustrating the variation in the species structure of the testate amoeba assemblages (Hellinger-transformed relative abundances, covariance matrix) in eight mires of the Northern Caucasus Mountains in response to the environmental variables: (a)—the distance plot of the site scores demonstrating the patterns in relation to the environmental variables; (b)—species plot (see Table S1 for species abbreviations); only species with a contribution greater than 0.15 (absolute value) are labelled on the plot to improve the readability. WTD—water table depth.
Diversity 15 00258 g005
Figure 6. Venn diagram of the variance partitioning analysis illustrating the effect of the macro- and micro-environmental characteristics, vascular plants and bryophytes on the total variation in the species structure of the testate amoeba assemblages. The values show the percentages of the explained variation of each variable (unique contribution) and the joined effects of their interaction (the values are computed from adjusted R2). The analysis is based on the results of the RDA (Hellinger transformed data, covariance matrix). For the significance of the testable fractions, see Table 4.
Diversity 15 00258 g006
Table 1. Brief characteristics of the studied biotopes.
NoLocation (Sample Size)Latitude, °N, Longitude, °EAltitude, m a.s.l.Area, km2Trophic StateDominating Plants
North Ossetia-Alania
1Chifandzar (12)42.919, 43.51422890.556eutrophicCalamagrostis-Sphagnum
Carex-Sphagnum
2Lower Kubus (6)42.893, 43.57620770.0049oligotrophicEriophorum-Sphagnum
3Upper Kubus (6)42.893, 43.57720800.002oligotrophicEriophorum-Sphagnum
Kabardino-Balkaria
4Konskoe (18)43.101, 43.4917760.0002(meso-) oligotrophicCalamagrostis-Rhododendron-Sphagnum
Empetrum-Calamagrostis-Sphagnum
Carex-Sphagnum
5Zayachye (12)43.098, 43.47818100.0001(meso-) oligotrophicEmpetrum-Sphagnum
Eriophorum-Sphagnum
6Vysokoe (12)43.097, 43.47918360.0015(meso-) oligotrophicCarex-Sphagnum
Eriophorum-Sphagnum
7Krugloe (6)43.106, 43.47616480.0001eutrophicCarex-Sphagnum
8Ushtulu (12)42.975, 43.33519950.173eutrophicCarex-Sphagnum
Comarum-Sphagnum
Table 2. Non-parametric Spearman’s correlation coefficients of the measured environmental variables in the Sphagnum-dominated biotopes of eight mires in the Northern Caucasus Mountains. *** p < 0.001, * p < 0.0.
Environmental CharacteristicsWater Table Depth, cmAcidity, pHMineralization, ppm
Acidity, pH−0.57 ***
Mineralization, ppm−0.240.29
Temperature, °C−0.61 ***0.31 *0.52 ***
Table 3. RV coefficients (below diagonal—bottom-left half of the table) and corresponding p-values (above diagonal) among the macro- and micro-environmental variables, vascular plants (presence–absence), bryophytes (presence–absence) and testate amoebae (relative abundances, Hellinger-transformed data, not scaled) in the multiple factor analyses (MFA) of eight mires in the Northern Caucasus Mountains. The MFA indicates the correlation with the overall combined ordination. The upper table represents the first MFA variant that includes the vegetation composition as a single data set; the lower table represents the second MFA where the vegetation composition was split into vascular plants and bryophytes to estimate their contributions separately.
Macro-EnvironmentMicro-EnvironmentVegetationTestate Amoebae
Macro-environment1.00<0.001<0.001<0.001
Micro-environment0.151.00<0.001<0.001
Vegetation0.330.331.00<0.001
Testate amoebae0.380.280.371.00
MFA0.610.590.840.70
Macro-environmentMicro-environmentVascular plantsBryophytesTestate amoebae
Macro-environment1.00<0.001<0.001<0.001<0.001
Micro-environment0.151.00<0.001<0.001<0.001
Vascular plants0.250.301.00<0.001<0.001
Bryophytes0.300.260.411.00<0.001
Testate amoebae0.380.280.270.351.00
MFA0.560.540.710.800.64
Table 4. Results of the RDA (Hellinger transformed data, covariance matrix) on the individual effects of the macro- and micro-environment characteristics, vascular plants and bryophytes on the species composition of Sphagnum-dwelling testate amoebae. Df—degrees of freedom.
Data SetsR2, %Adjusted R2, %DfPseudo-Fp-Value
Macro-environment22.318.34, 795.660.001
Micro-environment2420.24, 796.240.001
Vascular plants34.824.811, 723.490.001
Mosses53.432.126, 572.510.001
Disclaimer/Publisher’s Note: The statements, opinions and data contained in all publications are solely those of the individual author(s) and contributor(s) and not of MDPI and/or the editor(s). MDPI and/or the editor(s) disclaim responsibility for any injury to people or property resulting from any ideas, methods, instructions or products referred to in the content.

