Article

Isotopic Space of the House Mouse in the Gradient of Anthropogenic Habitats

by
Linas Balčiauskas
1,
Andrius Garbaras
2,*,
Vitalijus Stirkė
1,
Raminta Skipitytė
3 and
Laima Balčiauskienė
1
1
Nature Research Centre, Akademijos str. 2, 08412 Vilnius, Lithuania
2
General Jonas Žemaitis Military Academy of Lithuania, Šilo str. 5A, 0322 Vilnius, Lithuania
3
Center for Physical Sciences and Technology, Saulėtekio av. 3, 02300 Vilnius, Lithuania
*
Author to whom correspondence should be addressed.
Diversity 2023, 15(2), 173; https://doi.org/10.3390/d15020173
Submission received: 17 December 2022 / Revised: 23 January 2023 / Accepted: 24 January 2023 / Published: 26 January 2023
(This article belongs to the Collection Feature Papers in Animal Diversity)

Abstract

:
The house mouse (Mus musculus) is a most extensively distributed omnivorous rodent species, usually living in close association with humans. Its diet includes various vegetable matter, insects and any available human food. For the first time, we assessed the dietary niche of this species by the isotopic (δ15N and δ13C) compositions of animal hair samples in the gradient of habitats, ranging from natural to fully commensal. The main factors explaining the differences in the isotopic niche of the mice, being the proxy of their diet, were the season and the source of available food. Influence of the habitat was weak, while gender, age, body mass and body condition had no influence on the diet differences. We found that M. musculus dietary niches overlap between different habitats if mice have access to human food. Niches diverge when mice forage outdoors on natural food compared to farms where livestock feed is available. Compared to omnivorous bank vole (Clethrionomys glareolus) living synoptically, M. musculus has much wider dietary niche and consumes more foods of animal origin. Variability of the diet increases the ecological plasticity of this strongly commensal species and, together with behavioural and reproductive adaptability, allows irresistibly occupy various environments.

1. Introduction

The house mouse (Mus musculus) is a Palaearctic species, currently the most widespread invasive mammal due to its commensal nature, synanthropy and agrophilia [1,2,3,4,5]. M. musculus inhabits all continents except Antarctica [2,6]. Wild populations of this species live in agro-pastoral areas, grasslands and shrublands [7,8]. However, the main habitats of M. musculus are man-made, mainly buildings and farms [1,8,9], where it becomes commensal and storage pest [10].
In Lithuania, M. musculus is a widespread and very common species that is exterminated as an indoor pest [11,12]. In the wild, the species seems not abundant, but agricultural areas have not been intensively surveyed [13,14]. Eventually, M. musculus accounted for 0.97% of all small mammals captured and 0.90% of Tawny owl (Strix aluco) and Long-eared owl (Asio otus) prey between 1975 and 2021 [14]. In synanthropy, the species proportions ranged from zero [15] to 32.4% [16] and 95.5% [17] of the total number of small mammals trapped. Two of the former null sites began to be colonized by mice between 2021 and 2022 (see below).
Feral populations of M. musculus are not stable in temporal, spatial, and social aspects in contrast with commensal populations [18]. This species has exceptional ecological adaptability, allowing it to live in a wide range of environments [19]. The differences in ecology of a species are well reflected in the diversity of its diets [20,21]. As a highly omnivorous species [19], M. musculus can have impact on plant, invertebrate and vertebrate populations [5,22,23]. The most considerable damages might be inflicted in the isolated islands [22,24,25]. On the other hand, variability in diet and resource partitioning allows habitat sharing with the other sympatric or syntopic small mammals [26]. The diet of M. musculus can vary depending on food availability, food quality and competition with other coexisting species [22,27], intraspecific competition and structure of the habitat [28].
The diet composition in small mammals can be investigated with several methods, including faecal analysis [29] and stomach content analysis [30], currently enhanced by using metabarcoding [31]. Field observation of feeding and analysis of food remains [22] is hardly acceptable due to shy behaviour of mice [3,19].
Therefore, the analysis of stable isotope (δ13C and δ15N) ratios is now used to determine small mammal trophic levels and diet [22], resource partitioning [26,32] and trophic interactions [33]. As there may be uncertainties in identifying specific taxa consumed by rodents [34] and discrimination values may vary [35], it is preferable to estimate diet by multiple methods, but this is rarely done. Dietary niche reflects the consumed food, meanwhile isotopic niche reflects the consumed food via animal tissues, as they were formed from the routed dietary nutrients [36]. δ13C and δ15N values have been determined in various tissues, faeces and hair of rodents [37,38,39]. Thus, isotopic niche as a proxy of a diet may reflect dietary niche spaces as they both are related to animal’s diet [33,40].
The studies using mammalian hair as a source for measuring δ13C and δ15N values, has a long history, but is still widely used [39,41,42]. Depending on the pattern of moulting, hair may reflect seasonal, annual or lifelong diets [43,44]. We studied hair samples from small mammals, so most individuals had the same body mass of 15–20 g. Therefore, our samples were not enriched in isotopes due to body mass [45], were not affected by lipid content, which can alter the isotopic ratio in some tissues [46], and were independent of sample fixation [47].It is known that δ13C and δ15N values might differ according to the resources present [48], and so was the case of herbivores, granivores and omnivorous bank vole (Clethrionomys glareolus) in our studies of Lithuanian small mammals in natural [26,49], agricultural [50,51,52] and anthropogenic habitats [15]. However, M. musculus was not analysed.
The aim of the study was to analyse the proportions of M. musculus in small mammal communities, to investigate the variation of δ13C and δ15N values (as an indicator of the species diet) along a gradient of natural, agricultural and common habitats and to assess the influence of season, food source, sex and age of the individual on the variation of the isotopic values in the hair of the individuals.

2. Materials and Methods

2.1. Study Sites and Sampling

Investigation of M. musculus were conducted at 10 sampling sites between 2018 and 2022 (Figure 1). Represented habitats, in order of increasing degree of anthropisation, were: a meadow; two apple orchards, two currant and one raspberry plantation; kitchen garden (limited number of buildings, additional food available only in warm period); two homesteads (various buildings, human food available in the most of the year, no livestock, poultry or rabbit feed) and two farms (various buildings, unlimited access to human food and livestock poultry or rabbit feed).
In all habitats, small mammals were snap-trapped. Small mammals were trapped in summer and autumn in gardens and plantations, but all year round in shared habitats; therefore, four seasons were used for analysis. Traps were set in rows of 25 traps at 5 m spacing in meadows (as control habitats for the orchards), orchards and berry plantations, as described in [13,26,50,51,52]. In kitchen gardens, homesteads and farms, particularly inside structures, small mammals were trapped opportunistically using 5 to 20 traps in and around all accessible buildings [15]. Therefore, relative abundance, expressed as the number of individuals per 100 trap days, was not always available.
Habitats present in homesteads and farms were gardens (including vegetable gardens and orchards), buildings with available human food (such as houses, porches, cellars, box-rooms, barns and greenhouses) and outbuildings without human food available (such as the bathhouse, garage and tool shed). In the investigated farms there were also buildings with livestock feed available for mice all year round, such as sheds and storage rooms. Food availability in commercial orchards depended on agricultural measures, such as grass mowing or soil scarification and, therefore, its seasonality was not pronounced.
M. musculus were identified according to the notch in the upper incisive and the characteristic smell, while other trapped small mammal species were identified by external features and teeth according to the identification key [11]. The gender and age group (adult, sub-adult or juvenile) were assessed at dissection, more detailed information is given in [15,17,26]. We calculated body condition index C based on the body length and body mass, with the weight of the uterus with embryos excluded in pregnant females, according to Moors [53].
Hair samples from trapped M. musculus were collected by cutting small hair tufts from the back. The samples were stored in a refrigerator in separate bags. We collected 105 M. musculus hair samples between 2018 and 2022. Very dirty M. musculus individuals or those damaged by insects were not sampled. Sample breakdown by site and habitat, age and gender of animals is shown in Table 1.

2.2. Stable Isotope Analysis of Hair

Dirty hair samples were washed in deionized water and methanol, then desiccated. Dry samples were weighted (0.5–1 mg) into tin capsules and stored in the sample plate before analyses. The prepared samples were analysed for carbon and nitrogen isotopic ratios using an elemental analyser (Flash EA1112) coupled to an isotope ratio mass spectrometer (Thermo Delta V Advantage) via a ConFlo III interface in Centre for Physical Sciences and Technology, Lithuania. The stable isotope ratios (13C/12C and 15N/14N) are expressed relative to the international standards Vienna Pee Dee Belemnite and atmospheric air, respectively. A total of 5 out of 105 samples were analysed in duplicate and the results obtained for these samples were averaged [52].
Caffeine IAEA-600 (δ13C = –27.771 ± 0.043‰, δ15N = 1 ± 0.2‰), ammonium sulphate IAEA-N-1 (δ15N = 0.4 ± 0.2‰) and graphite USGS24 (δ13C = –16.049 ± 0.035‰), provided by the International Atomic Energy Agency, were used as the reference materials. The standards were resampled every 12 samples, yielding SD = 0.06‰ for carbon and SD = 0.10‰ for nitrogen.

2.3. Data Analyses

The proportion of M. musculus among all trapped small mammals (Table 2) was presented as average and the 95% CI for each locality, differences in the proportions were evaluated using the G test. We also present species richness (S) and diversity (Shannon’s H) as a measure of the diversity of the sampled communities calculated from the pooled data. Differences of Shannon’s indices were calculated using bootstrap with n = 9999. In PAST, the given number of random samples was produced, each with the same total number of individuals as in the original sample.
The δ13C and δ15N values of the hair samples were expressed as the arithmetic mean ± 1 SE and the range (min–max), wider range corresponding to more variable diet. The isotopic values of species and intraspecific groups, including those with sample size n < 5, were visualized in isotopic biplots. The isotopic niches were analysed using the parameters of TA (total area) and SEA (standard ellipse area), unbiased for the sample size [36].
We used GLM to find the influence of the habitat, season, food origin – available food source, gender and age of mice as categorical factors on the dependent parameters: the hair δ15N and δ13C values of M. musculus. Habitats were orchard, homestead, kitchen garden and farm; seasons—spring, summer, autumn and winter; and food sources were natural food, human food and livestock feed. Body mass of an individual and body condition coefficient were set as continuous predictors to control data variability. We also tested if body mass and body condition index were correlated with δ15N and δ13C values. Hotteling’s two sample T2 test for significance was used to test the significance of the model and eta-squared for the species and habitat influence. Outliers were not excluded. Differences between groups were evaluated with the post hoc Tukey’s test, pairwise comparisons with Student’s t. As we did not find differences in δ15N and δ13C values between sites (post hoc, nonsignificant), data were pooled on the habitat basis.
The normality of the distributions of the hair δ15N and δ13C values M. musculus were evaluated using Kolmogorov–Smirnov’s D test online [54].
The minimum confidence level was set as p < 0.05. Calculations were done in Statistica for Windows, version 6.0 (StatSoft, Inc., Tulsa, OK, USA), biplots were drawn in SigmaPlot ver. 12.5 (Systat Software Inc., San Jose, CA, USA), diversity estimates were calculated in PAST ver. 2.17c (Ø. Hammer, D.A.T. Harper, Oslo, Norway). The isotopic niches were calculated with SIBER [36] under R version 3.5.0 (https://cran.r-project.org/bin/windows/base/rdevel.html, accessed on 12 September 2020).

3. Results

3.1. House Mouse in Small Mammal Communities

The surveyed small mammal communities in natural and indoor habitats differed in terms of diversity (Table 2) and in the representation of M. musculus. This species was best represented in the less species-rich communities, with between three and six species. The most species-rich habitats were farmsteads, meadows and kitchen gardens and community diversity was also high in apple orchards.
In the kitchen garden and one of the two homesteads, M. musculus were trapped only in 2022; in the orchards and plantations, a few M. musculus were present in 2018 and 2021, but none in 2019, 2020 and 2022.
The proportion of M. musculus varied significantly between habitats (G = 592.1, p < 0.0001)—it was the dominant species on the farms, accounting for 36.5% of all small mammals caught in site No 3 and 95.5% in site No 9 (Figure 1). The species was not numerous in kitchen gardens and homesteads. The only habitat where the relative abundance of M. musculus was high were farms, where RA was 100–300 times higher than in most natural habitats (Table 2).

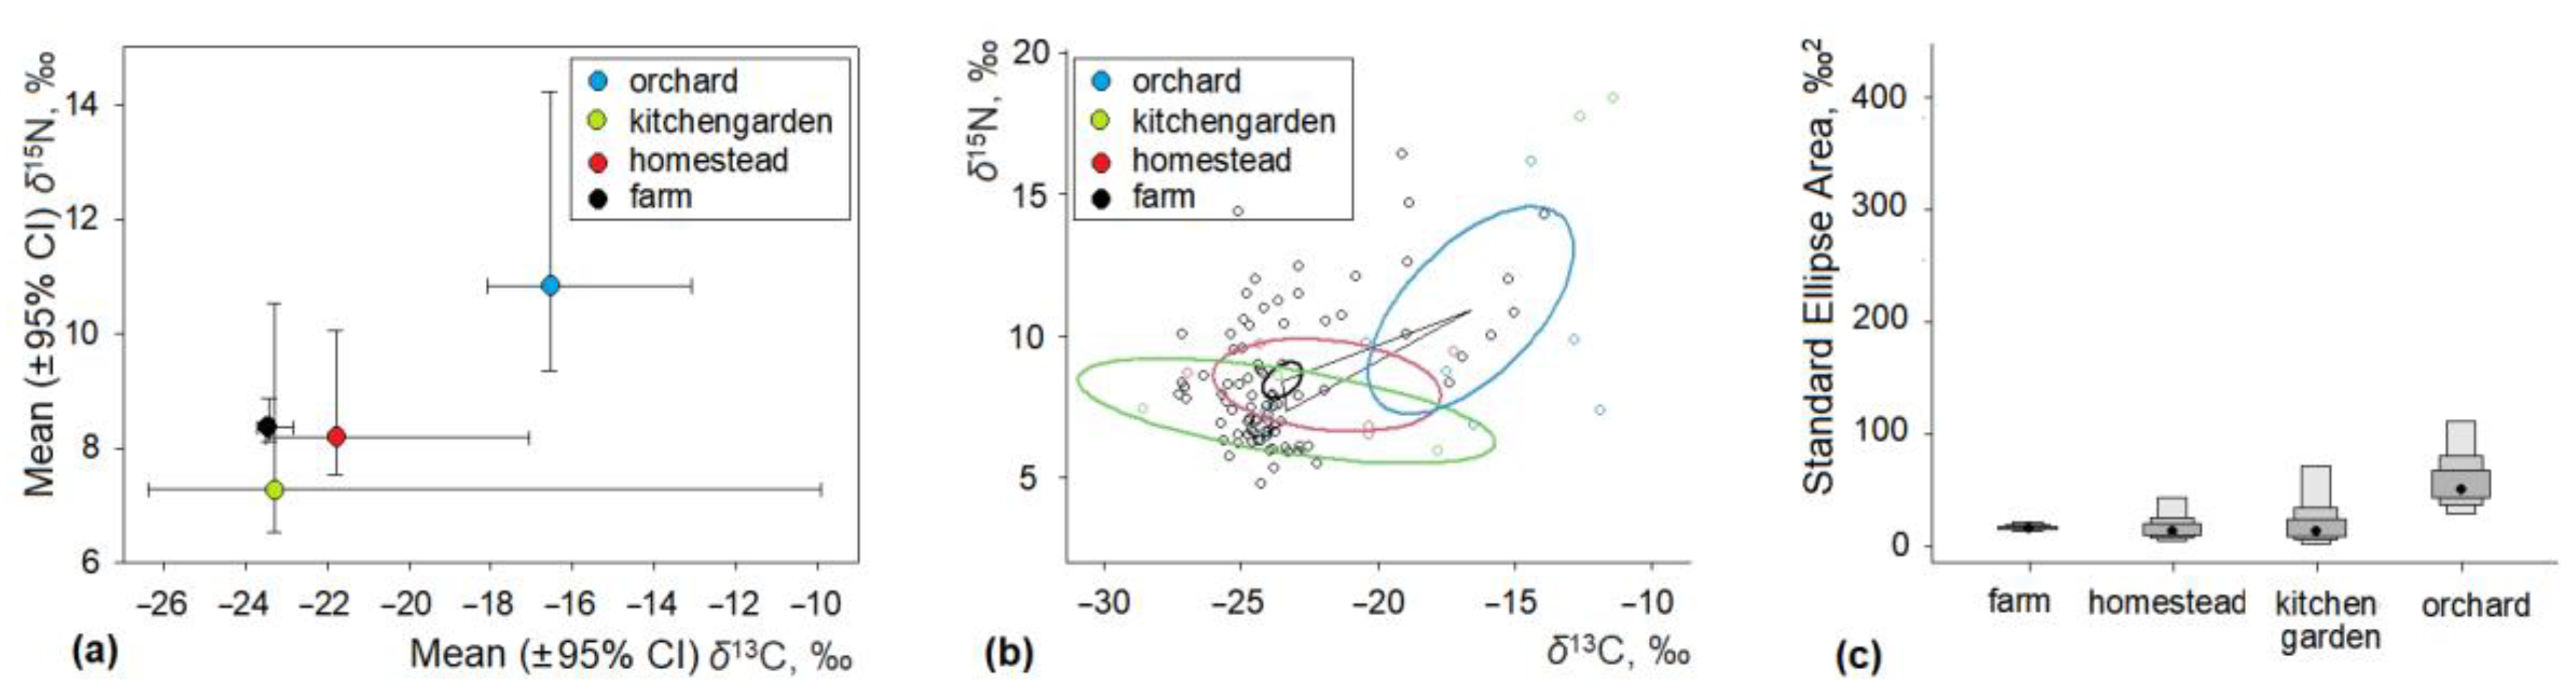
3.2. Stable Isotope Ratios of House Mouse in Anthropogenic Habitats

The central position of the M. musculus stable isotope ratio in the most natural habitats—meadows, gardens and plantations—was the highest according to both δ15N and δ13C. The ranges of hair δ15N values of mice trapped in kitchen gardens and homesteads were very narrow, while the ranges of hair δ15N values of mice trapped on farms and orchard plantations were more than three times wider (Table 3). The wider range reflects the greater variety of foods of animal origin in the diet. Ranges of δ13C values across these habitats did not differ that much.
Normality of distribution was confirmed in all habitats except for hair δ13C values of farm mice (D = 0.22, p < 0.001); kitchen garden and homestead mice samples were pooled.
The cumulative influence of season, habitat, available food source, animal gender and age was significant for the distribution of both δ13C (F14.88 = 5.13, p < 0.0001) and δ15N (F14.88 = 3.80, p < 0.0001) values, explaining 36.2% and 27.8% of the variation, respectively. At univariate level, season (Hotelling’s T2 = 0.17, p < 0.05) and available food source (T2 = 0.18, p < 0.05) were the only significant factors, in both cases eta2 = 0.08. The influence of habitat (T2 = 0.13, p < 0.08) was on the trend level. Two other categorical factors, gender (T2 = 0.02) and age (T2 = 0.02), and continuous predictors, body mass (T2 = 0.001) and body condition (T2 = 0.02), all were not significant.
Correlation between body mass and δ15N was not significant, that with δ13C—significant, but weak (r = –0.23, p < 0.02), explaining only 5.3% of δ13C variance. Correlations of body mass index with δ15N and δ13C were both positive, though weak (r = 0.26 and 0.25, respectively, p < 0.02), explaining 6.5% and 6.4% of variance, respectively.
Average hair δ13C values of mice from farms were significantly lower than those in orchards (Tukey’s HSD, p < 0.001), kitchen gardens and homesteads (both p < 0.05). Habitat separation of M. musculus according to δ15N values was not expressed (Figure 2a).
For comparison in niche size of M. musculus, we calculated standard ellipse areas (SEA). Isotopic niches based on standard ellipses show at least partial overlap in all groups representing different habitats (Figure 2b). Individuals from orchards and kitchen gardens had variation that is more considerable according to SEA (Figure 2c) to compare with the farms and homesteads.
When mice were trapped in natural habitats, their hair δ13C values were significantly higher than in all other cases (HSD, p < 0.001). When the food source included livestock feed indoors, the mice hair δ15N values were the lowest (p < 0.001). As shown by δ13C and δ15N values, M. musculus had similar diets when they could obtain food from both natural and anthropogenic sources, which was assumed to be the case for mice trapped in outbuildings or when human food was readily available, as in the case of mice indoors close to the source of human foods (Figure 3a).
These differences were reflected in the trophic niches of M. musculus. The ellipse areas were completely separated when mice fed in the orchards on the natural foods, compared to when food was received in farms (Figure 3b). Individuals that consumed food from natural sources had significantly more variable isotope values, as shown in Figure 3c, with both estimated TA and SEA being the highest.
If mice were able to obtain natural food and human food at the same time, as was the case for M. musculus trapped at various buildings in the kitchen garden, homesteads and residential buildings on both farms, the ellipses overlapped (Figure 3b), but the variation was much smaller (Figure 3c). The lowest dietary variation and the smallest ellipse area were found for M. musculus using livestock feed.

3.3. Intraspecific Differences of Isotopic Ratios in House Mice

Analysing pooled sample, no gender- or age-based differences were found in the isotopic space of M. musculus (Figure 4). This means that males and females (Figure 4a) and adults, subadults and juveniles (Figure 4b) most probably consumed similar food sources according to their isotopic data. Lower r δ13C values were found in the hair of adult mice, although the difference was at trend level (Tukey’s HSD, p < 0.07). Meanwhile, nitrogen isotopic values of juveniles and subadults tend to be higher.

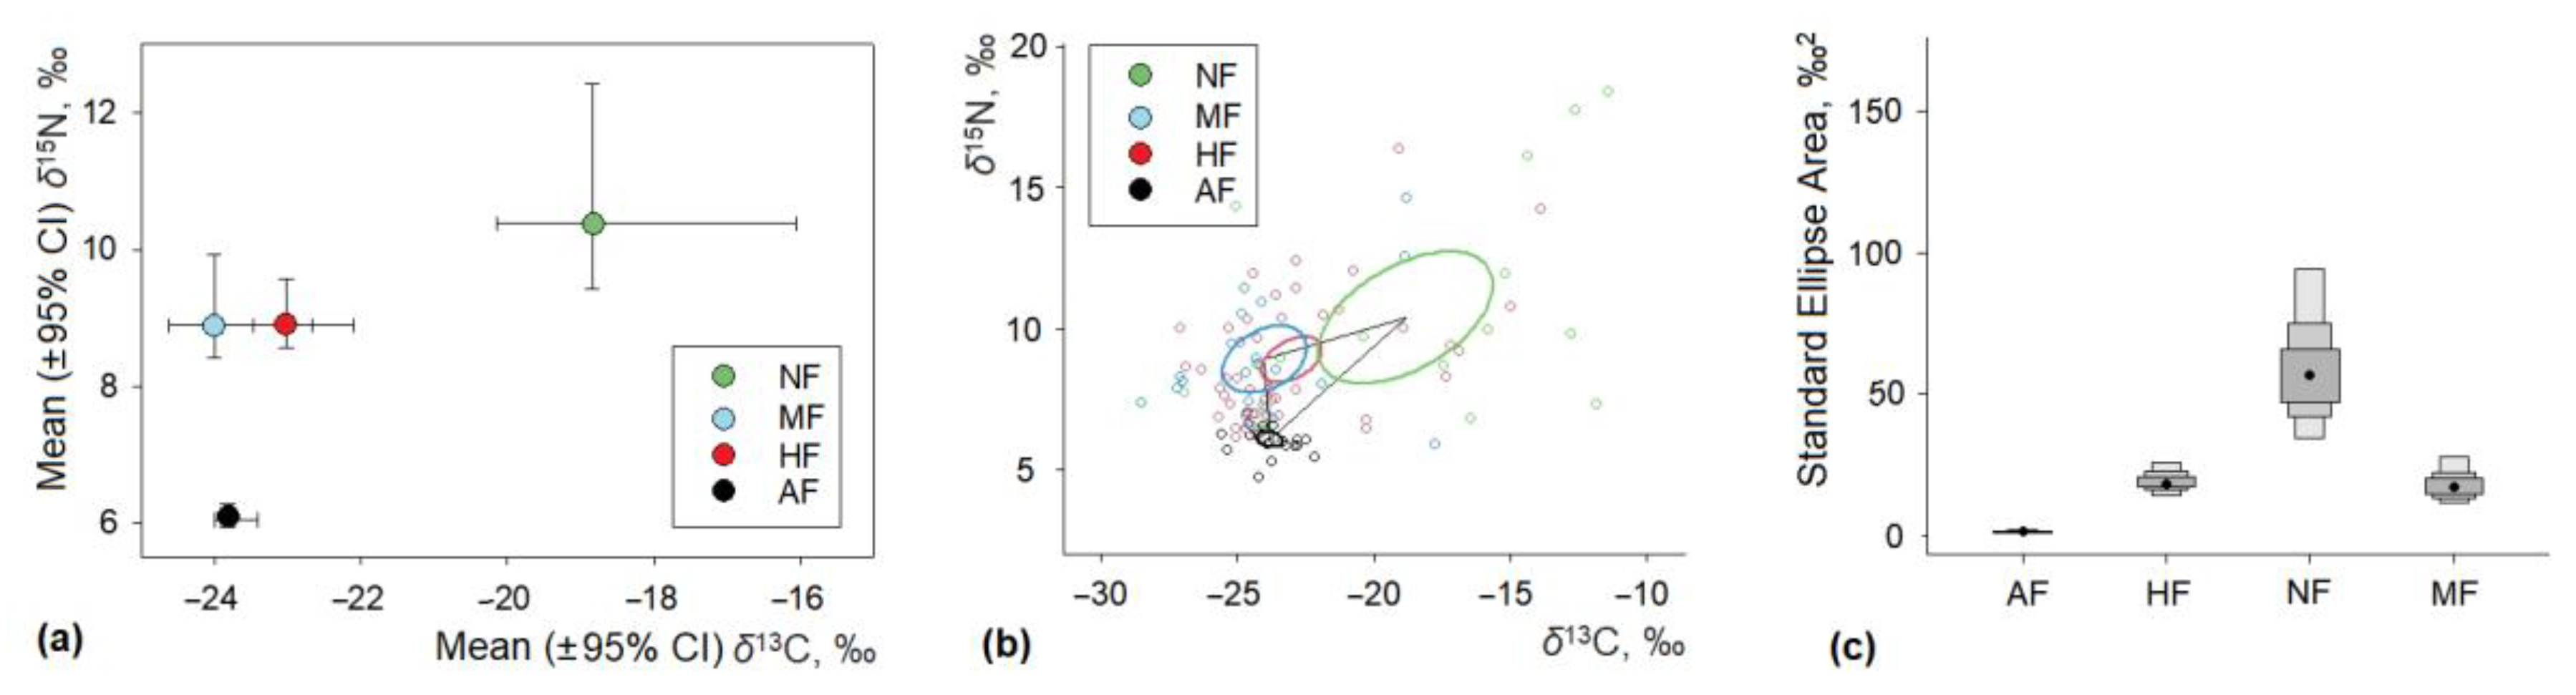
3.4. Seasonal Differences of Isotopic Ratios in House Mice

The isotopic space of M. musculus showed some seasonal aspects (Figure 5). The highest hair δ15N values were found in autumn and significantly exceeded the winter (HSD, p < 0.02) and spring (p < 0.005) values. The highest δ13C values were also characteristic to autumn season (Figure 5a) and exceeded the summer ones (p < 0.01).
Standard ellipse areas of M. musculus overlapped in winter and spring, but were fully separated in autumn and summer (Figure 5b) showing that these seasonal dietary niches were different in some extent. SEA density plots (Figure 5c) showed that in autumn standard ellipse area was considerably larger indicating the wider range of consumed resources in autumn, to compare with the other seasons.

4. Discussion

M. musculus is widely distributed in Lithuania [11,12], though no permanent feral populations exist [12,13,14,17]. However, no studies of species diet have been conducted thus far. Our results from stable isotope analysis of their hair showed that the diet of M. musculus was highly variable, depending mainly on the season and their food source and, to a lesser extent, on the habitat in which the mice were trapped. No intraspecific (age or gender based) differences were found.
We presume that M musculus can change foraging strategies according to the habitat, in particular depending on the degree of anthropogenic impact. We found that M. musculus dietary niches overlap in different habitats as long as mice have access to human food. Therefore, we believe this being an evidence that M musculus prefers food of anthropogenic origin, which is abundant and available throughout the year. Niches diverge when they forage outdoors on natural foods compared to farms where mice have access to livestock feed. The hair δ15N values of mice from farms were lowest, while the δ13C and δ15N values were the highest in the most natural outdoor habitats. When M. musculus were using livestock feed, variation of their diet was minimal.
Living close to humans supports M musculus with nearly unlimited and rich food resources [8], though commensalism in the anthropogenic environments is not sufficiently analysed [55], particularly how species diets are adapted under concurrence with the other small mammals. Interspecific competition limits success of M musculus in outdoor habitats, and possibilities to become crop pests [56]. Initiating this study, we expected house mice to be dominant species in homesteads and kitchen gardens [57], however it appeared only on the third year of the investigation and was not numerous (see Table 2).
Interaction with the similar species inevitably involve competition for resources [3,5,8,22,26,29,58]. This may be a reason limiting permanent feral M. musculus populations, as there are scarce human foods [59]. Competition with other small mammals may lead to the extinction of M. musculus following the displacement of humans [60]. Coexistence with Microtus voles has had a negative effect on the rate of mice population increase [61]. Other species coexisting with M. musculus in our latitudes were the bank vole (Clethrionomys glareolus) and the yellow-necked mouse (Apodemus flavicollis), which are often synoptically registered in agricultural and commensal habitats [62,63,64].
Differences in use of resources and comparisons of the diets of co-habiting species can help to identify their niches [22]. Most interesting is comparison of the isotopic position of C. glareolus (Table 4) and M. musculus (see Table 3) from our study sites, as both are omnivorous [52,57] and were found living synoptically in commensal habitats. The central positions of δ13C and δ15N between these two species differ in orchards (t = 11.3, p < 0.001; t = 8.4, p < 0.001, respectively) and in homesteads (t = 4.8, p < 0.001; t = 1.71, p = 0.10), with both mean values for C. glareolus being lower. Another characteristic feature is the significantly lower range of both δ13C and δ15N for C. glareolus in all habitats compared. Thus, M. musculus most possibly had a much wider dietary niche with higher consumption of foods of animal origin.
Our results show, that the diet of M. musculus expanded during the autumn, endorsed by the highest distribution of individual stable isotope values, with an increase in the consumption of food of animal origin in cases of the higher nitrogen stable isotope values (see Figure 5). Other authors also point to changes in the diet, such as the importance of plants in spring and the increased consumption of invertebrates in autumn [5]. Various insects, earthworms and caterpillars are included in the opportunistic diet of M. musculus on the islands, such consumption threatening invertebrate communities [65]. In some cases, diet of M. musculus have been mostly carnivorous [22].
We did not find strong correlations of the body mass or body condition with the δ13C and δ15N values. Most possibly, correlation of 13C enrichment with body mass [45] works only for larger mammalian herbivores.
The high ecological plasticity of M. musculus allows the species change its diet seasonally and according to habitat characteristics, in particular, but not exclusively, the degree of anthropization of the environment. Flexibility in reproductive strategies [66,67], habitat use [68], switching between agricultural and commensal habitats [69], spatial distribution [70], dispersion and migrations [71], together with behavioural adaptability [19,72] make M. musculus irresistible in nearly all environments [17,68,73,74,75]. However, we had only limited number of M. musculus trapped in orchards and homesteads.

5. Conclusions

After assessing the dietary niche of the house mouse (Mus musculus) in the gradient of natural to fully commensal habitats, that is, in the meadows, orchards, kitchen gardens, homesteads and farms, we found that:
  • The main factors, responsible for the diet variation are the season and the source of available food.
  • The dietary niches of mice eating natural food in orchards were completely separated from those of mice eating livestock feed on farms, the latter having the lowest dietary variation.
  • Based on isotopic data, all mice (males, females, adults, subadults and juveniles) were likely to consume similar diets.
  • M. musculus has much wider dietary niche and consumes more foods of animal origin than the other synoptically living omnivore, the bank vole.

Author Contributions

Conceptualisation and investigation, L.B. (Linas Balčiauskas), R.S., A.G., V.S. and L.B. (Laima Balčiauskienė); methodology and formal analysis, L.B. (Linas Balčiauskas), R.S. and A.G.; data curation, V.S. and L.B. (Laima Balčiauskienė); resources, A.G.; supervision, L.B. (Linas Balčiauskas) and A.G. All authors participated in producing draft. All authors have read and agreed to the published version of the manuscript.

Funding

This research received no external funding.

Institutional Review Board Statement

The study was approved by the Animal Welfare Committee of the NATURE RESEARCH CENTRE, protocols No GGT-7 and GGT-8 (2021, valid until 2024). It was conducted in accordance with Lithuanian (the Republic of Lithuania Law on the Welfare and Protection of Animals No. XI-2271) and European legislation (Directive 2010/63/EU) on the protection of animals. In Lithuania, there is no need or legal obligation to obtain permission or approval to snap trap small mammals. This is especially relevant to the trapping of rodents on private property, which was mostly the case of this investigation.

Informed Consent Statement

Not applicable.

Data Availability Statement

Due to ongoing investigation and preparation of Ph.D. thesis, data of this study are available from the second author upon reasonable request.

Acknowledgments

We appreciate the help of Ida Šaltenienė, Sigitas Podėnas and Vilius Vitkauskas for trapping small mammals in their property.

Conflicts of Interest

The authors declare no conflict of interest.

References

  1. Musser, G.; Hutterer, R.; Kryštufek, B.; Yigit, N.; Mitsainas, G. Mus musculus (amended version of 2016 assessment). IUCN Red List. Threat. Species 2021, e.T13972A197519724. [Google Scholar] [CrossRef]
  2. Wilson, D.E.; Lacher, T.E.; Mittermeier, R.A. Handbook of the Mammals of the World: Rodents II; Wilson, D.E., Lacher, T.E., Mittermeier, R.A., Eds.; Lynx Edicions: Barcelona, Spain, 2017; p. 789. [Google Scholar]
  3. Mazza, V.; Dammhahn, M.; Lösche, E.; Eccard, J.A. Small mammals in the big city: Behavioural adjustments of non-commensal rodents to urban environments. Glob. Chang. Biol. 2020, 26, 6326–6337. [Google Scholar] [CrossRef] [PubMed]
  4. Khlyap, L.A.; Warshavsky, A.A. Synanthropic and agrophilic rodents as invasive alien mammals. Russ. J. Biol. Invasions 2010, 1, 301–312. [Google Scholar] [CrossRef]
  5. Polito, M.J.; Robinson, B.; Warzybok, P.; Bradley, R.W. Population Dynamics and Resource Availability Drive Seasonal Shifts in the Consumptive and Competitive Impacts of Introduced House Mice (Mus musculus) on an Island Ecosystem. bioRxiv. 2022, 10, e13904. [Google Scholar] [CrossRef] [PubMed]
  6. Macholán, M. Mus Musculus; Academic Press: London, UK, 1999. [Google Scholar]
  7. Berry, R.J.; Jakobson, M.E. Adaptation and adaptability in wild-living house mice (Mus musculus). J. Zool. 1975, 176, 391–402. [Google Scholar] [CrossRef]
  8. Pocock, M.J.; Searle, J.B.; White, P.C. Adaptations of animals to commensal habitats: Population dynamics of house mice Mus musculus domesticus on farms. J. Anim. Ecol. 2004, 73, 878–888. [Google Scholar] [CrossRef]
  9. Gomez, D.; Provensal, C.; Polop, J. Microhabitat use by the house mouse Mus musculus in an urban area. Acta Theriol. 2009, 54, 183–192. [Google Scholar] [CrossRef]
  10. Häberle, S.; Schäfer, M.; Soteras, R.; Martínez-Grau, H.; Hajdas, I.; Jacomet, S.; Röder, B.; Schibler, J.; van Willigen, S.; Antolín, F. Small Animals, Big Impact? Early Farmers and Pre- and Post-Harvest Pests from the Middle Neolithic Site of Les Bagnoles in the South-East of France (L’Isle-sur-la-Sorgue, Vaucluse, Provence-Alpes-Côte-d’Azur). Animals 2022, 12, 1511. [Google Scholar] [CrossRef] [PubMed]
  11. Prūsaitė, J. (Comp.). Fauna of Lithuania. In Mammals; Mokslas: Vilnius, Lithuania, 1988; p. 295. [Google Scholar]
  12. Balčiauskas, L.; Trakimas, G.; Juškaitis, R.; Ulevičius, A.; Balčiauskienė, L. Atlas of Lithuanian Mammals, Amphibians and Reptiles, 2nd ed.; Akstis: Vilnius, Lithuania, 1999; p. 47. [Google Scholar]
  13. Balčiauskas, L.; Juškaitis, R. Diversity of small mammal communities in Lithuania (1. A review). Acta Zool. Litu. 1997, 7, 29–45. [Google Scholar] [CrossRef]
  14. Balčiauskas, L.; Balčiauskienė, L. Small Mammal Diversity Changes in a Baltic Country, 1975–2021: A Review. Life 2022, 12, 1887. [Google Scholar] [CrossRef]
  15. Balčiauskas, L.; Balčiauskienė, L.; Garbaras, A.; Stirkė, V. Diversity and Diet Differences of Small Mammals in Commensal Habitats. Diversity 2021, 13, 346. [Google Scholar] [CrossRef]
  16. Atkočaitis, O. Sodybos pastatuose sugauti smulkieji žinduoliai. Theriol. Litu. 2003, 3, 57–61. [Google Scholar]
  17. Balčiauskienė, L.; Balčiauskas, L.; Vitkauskas, V.; Podėnas, S. Indoor small mammals in Lithuania: Some morphometrical, body condition, and reproductive characteristics. Zool. Ecol. 2015, 25, 305–313. [Google Scholar] [CrossRef]
  18. Bronson, F.H. The reproductive ecology of the house mouse. Q. Rev. Biol. 1979, 54, 265–299. [Google Scholar] [CrossRef]
  19. Latham, N.; Mason, G. From house mouse to mouse house: The behavioural biology of free-living Mus musculus and its implications in the laboratory. Appl. Anim. Behav. Sci. 2004, 86, 261–289. [Google Scholar] [CrossRef] [Green Version]
  20. Russell, J.C.; Meyer, J.-Y.; Holmes, N.D.; Pagad, S. Invasive alien species on islands: Impacts, distribution, interactions and management. Environ. Conserv. 2017, 44, 359–370. [Google Scholar] [CrossRef] [Green Version]
  21. Watts, C.; Innes, J.; Wilson, D.J.; Thornburrow, D.; Bartlam, S.; Fitzgerald, N.; Cave, V.; Smale, M.; Barker, G.; Padamsee, M. Do mice matter? Impacts of house mice alone on invertebrates, seedlings and fungi at Sanctuary Mountain Maungatautari. N. Z. J. Ecol. 2022, 46, 3472. [Google Scholar] [CrossRef]
  22. Shiels, A.B.; Flores, C.A.; Khamsing, A.; Krushelnycky, P.D.; Mosher, S.M.; Drake, D.R. Dietary niche differentiation among three species of invasive rodents (Rattus rattus, R. exulans, Mus musculus). Biol. Invasions 2013, 15, 1037–1048. [Google Scholar] [CrossRef]
  23. Norbury, G.; Wilson, D.J.; Clarke, D.; Hayman, E.; Smith, J.; Howard, S. Density-impact functions for invasive house mouse (Mus musculus) effects on indigenous lizards and invertebrates. Biol. Invasions 2022. [Google Scholar] [CrossRef]
  24. Simberloff, D. Rats are not the only introduced rodents producing ecosystem impacts on islands. Biol. Invasions 2009, 11, 1735–1742. [Google Scholar] [CrossRef]
  25. Russell, J.C.; Peace, J.E.; Houghton, M.J.; Bury, S.J.; Bodey, T.W. Systematic prey preference by introduced mice exhausts the ecosystem on Antipodes Island. Biol. Invasions 2020, 2, 1265–1278. [Google Scholar] [CrossRef] [Green Version]
  26. Balčiauskas, L.; Skipitytė, R.; Balčiauskienė, L.; Jasiulionis, M. Resource partitioning confirmed by isotopic signatures allows small mammals to share seasonally flooded meadows. Ecol. Evol. 2019, 9, 5479–5489. [Google Scholar] [CrossRef]
  27. Ruffino, L.; Russell, J.C.; Pisanu, B.; Caut, S.; Vidal, E. Low individual-level dietary plasticity in an island-invasive generalist forager. Pop. Ecol. 2011, 53, 535–548. [Google Scholar] [CrossRef]
  28. Ribeiro, J.F.; Guaraldo, A.; Nardoto, G.B.; Santoro, G.; Vieira, E.M. Habitat type and seasonality influence the isotopic trophic niche of small mammals in a neotropical savanna. Hystrix 2019, 30, 3038. [Google Scholar] [CrossRef]
  29. Abt, K.F.; Bock, W.F. Seasonal variations of diet composition in farmland field mice Apodemus spp. and bank voles Clethrionomys glareolus. Acta Theriol. 1998, 43, 379–389. [Google Scholar] [CrossRef] [Green Version]
  30. Pisanu, B.; Caut, S.; Gutjar, S.; Vernon, P.; Chapuis, J.-L. Introduced black rats (Rattus rattus) on Ile de la Possession (Iles Crozet, Subantarctic): Diet and trophic position in food webs. Polar Biol. 2011, 34, 169–180. [Google Scholar] [CrossRef]
  31. Pinho, C.J.; Lopes, E.P.; Paupério, J.; Gomes, I.; Romeiras, M.M.; Vasconcelos, R. Trust your guts? The effect of gut section on diet composition and impact of Mus musculus on islands using metabarcoding. Ecol. Evol. 2022, 12, e8638. [Google Scholar] [CrossRef] [PubMed]
  32. Symes, C.T.; Wilson, J.W.; Woodborne, S.M.; Shaikh, Z.S.; Scantlebury, M. Resource partitioning of sympatric small mammals in an A frican forest-grassland vegetation mosaic. Austral Ecol. 2013, 38, 721–729. [Google Scholar] [CrossRef]
  33. Baltensperger, A.P.; Huettmann, F.; Hagelin, C.; Welker, J.M. Quantifying trophic niche spaces of small mammals using stable isotopes (δ15N and δ13C) at two scales across Alaska. Can. J. Zool. 2015, 93, 579–588. [Google Scholar] [CrossRef] [Green Version]
  34. Phillips, D.L. Converting isotope values to diet composition: The use of mixing models. J. Mammal. 2012, 93, 342–352. [Google Scholar] [CrossRef] [Green Version]
  35. Caut, S.; Angulo, E.; Courchamp, F. Variation in discrimination factors (Δ15N and Δ13C): The effect of diet isotopic values and applications for diet reconstruction. J. Appl. Ecol. 2009, 46, 443–453. [Google Scholar] [CrossRef]
  36. Jackson, A.L.; Inger, R.; Parnell, A.C.; Bearhop, S. Comparing isotopic niche widths among and within communities: SIBER—Stable Isotope Bayesian Ellipses in R. J. Anim. Ecol. 2011, 80, 595–602. [Google Scholar] [CrossRef]
  37. Hwang, Y.T.; Millar, J.S.; Longstaffe, F.J. Do δ15N and δ13C values of feces reflect the isotopic composition of diets in small mammals? Can. J. Zool. 2007, 85, 388–396. [Google Scholar] [CrossRef]
  38. Kurle, C.M.; Koch, P.L.; Tershy, B.R.; Croll, D.A. The effects of sex, tissue type, and dietary components on stable isotope discrimination factors (Δ13C and Δ15N) in mammalian omnivores. Isot. Environ. Health Stud. 2014, 50, 307–321. [Google Scholar] [CrossRef] [Green Version]
  39. Chibowski, P.; Brzeziński, M.; Suska-Malawska, M.; Zub, K. Diet/Hair and Diet/Faeces Trophic Discrimination Factors for Stable Carbon and Nitrogen Isotopes, and Hair Regrowth in the Yellow-Necked Mouse and Bank Vole. Ann. Zool. Fenn. 2022, 59, 171–185. [Google Scholar] [CrossRef]
  40. Calandra, I.; Labonne, G.; Mathieu, O.; Henttonen, H.; Lévêque, J.; Milloux, M.; Renvoisé, É.; Montuire, S.; Navarro, N. Isotopic partitioning by small mammals in the subnivium. Ecol. Evol. 2015, 5, 4132–4140. [Google Scholar] [CrossRef] [PubMed]
  41. Tieszen, L.L.; Boutton, T.W.; Tesdahl, K.G.; Slade, N.A. Fractionation and turnover of stable carbon isotopes in animal tissues: Implications for δ13C analysis of diet. Oecologia 1983, 57, 32–37. [Google Scholar] [CrossRef]
  42. Sponheimer, M.; Robinson, T.; Ayliffe, L.; Passey, B.; Roeder, B.; Shipley, L.; Lopez, E.; Cerling, T.; Dearing, D.; Ehleringer, J. An experimental study of carbon-isotope fractionation between diet, hair, and feces of mammalian herbivores. Can. J. Zool. 2003, 81, 871–876. [Google Scholar] [CrossRef]
  43. Schwertl, M.; Auerswald, K.; Schnyder, H. Reconstruction of the isotopic history of animal diets by hair segmental analysis. Rapid Commun. Mass Sp. 2003, 17, 1312–1318. [Google Scholar] [CrossRef]
  44. Plikus, M.V.; Chuong, C.M. Complex hair cycle domain patterns and regenerative hair waves in living rodents. J. Investig. Dermatol. 2008, 128, 1071–1080. [Google Scholar] [CrossRef] [Green Version]
  45. Tejada-Lara, J.V.; MacFadden, B.J.; Bermudez, L.; Rojas, G.; Salas-Gismondi, R.; Flynn, J.J. Body mass predicts isotope enrichment in herbivorous mammals. Proc. R. Soc. B 2018, 285, 20181020. [Google Scholar] [CrossRef] [Green Version]
  46. Rioux, È.; Pelletier, F.; St-Laurent, M.H. Influence of lipids on stable isotope ratios in mammal hair: Highlighting the importance of validation. Ecosphere 2019, 10, e02723. [Google Scholar] [CrossRef] [Green Version]
  47. Taylor, D.; DeJesus, E.J.; Novak, M.; Terry, R.C. The effects of formalin fixation and fluid storage on stable isotopes in rodent hair. J. Mammal. 2021, 102, 1635–1647. [Google Scholar] [CrossRef]
  48. Smiley, T.M.; Cotton, J.M.; Badgley, C.; Cerling, T.E. Small-mammal isotope ecology tracks climate and vegetation gradients across western North America. Oikos 2015, 125, 1100–1109. [Google Scholar] [CrossRef]
  49. Balčiauskas, L.; Skipitytė, R.; Jasiulionis, M.; Trakimas, G.; Balčiauskienė, L.; Remeikis, V. The impact of Great Cormorants on biogenic pollution of land ecosystems: Stable isotope signatures in small mammals. Sci. Total Environ. 2016, 565, 376–383. [Google Scholar] [CrossRef] [PubMed]
  50. Balčiauskas, L.; Skipitytė, R.; Garbaras, A.; Stirkė, V.; Balčiauskienė, L.; Remeikis, V. Isotopic Niche of Syntopic Granivores in Commercial Orchards and Meadows. Animals 2021, 11, 2375. [Google Scholar] [CrossRef] [PubMed]
  51. Balčiauskas, L.; Skipitytė, R.; Garbaras, A.; Stirkė, V.; Balčiauskienė, L.; Remeikis, V. Stable Isotopes Reveal the Dominant Species to Have the Widest Trophic Niche of Three Syntopic Microtus Voles. Animals 2021, 11, 1814. [Google Scholar] [CrossRef]
  52. Balčiauskas, L.; Stirkė, V.; Garbaras, A.; Skipitytė, R.; Balčiauskienė, L. Stable Isotope Analysis Supports Omnivory in Bank Voles in Apple Orchards. Agriculture 2022, 12, 1308. [Google Scholar] [CrossRef]
  53. Moors, P.J. Norway rats (Rattus norvegicus) on the Noises and Motukawao islands, Hauraki Gulf, New Zealand. N. Z. J. Ecol. 1985, 8, 37–54. Available online: https://www.jstor.org/stable/24052744 (accessed on 9 December 2022).
  54. The Kolmogorov-Smirnov Test of Normality. Available online: https://www.socscistatistics.com/tests/kolmogorov/default.aspx (accessed on 9 December 2022).
  55. Hulme-Beaman, A.; Dobney, K.; Cucchi, T.; Searle, J.B. An ecological and evolutionary framework for commensalism in anthropogenic environments. Trends Ecol. Evol. 2016, 31, 633–645. [Google Scholar] [CrossRef] [Green Version]
  56. Gomez, M.D.; Provensal, M.C.; Polop, J.J. Effect of interspecific competition on Mus musculus in an urban area. J. Pest Sci. 2008, 81, 235–240. [Google Scholar] [CrossRef]
  57. Balčiauskas, L.; Balčiauskienė, L. On the doorstep, rodents in homesteads and kitchen gardens. Animals 2020, 10, 856. [Google Scholar] [CrossRef] [PubMed]
  58. Evans, J.C.; Lindholm, A.K.; König, B. Long-term overlap of social and genetic structure in free-ranging house mice reveals dynamic seasonal and group size effects. Curr. Zool. 2021, 67, 59–69. [Google Scholar] [CrossRef]
  59. Souquet, L.; Chevret, P.; Ganem, G.; Auffray, J.C.; Ledevin, R.; Agret, S.; Hautier, L.; Renaud, S. Back to the wild: Does feralization affect the mandible of non-commensal house mice (Mus musculus domesticus)? Biol. J. Linn. Soc. 2019, 126, 471–486. [Google Scholar] [CrossRef]
  60. Fairley, J.S.; Smal, C.M. Feral house mice in Ireland. Ir. Nat. J. 1987, 22, 284–290. Available online: https://www.jstor.org/stable/25539173 (accessed on 9 December 2022).
  61. Delong, K.T. Population Ecology of Feral House Mice: Interference by Microtus. Ecology 1966, 47, 481–484. [Google Scholar] [CrossRef]
  62. Canova, L.; Fasola, M. Communities of small mammals in six biotopes of northern Italy. Acta Theriol. 1991, 36, 73–86. Available online: https://rcin.org.pl/ibs/dlibra/publication/edition/11774 (accessed on 9 December 2022). [CrossRef] [Green Version]
  63. Chalmers, R.; Sturdee, A.; Bull, S.; Miller, A.; Wright, S.E. The prevalence of Cryptosporidium parvum and C. muris in Mus domesticus, Apodemus sylvaticus and Clethrionomys glareolus in an agricultural system. Parasitol. Res. 1997, 83, 478–482. [Google Scholar] [CrossRef]
  64. Michalski, A.; Niemcewicz, M.; Bielawska-Drózd, A.; Nowakowska, A.; Gaweł, J.; Pitucha, G.; Joniec, J.; Zielonka, K.; Marciniak-Niemcewicz, A.; Kocik, J. Surveillance of hantaviruses in Poland: A study of animal reservoirs and human hantavirus disease in Subcarpathia. Vector-Borne Zoonot. 2014, 14, 514–522. [Google Scholar] [CrossRef] [Green Version]
  65. Le Roux, V.; Chapuis, J.L.; Frenot, Y.; Vernon, P. Diet of the house mouse (Mus musculus) on Guillou Island, Kerguelen archipelago, Subantarctic. Polar Biol. 2002, 25, 49–57. [Google Scholar] [CrossRef]
  66. Rowe, F.P.; Swinney, T.; Quy, R.J. Reproduction of the House mouse (Mus musculus) in farm buildings. J. Zool. 2009, 199, 259–269. [Google Scholar] [CrossRef]
  67. Vadell, M.V.; Villafañe, I.E.G.; Cavia, R. Are life-history strategies of Norway rats (Rattus norvegicus) and house mice (Mus musculus) dependent on environmental characteristics? Wildlife Res. 2014, 41, 172–185. [Google Scholar] [CrossRef]
  68. Gomez, M.D.; Priotto, J.; Provensal, M.C.; Steinmann, A.; Castillo, E.; Polop, J.J. A population study of house mice (Mus musculus) inhabiting different habitats in an Argentine urban area. Int. Biodeter. Biodegr. 2008, 62, 270–273. [Google Scholar] [CrossRef]
  69. León, V.A.; Fraschina, J.; Guidobono, J.S.; Busch, M. Habitat use and demography of Mus musculus in a rural landscape of Argentina. Integr. Zool. 2012, 8, 18–29. [Google Scholar] [CrossRef]
  70. Sked, S.; Liu, C.; Abbar, S.; Corrigan, R.; Cooper, R.; Wang, C. The Spatial Distribution of the House Mouse, Mus musculus domesticus, in Multi-Family Dwellings. Animals 2022, 12, 197. [Google Scholar] [CrossRef]
  71. Pocock, M.J.O.; Hauffe, H.C.; Searle, J.B. Dispersal in house mice. Biol. J. Linn. Soc. 2005, 84, 565–583. [Google Scholar] [CrossRef] [Green Version]
  72. Vrbanec, L.; Matijević, V.; Guenther, A. Enhanced problem-solving ability as an adaptation to urban environments in house mice. Proc. R. Soc. B 2021, 288, 20202504. [Google Scholar] [CrossRef]
  73. Boitani, L.; Loy, A.; Molinari, P. Temporal and spatial displacement of two sympatric rodents (Apodemus sylvaticus and Mus musculus) in a Mediterranean coastal habitat. Oikos 1985, 45, 246–252. [Google Scholar] [CrossRef]
  74. de la Peña, N.M.; Butet, A.; Delettre, Y.; Paillat, G.; Morant, P.; Le Du, L.; Burel, F. Response of the small mammal community to changes in western French agricultural landscapes. Landscape Ecol. 2003, 18, 265–278. [Google Scholar] [CrossRef]
  75. Csanády, A.; Kisková, J.; Galušková, S.; Duranková, S.; Pristaš, P.; Sedláková-Kaduková, J. The house mouse (Mus musculus) in small farmstead buildings in Slovakia. Biologia 2021, 76, 1205–1213. [Google Scholar] [CrossRef]
Figure 1. Study sites in Lithuania, 2018–2022. Habitats, in order from natural to most commensal, indicated by colour.
Diversity 15 00173 g001
Figure 2. Position of M. musculus in isotopic space according to hair sample stable isotope ratios in the gradient of anthropogenic disturbance of habitats, from orchards to farms (a), ellipses, representing isotopic niche width areas of the mice from different habitats (b), and SEA density plots, representing the credibility intervals of the Bayesian SEA with shaded boxes encompassing the 50th, 75th and 95th (shown from dark to light) credibility intervals for different habitats (c).
Diversity 15 00173 g002
Figure 3. Position of M. musculus in isotopic space according to hair sample stable isotope ratios in the gradient of available food sources (a), ellipses, representing isotopic niche width areas of the mice, according to available food sources (b), and SEA density plots, representing the credibility intervals of the Bayesian SEA with shaded boxes encompassing the 50th, 75th and 95th (shown from dark to light) credibility intervals, according to available food sources (c). NF—mice foods originated from natural sources, MF—mice foods from natural and anthropogenic sources; HF—human foods available; AF—livestock, rabbits and poultry feed available.
Diversity 15 00173 g003
Figure 4. Intraspecific differences of the isotopic space of M. musculus: (a)—gender-based; (b)—age-based.
Diversity 15 00173 g004
Figure 5. Seasonal position of M. musculus in isotopic space according to hair sample stable isotope ratios (a), ellipses, representing isotopic niche width areas of the mice, trapped at different seasons (b), and SEA density plots, representing the credibility intervals of the Bayesian SEA with shaded boxes encompassing the 50th, 75th and 95th (shown from dark to light) credibility intervals, according to the seasons (c).
Diversity 15 00173 g005
Table 1. M. musculus sample size for stable isotope analysis.
Site NoYearHabitatNMalesFemalesAdultsSubadultsJuveniles
12022Apple orchard110001
22022Apple orchard220020
22018, 2021Meadow422202
32021–2022Farm654322381215
42018Currant plantation110001
52022Homestead110010
62018–2019Raspberry plantation211110
72022Homestead422103
82022Kitchen garden312210
92018Farm2111101038
102019Currant plantation110100
In total 1056639552030
Table 2. Characteristics of small mammal communities in relation to gradient of habitats, from natural to farms. N—number of trapped small mammal individuals; S—number of trapped species; H—diversity (Shannon’s index); P%—proportion of M. musculus (95% CI); RA– relative abundance of M. musculus (individuals per 100 trap days). Superscript letters denote differences of the values in columns, significant at p < 0.05.
HabitatYear NSHP%RA
Meadow2018–2022152101.48 a3.3 a (CI = 1.1–7.5)0.05
Apple orchard2018–202213481.35 a2.2 a (CI = 0.5–6.4)0.03
Currant plantation2018–20199260.96 b2.2 a (CI = 0.3–7.6)0.02
Raspberry plantation2018–2019730.96 b28.6 b (CI = 3.8–71.0)0.19
Kitchen garden2019–202236191.24 c0.8 a (CI = 0.2–2.4)n/a
Homestead2019–2022645111.36 a0.9 a (CI = 0.3–2.0)n/a
Farm2018, 2021–202228961.26 c59.2 b (CI = 53.3–64.9)6.67
Table 3. Central position (mean ± SE) and ranges of hair stable isotope ratios of M. musculus.
HabitatNδ13C, ‰δ15N, ‰
Mean ± SE Min–MaxRangeMean ± SEMin–MaxRange
Orchard and plantation 10–16.55 ± 1.53−24.09–−11.4212.6710.84 ± 1.496.42–18.4011.98
Kitchen garden3–23.28 ± 3.11−28.51–−17.7510.767.29 ± 0.765.93–8.552.62
Homestead5–21.79 ± 1.70−26.88–−17.199.698.20 ± 0.676.49–9.673.18
Farm86–23.42 ± 0.29−27.21–−13.8913.328.37 ± 0.264.72–16.4111.69
Table 4. Central position (mean ± SE) and ranges of stable isotope ratios in the hair of C glareolus, living synoptically in the investigated habitats, according to [52,57].
HabitatNδ13C, ‰δ15N, ‰
Mean ± SEMin–MaxRangeMean ± SEMin–MaxRange
Homestead56−25.91 ± 0.11−27.90–−23.983.925.94 ± 0.262.44–10.708.26
Kitchen garden5−25.40 ± 0.28−27.43–−24.572.866.14 ± 0.264.78–7.062.28
Orchard and plantation155−23.63 ± 0.08−26.00–−28.552.555.84 ± 0.16–1.62–11.302.28
Disclaimer/Publisher’s Note: The statements, opinions and data contained in all publications are solely those of the individual author(s) and contributor(s) and not of MDPI and/or the editor(s). MDPI and/or the editor(s) disclaim responsibility for any injury to people or property resulting from any ideas, methods, instructions or products referred to in the content.

