Article

Impact of Nesting Mode, Diet, and Taxonomy in Structuring the Associated Microbial Communities of Amazonian Ants

by
Anaïs Chanson
1,2,
Corrie S. Moreau
3 and
Christophe Duplais
4,*
1
Université de Guyane, UMR8172 Ecofog, Campus AgroParisTech, CNRS, Cirad, INRAE, Université des Antilles, 97304 Kourou, France
2
Department of Life Sciences, College of Science, University of Lincoln, Lincoln LN6 7TS, UK
3
Departments of Entomology and Ecology & Evolutionary Biology, Cornell University, Ithaca, NY 14850, USA
4
Department of Entomology, Cornell AgriTech, Cornell University, Geneva, NY 14456, USA
*
Author to whom correspondence should be addressed.
Diversity 2023, 15(2), 126; https://doi.org/10.3390/d15020126
Submission received: 29 November 2022 / Revised: 6 January 2023 / Accepted: 7 January 2023 / Published: 17 January 2023
(This article belongs to the Special Issue Diversity, Biogeography and Community Ecology of Ants II)

Abstract

:
Studies of ant biodiversity are important to understand their group better, as well as to extend our knowledge on the evolution of their associated organisms. Host-associated microbial communities, and particularly bacterial communities, are shaped by different host factors such as habitat, diet, and phylogeny. Here, we studied the structures of bacterial and microbial eukaryote communities associated with Amazonian ants collected from two habitats: the rainforest and the city. We collected 38 ant species covering a large taxonomic range, and we used 16S rRNA and 18S rRNA amplicon sequencing to study the impact of the host’s ecological and phylogenetic factors on their microbial communities. Our results show that (1) habitat does not structure ant microbial communities, (2) ant diet and nesting mode impact bacterial communities, while only nesting mode structures microbial eukaryote communities, and (3) microbial diversity is not correlated with host phylogeny, although several ant genera have conserved bacterial communities. As we continue to uncover the diversity and function of insect-associated microbes, this work explores how host ecology and evolutionary history shape ant microbial communities.

1. Introduction

One of the major goals in community ecology is to understand the diversity, maintenance, and consequences of biological interactions between different communities, especially in increasingly fragmented ecosystems [1]. Studies of ant biodiversity are not just relevant to an understanding of this globally dominant faunal group but also to an understanding of the evolution of associated organisms. Every organism has biological needs that can only be met under specific environmental conditions. Habitat filtering is one of the processes invoked to explain why, in a given habitat, only individual species possessing suitable traits for this specific habitat can persist [2,3]. Organisms rely on specific factors to survive and thrive. When organisms living in the same local environment depend on the same resources, they engage in competition for those resources, often leading to competitive exclusion [4]. In contrast, when certain organisms living in the same local environment do not depend on the same resources, they can coexist without competition, and this process is described as niche differentiation [3,5].
Microbial communities are ubiquitous and can be found in all types of environments, even the most extreme [6,7]. Environmental factors have been shown to have strong impacts on microbial richness and diversity in species-rich biomes [8,9,10,11,12,13]. Microbial communities are also often found in associations with diverse host organisms. In insects, symbiotic bacteria have shaped the evolution of their hosts and are key components in providing basic functions to their host [14,15]. Mutualistic bacteria are known to supplement nutritionally insufficient host diets [16,17,18,19]. They also help maintain and improve their host’s health and immune system [20,21] and participate in broadening their host’s environmental tolerance [22,23,24,25,26]. On the other hand, parasitic bacteria can manipulate host reproduction [27] and limit host dispersion [28,29].
Compared to the study of insect-associated bacteria, scientific research on insect-associated microbial eukaryotes is not as widespread. Indeed, scientists tend to study insect-associated eukaryotes only when an insect shows outward signs of infection. Common signs of insect infection include behavioral and morphological changes such as climbing on the top of the canopy or a change in color and size. Many microbial eukaryotes including pathogenic fungi, nematodes, and protists have been identified as being associated with insects. Ascomycota fungi infect a wide range of insect hosts, and after killing an insect, often feed on its cadaver [30]. Basidiomycota and Chytriodiomycota fungi are known parasites of scale insects [31,32] and insect eggs [33,34], whereas Zygomycota occur on various insects without showing signs of host pathogenicity [35,36,37,38]. Regarding nematodes, several Heterorhabditis and Steinerma species have been reported as pathogens of coleopterans [39], dipterans [40], lepidopterans [41], and orthopterans [42]. Other nematodes also use insects as vectors but do not necessarily kill them. This is the case for several Brugia [43,44], Dirofilaria [45], Onchocerca [46], and Wuchereria [47] species, which use mosquitoes or midges as vectors to transmit diseases. Finally, among the stramenophiles, oomycota [48,49] are known to infect insects. Mutualistic associations between eukaryotes and insects are also widespread, especially between insects and fungi [50]. One of the most common examples is the cultivation of fungi for nutrition, which exists in several species of ants [51], beetles [52], and termites [53]. Mutualistic non-nutritional associations have also been demonstrated in numerous tripartite symbioses between the ascomycete (order: Chaetothyriales) fungi–plant–ant [54,55,56]. Another important aspect of mutualism between insects and fungi is the dispersion of fungi. Many insects have even evolved to have specific organs to carry fungal spores [57,58] or carry them in the gut [59]. Finally, insects also benefit from antimicrobial molecules produced by some fungi [60]. Mutualistic associations between insects and nematodes are rare, but a few examples are known [61], and some nematodes may have mutualistic associations with bacteria within insect hosts [62]. However, relying on observational methods limits the study of microbial eukaryote diversity in insects.
Among insects, ants represent a species-rich clade with different ecologies and provide many ecosystem services [63]. Symbiotic bacteria are thought to be partly responsible for their evolutionary success. For example, it has been hypothesized that symbiotic bacteria allow ants to dominate rainforest canopies [64,65]. Many studies have shown that symbiotic bacteria in ants differ depending on the ant diet, especially between herbivorous and carnivorous ants [66]. Predatory army ants possess specialized Firmicutes and Entomoplasmatales gut bacteria, which are common to all lineages of army ant with a symbiosis dating from the Cretaceous period and which are likely socially transmitted by trophallaxis or coprophagy [67,68]. The functional role of these bacteria in army ants is not yet known due to the lack of available symbiont genomes from army ants, but a nutritional role for these symbionts has been suggested [68]. Herbivorous turtle ants rely on symbiotic gut bacteria to recycle nitrogen into amino acids [69,70], while the Camponotoni tribe benefits from amino acid production by the obligate intracellular symbiont Blochmannia [19,71]. In addition, many studies have studied the bacterial communities of specific ant clades, such as Daceton [72], Paraponera [73], ponerine ants [74], Pseudomyrmex [75], Solenopsis [76], and spiny ants [77]. Several bacteria symbionts are associated across these multiple ant clades. For example, Acetobacterales, Entomoplasmatales, and Rhizobiales are bacterial orders commonly found in ant guts. Their role in ants is not fully understood, but Acetobacterales might be involved in larval immune function [78] and development [79], while Entomoplasmatales might be involved in chitin processing of insect prey [80], and Rhizobiales might be involved in protein degradation [81] and urea recycling pathways [82]. The bacteria symbiont Wolbachia is also found across several ant clades and may induce reproductive changes in hosts [83] and vitamin B supplementation [84], although in most cases, there appear to be no positive or negative effects of Wolbachia infection for ants. Several microbial eukaryotes are also known to be associated with ants. The fungal class Sordariomycetes contains several species that infect ants, like the pathogen fungus infecting fungus-growing ants [85] or the fungus causing zombie ants [86]. Among the nematodes, many families have been shown to infect different ant species [87].
In this work, we aimed to study the factors structuring the microbial communities associated with Amazonian ants. We collected 38 ant species in French Guiana from a wide phylogenetic range spanning several ant subfamilies. We focused on the microbial communities associated in terms of both abundance and diversity using qPCR and 16S rRNA and 18S rRNA amplicon sequencing. Our sampling strategy had three objectives. First, a wide phylogenetic range was chosen to test correlations between microbial communities and the evolutionary history of their hosts. Second, we collected species possessing different ecological traits (diet and nesting mode) which were assessed for their correlations with bacterial communities. Third, among the 38 collected ant species, nine species were collected from both rainforest and city habitats to evaluate the impact of the environment on microbial communities. The results of this work contribute to our understanding of the different factors structuring the microbial communities associated with Neotropical ants.

2. Materials and Methods

2.1. Sample Collection

Samples were collected in March 2018 from two sites in French Guiana in the Nouragues Rainforest Reserve and the city of Cayenne (Figure S1). A total of 49 ant colonies were collected, representing 38 ant species from 18 genera spanning eight subfamilies. Several workers were collected from each colony with pincers and stored in small individual tubes containing ethanol. Then, tubes were kept at −20 °C until DNA extraction. Collected ant samples were identified up to the species level, when possible, in the field with a magnifying glass. Identifications were further refined in the lab with a binocular magnifier using the key to subfamilies of the Neotropical region from Baccaro et al. [88] The list of collected samples and different phylogenetic (subfamily, genera) and ecological factors (habitat, nesting mode, and diet) chosen is presented in Supplementary File S1. For 44 of the 49 sampled colonies, we also collected a sample of the nest material or foraging area. Nest samples were collected and stored in small sterile bags. Then, bags were kept at −20 °C until DNA extraction. Vouchers for all samples were deposited in the Cornell University Insect Collection (Ithaca, New York, NY, USA).

2.2. DNA Extractions

DNA extractions from single ants and nest samples were performed using the DNeasy PowerSoil Kit (Qiagen, Germantown, MD, USA) following the manufacturer’s protocol with a few modifications before the first step. For the DNA extractions, a single worker from each collected nest was used, and between 0.1 and 0.25 g of nest material was used. First, ant samples and nest samples were introduced into sterile 1.5 mL Eppendorf tubes. Then, 1 mL of liquid nitrogen was added to each Eppendorf tube, and each sample was immediately manually crushed in the tube with a sterile micropestel. To avoid any contamination between samples during this step, a new sterile micropestel was used for each sample tube. The crushed samples were then transferred to tubes with 500 µL PowerSoil bead solution. Following the procedure suggested by Rubin et al. [89], 60 µL of solution C1 and 100 µg of proteinase K were added to each PowerSoil tube, and tubes were incubated at 56 °C overnight. The extraction then proceeded following the DNeasy PowerSoil Kit protocol. The same protocol was followed with 4 blank tubes containing no ant or nest sample, and these served as negative controls. Filtered pipette tips and sterile techniques were used in every step to avoid contamination [90]. All DNA extractions were quantified via Qubit to verify the success of the DNA extraction. The Qubit quantification was performed with the High Sensitivity Assay Kit (Life Technologies Corp., Carlsbad, CA, USA).

2.3. DNA Amplification

Amplification of the V4 region of bacterial 16S rRNA for the ant and nest dataset and V1–V2 region of 18S rRNA of the ant dataset as well as Miseq sequencing of each DNA dataset were performed by the Argonne National Laboratory (Lemont, IL, USA). Negative controls were also processed following the same protocol. Following the protocol suggested in the Earth Microbiome Project (EMP) (http://www.earthmicrobiome.org/protocols-and-standards/16S/, accessed on 9 December 2019), amplifications for the V4 region of 16S rRNA were performed using 515F (5′-GTGCCAGCMGCCGCGGTAA) and 806R (5′-GGACTACHVGGGTWTCTAAT) primers, as described by Caporaso et al. [91], and amplifications for the V1–V2 region of 18S rRNA were performed using F04 (5′-GCTTGTCTCAAAGATTAAGCC) and R22 (5′-GCCTGCTGCCTTCCTTGGA) primers, as described by Creer et al. [92]. Each PCR reaction contained 12 µL of DNA-free PCR water, 10 µL of 5 Prime HotMasterMix 1X, 1 µL of 5 mM forward primer, 1 µL of 5 mM Golay barcode tagged reverse primer, and 1 µL of extracted DNA. The amplification conditions were as follows: 94 °C for 3 min, with 35 cycles at 94 °C for 45 s, 50 °C for 60 s, and 72 °C for 90 s, and a final cycle of 10 min at 72 °C. Each PCR reaction was performed in triplicate. Electrophoresis with 1% agarose gel was performed to confirm the efficiency of the amplification. Amplification samples from ants and their nests were pooled separately with each pool containing a 100 μL samplr, and these were cleaned using the QIAquick PCR Purification Kit (Qiagen, USA) following the manufacturer’s instructions. The molarity of the pool was determined and diluted down to 4 nM, denatured, and then diluted to a final concentration of 6.75 pM with 10% PhiX for sequencing. Three separate runs (one for the 16S rRNA ant dataset, one for the 16S rRNA nest dataset and one for the 18S rRNA ant dataset) were performed with the MiSeq Illumina V3 Reagent Kit 600 Cycles (300 × 300) using the custom sequencing primers and procedures described in the Supplementary Methods by Caporaso et al. [91] for 16S rRNA and Creer et al. [92] for 18S rRNA.

2.4. Bacterial Quantification

Bacterial quantification of each sample was performed through qPCR quantification (Thermo Fisher Scientific, Waltham, MA, USA) on real-time CFX Connect equipment (Bio-Rad). A SYBRAdvanced 2X (Bio-Rad) SYBR green supermix and 2 μL of extracted DNA were used to verify the total amount of bacteria present in each sample. Amplification of the V4 region of 16S rRNA in the qPCR was performed using 515F and 806R primers, as described by Caporaso et al. [91], following the protocol suggested in the Earth Microbiome Project (EMP) (http://www.earthmicrobiome.org/protocols-and-standards/16S/, accessed on 9 December 2019). Each qPCR reaction was performed in triplicate. Standard curves were generated from serial dilutions of linearized plasmids containing E. coli 16S rRNA inserts, following the same parameters of Rubin et al. [89]. All triplicate qPCRs values were satisfactory and had R2 values from 70% to 100%. The mean triplicate value for each sample was used in the analysis. Negative controls were also analyzed following the same protocol.

2.5. Bacterial and Microbial Eukaryote Diversity

Demultiplexing of sequences and taxonomic assignments was performed separately for the ant and nest sequences but following the same protocol. Demultiplexed sequences were analyzed using Qiime2-2019.1 [93] with the plugin demux (https://github.com/qiime2/q2-demux, accessed on 22 August 2020). Sequence quality control and feature table construction were performed through the dada2 plugin [94]. Taxonomic assignment was conducted with the SILVA_132_QIIME database [95], and the ASVs (amplicon sequence variants) were selected with 99% identity. To generate the taxonomy table, paired-end sequence reads were trimmed in the V4 region of 16S rRNA with the 515F/806R primers and in the V1–V2 region of 18S rRNA with the F04/R22 primers. Thereby, our own classifier was created using the “feature-classifier fit-classifier-naive-bayes” command. Once the classifier was obtained, the reads (rep-seqs) were classified by taxon using the “feature-classifier classify-sklearn” command [96].
The filtration of contaminants (blank samples) in the datasets was performed with the Decontam package [97] of R software version 4.02 [98]. In this package, the prevalence method was used to remove the contaminant sequences from our samples. The decontaminated datasets were inserted back into Qiime2 [93] to filter all mitochondria and chloroplast sequences from the datasets. Hymenopteran sequences were also excluded from the 18S rRNA table so that sequences coming from the ant host did not appear in our analyses. The alignment was performed using the align-to-tree-mafft-fasttree command [99] to reconstruct the microbial phylogenies.
The alpha and beta diversity analyses were performed by using the “qiime diversity core-metrics-phylogenetic” command. Beta diversities were visualized using the visualization interface https://view.qiime2.org/, accessed on 22 August 2020. Alpha diversity metrics computed were the Shannon index, the Pielou’s evenness index, the Faith’s phylogenic diversity, and the number of ASVs. Beta diversity metrics computed were the Jaccard similarity index, Bray–Curtis dissimilarity, unweighted unifrac distance, and weighted unnormalized unifrac distance. The Jaccard similarity index gauges the similarity and diversity without accounting for the abundance [100]. The Bray–Curtis dissimilarity is a measure of the overabundant taxa [101]. The unweighted unifrac distance measures the unique branch length [102], and the weighted unnormalized unifrac distance estimates the abundance but does not correct for different evolutionary rates between taxa [103].

2.6. Statistical Analysis

Statistical analyses of bacterial quantification were performed using one-way ANOVAs (Analysis of Variance) with PAST software version 4.02 [104]. Statistical analyses of alpha diversity and beta diversity were performed on Qiime2-2019.1 [93] using the “diversity alpha-group-significance” command with the pairwise Kruskal–Wallis methods, and the “diversity beta-group-significance” command with the pairwise PERMANOVA method and 999 permutations. The bacterial quantification and alpha diversity results were visualized using PCoAs (Principal Coordinates Analysis) generated with the R packages “ggpubr” version 0.3.0 [105] and “PMCMR” version 4.3 [106]. The beta diversity results were visualized using PCoAs with the R packages “ggplot2” version 3.3.0 [107] and “ggfortify” version 0.4.10 [108]. The correlation between ant evolutionary history and microbial composition was determined using Mantel tests using the R package phytools [109]. The contribution of each ASV to each sample at the order level (for the 16S rRNA datasets) and at the phyla level (for the 18S rRNA dataset) was determined using the “qiime taxa barplot” and “qiime taxa collapse” commands on Qiime2-2019.1 [93]. SIMPER (Similarity Percentage) analyses were performed using the PAST software version 4.02 [104] and visualized using boxplots with the R packages “ggpubr” version 0.3.0 [105] and “PMCMR” version 4.3 [106].

3. Results

3.1. 16S rRNA Assessing Sequencing Quality

A total of 49 ant samples and 44 nest samples were sequenced with four control samples, two for each sample type (Supplementary File S1). For the ant samples, a total of 1,879,666 reads were sequenced. After rarefaction at a sampling depth of 4500 reads, three samples were removed due to a low number of reads, resulting in a total of 5908 ASVs recovered from the 46 ant samples, ranging from 7548 to 80,226 reads, with a mean frequency of 40,842 reads per sample. The rarefaction curve shows that sequences from every sample reached a plateau, indicating that most of the bacterial diversity was recovered (Figure S2A). Three samples (CSM3695a, CSM3695b and PJF10) were excluded from the dataset because they did not reach the minimum sampling depth of 4500 reads. Nest samples were rarefied to 9000 reads (Figure S2B), and in total, 19,934 ASVs were obtained from 2,350,607 reads sequenced in the 44 nest samples, ranging from 9130 to 76,765 reads, with a mean frequency of 53,442 reads per sample.

3.2. 16S rRNA Alpha Diversity

First, we tested for dissimilarities in bacterial alpha diversity across ant habitat, nesting mode, diet and subfamily. There was no differences in bacterial alpha diversity between rainforest ants and city ants (Figure S3; Shannon: H = 0.017, p-value = 0.895; Pielou: H = 0.002, p-value = 0.965; Faith: H = 0.213, p-value = 0.644; ASV: H = 0.148, p-value = 0.700), However, there were differences in bacterial alpha diversity across nesting modes (Figure S4; Shannon: H = 15.563, p-value = 4.17E-04; Pielou: H = 13.742, p-value = 0.001; Faith: H = 12.159, p-value = 0.002; ASV: H = 16.350, p-value = 2.817E-04), diets (Figure S5; Shannon: H = 4.316, p-value = 0.116; Pielou: H = 6.431, p-value = 0.040; Faith: H = 0.424, p-value = 0.809; ASV: H = 0.456, p-value = 0.796) and subfamilies (Figure S6; Shannon: H = 18.096, p-value = 0.012; Pielou: H = 17.280, p-value = 0.016; Faith: H = 12.113, p-value = 0.097; ASV: H = 17.834, p-value = 0.013).
The SIMPER (Similarity Percentage) analysis was performed to determine the most abundant bacterial orders in the ant samples. The taxa bar plot of the bacterial relative abundance exhibited very diverse patterns across ant genera (Figure 1), and across the habitat, nesting mode, and diet (Supplementary File S2). The 15 most abundant bacterial orders found in the host samples were, in order, Rickettsiales, Rhizobiales, Enterobacteriales, Acetobacterales, Lactobacillales, Burkholderiales, Xanthomonadales, Erysipelotrichales, Flavobacteriales, Pseudomonadales, Corynebacteriales, Entomoplasmatales, Opitutales, Sphingomonadales, and Micrococcales (Supplementary File S3).
Rickettsiales were present (at least 10% of relative abundance) in every habitat, diet, and nesting mode tested (Supplementary File S2). Rhizobiales were also very common, being found across carnivorous and herbivorous ants (carnivorous: 21.38%; herbivorous: 23.63%) as well as in ants nesting in trees (21.36%) and in the ground (10.25%) and in rainforest ants (16.87%). Acetobacterales and Enterobacteriales were present in omnivorous ants (respectively, 13.76% and 12.71%) and ants nesting in rotten logs (respectively, 24.3% and 28.69%). Acetobacterales were also found in city ants (10.93%). Burkholderiales and Xanthomonadales were common in herbivorous ants (respectively, 11.00% and 10.98%), while Erysipelotrichales were only found in carnivorous ants (9.29%).
The bacterial relative abundance showed different patterns across ant genera but was relatively consistent within the same genus. This was especially true for Camponotus, Cephalotes, Crematogaster, Daceton, Solenopsis, and Odontomachus (Figure 1). Crematogaster and Odontomachus were found to have very conserved bacterial compositions, consisting primarily of Rickettsiales (respectively 78.58% and 72.87%) and Rhizobiales (respectively 10.85% and 11.60%). Rickettsiales was also found to be the most abundant bacterial order in Solenopsis (59.59%). Camponotus were dominated by Enterobacteriales (45.19%), but also contained Acetobacterales (18.47%) and Rickettsiales (17.60%). Daceton were dominated by Rhizobiales (72.49%) but also had Entomoplasmatales (13.20%) and Acetobacterales (11.31%). Cephalotes were associated with Xanthomonadales (24.65%), Burkholderiales (22.71%), and Rhizobiales (19.19%). In addition, some of the most abundant bacterial orders were only found in a few ant genera. Erysipelotrichales (Firmicutes) were only found in Eciton (34.47%) and Labidus (62.80%). Eciton also contained Flavobacteriales (21.37%), while Labidus also possessed Entomoplasmatales (19.24%).

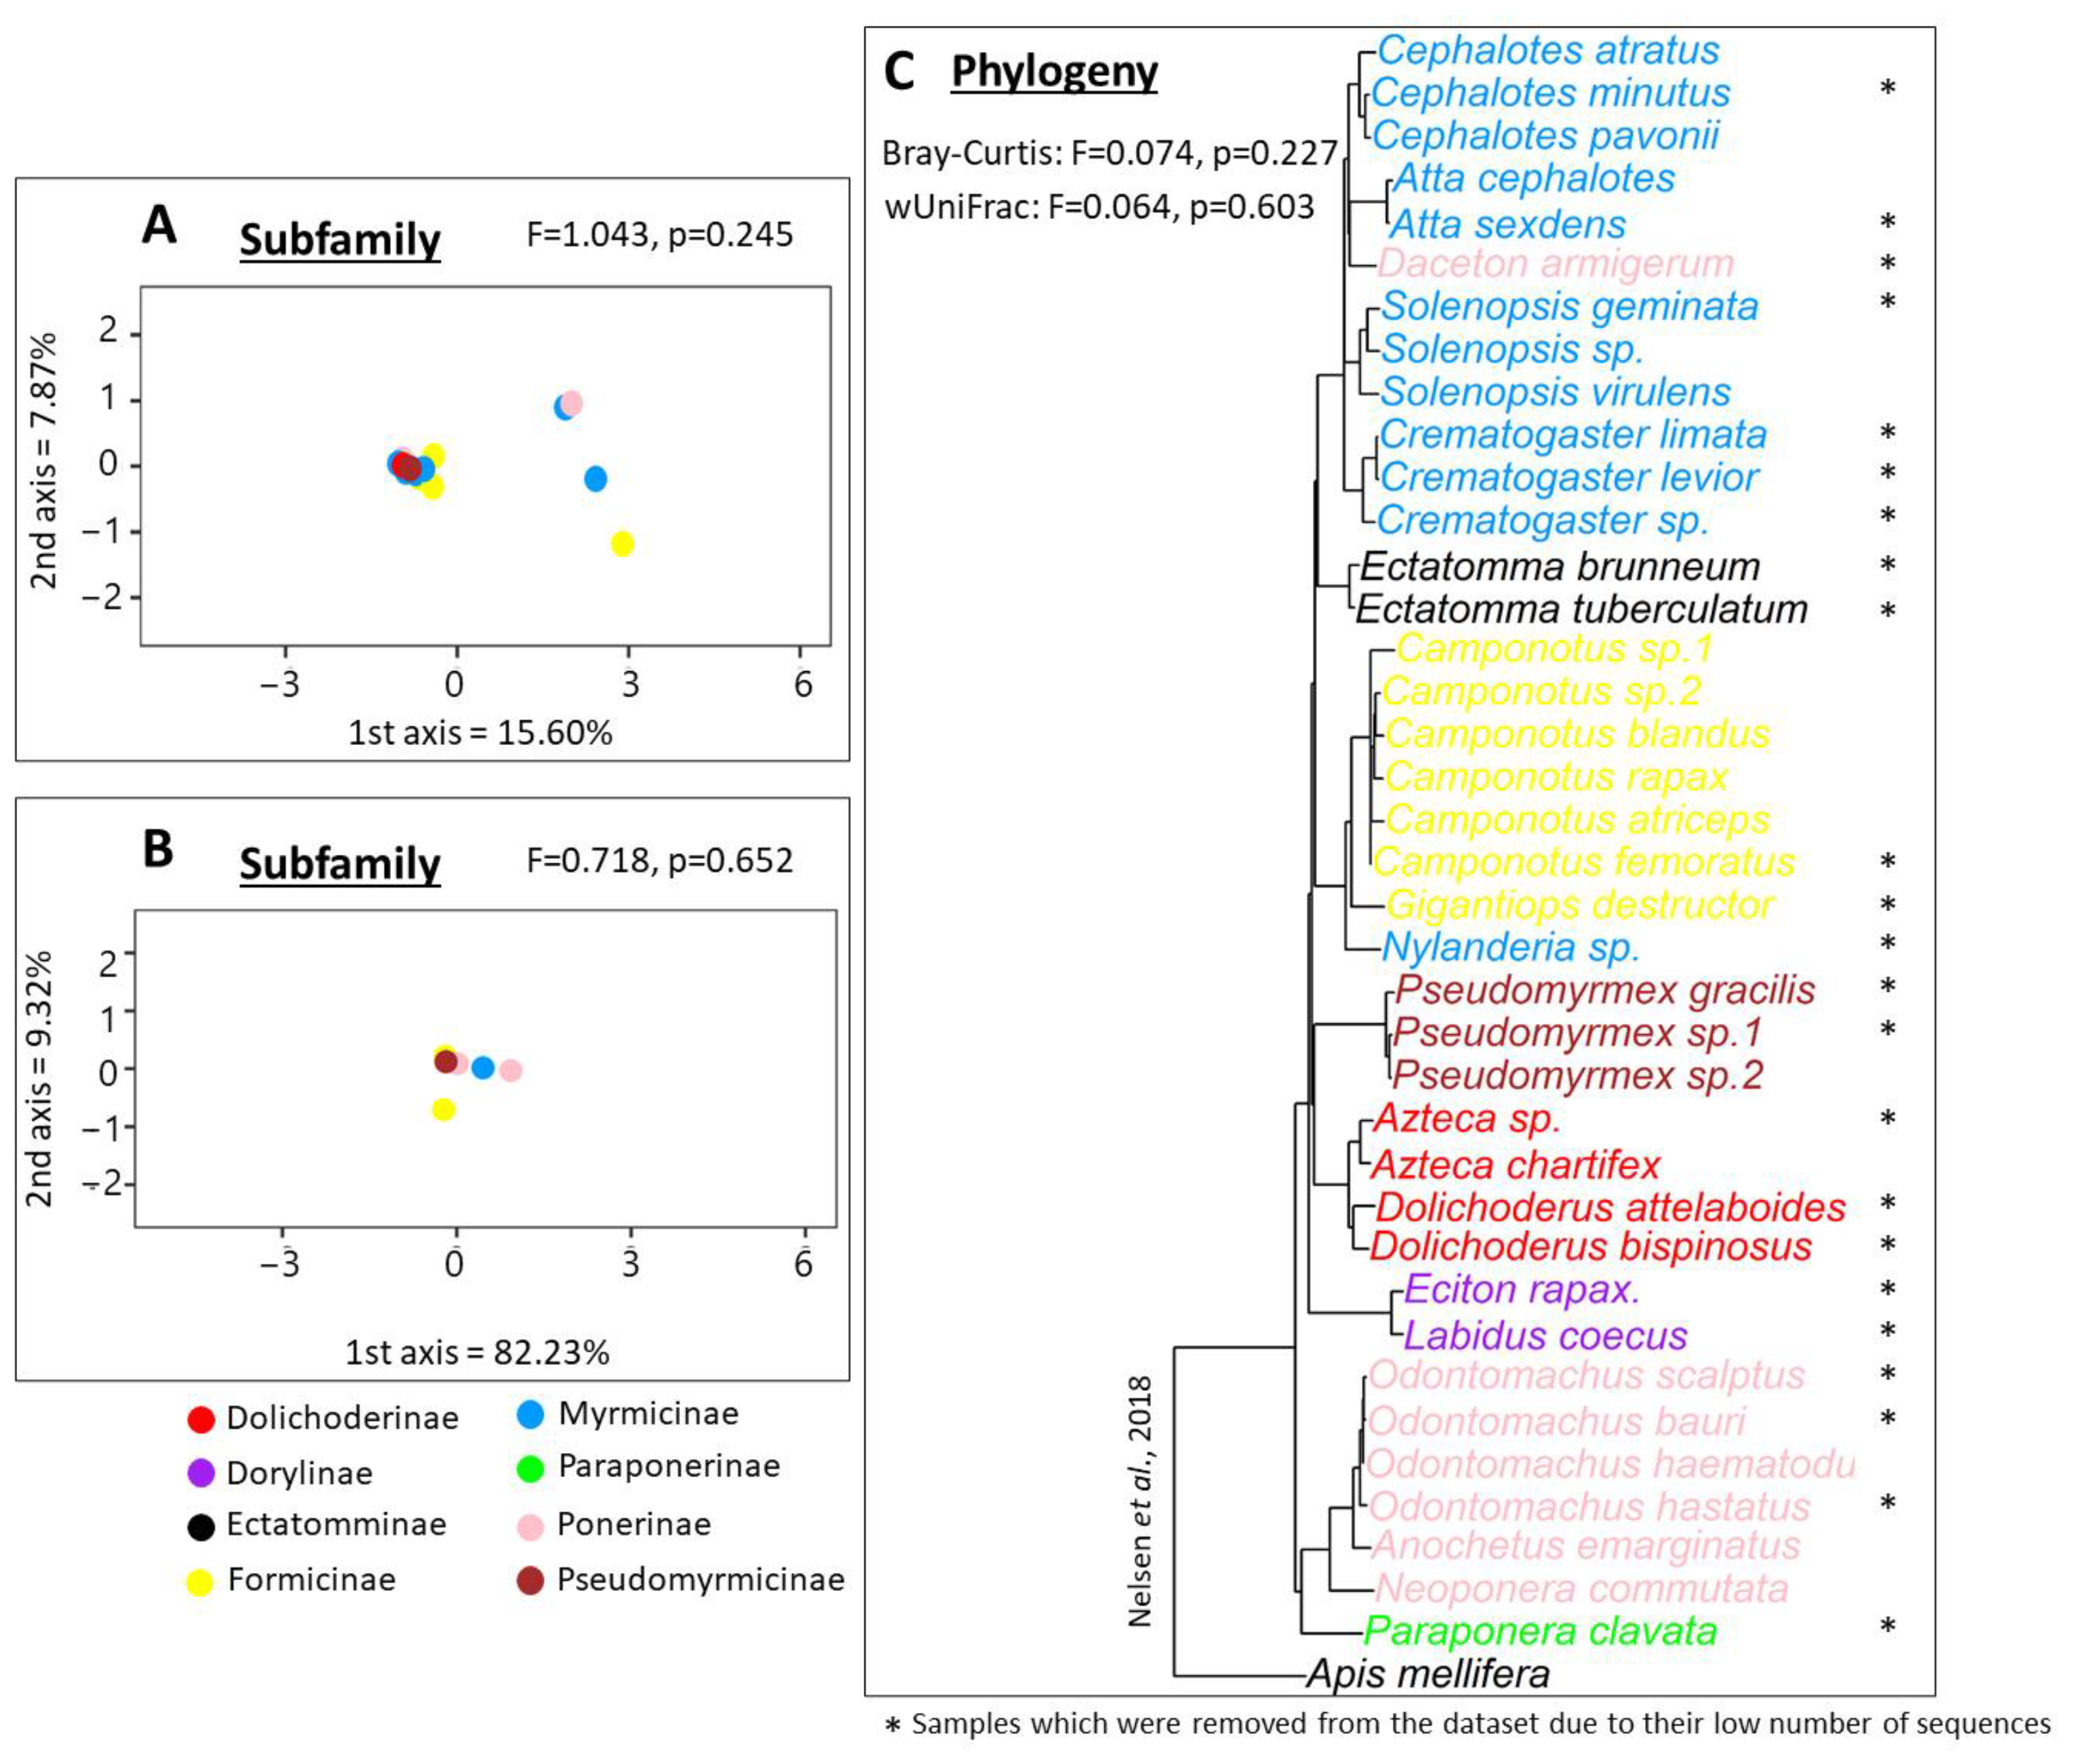
3.3. 16S rRNA Beta Diversity Analysis

The bacterial diversity of the ants was compared with the bacterial diversity of their nest samples, and both the Jaccard and unUniFrac distances showed statistical differences (Figure S7A,B; Jaccard: pseudo-F = 2.967, p-value = 0.001; unUniFrac: pseudo-F = 8.162, p-value = 0.001). The forest/city dataset showed the same statistical differences (Jaccard: pseudo-F = 1.919, p-value = 0.001; unUniFrac: pseudo-F = 3.535, p-value = 0.001). In the rest of the manuscript, we only focused on the analyses of the ant samples.
Then, we tested for dissimilarities in bacterial diversity across ant habitat, diet, nesting mode, and taxonomy. All statistics for each beta diversity metric are reported in Supplementary File S4. The bacterial qPCR quantification analysis revealed no statistical differences in bacterial quantification associated with ants across ant taxonomy, diet, nesting mode, and habitat (Figure S8; df = 46; Habitat: t-test, t = 1.438, p-value = 0.157; Diet: ANOVA, F = 0.193, p-value = 0.956; Nesting mode: ANOVA, F = 0.128, p-value = 0.957; Subfamily: ANOVA, F = 0.400, p-value = 0.813). There were no statistical differences either in the forest/city dataset across ant habitat, diet, nesting mode, or taxonomy (df = 20; Habitat: t-test, t = 1.345, p-value = 0.194; Diet: ANOVA, F = 1.761, p-value = 0.106; Nesting mode: ANOVA, F = 1.823, p-value = 0.141; Subfamily: ANOVA, F = 0.331, p-value = 0.941).
The bacterial beta diversity did not differ between rainforest ants and city ants (Figure 2A,B, Supplementary File S4; Bray-Curtis: pseudo-F = 0.920, p-value = 0.619; wUniFrac: pseudo-F = 0.945, p-value = 0.502); however, the nesting modes ground nesting, rotten log, and tree nesting all showed statistically different bacterial diversity results (Figure 2C,D, Supplementary File S4; Bray-Curtis: pseudo-F = 1.473, p-value = 0.005; wUniFrac: pseudo-F = 2.217, p-value = 0.002). Overall, the diet was a strong factor in differential bacterial diversity (Figure 2E,F; Bray-Curtis: pseudo-F = 1.361, p-value = 0.018; wUniFrac: pseudo-F = 1.675, p-value = 0.029). Carnivorous ants were shown to have different bacterial communities than herbivorous ants, which had different bacterial communities to omnivorous ants, but no difference was found between carnivorous and omnivorous ants (Supplementary File S4). Concerning ant taxonomy, the results were statistically different across subfamilies (Figure 3A,B; Bray-Curtis: pseudo-F = 1.368, p-value = 0.018; wUniFrac: pseudo-F = 1.715, p-value = 0.025). More specifically Dorylinae, Formicinae, Myrmicinae, and Ponerinae had different bacterial compositions to other subfamilies (Supplementary File S4). To test whether these dissimilarities are due to the ants’ evolutionary histories, we performed Mantel tests comparing the bacterial diversity with the host phylogeny [110]. However, the Mantel tests showed no correlation between bacterial diversity and ant phylogeny for both the Bray–Curtis and wUniFrac distances (Figure 3C; Bray–Curtis: F = 1.473, p-value = 0.516; wUniFrac: F = 2.217, p-value = 0.498). The forest and city datasets gave the same statistical results for every factor tested (Supplementary File S4).

3.4. 16S rRNA ASV Similarity Percentage Analysis

Next, we used a SIMPER analysis to identify the most abundant bacterial orders responsible for the dissimilarities observed previously. This analysis identified 15 bacterial orders responsible for the differences. All statistics for the SIMPER analyses are presented in Supplementary File S5. Erysipelotrichales were more abundant in carnivorous ants (Figure S9A), while Rhizobiales were more abundant in herbivorous ants (Figure S9C). However, both were also more abundant in ground nesting ants than in rotten log nesting ants (Figure S9B,D). Lactobacillales were more abundant in ground nesting ants compared to ants nesting in rotten logs, while Rickettsiales had a higher abundance in rotten log nesting ants than in tree nesting ants (Figure S9F,H). Entomoplasmatales were more abundant in carnivorous ants than in herbivorous ants (Figure S9E). Finally, Acetobacterales had a greater abundance in city ants than in rainforest ants (Figure S9G). However, there was no statistical difference in any bacterial order between ant subfamilies. Pairwise Kruskal–Wallis comparisons for all the discussed bacterial orders are presented in Supplementary File S6.

3.5. 18S rRNA Assessing Sequencing Quality

We assessed the eukaryote diversity associated with the same 49 Amazonian ants used for the bacterial diversity analysis (Supplementary File S1). In the raw dataset, there was a total of 21,719 reads. After rarefaction of the samples to 199 reads, 33 samples were excluded from the dataset because they did not reach the minimum sampling depth (Figure S10). In total, from the 16 remaining samples, we obtained 118 ASVs from 20,185 reads ranging from 199 to 7815 reads with a mean frequency of 1261 reads per sample.

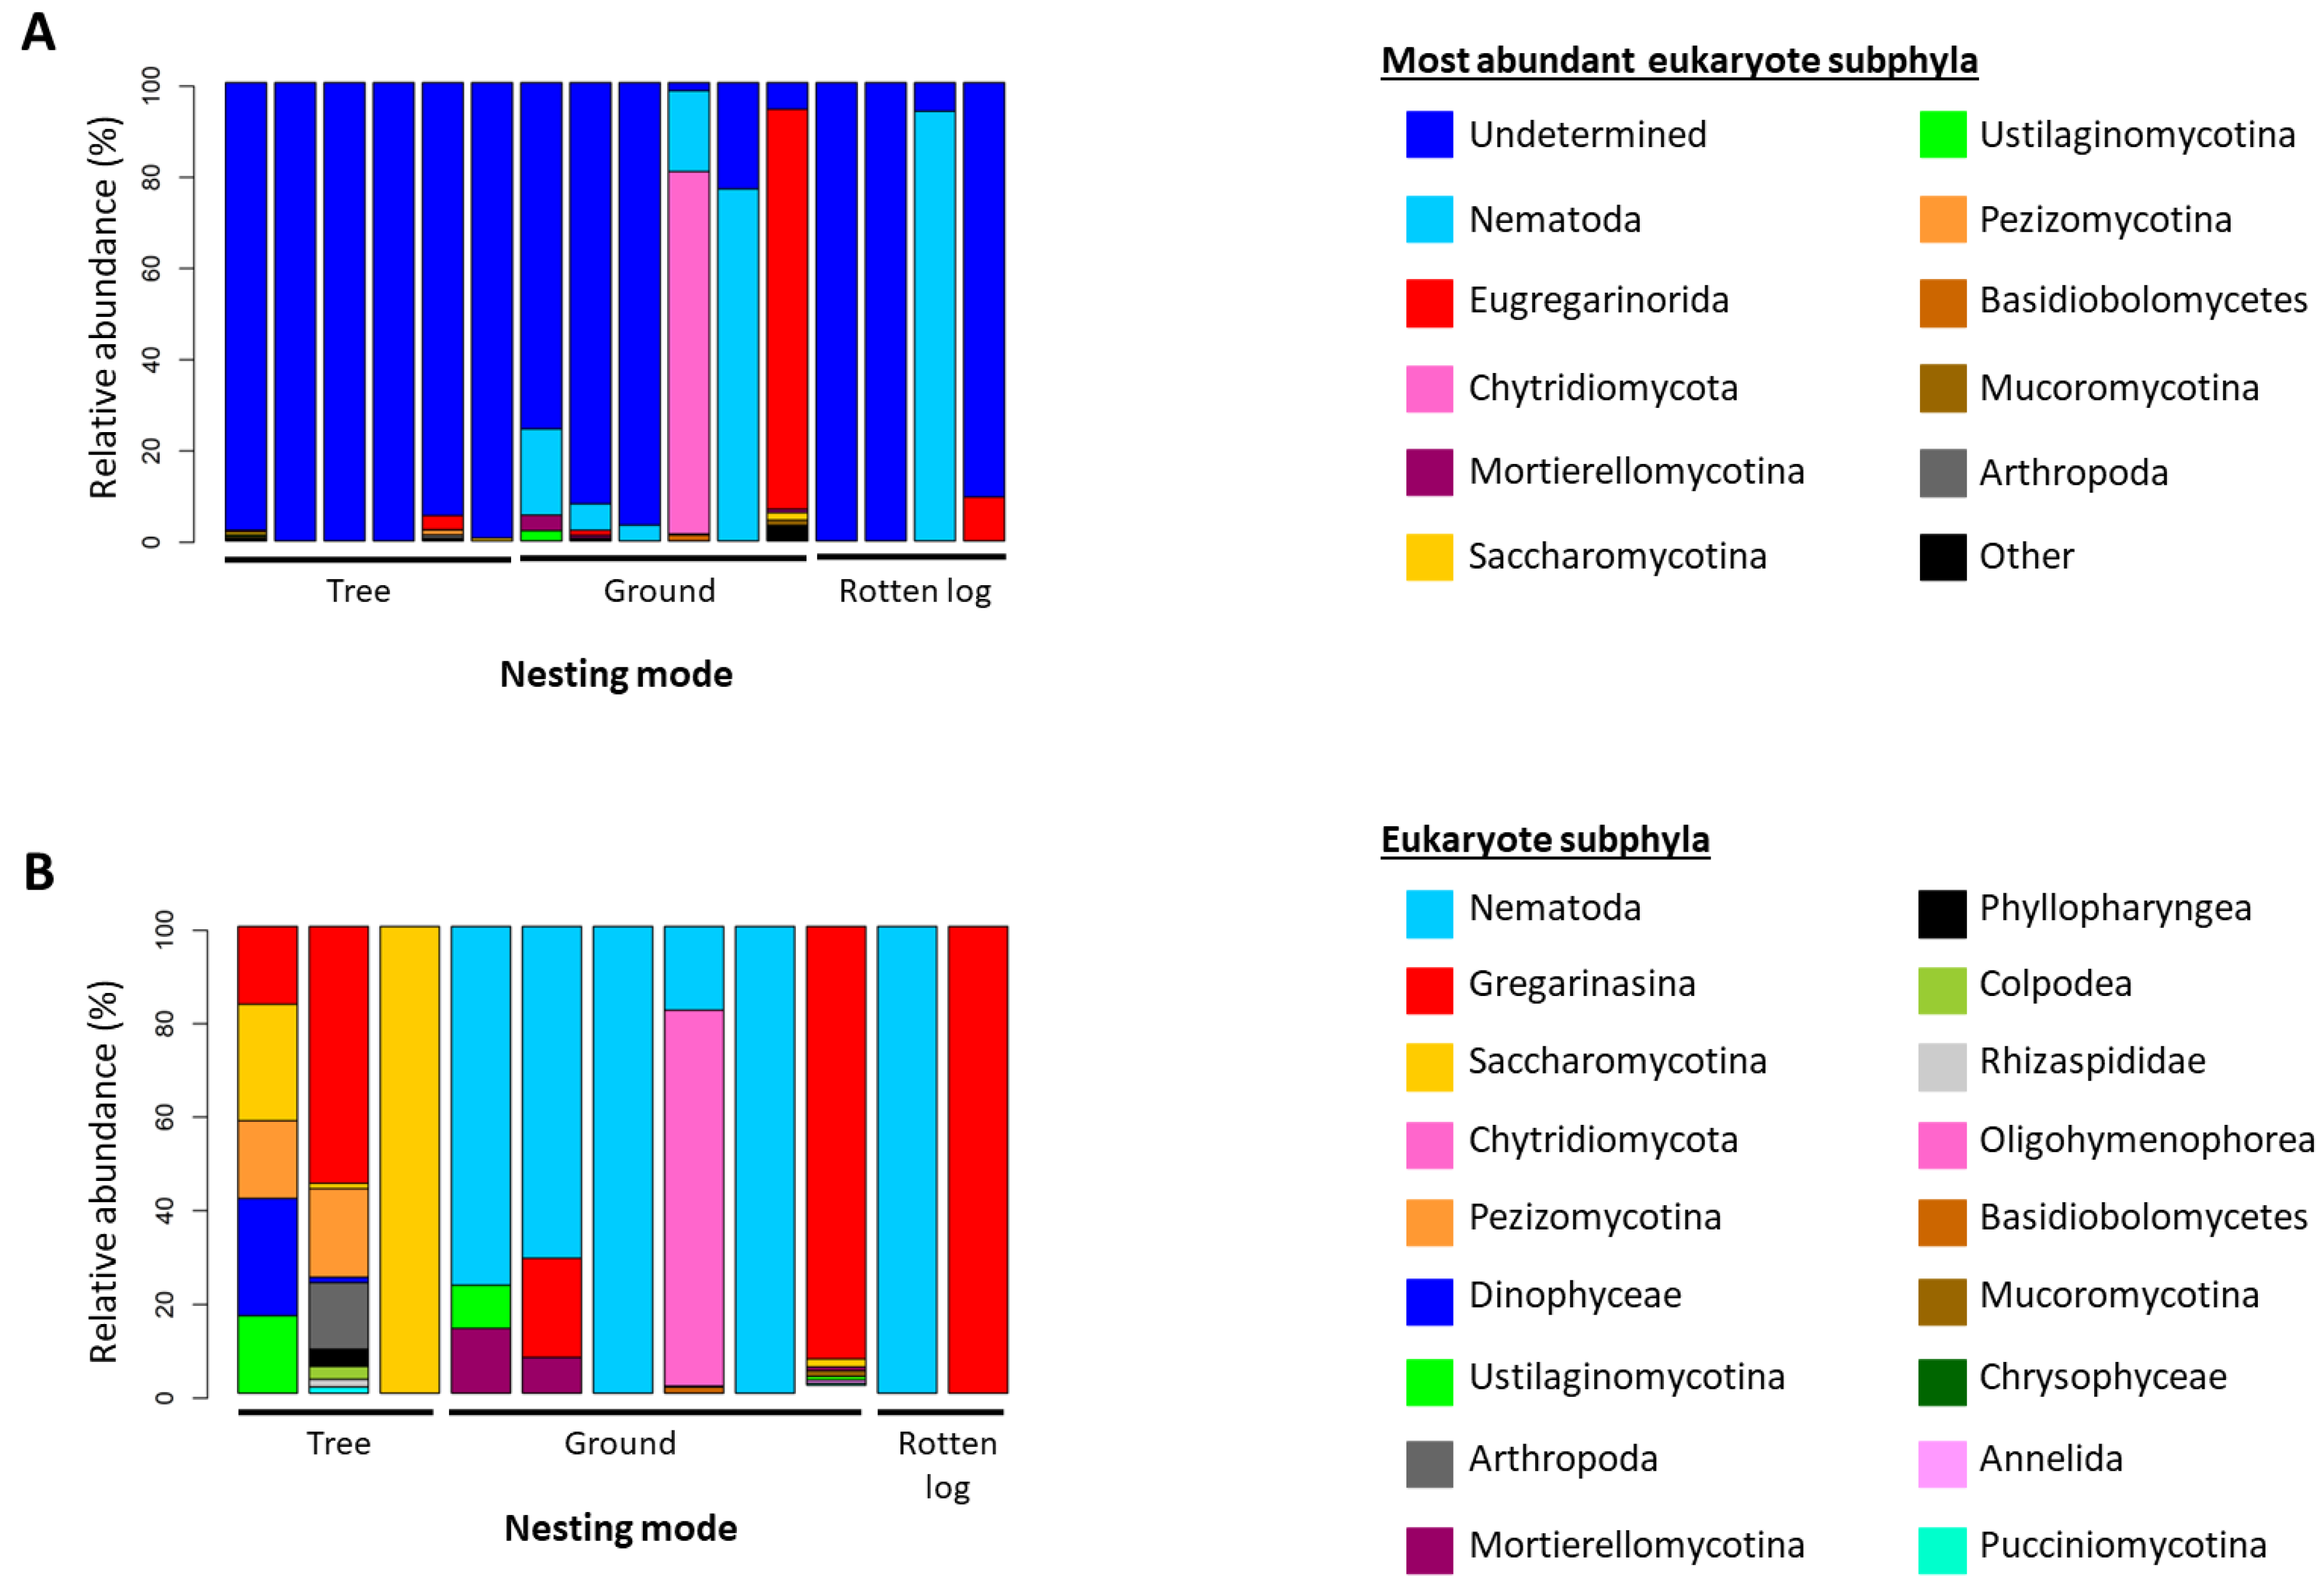
3.6. 18S rRNA Alpha and Beta Diversity Analysis

Alpha diversity analyses were performed using Qiime2 software to test for dissimilarities in eukaryote diversity in our dataset. There was no differences in microbial eukaryote alpha diversity between rainforest ants and city ants (Figure S11; Shannon: H = 0.540, p-value = 0.462; Pielou: H = 0.011, p-value = 0.916; Faith: H = 1.103, p-value = 0.294; ASV: H = 1.773, p-value = 0.183), nesting mode (Figure S12; Shannon: H = 4.352, p-value = 0.360; Pielou: H = 5.593, p-value = 0.200; Faith: H = 3.643, p-value = 0.456; ASV: H = 2.581, p-value = 0.630), diet (Figure S13; Shannon: H = 3.824, p-value = 0.148; Pielou: H = 1.283, p-value = 0.526; Faith: H = 3.107, p-value = 0.212; ASV: H = 4.634, p-value = 0.099) or subfamily (Figure S14; Shannon: H = 8.184, p-value = 0.017; Pielou: H = 4.634, p-value = 0.099; Faith: H = 3.107, p-value = 0.212; ASV: H = 1.283, p-value = 0.526).
Beta diversity analyses were performed using Qiime2 software to test for dissimilarities in eukaryote diversity in our dataset. Statistics for the two beta diversity metrics tested (Bray–Curtis distance and wUnifrac distance) are presented in Supplementary File S8.
For the two metrics tested, there were no differences between ant habitats (Figure 4A,B; Bray–Curtis: pseudo-F = 1.042, p-value = 0.320; wUnifrac: pseudo-F = 1.295, p-value = 0.199), diets (Figure 4E,F; Bray–Curtis: pseudo-F = 1.041, p-value = 0.281; wUnifrac: pseudo-F = 1.113, p-value = 0.313), or subfamilies (Figure 5A,B; Bray–Curtis: pseudo-F = 1.043, p-value = 0.245; wUnifrac: pseudo-F = 0.718, p-value = 0.652). There was also no correlation between the eukaryote diversity and ant evolutionary history, as shown by the Mantel test (Figure 5C; Bray–Curtis: F = 0.074, p-value = 0.227; wUnifrac: F = 0.064, p-value = 0.603). Ground nesting ants showed statistically different results to tree nesting ants (Figure 4C,D; Bray–Curtis: pseudo-F = 1.121, p-value = 0.048; wUnifrac: pseudo-F = 3.143, p-value = 0.029). Omnivorous ants also showed statistically different results to carnivorous and herbivorous ants for the Bray–Curtis distance (Figure 4E; F = 1.041, p-value = 0.033); however, these differences did not appear for the wUnifrac distance (Figure 4F; F = 1.113, p-value = 0.313).

3.7. 18S rRNA ASV Similarity Percentage Analysis

To investigate which eukaryote subphyla are the most commonly associated with Amazonian ants, we used SIMPER analyses. The taxa bar plot of the total eukaryote relative abundance was largely dominated by undetermined eukaryotes for every factor tested (Figure 6A). Overall, besides the undetermined eukaryotes, the 10 most abundant eukaryote subphyla were Nematoda, Eugregarinorida, Chytridiomycota, Mortierellomycotina, Saccharomycotina, Ustilaginomycotina, Pezizimycotina, Basidiobolomycetes, Mucoromycotina, and Arthropoda. All statistics for the SIMPER analyses are presented in Supplementary File S7.
By focusing on the different ant habitats and nesting modes, undetermined eukaryotes were found to represent half of the total eukaryote relative abundance in city ants and ground nesting ants (49.10% and 61.90% respectively), while they represent almost 75% of the relative abundance in ants nesting in rotten logs and more than 98% in rainforest ants and ants nesting in trees. Nematoda are also very common in city ants and ground nesting or rotten log nesting ants (23.70%, 20.40%, and 23.40%, respectively). Eugragarinorida were present in city ants and in ground nesting ants (14.70% and 12.50%, respectively), while Chytridiomycota were only present in ground nesting ants.
The ant subfamilies Dolichoderinae and Pseudomyrmicinae were entirely associated with undetermined eukaryotes. Formicinae and Myrmicinae also contained mainly undetermined eukaryotes (72.70% and 73.90% respectively), but Formicinae also contained Eugragarinorida (19.60%), while Myrmicinae contained Nematoda and Chytridiomycota (13.50% and 11.30%, respectively). Ponerinae were composed of undetermined eukaryotes and Nematoda (51.40% and 48.60%, respectively).
We used a SIMPER analysis to determine the contributions of the 11 most abundant eukaryote subphyla to the dissimilarities observed previously. All statistics obtained from the SIMPER analyses are presented in Supplementary File S9. There were no statistical differences in any eukaryote subphyla between ant habitats, diets, or subfamilies. However, there were statistical differences in some eukaryote subphyla between nesting modes. Indeed, undetermined eukaryotes had increased relative abundances in tree nesting ants compared with in ground nesting ants. In contrast, Nematoda had an increased relative abundance in ground nesting ants compared with in tree nesting ants (Figure S15). Pairwise Kruskal–Wallis comparisons for these two eukaryote subphyla are presented in Supplementary File S10.
Due to the high number of undetermined ASVs in our samples, we decided to remove these sequences to obtain a better representation of the identified eukaryote subphyla results (Figure 6B). The most abundant eukaryote subphyla were Nematoda and Gregarinasina. As shown before, Nematoda are more abundant in ground nesting ants than in tree nesting ants (Figure 6B). Most genera are associated with only a few different eukaryote subphyla, with one subphylum being predominant in the sample and the other subphyla having a low abundance. However, Cephalotes is the only genus in which the samples were associated with at least five different eukaryote subphyla with no subphylum being dominant, but instead, the different eukaryote subphyla were present with similar relative abundances. A description of each eukaryote subphylum and examples of genera associated with each subphylum can be found in Supplementary File S11.

4. Discussion

4.1. Dietary Niche Structures Bacterial Communities but Not Microbial Eukaryote Communities Associated with Amazonian Ants

Our results show differences in bacterial diversity but not in bacterial relative abundance between carnivorous and herbivorous ants for both the Bray–Curtis and wUniFrac distances. Furthermore, our analyses highlight the finding that some bacterial orders are specific to ants with different diets. Indeed, Erysipelotrichales and Entomoplasmatales are more abundant in carnivorous ants, while Rhizobiales are more abundant in herbivorous ants. These results are in accordance with several previous studies that also highlighted the roles of these bacterial orders in complementing the host diet in ants [19,66,70] as well as in mammals [111]. Additionally, symbiotic bacteria have been shown to drive host evolution [68,112]. One of the possible explanations for this correlation between gut bacteria and the host diet could be the nutrient niche theory.
The structure of the gut bacterial community is hypothesized to be determined by the abundance and diversity of nutrients extracted from the host diet during digestion. The nutrient niche theory posits that gut ecological niches are determined by available nutrients in the gut [113,114,115]. This means that a specific bacteria species can only assert itself in the host gut if it is able to use a limiting nutrient. The nutrient niche theory has been supported by numerous diet supplementation studies, which have shown that the presence and abundance of specific bacterial species can be altered by experimentally modifying the types and abundance of nutrients present in the gut [116,117,118,119,120].

4.2. Microbial Community Structure Associated with Amazonian Ants Is Influenced by Abiotic Factors and Nesting Modes

Microbial community structure can be influenced by multiple abiotic factors, resulting in different habitat niches. Studies of abiotic factors in rainforests have shown that environmental parameters, like luminosity, humidity, and temperature, vary between the canopy and the forest floor [121,122]. Arthropods and free-living bacteria vertically structure their communities according to their different tolerance levels to these abiotic factors [123]. Some symbiotic bacteria can also confer to their host improved tolerance to these environmental perturbations, and this has previously been shown in several insects [124,125,126,127,128].
Our results indicated differences in microbial alpha and beta diversity, but not in bacterial abundance, between ground nesting ants and rotten log or tree nesting ants. Furthermore, as shown in our diet analysis, some bacterial orders are specific to a particular ant nesting mode. Indeed, Erysipelotrichales, Lactobacillales, and Rhizobiales are more abundant in ground nesting than in rotten log nesting ants, while Rickettsiales showed a higher abundance in rotten log nesting ants than in tree nesting ants. These bacteria could help their hosts to withstand specific environmental conditions, and future experimental work could demonstrate the roles of these bacteria.
The low numbers of currently available 18S rRNA sequences in public databases limit the study of microbial eukaryotes. In our study, the majority of the retrieved 18S rRNA sequences, after excluding any sequence identified as “Hymenoptera”, could not be identified further than as being eukaryotes. Among the determined microbial eukaryote ASVs, the identification accuracy was variable with only a few ASVs assigned at the species level, while other AVSs could only be identified at the order or kingdom levels. This major issue has been discussed in previous work [129]. The fact that more undetermined microbial eukaryotes were found in tree nesting ants could come from the fact that, to date, there has been a greater number of studies on eukaryote diversity from soils [129,130,131,132], which could cause a lack of sequences from eukaryotes found primarily in the canopy. If this is the case, more studies on global eukaryote diversity from trees and arboreal species would be necessary to increase the eukaryote databases.

4.3. Bacterial Communities in Long-Term Association with Specific Ant Hosts Are Conserved

Several ant genera have well-established long-term relationships with specific bacterial communities. These bacterial communities are usually conserved within the different species of their host genus and often provide benefits to the host, as previously reported for Camponotus [19] and Cephalotes [70].
By focusing on the differences in bacterial beta diversity, we noticed that, overall, three genera were different from the other ant genera: Camponotus (subfamily: Formicinae), Cephalotes (subfamily: Myrmicinae), and Odontomachus (subfamily: Ponerinae). Looking deeper, we found that Camponotus are mainly composed of three bacterial orders: Enterobacterales (especially the bacterial genus Blochmannia), Acetobacterales, and Rickettsiales (especially the bacterial genus Wolbachia). Blochmannia are known to be the main symbiont of Camponotus, providing it with nutritional supplementation [133,134]. Some Camponotus species have also been shown to be strongly associated with Acetobacterales [135]. Wolbachia is a common insect symbiont and can have beneficial effects, like vitamin B supplementation in bedbugs [84,136], as well as negative effects when manipulating host reproduction [137]. Concerning the Cephalotes samples, we determined that they were mainly composed of four bacterial orders: Xanthomonadales, Burkholderiales, Rhizobiales, and Opitutales. Our results are in accordance with previous studies on Cephalotes, which highlighted that they possess a very stable core microbiome composed of five bacterial orders: Burkholderiales, Opitutales, Pseudomonadales, Rhizobiales and Xanthomonadales [66,69,112,138]. Together these symbionts synthesize amino acids via nitrogen recycling for their host [70]. Finally, focusing on the Odontomachus samples, our results show that they are mainly composed of Rickettsiales (especially the bacterial genus Wolbachia), Rhizobiales, and Erysipelotrichales. Few studies have focused on the bacterial diversity associated with Odontomachus, but a couple of studies have also shown strong associations of Wolbachia and Rhizobiales with Odontomachus ants [74,139]. To the best of our knowledge, the presence of Erysipelotrichales bacteria has not been previously studied in Odontomachus ants, but as it is a common symbiont of carnivorous species [140,141,142], its presence in predatory Odontomachus samples is not surprising.
In contrast to these very conserved microbiomes, we also identified two ant genera which displayed very high levels of species richness: Ectatomma and Paraponera. These two ant genera are characterized by not being associated with a core microbiome, but instead, have transient bacterial communities. Two studies have reported the bacterial communities associated with Paraponera clavata [73,143], but no clear identification of a core microbiome has been revealed, thus suggesting that the bacterial communities found are very variable and originate from the broad diets and habitats of these omnivorous ants.

4.4. Habitat Does Not Participate in Structuring Microbial Communities Associated with Amazonian Ants

As we have shown previously, microbial communities associated with ants are structured by host diet and nesting mode. Yet, these ecological factors may vary in different habitats. For example, ants may need to adapt their feeding habits, as different prey or plants may live in contrasting habitats. This is known as environmental filtering, a process in which the environment selects for and against certain species. Omnivorous ants or ants whose diet does not rely on a specific species could adapt faster and more easily to the resources they find in a new environment. Urbanization, in particular, is known to be associated with a variety of effects on arthropods, like pollution, habitat fragmentation, and a decrease in species richness [144,145]. Environment filtering has also been shown to affect microbial communities present in different habitats [146,147].
We did not find any correlations between the microbial communities from these ants in these contrasting habitats in term of diversity or abundance. Our results corroborate previous work investigating the differences in the microbial diversity of insects collected from different habitats that did not find any differences in the bacterial diversity between insects collected from urban environments and insects collected from rural environments [148,149]. We did find a statistical difference in the abundance of one bacterial order (Acetobacterales) between rainforest ants and city ants. However, this result represents an exception in our study, which suggests that environmental filtering does not affect the structure of ant microbial communities.

5. Conclusions

Our results show that microbial communities associated with Amazonian ants are structured by different factors. The bacterial communities associated with Amazonian ants are structured by the ant diet, nesting mode, and taxonomy, while the microbial eukaryote communities associated with Amazonian ants are only structured by the ant nesting mode. The ant habitat and evolutionary history were not shown to have any impact on structuring their associated microbial communities. Despite the large number of undetermined sequences of microbial eukaryotes, future work focusing on the co-occurrence between bacterial communities and microbial eukaryote communities could reveal microbe–microbe interaction dynamics inside the insect host. To the best of our knowledge, this is one of the first studies to focus on the microbial communities associated with a wide range of Neotropical ants. As such, future work on this topic would be useful to confirm our findings. In particular, since only one nest per species was collected in this study, research focusing on the microbiome of ants from several nests of the same species might increase the robustness of our findings.

Supplementary Materials

The following are available online at https://www.mdpi.com/article/10.3390/d15020126/s1, Figure S1: Sampling map; Figure S2: 16S rRNA rarefaction curves; Figure S3: 16S rRNA alpha diversity for ant habitat; Figure S4: 16S rRNA alpha diversity for ant nesting mode; Figure S5: 16S rRNA alpha diversity for ant diet; Figure S6: 16S rRNA alpha diversity for ant subfamily; Figure S7: 16S rRNA qPCR; Figure S8: 16S rRNA beta diversity for ants and nests; Figure S9: 16S rRNA SIMPER analysis; Figure S10: 18S rRNA rarefaction curves; Figure S11: 18S rRNA alpha diversity for ant habitat; Figure S12: 18S rRNA alpha diversity for ant subfamily; Figure S13: 18S rRNA alpha diversity for ant nesting mode; Figure S14: 18S rRNA alpha diversity for ant diet; Figure S15: 18S rRNA SIMPER analysis; Supplementary File S1: All samples; Supplementary File S2: 16S rRNA alpha diversity metrics; Supplementary File S3: Bacterial relative abundance; Supplementary File S4: 16S rRNA beta diversity metrics; Supplementary File S5: 16S rRNA SIMPER statistics; Supplementary File S6: 16S rRNA SIMPER pairwise comparisons; Supplementary File S7: 18S rRNA alpha diversity metrics; Supplementary File S8: 18S rRNA beta diversity metrics; Supplementary File S9: 18S rRNA SIMPER statistics; Supplementary File S10: 18S rRNA SIMPER pairwise comparisons; Supplementary File S11: Eukaryote phyla.

Author Contributions

Conceptualization, A.C., C.S.M. and C.D.; methodology, A.C., C.S.M. and C.D.; software, A.C.; formal analysis, A.C.; writing—original draft preparation, A.C.; writing—review and editing, A.C., C.S.M. and C.D.; funding acquisition, A.C., C.S.M. and C.D. All authors have read and agreed to the published version of the manuscript.

Funding

This research was funded by “Investissement d’Avenir”, grant managed by Agence Nationale de la Recherche, CEBA, ref. ANR-10-LABX-25-01 to C.D., and the National Science Foundation, NSF DEB 1900357 to C.S.M. We are grateful to the University of French Guiana for A.C.’s Ph.D. fellowship and traveling grants.

Informed Consent Statement

Not applicable.

Data Availability Statement

All raw sequence data are publicly available NCBI SRA accession number PRJNA743571, and BioSample SAMN20055534 and SAMN20055535 respectively for the 16S rRNA and the 18S rRNA raw sequences.

Acknowledgments

The authors are grateful to Axel Touchard and Peter Flynn for their help with the collection and taxonomic identification of the ant samples. The authors are grateful to the Argonne National Laboratory (Lemont, IL, USA) for the 16S rRNA and 18S rRNA amplification and sequencing. The authors are thankful to the Cornell Institute of Biotechnology and the Cornell Information Technology support for their help in the setting up of the software used in this study. The authors are also thankful to Manuela Ramalho for all her assistance with statistical analysis.

Conflicts of Interest

The authors declare no conflict of interest and the funders had no role in the design of the study, in the collection, analyses, or interpretation of data, in the writing of the manuscript, or in the decision to publish the results.

References

  1. Hoffmeister, T.S.; Vet, L.E.M.; Biere, A.; Holsinger, K.; Filser, J. Ecological and Evolutionary Consequences of Biological Invasion and Habitat Fragmentation. Ecosystems 2005, 8, 657–667. [Google Scholar] [CrossRef]
  2. Ricklefs, R.E. Community Diversity: Relative Roles of Local and Regional Processes. Science 1987, 235, 167–171. [Google Scholar] [CrossRef] [PubMed]
  3. Maire, V.; Gross, N.; Börger, L.; Proulx, R.; Wirth, C.; Pontes, L.d.S.; Soussana, J.F.; Louault, F. Habitat Filtering and Niche Differentiation Jointly Explain Species Relative Abundance within Grassland Communities along Fertility and Disturbance Gradients. New Phytol. 2012, 196, 497–509. [Google Scholar] [CrossRef] [PubMed]
  4. Arthur, W. The Niche in Competition and Evolution; Wiley-Blackwell: New York, NY, USA, 1987. [Google Scholar]
  5. Hickman, J.C. Energy Allocation and Niche Differentiation in Four Co-Existing Annual Species of Polygonum in Western North America. J. Ecol. 1977, 65, 317–326. [Google Scholar] [CrossRef]
  6. Konopka, A. What Is Microbial Community Ecology. ISME J. 2009, 3, 1223–1230. [Google Scholar] [CrossRef] [Green Version]
  7. Allison, S.D.; Martiny, J.B.H. Resistance, Resilience, and Redundancy in Microbial Communities. Proc. Natl. Acad. Sci. USA 2008, 105, 11512–11519. [Google Scholar] [CrossRef] [Green Version]
  8. Hollister, E.B.; Engledow, A.S.; Hammett, A.J.M.; Provin, T.L.; Wilkinson, H.H.; Gentry, T.J. Shifts in Microbial Community Structure along an Ecological Gradient of Hypersaline Soils and Sediments. ISME J. 2010, 4, 829–838. [Google Scholar] [CrossRef] [PubMed] [Green Version]
  9. Sunagawa, S.; Coelho, L.P.; Chaffron, S.; Kultima, J.R.; Labadie, K.; Salazar, G.; Djahanschiri, B.; Zeller, G.; Mende, D.R.; Alberti, A.; et al. Structure and Function of the Global Ocean Microbiome. Science 2015, 348, 1261359. [Google Scholar] [CrossRef] [Green Version]
  10. Stres, B.; Danevčič, T.; Pal, L.; Fuka, M.M.; Resman, L.; Leskovec, S.; Hacin, J.; Stopar, D.; Mahne, I.; Mandic-Mulec, I. Influence of Temperature and Soil Water Content on Bacterial, Archaeal and Denitrifying Microbial Communities in Drained Fen Grassland Soil Microcosms. FEMS Microbiol. Ecol. 2008, 66, 110–122. [Google Scholar] [CrossRef] [Green Version]
  11. Nicol, G.W.; Leininger, S.; Schleper, C.; Prosser, J.I. The Influence of Soil PH on the Diversity, Abundance and Transcriptional Activity of Ammonia Oxidizing Archaea and Bacteria. Environ. Microbiol. 2008, 10, 2966–2978. [Google Scholar] [CrossRef]
  12. Kuffner, M.; Hai, B.; Rattei, T.; Melodelima, C.; Schloter, M.; Zechmeister-Boltenstern, S.; Jandl, R.; Schindlbacher, A.; Sessitsch, A. Effects of Season and Experimental Warming on the Bacterial Community in a Temperate Mountain Forest Soil Assessed by 16S RRNA Gene Pyrosequencing. FEMS Microbiol. Ecol. 2012, 82, 551–562. [Google Scholar] [CrossRef] [PubMed]
  13. Shen, C.; Xiong, J.; Zhang, H.; Feng, Y.; Lin, X.; Li, X.; Liang, W.; Chu, H. Soil PH Drives the Spatial Distribution of Bacterial Communities along Elevation on Changbai Mountain. Soil Biol. Biochem. 2013, 57, 204–211. [Google Scholar] [CrossRef]
  14. Hosokawa, T.; Kikuchi, Y.; Nikoh, N.; Shimada, M.; Fukatsu, T. Strict Host-Symbiont Cospeciation and Reductive Genome Evolution in Insect Gut Bacteria. PLoS Biol. 2006, 4, 1841–1851. [Google Scholar] [CrossRef]
  15. Jiggins, F.M.; Hurst, G.D.D. Rapid Insect Evolution by Symbiont Transfer. Science 2011, 332, 185–186. [Google Scholar] [CrossRef] [PubMed] [Green Version]
  16. Warnecke, F.; Luginbühl, P.; Ivanova, N.; Ghassemian, M.; Richardson, T.H.; Stege, J.T.; Cayouette, M.; McHardy, A.C.; Djordjevic, G.; Aboushadi, N.; et al. Metagenomic and Functional Analysis of Hindgut Microbiota of a Wood-Feeding Higher Termite. Nature 2007, 450, 560–565. [Google Scholar] [CrossRef] [Green Version]
  17. Duron, O.; Morel, O.; Noël, V.; Buysse, M.; Binetruy, F.; Lancelot, R.; Loire, E.; Ménard, C.; Bouchez, O.; Vavre, F.; et al. Tick-Bacteria Mutualism Depends on B Vitamin Synthesis Pathways. Curr. Biol. 2018, 28, 1896–1902. [Google Scholar] [CrossRef] [PubMed] [Green Version]
  18. Akman Gündüz, E.; Douglas, A.E. Symbiotic Bacteria Enable Insect to Use a Nutritionally Inadequate Diet. Proc. R. Soc. B Biol. Sci. 2012, 276, 987–991. [Google Scholar] [CrossRef] [Green Version]
  19. Feldhaar, H.; Straka, J.; Krischke, M.; Berthold, K.; Stoll, S.; Mueller, M.J.; Gross, R. Nutritional Upgrading for Omnivorous Carpenter Ants by the Endosymbiont Blochmannia. BMC Biol. 2007, 5, 48. [Google Scholar] [CrossRef] [Green Version]
  20. Douglas, A.E. Review Lessons from Studying Insect Symbioses. CHOM 2011, 10, 359–367. [Google Scholar] [CrossRef] [Green Version]
  21. Raymann, K.; Moran, N.A. The Role of the Gut Microbiome in Health and Disease of Adult Honey Bee Workers. Curr. Opin. Insect Sci. 2018, 26, 97–104. [Google Scholar] [CrossRef]
  22. Block, W.; Erzinclioglu, Y.Z.; Worland, M.R. Cold Resistance in All Life Stages of Two Blowfly Species (Diptera, Calliphoridae). Med. Vet. Entomol. 1990, 4, 213–219. [Google Scholar] [CrossRef] [PubMed]
  23. Hückesfeld, S.; Niederegger, S.; Schlegel, P.; Heinzel, H.-G.; Spiess, R. Feel the Heat: The Effect of Temperature on Development, Behavior and Central Pattern Generation in 3rd Instar Calliphora Vicina Larvae. J. Insect Physiol. 2011, 57, 136–146. [Google Scholar] [CrossRef] [PubMed]
  24. Peccia, J.; Werth, H.M.; Shelly, M.; Mark, H. Effects of Relative Humidity on the Ultraviolet Induced Inactivation of Airborne Bacteria. Aerosol Sci. Technol. 2001, 35, 728–740. [Google Scholar] [CrossRef] [Green Version]
  25. Engl, T.; Eberl, N.; Gorse, C.; Krüger, T.; Schmidt, T.H.P.; Plarre, R.; Adler, C.; Kaltenpoth, M. Ancient Symbiosis Confers Desiccation Resistance to Stored Grain Pest Beetles. Mol. Ecol. 2018, 27, 2095–2108. [Google Scholar] [CrossRef] [PubMed]
  26. Rodriguez, R.J.; Henson, J.; Van Volkenburgh, E.; Hoy, M.; Wright, L.; Beckwith, F.; Kim, Y.-O.; Redman, R.S. Stress tolerance in plants via habitat-adapted symbiosis. ISME J. 2008, 2, 404–416. [Google Scholar] [CrossRef] [PubMed] [Green Version]
  27. Duron, O.; Bouchon, D.; Boutin, S.; Bellamy, L.; Zhou, L.; Engelstädter, J.; Hurst, G.D. The Diversity of Reproductive Parasites among Arthropods: Wolbachia Do Not Walk Alone. BMC Biol. 2008, 6, 27. [Google Scholar] [CrossRef] [PubMed] [Green Version]
  28. Leonardo, T.E.; Mondor, E.B. Symbiont Modifies Host Life-History Traits That Affect Gene Flow. Proc. R. Soc. B Biol. Sci. 2006, 273, 1079–1084. [Google Scholar] [CrossRef] [Green Version]
  29. Goodacre, S.L.; Martin, O.Y.; Bonte, D.; Hutchings, L.; Woolley, C.; Ibrahim, K.; Thomas, C.F.G.; Hewitt, G.M. Microbial Modification of Host Long-Distance Dispersal Capacity. BMC Biol. 2009, 7, 32. [Google Scholar] [CrossRef] [Green Version]
  30. Evans, H.C. Co-Evolution of Entomogenous Fungi and Their Insect Hosts. In Co-Evolution of Fungi with Plants and Animals; Academic Press: London, UK, 1988. [Google Scholar]
  31. Karling, J.S. Chytridiosis of Scale Insects. Am. J. Bot. 1948, 35, 246–254. [Google Scholar] [CrossRef]
  32. Evans, H.C. Mycopathogens of Insects of Epigeal and Aerial Habitats. In Insect-Fungus Interactions; Academic Press: London, UK, 1989; pp. 205–238. [Google Scholar]
  33. Martin, W.W. Two Additional Species of Catenaria (Chytridiomycetes, Blastocladiales) Parasitic in Midge Eggs. Mycologia 1978, 70, 461–467. [Google Scholar] [CrossRef]
  34. Matsuura, K.; Tanaka, C.; Nishida, T. Symbiosis of a Termite and a Sclerotium-Forming Fungus: Sclerotia Mimic Termite Eggs. Ecol. Res. 2000, 15, 405–414. [Google Scholar] [CrossRef]
  35. Evans, H.C.; Samson, R.A. Sporodiniella umbellata, an Entomogenous Fungus of the Mucorales from Cocoa Farms in Ecuador. Can. J. Bot. 1977, 55, 2981–2984. [Google Scholar] [CrossRef]
  36. Horn, B.W.; Lichtwardt, R.W. Studies on the Nutritional Relationship of Larval Aedes aegypti (Diptera: Culicidae) with Smittium culisetae (Trichomycetes). Mycologia 1981, 73, 724–740. [Google Scholar] [CrossRef]
  37. Roberts, D.W.; Humber, R.A. Entomogenous Fungi. In Biology of Conidial Fungi; Elsevier: Amsterdam, The Netherlands, 1981; pp. 201–236. [Google Scholar]
  38. Humber, R.A. Entomophthoromycota: A New Phylum and Reclassification for Entomophthoroid Fungi. Mycotaxon 2012, 120, 477–492. [Google Scholar] [CrossRef]
  39. Armer, C.A.; Rao, S.; Berry, R.E.; Armer, C.A.; Rao, S.; Berry, R.E. Insect Cellular and Chemical Limitations to Pathogen Development: The Colorado Potato Beetle, the Nematode Heterorhabditis marelatus, and Its Symbiotic Bacteria. J. Invertebr. Pathol. 2004, 87, 114–122. [Google Scholar] [CrossRef]
  40. Taylor, D.B.; Szalanski, A.L.; Adams, B.J.; Peterson, R.D. Susceptibility of House Fly (Diptera: Muscidae) Larvae to Entomopathogenic Nematodes (Rhabditida: Heterorhabditidae, Steinernematidae). Environ. Entomol. 1998, 27, 1514–1519. [Google Scholar] [CrossRef] [Green Version]
  41. Li, X.-Y.; Cowles, R.S.; Cowles, E.A.; Gaugler, R.; Cox-Foster, D.L.; Li, X.Y.; Cowles, R.S.; Cowles, E.A.; Gaugler, R.; Cox-Foster, D.L. Relationship between the Successful Infection by Entomopathogenic Nematodes and the Host Immune Response. Int. J. Parasitol. 2007, 37, 365–374. [Google Scholar] [CrossRef]
  42. van Sambeek, J.; Wiesner, A.; Van Sambeek, J.; Wiesner, A. Successful Parasitation of Locusts by Entomopathogenic Nematodes Is Correlated with Inhibition of Insect Phagocytes. J. Invertebr. Pathol. 1999, 73, 154–161. [Google Scholar] [CrossRef]
  43. Zhao, X.; Ferdig, M.T.; Li, J.; Christensen, B.M. Biochemical Pathway of Melanotic Encapsulation of Brugia malayi in the Mosquito Armigeres subalbatus. Dev. Comp. Immunol. 1995, 19, 205–215. [Google Scholar] [CrossRef]
  44. Aliota, M.T.; Chen, C.-C.; Dagoro, H.; Fuchs, J.F.; Christensen, B.M. Filarial Worms Reduce Plasmodium Infectivity in Mosquitoes. PLoS Negl. Trop. Dis. 2011, 5, e963. [Google Scholar] [CrossRef]
  45. Vegni Talluri, M.; Cancrini, G. An Ultrastructural Study on the Early Cellular Response to Dirofilaria immitis (Nematoda) in the Malpighian Tubules of Aedes aegypti (Refractory Strains). Parasite 1994, 1, 343–348. [Google Scholar] [CrossRef] [PubMed] [Green Version]
  46. Cupp, M.S.; Chen, Y.; Cupp, E.W. Cellular Hemolymph Response of Simulium Vittatum (Diptera: Simuliidae) to Intrathoracic Injection of Onchocerca lienalis (Filarioidea: Onchocercidae) Microfilariae. J. Med. Entomol. 1997, 34, 56–63. [Google Scholar] [CrossRef] [PubMed]
  47. Bartholomay, L.C.; Waterhouse, R.M.; Mayhew, G.F.; Campbell, C.L.; Michel, K.; Zou, Z.; Ramirez, J.L.; Das, S.; Alvarez, K.; Arensburger, P.; et al. Pathogenomics of Culex quinquefasciatus and meta-analysis of infection responses to diverse pathogens. Science 2010, 330, 88–90. [Google Scholar] [CrossRef] [PubMed] [Green Version]
  48. Seymour, R.; Briggs, J.D. Occurrence and Control of Aphanomyces (Saprolegniales: Fungi) Infections in Laboratory Colonies of Larval Anopheles. J. Am. Mosq. Control Assoc. 1985, 1, 100–102. [Google Scholar]
  49. Stephen, K.; Ipek Kurtböke, D. Screening of Oomycete Fungi for Their Potential Role in Reducing the Biting Midge (Diptera: Ceratopogonidae) Larval Populations in Hervey Bay, Queensland, Australia. Int. J. Environ. Res. Public Health 2011, 8, 15601574. [Google Scholar] [CrossRef] [Green Version]
  50. Biedermann, P.H.W.; Vega, F.E. Ecology and Evolution of Insect—Fungus Mutualisms. Annu. Rev. Entomol. 2020, 65, 431–455. [Google Scholar] [CrossRef] [Green Version]
  51. Schultz, T.R.; Brady, S.G. Major Evolutionary Transitions in Ant Agriculture. Proc. Natl. Acad. Sci. USA 2008, 105, 5435–5440. [Google Scholar] [CrossRef] [Green Version]
  52. Hulcr, J.; Stelinski, L.L. The Ambrosia Symbiosis: From Evolutionary Ecology to Practical Management. Annu. Rev. Entomol. 2017, 62, 285–303. [Google Scholar] [CrossRef] [Green Version]
  53. Aanen, D.K.; De Fine Licht, H.H.; Debets, A.J.M.; Kerstes, N.A.G.; Hoekstra, R.F.; Boomsma, J.J. High Symbiont Relatedness Stabilizes Mutualistic Cooperation in Fungusgrowing Termites. Science 2009, 326, 1103–1106. [Google Scholar] [CrossRef] [Green Version]
  54. Defossez, E.; Selosse, M.A.; Dubois, M.P.; Mondolot, L.; Faccio, A.; Djieto-Lordon, C.; McKey, D.; Blatrix, R. Ant-Plants and Fungi: A New Threeway Symbiosis. New Phytol. 2009, 182, 942–949. [Google Scholar] [CrossRef]
  55. Ruiz-González, M.X.; Malé, P.J.G.; Leroy, C.; Dejean, A.; Gryta, H.; Jargeat, P.; Quilichini, A.; Orivel, J. Specific, Non-Nutritional Association between an Ascomycete Fungus and Allomerus Plant-Ants. Biol. Lett. 2011, 7, 475–479. [Google Scholar] [CrossRef]
  56. Nepel, M.; Voglmayr, H.; Schönenberger, J.; Mayer, V.E. High Diversity and Low Specificity of Chaetothyrialean Fungi in Carton Galleries in a Neotropical Ant-Plant Association. PLoS ONE 2014, 9, e112756. [Google Scholar] [CrossRef] [PubMed]
  57. Li, X.; Guo, W.; Ding, J. Mycangial Fungus Benefits the Development of a Leaf-Rolling Weevil, Euops chinesis. J. Insect Physiol. 2012, 58, 867–873. [Google Scholar] [CrossRef] [PubMed]
  58. Kobune, S.; Kajimura, H.; Masuya, H.; Kubono, T. Symbiotic Fungal Flora in Leaf Galls Induced by Illiciomyia yukawai (Diptera: Cecidomyiidae) and in its Mycangia. Microb. Ecol. 2012, 63, 619–627. [Google Scholar] [CrossRef] [PubMed]
  59. Stefanini, I. Yeast-Insect Associations: It Takes Guts. Yeast 2018, 35, 315–330. [Google Scholar] [CrossRef] [Green Version]
  60. Florez, L.V.; Biedermann, P.H.W.; Engl, T.; Kaltenpoth, M. Defensive Symbioses of Animals with Prokaryotic and Eukaryotic Microorganisms. R. Soc. Chem. 2015, 32, 904–936. [Google Scholar] [CrossRef] [Green Version]
  61. Goodrich-Blair, H.; Clarke, D.J. Mutualism and Pathogenesis in Xenorhabdus and Photorhabdus: Two Roads to the Same Destination. Mol. Microbiol. 2007, 64, 260–268. [Google Scholar] [CrossRef] [PubMed]
  62. Miranda, V.A.; Navarro, P.D.; Davidowitz, G.; Bronstein, J.; Stock, S.P. Effect of Insect Host Age and Diet on the Fitness of the Entomopathogenic Nematode-Bacteria Mutualism. Symbiosis 2013, 61, 145–153. [Google Scholar] [CrossRef]
  63. Griffiths, H.M.; Ashton, L.A.; Walker, A.E.; Hasan, F.; Evans, T.A.; Eggleton, P.; Parr, C.L. Ants Are the Major Agents of Resource Removal from Tropical Rainforests. J. Anim. Ecol. 2018, 87, 293–300. [Google Scholar] [CrossRef] [Green Version]
  64. Davidson, D.W.; Cook, S.C.; Snelling, R.R.; Chua, T.H. Explaining the Abundance of Ants in Lowland Tropical Rainforest Canopies. Science 2003, 300, 969–972. [Google Scholar] [CrossRef] [Green Version]
  65. Cook, S.C.; Davidson, D.W. Nutritional and Functional Biology of Exudate-Feeding Ants. Entomol. Exp. Appl. 2006, 118, 1–10. [Google Scholar] [CrossRef]
  66. Anderson, K.E.; Russell, J.A.; Moreau, C.S.; Kautz, S.; Sullam, K.E.; Hu, Y.; Basinger, U.; Mott, B.M.; Buck, N.; Wheeler, D.E. Highly Similar Microbial Communities Are Shared among Related and Trophically Similar Ant Species. Mol. Ecol. 2012, 21, 2282–2296. [Google Scholar] [CrossRef]
  67. Funaro, C.F.; Kronauer, D.J.C.; Moreau, C.S.; Goldman-Huertas, B.; Pierce, N.E.; Russell, J.A. Army Ants Harbor a Host-Specific Clade of Entomoplasmatales Bacteria. Appl. Environ. Microbiol. 2011, 77, 346–350. [Google Scholar] [CrossRef] [Green Version]
  68. Łukasik, P.; Newton, J.A.; Sanders, J.G.; Hu, Y.; Moreau, C.S.; Kronauer, D.J.C.; O’Donnell, S.; Koga, R.; Russell, J.A. The Structured Diversity of Specialized Gut Symbionts of the New World Army Ants. Mol. Ecol. 2017, 26, 3808–3825. [Google Scholar] [CrossRef] [PubMed]
  69. Sanders, J.G.; Powell, S.; Kronauer, D.J.C.; Vasconcelos, H.L.; Frederickson, M.E.; Pierce, N.E. Stability and Phylogenetic Correlation in Gut Microbiota: Lessons from Ants and Apes. Mol. Ecol. 2014, 23, 1268–1283. [Google Scholar] [CrossRef]
  70. Hu, Y.; Sanders, J.G.; Łukasik, P.; D’Amelio, C.L.; Millar, J.S.; Vann, D.R.; Lan, Y.; Newton, J.A.; Schotanus, M.; Kronauer, D.J.C.; et al. Herbivorous Turtle Ants Obtain Essential Nutrients from a Conserved Nitrogen-Recycling Gut Microbiome. Nat. Commun. 2018, 9, 964. [Google Scholar] [CrossRef] [Green Version]
  71. Wernegreen, J.J.; Kauppinen, S.N.; Brady, S.G.; Ward, P.S. One Nutritional Symbiosis Begat Another: Phylogenetic Evidence That the Ant Tribe Camponotini Acquired Blochmannia by Tending Sap-Feeding Insects. BMC Evol. Biol. 2009, 9, 292. [Google Scholar] [CrossRef] [PubMed] [Green Version]
  72. Ramalho, M.O.; Duplais, C.; Orivel, J.; Dejean, A.; Gibson, J.C.; Suarez, A.V.; Moreau, C.S. Development but Not Diet Alters Microbial Communities in the Neotropical Arboreal Trap Jaw Ant Daceton armigerum: An Exploratory Study. Sci. Rep. 2020, 10, 7350. [Google Scholar] [CrossRef] [PubMed]
  73. Moreau, C.S.; Rubin, B.E.R. Diversity and Persistence of the Gut Microbiome of the Giant Neotropical Bullet Ant. Integr. Comp. Biol. 2017, 57, 682–689. [Google Scholar] [CrossRef] [Green Version]
  74. De Oliveira, T.B.; Ferro, M.; Bacci, M.; De Souza, D.J.; Fontana, R.; Delabie, J.H.C.; Silva, A. Bacterial Communities in the Midgut of Ponerine Ants (Hymenoptera: Formicidae: Ponerinae). Sociobiology 2016, 63, 637–644. [Google Scholar] [CrossRef] [Green Version]
  75. Rubin, B.E.R.; Kautz, S.; Wray, B.D.; Moreau, C.S. Dietary Specialization in Mutualistic Acacia-Ants Affects Relative Abundance but Not Identity of Host-Associated Bacteria. Mol. Ecol. 2019, 28, 900–916. [Google Scholar] [CrossRef]
  76. Martins, C.; Souza, R.F.; Bueno, O.C. Presence and Distribution of the Endosymbiont Wolbachia among Solenopsis spp. (Hymenoptera: Formicidae) from Brazil and its Evolutionary History. J. Invertebr. Pathol. 2012, 109, 287–296. [Google Scholar] [CrossRef] [PubMed] [Green Version]
  77. Ramalho, M.O.; Bueno, O.C.; Moreau, C.S. Microbial Composition of Spiny Ants (Hymenoptera: Formicidae: Polyrhachis) across Their Geographic Range. BMC Evol. Biol. 2017, 17, 96. [Google Scholar] [CrossRef] [PubMed] [Green Version]
  78. Corby-Harris, V.; Snyder, L.; Meador, C.A.D.; Naldo, R.; Mott, B.; Anderson, K.E. Parasaccharibacter apium, Gen. Nov., Sp. Nov., Improves Honey Bee (Hymenoptera: Apidae) Resistance to Nosema. J. Econ. Entomol. 2016, 109, 537–543. [Google Scholar] [CrossRef] [Green Version]
  79. Mitraka, E.; Stathopoulos, S.; Siden-Kiamos, I.; Christophides, G.K.; Louis, C. Asaia Accelerates Larval Development of Anopheles gambiae. Pathog. Glob. Health 2013, 107, 305–311. [Google Scholar] [CrossRef] [PubMed] [Green Version]
  80. Sapountzis, P.; Zhukova, M.; Hansen, L.H.; Sørensen, S.J.; Schiøtt, M.; Boomsma, J.J. Acromyrmex Leaf-Cutting Ants Have Simple Gut Microbiota with Nitrogen-Fixing Potential. Appl. Environ. Microbiol. 2015, 81, 5527–5537. [Google Scholar] [CrossRef] [PubMed] [Green Version]
  81. Dussutour, A.; Simpson, S.J. Ant Workers Die Young and Colonies Collapse When Fed a High-Protein Diet. Proc. R. Soc. B Biol. Sci. 2012, 279, 2402–2408. [Google Scholar] [CrossRef] [PubMed] [Green Version]
  82. Neuvonen, M.M.; Tamarit, D.; Näslund, K.; Liebig, J.; Feldhaar, H.; Moran, N.A.; Guy, L.; Andersson, S.G.E. The Genome of Rhizobiales Bacteria in Predatory Ants Reveals Urease Gene Functions but No Genes for Nitrogen Fixation. Sci. Rep. 2016, 6, 39197. [Google Scholar] [CrossRef] [Green Version]
  83. Wenseleers, T.; Billen, J. No Evidence for Wolbachia-Induced Parthenogenesis in the Social Hymenoptera. J. Evol. Biol. 2000, 13, 277–280. [Google Scholar] [CrossRef] [Green Version]
  84. Hosokawa, T.; Koga, R.; Kikuchi, Y.; Meng, X.Y.; Fukatsu, T. Wolbachia as a Bacteriocyte-Associated Nutritional Mutualist. Proc. Natl. Acad. Sci. USA 2010, 107, 769–774. [Google Scholar] [CrossRef] [Green Version]
  85. Santos, A.V.; Dillon, R.J.; Dillon, V.M.; Reynolds, S.E.; Samuels, R.I. Ocurrence of the Antibiotic Producing Bacterium Burkholderia sp. in Colonies of the Leaf-Cutting Ant Atta sexdens rubropilosa. FEMS Microbiol. Lett. 2004, 239, 319–323. [Google Scholar] [CrossRef] [PubMed]
  86. Hughes, D.P.; Andersen, S.B.; Hywel-Jones, N.L.; Himaman, W.; Billen, J.; Boomsma, J.J. Behavioral Mechanisms and Morphological Symptoms of Zombie Ants Dying from Fungal Infection. BMC Ecol. 2011, 11, 13. [Google Scholar] [CrossRef] [PubMed] [Green Version]
  87. Poinar, G. Nematode Parasites and Associates of Ants: Past and Present. Psyche 2012, 2012, 192017. [Google Scholar] [CrossRef] [Green Version]
  88. Baccaro, F.B.; Feitosa, R.M.; Fernández, F.; Fernandes, I.O.; Izzo, T.J.; Souza, J.D.; Solar, R. Guia Para Os Gêneros de Formigas Do Brasil, 1st ed.; Editora INPA: Manaus, Brazil, 2015. [Google Scholar] [CrossRef]
  89. Rubin, B.E.R.; Sanders, J.G.; Hampton-Marcell, J.; Owens, S.M.; Gilbert, J.A.; Moreau, C.S. DNA Extraction Protocols Cause Differences in 16S RRNA Amplicon Sequencing Efficiency but Not in Community Profile Composition or Structure. Microbiologyopen 2014, 3, 910–921. [Google Scholar] [CrossRef] [Green Version]
  90. Moreau, C.S. A Practical Guide to DNA Extraction, PCR, and Gene-Based DNA Sequencing in Insects. Halteres 2014, 5, 32–42. [Google Scholar]
  91. Caporaso, J.G.; Lauber, C.L.; Walters, W.A.; Berg-Lyons, D.; Huntley, J.; Fierer, N.; Owens, S.M.; Betley, J.; Fraser, L.; Bauer, M.; et al. Ultra-High-Throughput Microbial Community Analysis on the Illumina HiSeq and MiSeq Platforms. ISME J. 2012, 6, 1621–1624. [Google Scholar] [CrossRef] [Green Version]
  92. Creer, S.; Fonseca, V.G.; Porazinska, D.L.; Giblin-Davis, R.M.; Sung, W.; Power, D.M.; Packer, M.; Carvalho, G.R.; Blaxter, M.L.; Lambshead, P.J.D.; et al. Ultrasequencing of the Meiofaunal Biosphere: Practice, Pitfalls and Promises. Mol. Ecol. 2010, 19, 4–20. [Google Scholar] [CrossRef]
  93. Bolyen, E.; Rideout, J.R.; Dillon, M.R.; Bokulich, N.A.; Abnet, C.C.; Al-Ghalith, G.A.; Alexander, H.; Alm, E.J.; Arumugam, M.; Asnicar, F.; et al. Reproducible, Interactive, Scalable and Extensible Microbiome Data Science Using QIIME 2. Nat. Biotechnol. 2019, 37, 852–857. [Google Scholar] [CrossRef]
  94. Callahan, B.J.; McMurdie, P.J.; Rosen, M.J.; Han, A.W.; Johnson, A.J.A.; Holmes, S.P. DADA2: High-Resolution Sample Inference from Illumina Amplicon Data. Nat. Methods 2016, 13, 581–583. [Google Scholar] [CrossRef] [Green Version]
  95. Quast, C.; Pruesse, E.; Yilmaz, P.; Gerken, J.; Schweer, T.; Yarza, P.; Peplies, J.; Glöckner, F.O. The SILVA Ribosomal RNA Gene Database Project: Improved Data Processing and Web-Based Tools. Nucleic Acids Res. 2013, 41, 590–596. [Google Scholar] [CrossRef]
  96. Bokulich, N.; Kaehler, B.; Rideout, J.R.; Dillon, M.; Bolyen, E.; Knight, R.; Huttley, G.; Caporaso, G. Optimizing Taxonomic Classification of Marker Gene Amplicon Sequences. PeerJ Prepr. 2018, 6, e3208v2. [Google Scholar] [CrossRef]
  97. Davis, N.M.; Proctor, D.M.; Holmes, S.P.; Relman, D.A.; Callahan, B.J. Simple Statistical Identification and Removal of Contaminant Sequences in Marker-Gene and Metagenomics Data. Microbiome 2018, 6, 1–14. [Google Scholar] [CrossRef] [Green Version]
  98. R Core Team. R: A Language and Environment for Statistical Computing; R Foundation for Statistical Computing: Vienna, Austria, 2019. [Google Scholar]
  99. Katoh, K.; Standley, D.M. MAFFT Multiple Sequence Alignment Software Version 7: Improvements in Performance and Usability. Mol. Biol. Evol. 2013, 30, 772–780. [Google Scholar] [CrossRef] [PubMed] [Green Version]
  100. Jaccard, P. Nouvelles Recherches Sur La Distribution Florale. Bull. Soc. Vaud. Sci. Nat. 1908, 44, 223–270. [Google Scholar]
  101. Sorenson, T. A Method of Establishing Groups of Equal Amplitude in Plant Sociology Based on Similarity of Species Content. K. Danske Vidensk. Selsk. 1948, 5, 1–34. [Google Scholar]
  102. Lozupone, C.; Knight, R. UniFrac: A New Phylogenetic Method for Comparing Microbial Communities. Appl. Environ. Microbiol. 2005, 71, 8228–8235. [Google Scholar] [CrossRef] [Green Version]
  103. Lozupone, C.A.; Hamady, M.; Kelley, S.T.; Knight, R. Quantitative and Qualitative β Diversity Measures Lead to Different Insights into Factors That Structure Microbial Communities. Appl. Environ. Microbiol. 2007, 73, 1576–1585. [Google Scholar] [CrossRef] [Green Version]
  104. Hammer, Ø.; Harper, D.A.T.; Ryan, P.D. Past: Paleontological Statistics Software Package for Education and Data Analysis. Palaeontol. Electron. 2001, 4, 9. [Google Scholar]
  105. Kassambara, A. Ggpubr: “ggplot2” Based Publication Ready Plots. R Packag. Version 0.3.0. 2020. Available online: https://CRAN.R-project.org/package=ggpubr (accessed on 6 January 2023).
  106. Pohlert, T. The Pairwise Multiple Comparison of Mean Ranks Package PMCMR. R Package. 2014. Available online: https://CRAN.R-project.org/package=PMCMR (accessed on 6 January 2023).
  107. Gómez-Rubio, V. Ggplot2—Elegant Graphics for Data Analysis (2nd Edition). J. Stat. Softw. 2017, 77, 3–5. [Google Scholar] [CrossRef] [Green Version]
  108. Tang, Y.; Horikoshi, M.; Li, W. Ggfortify: Unified Interface to Visualize Statistical Results of Popular r Packages. R J. 2016, 8, 478–489. [Google Scholar] [CrossRef] [Green Version]
  109. Revell, L.J. Phytools: An R Package for Phylogenetic Comparative Biology (and Other Things). Methods Ecol. Evol. 2012, 3, 217–223. [Google Scholar] [CrossRef]
  110. Nelsen, M.P.; Ree, R.H.; Moreau, C.S. Ant–Plant Interactions Evolved through Increasing Interdependence. Proc. Natl. Acad. Sci. USA 2018, 115, 12253–12258. [Google Scholar] [CrossRef] [PubMed] [Green Version]
  111. Muegge, B.D.; Kuczynski, J.; Knights, D.; Clemente, J.C.; González, A.; Fontana, L.; Henrissat, B.; Knight, R.; Gordon, J.I. Diet Drives Convergence in Gut Microbiome Functions across Mammalian Phylogeny and within Humans. Science 2011, 332, 970–974. [Google Scholar] [CrossRef] [PubMed] [Green Version]
  112. Russell, J.A.; Moreau, C.S.; Goldman-Huertas, B.; Fujiwara, M.; Lohman, D.J.; Pierce, N.E. Bacterial Gut Symbionts Are Tightly Linked with the Evolution of Herbivory in Ants. Proc. Natl. Acad. Sci. USA 2009, 106, 21236–21241. [Google Scholar] [CrossRef] [PubMed]
  113. Freter, R.; Brickner, H.; Fekete, J.; Vickerman, M.M.; Carey, K.E. Survival and Implantation of Escherichia coli in the Intestinal Tract. Infect. Immun. 1983, 39, 686–703. [Google Scholar] [CrossRef] [PubMed] [Green Version]
  114. Freter, R.; Brickner, H.; Botney, M.; Cleven, D.; Aranki, A. Mechanisms That Control Bacterial Populations in Continuous-Flow Culture Models of Mouse Large Intestinal Flora. Infect. Immun. 1983, 39, 676–685. [Google Scholar] [CrossRef] [Green Version]
  115. Papadimitriou, K.; Pot, B.; Tsakalidou, E. How Microbes Adapt to a Diversity of Food Niches. Curr. Opin. Food Sci. 2015, 2, 29–35. [Google Scholar] [CrossRef]
  116. Chaucheyras-Durand, F.; Durand, H. Probiotics in Animal Nutrition and Health. Benef. Microbes 2010, 1, 3–9. [Google Scholar] [CrossRef] [PubMed]
  117. Macfarlane, G.T.; Steed, H.; Macfarlane, S. Bacterial Metabolism and Health-Related Effects of Galacto-Oligosaccharides and Other Prebiotics. J. Appl. Microbiol. 2008, 104, 305–344. [Google Scholar] [CrossRef]
  118. Ramirez-Farias, C.; Slezak, K.; Fuller, Z.; Duncan, A.; Holtrop, G.; Louis, P. Effect of Inulin on the Human Gut Microbiota: Stimulation of Bifidobacterium adolescentis and Faecalibacterium prausnitzii. Br. J. Nutr. 2009, 101, 541–550. [Google Scholar] [CrossRef] [Green Version]
  119. Ivarsson, E.; Roos, S.; Liu, H.Y.; Lindberg, J.E. Fermentable Non-Starch Polysaccharides Increases the Abundance of Bacteroides-Prevotella-Porphyromonas in Ileal Microbial Community of Growing Pigs. Animal 2014, 8, 1777–1787. [Google Scholar] [CrossRef]
  120. Chung, W.S.F.; Walker, A.W.; Louis, P.; Parkhill, J.; Vermeiren, J.; Bosscher, D.; Duncan, S.H.; Flint, H.J. Modulation of the Human Gut Microbiota by Dietary Fibres Occurs at the Species Level. BMC Biol. 2016, 14, 3. [Google Scholar] [CrossRef] [PubMed] [Green Version]
  121. Madigosky, S.R. Tropical Microclimatic Considerations. In Forest Canopies; Lowman, M.D., Rinker, H.B., Eds.; Elsevier Academic Press: Cambridge, MA, USA, 2004; pp. 24–48. [Google Scholar]
  122. Kumagai, T.; Kuraji, K.; Noguchi, H.; Tanaka, Y.; Tanaka, K.; Suzuki, M. Vertical Profiles of Environmental Factors within Tropical Rainforest, Lambir Hills National Park, Sarawak, Malaysia. J. For. Res. 2001, 6, 257–264. [Google Scholar] [CrossRef]
  123. Basset, Y.; Hammond, P.M.; Barrios, H.; Holloway, J.D.; Miller, S.E. Vertical Stratification of Arthropod Assemblages. In Arthropods of Tropical Forests: Spatio-Temporal Dynamics and Resource Use in the Canopy; Basset, Y., Novotny, V., Miller, S.E., Kitching, R.L., Eds.; Cambridge University Press: New York, NY, USA, 2003; pp. 17–27. [Google Scholar]
  124. Gruntenko, N.E.; Ilinsky, Y.Y.; Adonyeva, N.V.; Burdina, E.V.; Bykov, R.A.; Menshanov, P.N.; Rauschenbach, I.Y. Various Wolbachia Genotypes Differently Influence Host Drosophila Dopamine Metabolism and Survival under Heat Stress Conditions. BMC Evol. Biol. 2017, 17, 15–22. [Google Scholar] [CrossRef] [PubMed]
  125. Burke, G.; Fiehn, O.; Moran, N. Effects of Facultative Symbionts and Heat Stress on the Metabolome of Pea Aphids. ISME J. 2010, 4, 242–252. [Google Scholar] [CrossRef] [PubMed] [Green Version]
  126. Ferguson, L.V.; Dhakal, P.; Lebenzon, J.E.; Heinrichs, D.E.; Bucking, C.; Sinclair, B.J. Seasonal Shifts in the Insect Gut Microbiome Are Concurrent with Changes in Cold Tolerance and Immunity. Funct. Ecol. 2018, 32, 2357–2368. [Google Scholar] [CrossRef] [Green Version]
  127. Rio, R.V.M.; Wu, Y.N.; Filardo, G.; Aksoy, S. Dynamics of Multiple Symbiont Density Regulation during Host Development: Tsetse Fly and its Microbial Flora. Proc. R. Soc. B Biol. Sci. 2006, 273, 805–814. [Google Scholar] [CrossRef] [Green Version]
  128. Lemoine, M.M.; Engl, T.; Kaltenpoth, M. Microbial Symbionts Expanding or Constraining Abiotic Niche Space in Insects. Curr. Opin. Insect Sci. 2020, 39, 14–20. [Google Scholar] [CrossRef] [PubMed]
  129. Lawley, B.; Ripley, S.; Bridge, P.; Convey, P. Molecular Analysis of Geographic Patterns of Eukaryotic Diversity in Antarctic Soils. Appl. Environ. Microbiol. 2004, 70, 5963–5972. [Google Scholar] [CrossRef] [Green Version]
  130. Fell, J.W.; Scorzetti, G.; Connell, L.; Craig, S. Biodiversity of Micro-Eukaryotes in Antarctic Dry Valley Soils with <5% Soil Moisture. Soil Biol. Biochem. 2006, 38, 3107–3119. [Google Scholar] [CrossRef]
  131. Tian, F.; Yu, Y.; Chen, B.; Li, H.; Yao, Y.F.; Guo, X.K. Bacterial, Archaeal and Eukaryotic Diversity in Arctic Sediment as Revealed by 16S RRNA and 18S RRNA Gene Clone Libraries Analysis. Polar Biol. 2009, 32, 93–103. [Google Scholar] [CrossRef]
  132. Meadow, J.F.; Zabinski, C.A. Spatial Heterogeneity of Eukaryotic Microbial Communities in an Unstudied Geothermal Diatomaceous Biological Soil Crust: Yellowstone National Park, WY, USA. FEMS Microbiol. Ecol. 2012, 82, 182–191. [Google Scholar] [CrossRef] [Green Version]
  133. Wolschin, F.; Hölldobler, B.; Gross, R.; Zientz, E. Replication of the Endosymbiotic Bacterium Blochmannia floridanus is Correlated with the Developmental and Reproductive Stages of its Ant Host. Appl. Environ. Microbiol. 2004, 70, 4096–4102. [Google Scholar] [CrossRef] [PubMed] [Green Version]
  134. Zientz, E.; Beyaert, I.; Gross, R.; Feldhaar, H. Relevance of the Endosymbiosis of Blochmannia floridanus and Carpenter Ants at Different Stages of the Life Cycle of the Host. Appl. Environ. Microbiol. 2006, 72, 6027–6033. [Google Scholar] [CrossRef] [PubMed]
  135. Brown, B.P.; Wernegreen, J.J. Deep Divergence and Rapid Evolutionary Rates in Gut-Associated Acetobacteraceae of Ants. BMC Microbiol. 2016, 16, 1–17. [Google Scholar] [CrossRef] [PubMed] [Green Version]
  136. Nikoh, N.; Hosokawa, T.; Moriyama, M.; Oshima, K.; Hattori, M.; Fukatsu, T. Evolutionary Origin of Insect-Wolbachia Nutritional Mutualism. Proc. Natl. Acad. Sci. USA 2014, 111, 10257–10262. [Google Scholar] [CrossRef] [PubMed] [Green Version]
  137. Stouthamer, R.; Breeuwer, J.A.J.; Hurst, G.D.D. Wolbachia pipientis: Microbial Manipulator of Arthropod Reproduction. Annu. Rev. Microbiol. 1999, 53, 71–102. [Google Scholar] [CrossRef] [PubMed]
  138. Sanders, J.G.; Lukasik, P.; Frederickson, M.E.; Russell, J.A.; Koga, R.; Knight, R.; Pierce, N.E. Dramatic Differences in Gut Bacterial Densities Correlate with Diet and Habitat in Rainforest Ants. Integr. Comp. Biol. 2017, 57, 705–722. [Google Scholar] [CrossRef] [PubMed] [Green Version]
  139. Russell, J.A.; Goldman-Huertas, B.; Moreau, C.S.; Baldo, L.; Stahlhut, J.K.; Werren, J.H.; Pierce, N.E. Specialization and Geographic Isolation among Wolbachia Symbionts from Ants and Lycaenid Butterflies. Evolution 2009, 63, 624–640. [Google Scholar] [CrossRef] [PubMed]
  140. Greiner, T.; Bäckhed, F. Effects of the Gut Microbiota on Obesity and Glucose Homeostasis. Trends Endocrinol. Metab. 2011, 22, 117–123. [Google Scholar] [CrossRef] [PubMed]
  141. Hang, I.; Rinttila, T.; Zentek, J.; Kettunen, A.; Alaja, S.; Apajalahti, J.; Harmoinen, J.; de Vos, W.M.; Spillmann, T. Effect of High Contents of Dietary Animal-Derived Protein or Carbohydrates on Canine Faecal Microbiota. BMC Vet. Res. 2012, 8, 90. [Google Scholar] [CrossRef] [PubMed] [Green Version]
  142. Magnusson, K.R.; Hauck, L.; Jeffrey, B.M.; Elias, V.; Humphrey, A.; Nath, R.; Perrone, A.; Bermudez, L.E. Relationships between Diet-Related Changes in the Gut Microbiome and Cognitive Flexibility. Neuroscience 2015, 300, 128–140. [Google Scholar] [CrossRef] [PubMed]
  143. Larson, H.K.; Goffredi, S.K.; Parra, E.L.; Vargas, O.; Pinto-Tomas, A.A.; McGlynn, T.P. Distribution and Dietary Regulation of an Associated Facultative Rhizobiales-Related Bacterium in the Omnivorous Giant Tropical Ant, Paraponera clavata. Naturwissenschaften 2014, 101, 397–406. [Google Scholar] [CrossRef]
  144. Pyle, R.; Bentzien, M.; Opler, P. Insect Conservation. Annu. Rev. Entomol. 1981, 26, 233–258. [Google Scholar] [CrossRef]
  145. McIntyre, N. Ecology of Urban Arthropods: A Review and a Call to Action. Ann. Entomol. Soc. Am. 2009, 93, 271–276. [Google Scholar] [CrossRef]
  146. Shaffer, B.; Lighthart, B. Survey of Culturable Airborne Bacteria at Four Diverse Locations in Oregon: Urban, Rural, Forest, and Coastal. Microb. Ecol. 1997, 34, 167–177. [Google Scholar] [CrossRef]
  147. Belt, K.T.; Hohn, C.; Gbakima, A.; Higgins, J.A. Identification of Culturable Stream Water Bacteria from Urban, Agricultural, and Forested Watersheds Using 16S RRNA Gene Sequencing. J. Water Health 2007, 5, 395–406. [Google Scholar] [CrossRef] [Green Version]
  148. Reeson, A.F.; Jankovic, T.; Kasper, M.L.; Rogers, S.; Austin, A.D. Application of 16S RDNA-DGGE to Examine the Microbial Ecology Associated with a Social Wasp Vespula germanica. Insect Mol. Biol. 2003, 12, 85–91. [Google Scholar] [CrossRef]
  149. Overzier, E.; Pfister, K.; Thiel, C.; Herb, I.; Mahling, M.; Silaghi, C. Anaplasma phagocytophilum in Questing Ixodes ricinus Ticks: Comparison of Prevalences and Partial 16S RRNA Gene Variants in Urban, Pasture, and Natural Habitats. Appl. Environ. Microbiol. 2013, 79, 1730–1734. [Google Scholar] [CrossRef]
Figure 1. Taxa bar plot based on the relative abundance classified by ant subfamily and genus. Relative abundance bars are colored by bacterial order percentage. Only the 15 most abundant bacterial order associated with Amazonian ants are listed. The less abundant bacterial orders are grouped under the term “Other”.
Diversity 15 00126 g001
Figure 2. Differences in bacterial communities visualized with PCoAs across ant habitats (A,B), nesting modes (C,D), and diets (E,F). The distances used were the Bray–Curtis (A,C,E) and wUniFrac (B,D,F). The statistical p-values were obtained with pairwise PERMANOVAs. The circles represent confidence intervals of 0.95.
Diversity 15 00126 g002
Figure 3. Differences in bacterial communities visualized with PCoAs across ant subfamily (A,B) and phylogeny (C). The distances used were the Bray–Curtis (A,C) and wUniFrac (B,C). The statistical p-values were obtained with pairwise PERMANOVAs.
Diversity 15 00126 g003
Figure 4. Differences in microbial eukaryote communities visualized with PCoAs across ant habitats (A,B), nesting modes (C,D), and diets (E,F). The distances used were the Bray–Curtis (A,C,E) and wUniFrac (B,D,F). The statistical p-values were obtained with pairwise PERMANOVAs. The circles represent confidence intervals of 0.95.
Diversity 15 00126 g004
Figure 5. Differences in eukaryote communities visualized with PCoAs across ant subfamilies (A,B) and phylogenies (C). The distances used were the Bray–Curtis (A,C) and wUniFrac (B,C). The stars on the tips of the phylogenies denote samples that were excluded from this analysis due to low sequencing coverage. The statistical p-values were obtained with PERMANOVAs.
Diversity 15 00126 g005
Figure 6. (A) Taxa bar plot based on the relative abundance ordered by ant nesting mode with all ASVs. The relative abundance bars are colored by the percentages of eukaryote subphyla. The 11 most abundant eukaryote subphyla associated with Amazonian ants are listed. The less abundant eukaryote subphyla are grouped under the term “Other”. The term “Undetermined” represents eukaryote ASVs that could not be identified with the SILVA taxonomy. (B) Taxa bar plot based on the relative abundance ordered by ant nesting mode after removing all undetermined eukaryote ASVs. The relative abundance bars are colored by the percentages of eukaryote subphyla. A description of each eukaryote subphyla and examples of genera associated with each subphylum can be found in Supplementary File S11.
Diversity 15 00126 g006
Disclaimer/Publisher’s Note: The statements, opinions and data contained in all publications are solely those of the individual author(s) and contributor(s) and not of MDPI and/or the editor(s). MDPI and/or the editor(s) disclaim responsibility for any injury to people or property resulting from any ideas, methods, instructions or products referred to in the content.

