Article

Analysis of Scat for Gut Microbiome Identification in Wolves from a Mediterranean and an Alpine Area

1
Department of Life Sciences, University of Siena, Via Aldo Moro 2, 53100 Siena, Italy
2
NBFC, National Biodiversity Future Center, 90133 Palermo, Italy
*
Author to whom correspondence should be addressed.
Diversity 2023, 15(1), 37; https://doi.org/10.3390/d15010037
Submission received: 24 November 2022 / Revised: 23 December 2022 / Accepted: 26 December 2022 / Published: 29 December 2022
(This article belongs to the Section Microbial Diversity and Culture Collections)

Abstract

:
The gut microbiome can play a fundamental role in several processes associated with an organism’s ecology, and research on the microbiota of wild animals has flourished in the last decades. Microbiome composition can vary across and within species according to taxonomy and environmental variability, including the availability of food resources. Species with a large distribution may exhibit spatial patterns acting at local/regional scales. We considered one of the most widespread and ecologically important predators in the world, i.e., the grey wolf Canis lupus, for which microbiome data is unduly limited. We studied four packs in different ecological conditions in Italy—two packs from a Mediterranean coastal area and two packs from an Alpine range—using an amplicon sequencing barcoding approach. Overall, our results are consistent with food habits entailing a diet largely based on wild prey and agree with findings obtained on other species of canids. If confirmed through a larger sample, they would support the hypothesis of an influence of the shared evolutionary history across canids on the composition of the gut microbiome. Some emerging differences were observed among packs in terms of species composition (Jaccard) and diversity, providing partial support to recent indications on pack identity as a significant determinant of microbiome composition. These results should be considered preliminary results of gut microbiome composition in our study areas.

1. Introduction

It is widely recognized that the gut microbiome plays a critical role in several processes that influence individual health [1,2], with implications ranging from the assessments of individual-to-population-level processes to evolutionary history and adaptation [3]. Accordingly, the description of the microbiota of wild animals, as well as research on relationships between the microbiome, ecological factors, and individual characteristics, have been the focus of an increasing number of studies in recent years [3,4,5,6].
The microbiome composition can vary across and within species according to taxonomy and phylogenetic history, as well as the variability of environmental features and anthropogenic impact [3,5,7]. Factors reflecting variation in diet composition, such as seasonality, sex, community composition, habitat, and climatic conditions, may also have an indirect influence on the gut microbiome, triggered by changes in the availability of food resources [3,5,8,9]. Following this rationale, species with a large distribution range can be expected to exhibit spatial patterns of gut microbiome composition associated with environmental factors acting at the local/regional scale. Thus, assessing patterns of microbiota composition at different locations within the species range is important to achieve an adequate description of a species’ microbiota.
We studied the grey wolf Canis lupus that, with a distribution encompassing North America and Eurasia [10], is one of the most widespread carnivores in the world. In this species, microbiome composition has been suggested to be influenced by internal (e.g., age or body condition), social (e.g., pack membership and genetic relatedness), and environmental features such as altitude, climate, and human interference [11,12]. However, information is limited to a few populations (China: [11,13]; North America, Yellowstone National Park: [12]). Incidentally, the practical aspects of studying the microbiome in grey wolves cannot be overlooked. Wolves are overly difficult to observe in the wild due to their nocturnal and secluded habits, and most of the information on their ecology and behavior, including social structure, comes from indirect methods involving the analysis of scat contents, camera trapping, telemetry, or other analyses of biological samples [14]. Feces (i.e., scats) are currently deployed as signs of territorial marking, and their analysis can provide an indication of the dominant diet as well as individual features (i.e., identity, physiological, and genetic profile). The microbial composition of scats may be further used as a minimally invasive alternative to analyses that require direct handling of the animal to study wolf diet, health status, or pack composition.
With this study, we contribute to the knowledge of the wolf microbiome by analyzing the composition of the gut microbiota from wolves living in two contrasting environments in southern Europe: two packs from a Mediterranean coastal area and two packs from an Alpine area. We aimed at (i) describing microbiota composition and evaluating it in relation to published accounts on this species [11,12] and (ii) testing for potential differences in microbiota diversity and composition among packs.

2. Materials and Methods
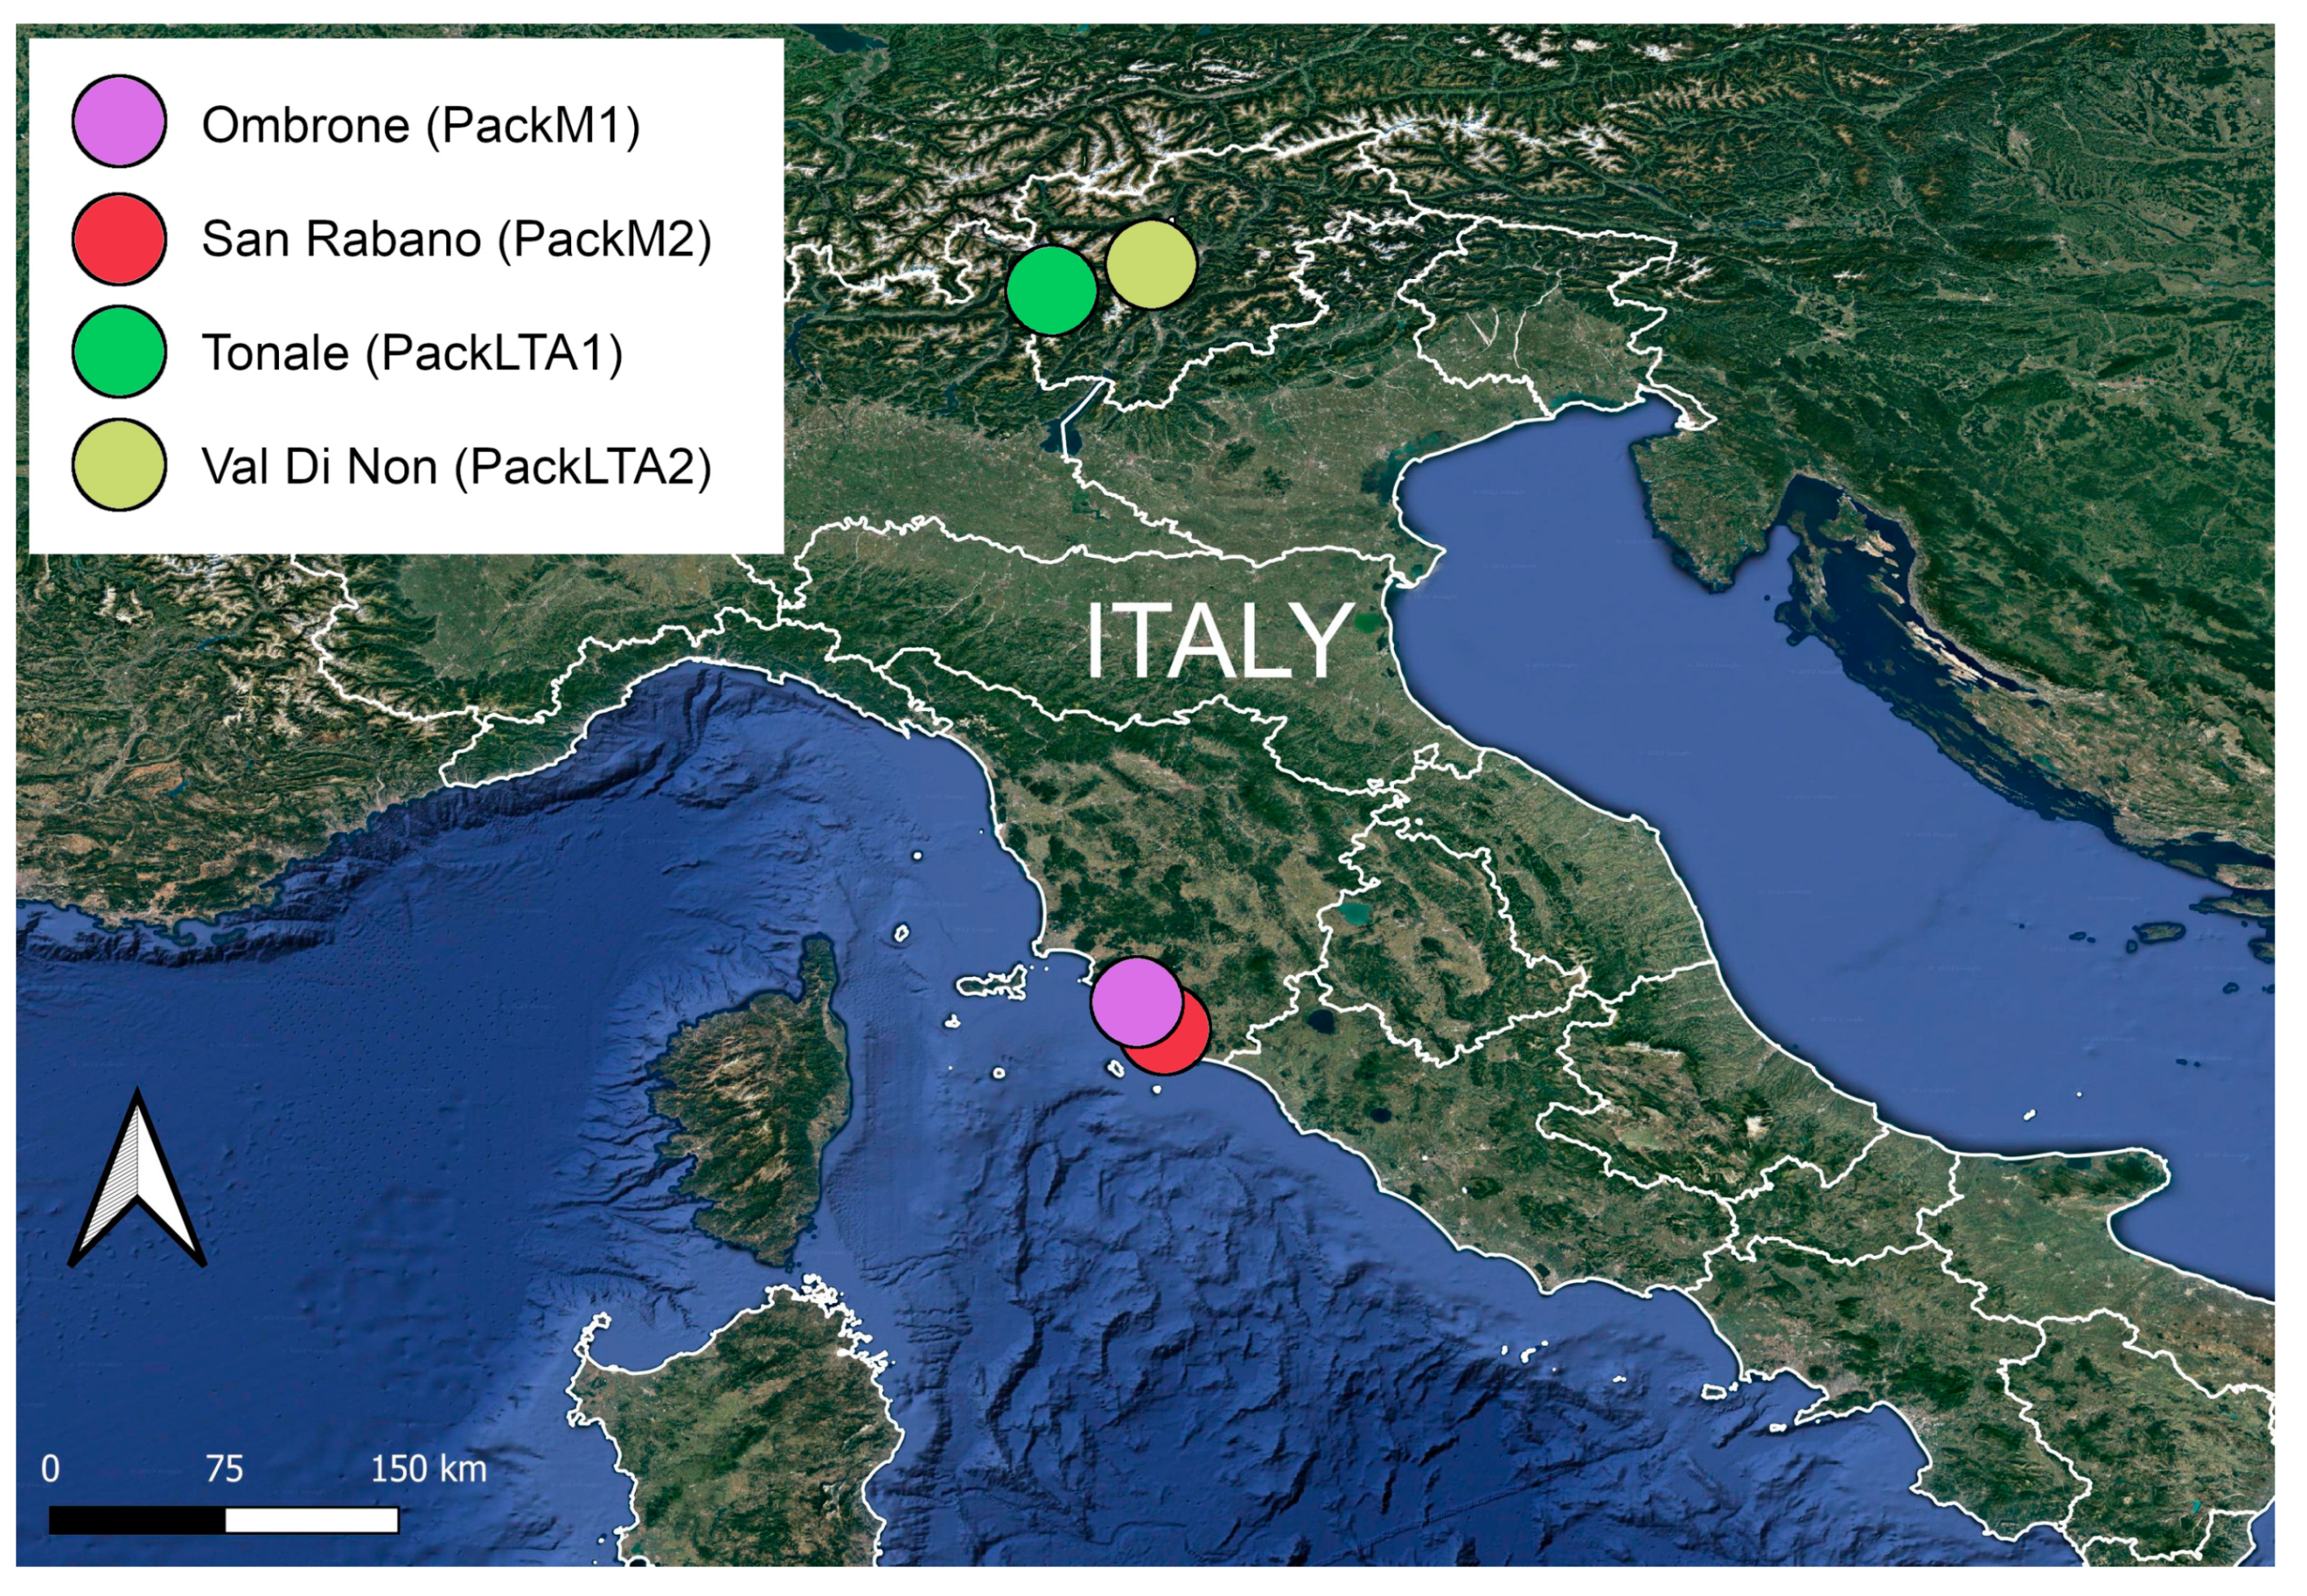
2.1. Study Areas

Wolf fecal samples were collected in the territories of four packs that are actively being monitored in the context of other research activities ([15]; Figure 1). Two packs were sampled in the Maremma Regional Park (approximately 90 km2; 42.626371° N, 11.099303° E), a protected coastal area in central Italy. The “Ombrone” pack was identified as PackM1, and the “San Rabano” pack was identified as PackM2, with minimal pack size being 7–13 individuals and 6–9 individuals depending on the season, respectively, as assessed from camera trapping throughout the study period (Ferretti et al., unpublished data). The area belongs to the Mediterranean Biogeographic Region, and the vegetation is typical of the Mediterranean region, composed mainly of Mediterranean sclerophyllic scrubwood. The mammalian community includes the wolf [15], three species of wild ungulates, i.e., the wild boar Sus scrofa, the roe deer Capreolus capreolus, and the fallow deer Dama dama, and many medium and small-sized species, i.e., the red fox Vulpes vulpes, the European brown hare Lepus europaeus, the crested porcupine Hystrix cristata, the coypu Myocastor coypus, the badger Meles meles, the stone marten Martes foina, the pine marten Martes martes, and the wildcat Felis silvestris [15]. Livestock includes mainly cattle, horses, and sheep [15]. Wolf food habits are dominated by wild boar and fallow deer, with livestock building up only a negligible portion of the wolf diet [15]. Two packs were sampled in the Central Italian Alps between Lombardia (Tonale) and Trentino Alto Adige (Val di Non), identified as PackLTA1 and PackLTA2, respectively. The first one, i.e., the “Tonale” pack (Pack LTA1), established in 2018 (first year of reproduction: 2019; 4 pups produced per year in both 2019 and 2020; Stelvio National Park Agency, unpublished data) and occupied an area that extends for 100–150 km2 partially inside the Stelvio National Park (46.26045° N, 10.58576° E). The climate is alpine, the area belonging to the Alpine Biogeographic Region. Vegetation is mainly dominated by coniferous forests on the valley floor and, above the tree line, alpine and subalpine meadows. Here, 5 species of ungulates are present: red deer Cervus elaphus, chamois Rupicapra rupicapra, roe deer, mouflon Ovis aries, and ibex Capra ibex (as assessed yearly by annual censuses conducted by Park personnel) and cattle, sheep and goats graze on meadows, in summer. The second pack, i.e., the “Val di Non” pack (PackLTA2), occurred in Alta Val di Non, in central Trentino—Alto Adige (46.45537° N, 11.06775° E), where the pack established in 2016 (unpublished data). Here the climate is subalpine-alpine, and vegetation is composed mainly of mixed forests on the valley floor and pinewoods, Pinus silvestris, and spruce forests, Picea abies, at higher altitudes. The main species of ungulates are roe deer, red deer, and chamois, while the presence of wild boar is negligible. In both study areas, mesocarnivores such as red foxes, badgers, stone marten, and pine marten are present, while the presence of the brown bear Ursus arctos is sporadic.

2.2. Sample Collection and Assessment of Scat Content

Fresh feces (i.e., with no molds, with an evident mucous layer on the surface, still soft when prodded with a twig, not covered with dust) were collected in the field in autumn-winter 2020–2021 (PackM1: 30.11.2020, 23.12.2020, 19.02.2021; PackM2: 20.10.2020, 11.11.2020, 4.02.2021; PackLTA1: 19.01.2021; PackLTA2: 20, 23, and 24.10.2020). Samples were frozen at −80 °C until molecular analyses. Three independent fragments (~200 mg each) were excised from each excrement using a sterile scalpel and used for DNA extraction. Only the inner part of the excrement was used for DNA extraction in order to minimize contamination from soil bacteria. The remaining part of the excrement was used to identify food traces. The content of scats was determined through standard procedures involving macro- and microscopic identification of prey hair ([16]; see [15,17] for applications in the Maremma Regional Park).

2.3. Molecular Analyses

DNA was extracted from each fragment using the QIAamp PowerFecal Pro DNA kit (QIAGEN, Hilden, Germany) following the manufacturer protocol and immediately stored at −20 °C. Following amplification of the V3–V4 region of the 16S ribosomal RNA using primers F515 and R806 [18], Illumina 16S barcoding libraries were prepared at BioFab Research S.r.l. (Rome, Italy) and sequenced on a MiSeq (Illumina) to obtain 2 × 300 paired-end reads (Supplementary Material Table S1).
The dataset is thus composed of four packs, three excrements per pack, and three replicates per excrement, totaling 36 samples being analyzed. The sampling design is fully nested in structure, with levels being pack and excrement. An additional level of subdivision was initially envisioned (region, as PackLTA2 and PackLTA1 come from the Stelvio area in Northern Italy and PackM1 and PackM2 come from Maremma in Central Italy). This third level was nevertheless discarded during the analysis as (a) minimal—if any-differences are observed across packs and (b) if nestedness is taken into account, differences at the level of the region are not testable statistically using a non-parametric resampling test (see below).

2.4. Alpha and Beta Diversity of Gut Microbiome

Raw reads were imported in Qiime2 (ver. 2021.4) [19] and pre-processed (PCR primer removal, merging, denoising) using the dada2 denoise-paired function. A Naive Bayes classifier was trained on the SILVA database (ver. 132) [20] using the feature-classifier fit-classifier-naive-Bayes function and used for the taxonomic identification of OTUs. Sequences originating from mitochondria and chloroplast were filtered through taxa filter-seqs and filter-table functions. A phylogenetic tree, necessary for downstream phylogeny-based Beta diversity calculations, was obtained using the phylogeny iqtree-ultrafast-bootstrap function.
Sharing of OTUs among packs (presence/absence) was visualized based on Venn diagrams as implemented in the R package VennDiagram [21]. The same was repeated on the full dataset and, independently, on the 25% more abundant and 25% rarest OTUs.
After computing alpha rarefaction curves in diversity alpha-rarefaction, the OTU table was rarefied to the minimum number of observations across replicates (7095) using the feature-table rarefy function. Alpha diversity metrics (Shannon, observed OTU, Faith, Evenness) were calculated using the core-metrics-phylogenetic function, and their difference at different levels (pack, excrement) was tested based on the Kruskal Wallis test over the entire dataset, followed by post hoc pairwise tests if overall significant, in alpha-group-significance. Noticeably, the four indices convey different types of information: quantitative community richness, qualitative community richness, qualitative phylogenetic diversity, and community evenness, respectively. The relative frequency of species counts in samples was plotted as a histogram using the taxa barplot function.
The diversity core-metrics-phylogenetic function was used to calculate Beta diversity metrics among samples based on Jaccard, Bray Curtis, Unifrac, and Weighted Unifrac indices. The four indices convey different types of information: presence/absence of OTUs, presence/absence and relative abundance, presence/absence and phylogenetic dispersion, presence/absence and relative abundance, as well as phylogenetic dispersion, respectively. The distribution of samples over the ordination space was visualized using a PCoA plot over Jaccard distances. The total variance observed at different levels (pack, excrement, residuals) was partitioned using the qiime diversity adonis function and quantified as R-squared values.
The aggregation of the three replicates for a single excrement—an indication of the technical effectiveness of the sampling procedure to capture information at this level—was assessed based on PCoA plot, R-squared values (see above) and testing in diversity beta-group-significance using permanova with 9999 permutations based on the 4 dissimilarity indices and post hoc pairwise tests.

2.5. Testing for Differences among Packs

Due to the structure of the experimental design, testing for differences among packs required nestedness to be specifically taken into account in the calculation of the null distribution for the test statistic. Two different strategies were used: (a) nested permanova using the software PRIMER (ver 6) [22] with package PERMANOVA+, as this analysis is not currently available in qiime2. Pack and excrement were treated as random factors, with excrement nested in pack. The test was conducted, based on the 4 indices, using 10,000 permutations (resulting in 7000–10,000 unique permutations) to obtain the null distribution with Monte Carlo approximation as well as post hoc pairwise tests where appropriate; (b) counts emerging from the three replicates of a single excrement were pooled, thus actually eliminating nestedness, though at the cost of reducing the number of samples. Packs were further compared, using excrements as observations, based on a permanova test with 9999 permutations performed using the diversity beta-group-significance function and post hoc pairwise tests where appropriate. Replicates were pooled both before and after rarefaction, with identical results, and only the latter is shown.

3. Results

3.1. Scat Content

All the analyzed scats from Alpine packs were characterized by the presence of deer hair. Specifically, only roe deer hair was observed in scats from Val di Non (PackLTA2) and only red deer hair in scats from Tonale (PackLTA1). Scats from the Maremma packs displayed a mixed content of deer and boar. Scats from Ombrone (PackM1) included 67% wild boar and 33% roe deer, whereas those of San Rabano (PackM2) included 67% fallow deer and 33% wild boar (both absolute frequency and volume).

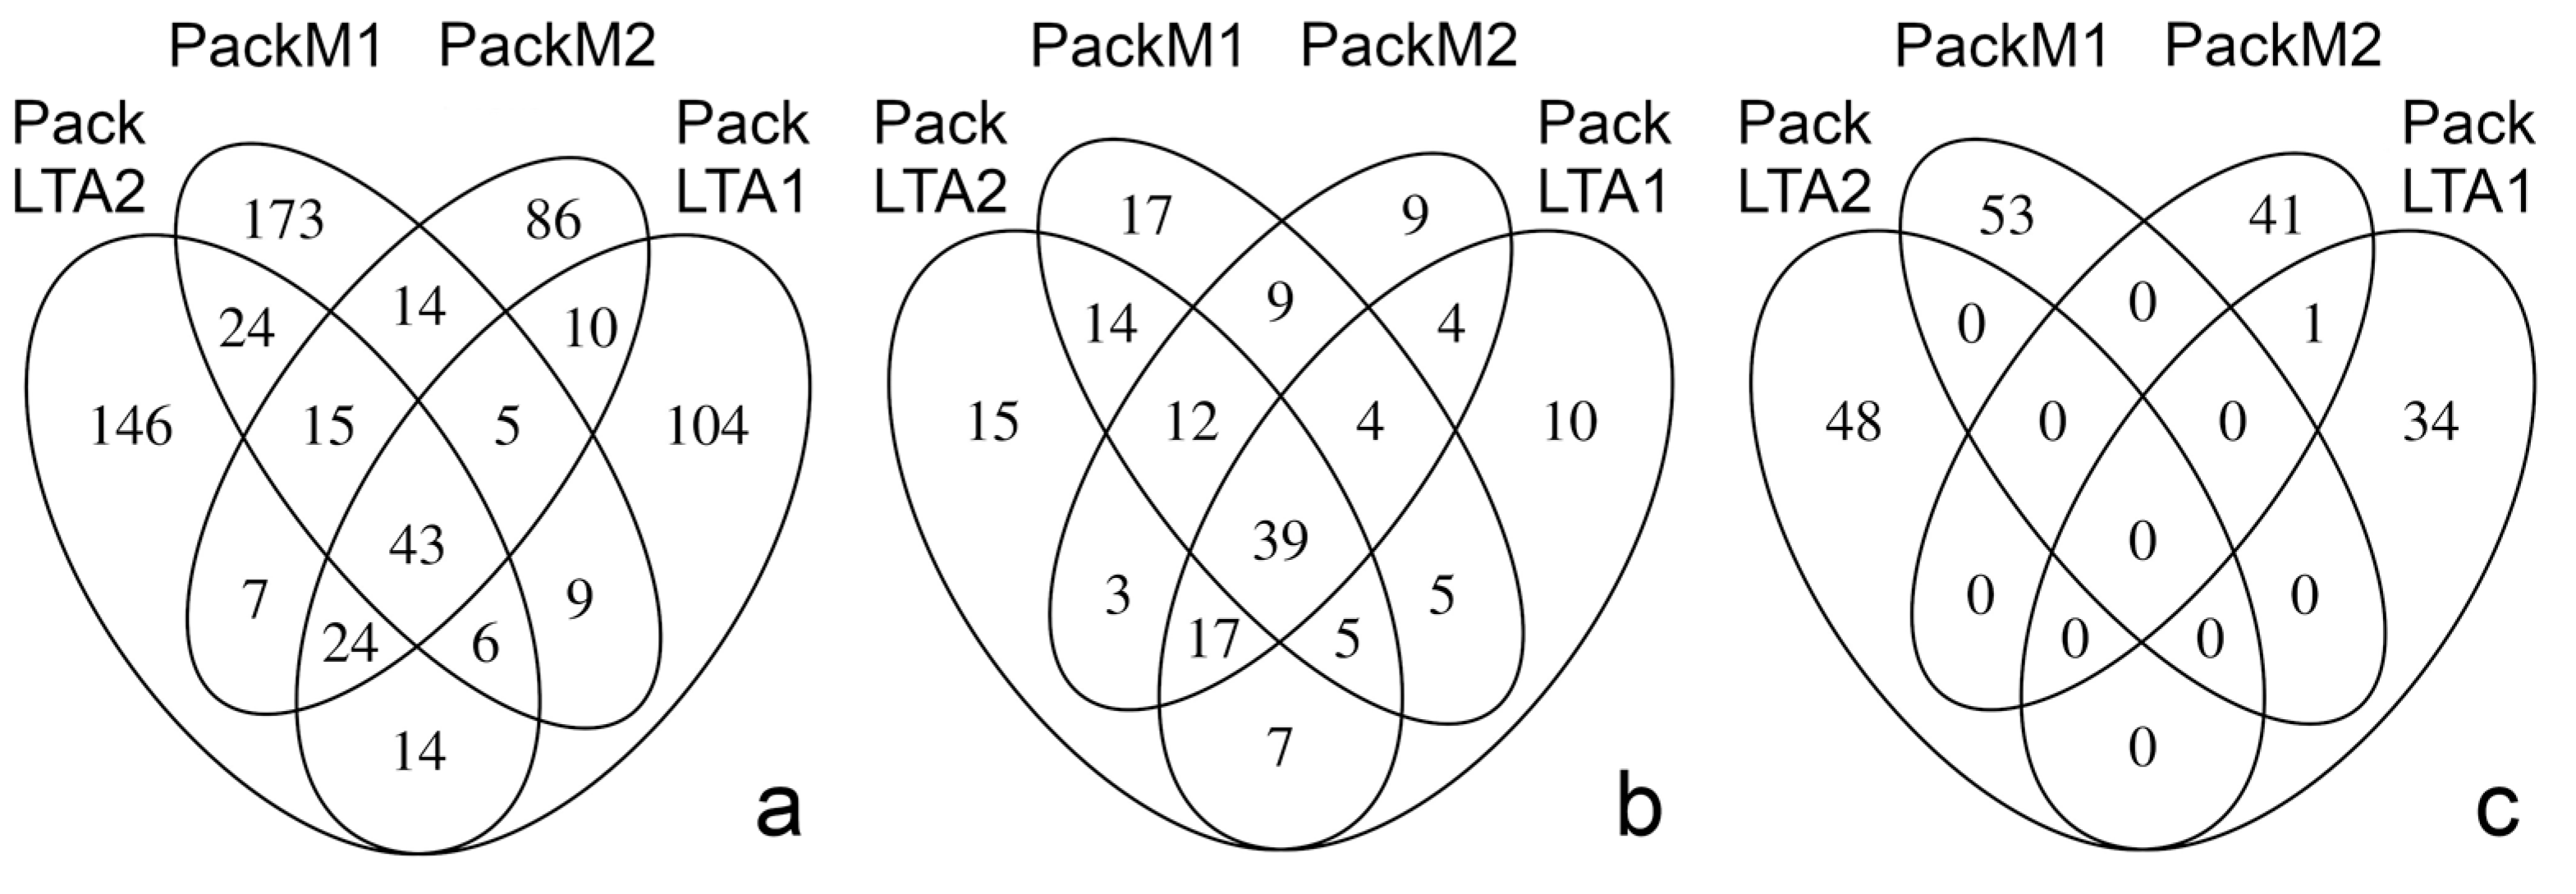
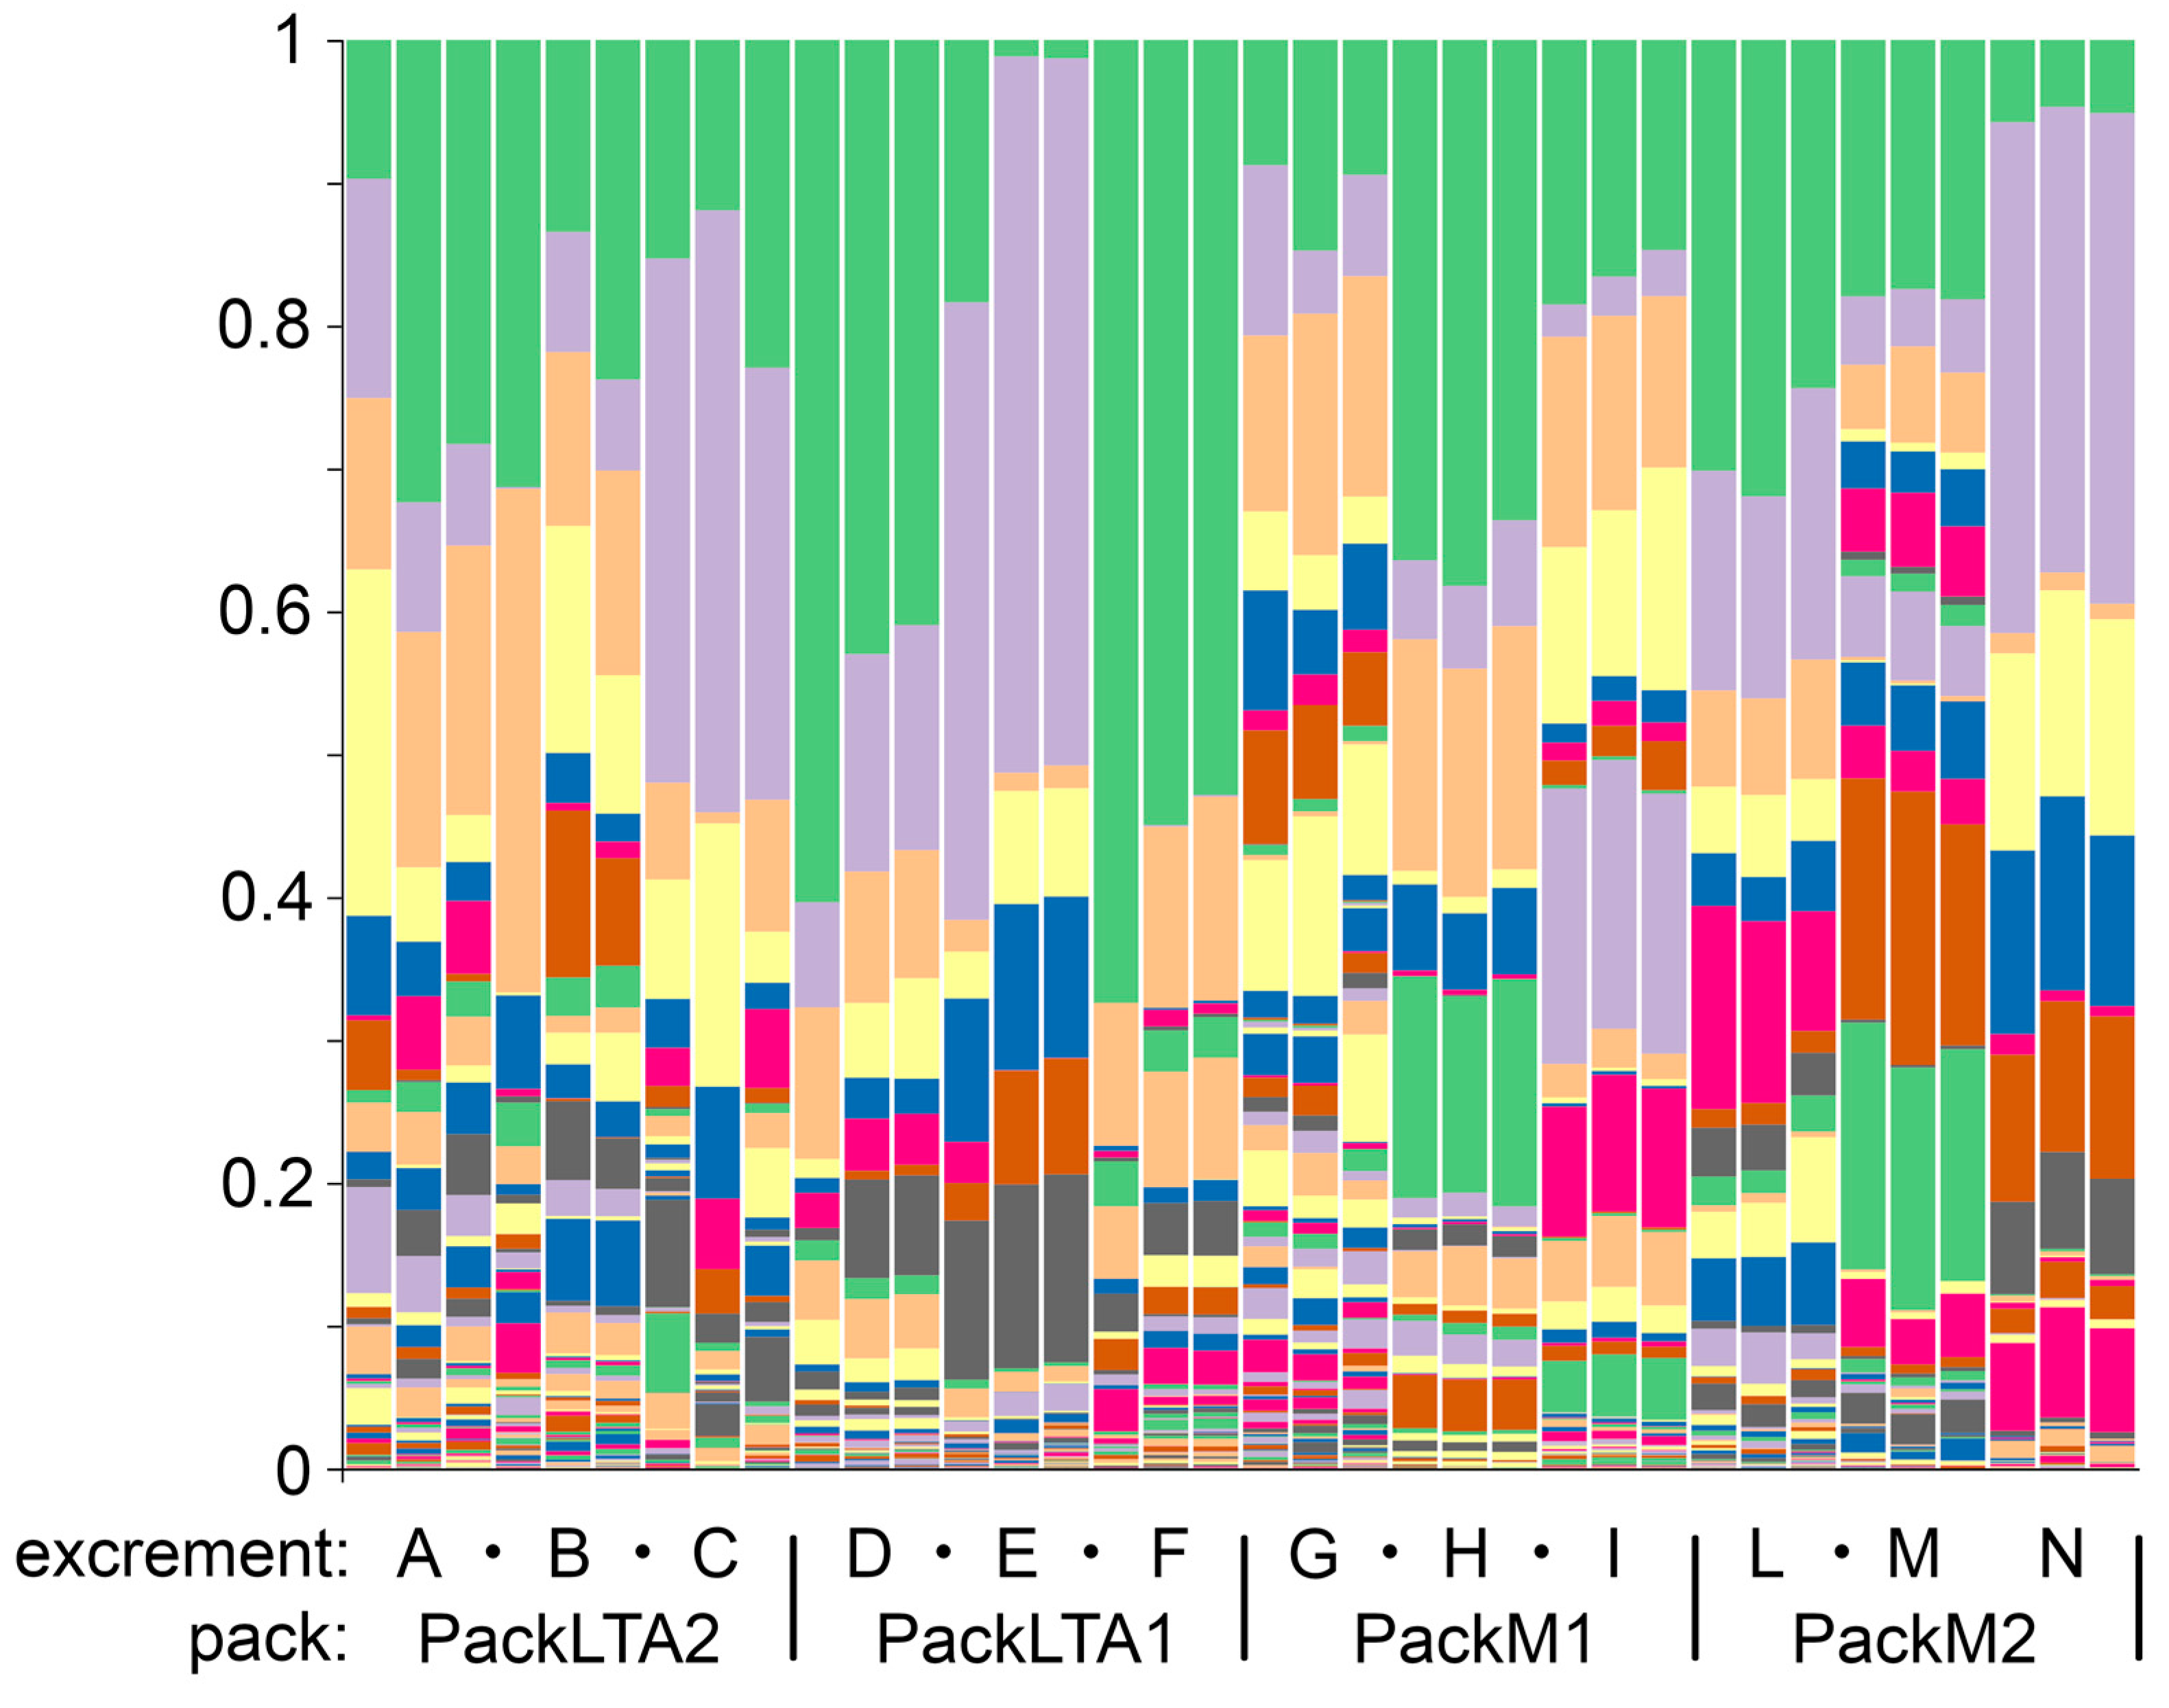
3.2. Microbial Diversity in Excrements

A total of 42,549 to 241,152 (mean 81,718) raw reads per library were obtained. Data have been submitted to the NCBI SRA archive under BioProject PRJNA769562 and SRA accessions SRR16248238 to SRR16248273. Raw data pre-processing and filtering led to the identification of 7095 to 39,513 (mean 16,856) bona fide features per sample (Table S1).
A total of 680 different bacterial OTUs were observed in the dataset. Of these, 522 (76.8%) were identified at the genus level and 30 (4.4%) at the species level. The remaining 128 (18.8%) were similarly included in the analysis, although identified as belonging to higher-ranking categories. The number of different OTUs per pack ranged between 204 (PackM2, Maremma) and 289 (PackM1, Maremma) (Table S2). Of these 680 OTUs, 43 (6.3%) were present in all packs, and 509 (74.9%) were present in one single pack (Figure 2a). Of the 25% most abundant OTUs, accounting for 97.4% of records overall, 39 (22.9%) were present in all packs, and 51 (30%) were exclusive of one single pack (Figure 2b). Of the 25% rarest OTUs, accounting for 0.1% of records, 0 (0%) were present in all packs, and 176 (99%) were present in a single pack (Figure 2c).

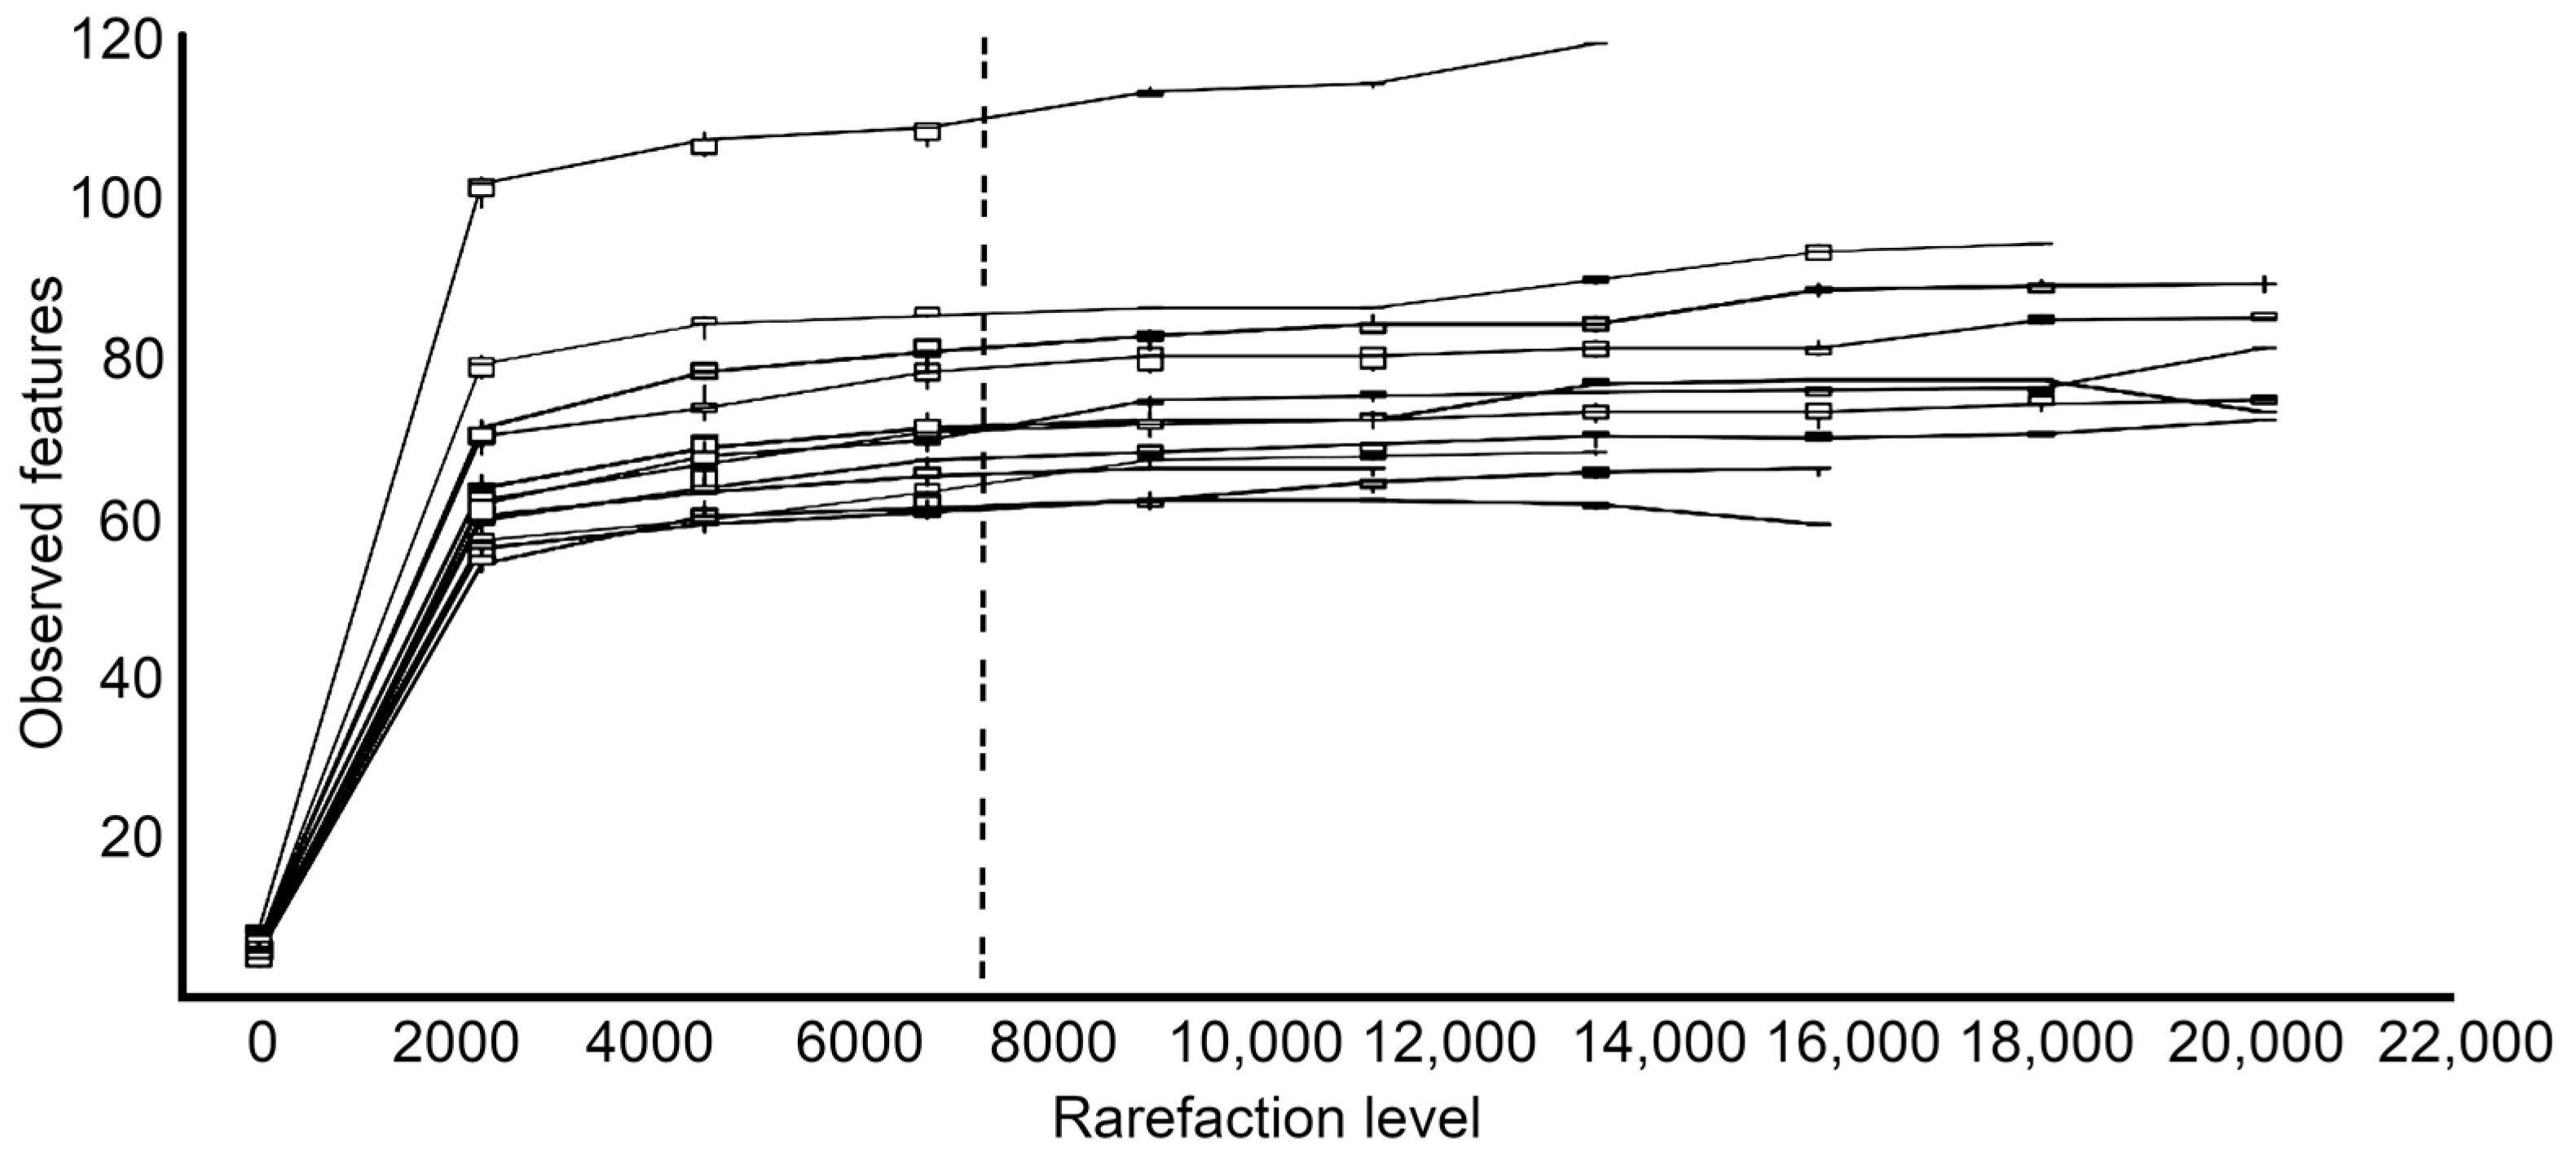
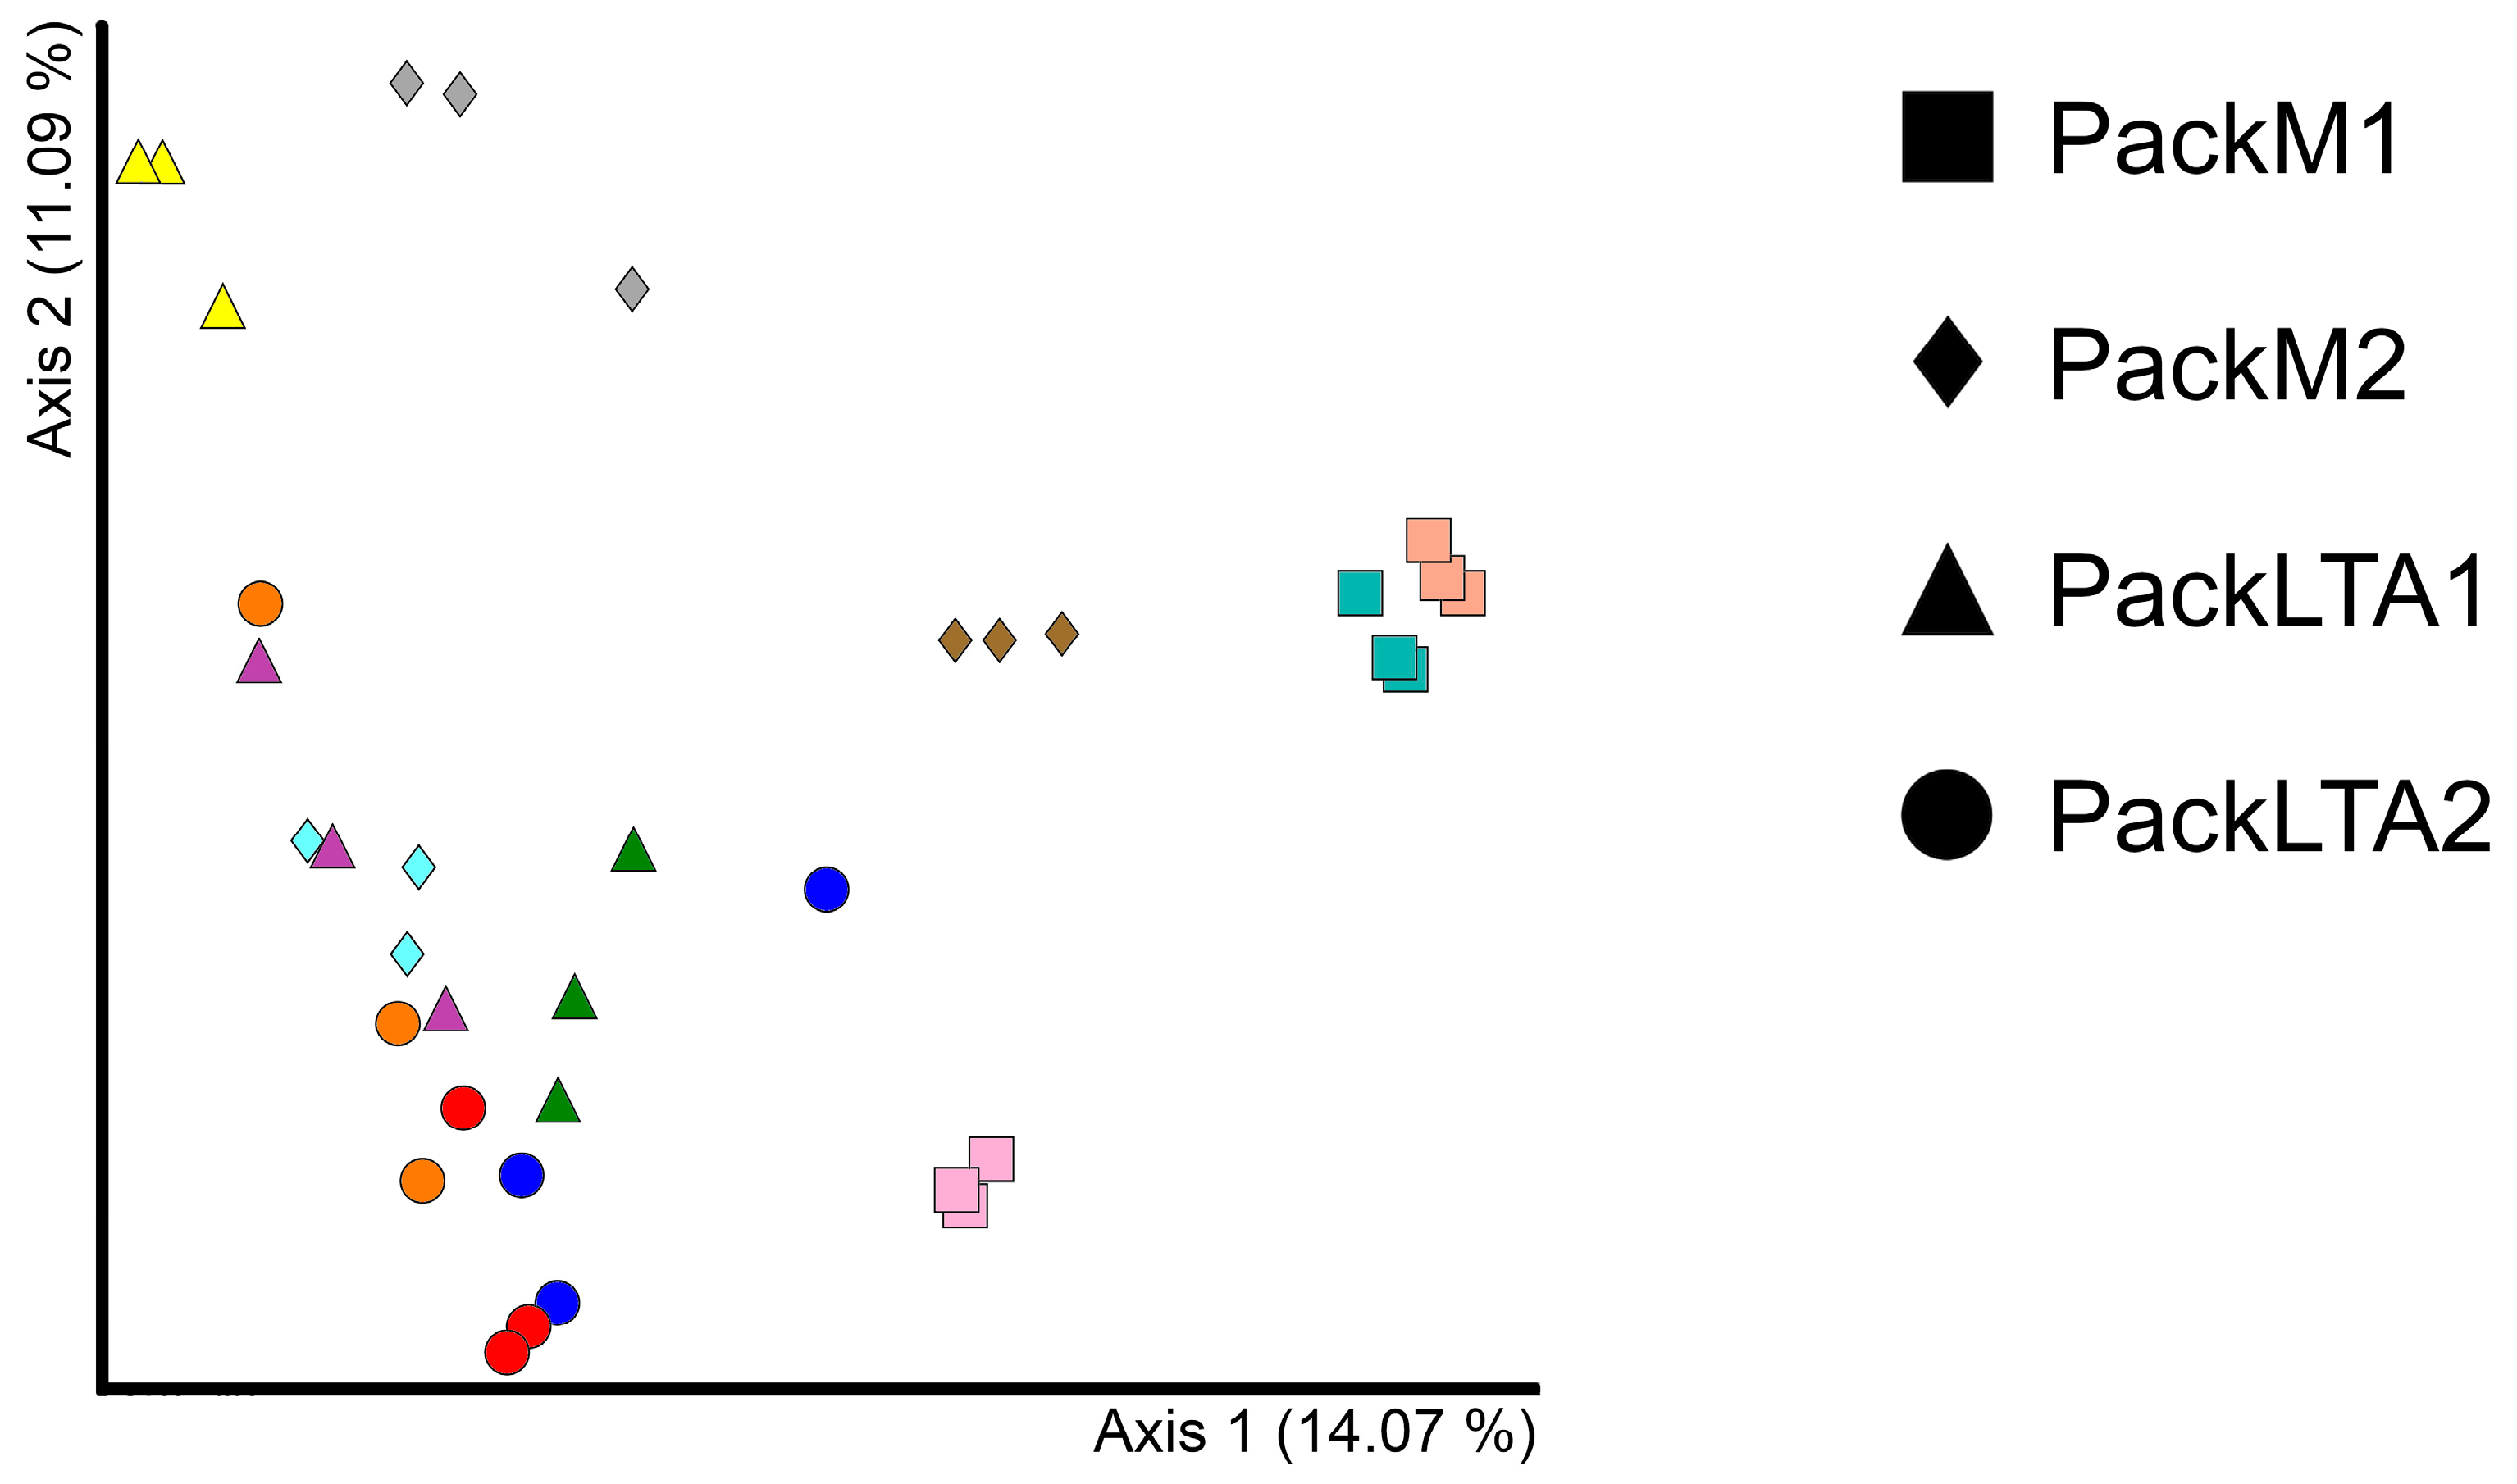
3.3. Alpha and Beta Diversity

The distribution of OTU counts (Figure 3, see Table S2 for full information) was highly skewed, with the most common three OTUs accounting for 37,975 to 143,304 counts or 45.2% of the entire dataset. Bacteria of class Clostridia, a non-natural assemblage of ubiquitous and typically saprophytic bacteria, were dominant in the dataset (60% of OTUs, 89% of counts), as well as the genus Clostridium (15% of OTUs, 27% of counts). In terms of major assemblages, Firmicutes (that includes the class Clostridia), Bacteroidetes, and Fusobacteria here represent 86% of OTUs and 98% of counts. At the level of specific OTUs, Peptoclostridium sp., Clostridium perfingens, and Paeniclostridium sp. were overall very frequent (>5% of counts overall). Although rare in the dataset, two taxa were singled out for comparative reasons (see below): one OTU belonging to the genus Succinivibrio, very rare (0.0016% of counts) and present in PackM1 only, and two different OTUs of the genus Turicibacter, also rare (0.016% and 0.0046% of counts) and present, respectively, in PackLTA1 and PackM1.
The opportunity of rarefaction was evaluated by plotting the number of observed features remaining after rarefaction to different levels (Figure 4). Rarefaction to the minimum library count (dashed line in Figure 4) was deemed feasible, as it is well after saturation curves appear to plateau.
The Kruskal Wallis test, applied to the four indices of Alpha diversity Shannon, observed OTUs, Faith and Evenness, supported significant differences in the Shannon and Evenness indices at the level of packs, with PackLTA1 being significantly impoverished and less uniform in composition compared to all others in pairwise tests. Indices Shannon observed OTUs and Faith highlighted marked inequalities at the excrement level, but pairwise tests are inconclusive given the limited number of samples (three by three) being compared.
Partitioning of variance across different levels based on the four indices of Beta diversity Jaccard, Bray-Curtis, Unifrac, and Weighted Unifrac indicated that, with limited differences across diversity indices, most of the variance (46–62%; Table 1) was observed at the excrement level and, to a lesser extent, at the levels of pack (23–28%) and replicates (11–26%; residuals).
Plotting of samples in two-dimensional space (Figure 5; based on the Jaccard index) led to the visualization of 14% and 11% of variance on the two axes. The distribution of points per replicate (Figure 5) indicated, with minor exceptions, a tight clustering of replicates. The distribution of points per pack (Figure 5) indicated some emerging differences, with PackM1 as the most separated one, PackM2 as separated except for one excrement, and a more extensive overlap between PackLTA1 and PackLTA2. In agreement with variance partitioning, visual inspection of PCoA plots suggests relevant differences among excrements and, possibly, some emerging differences among packs.

3.4. Testing for Differences at Different Levels

Technical replicates, i.e., triplets of libraries from the same excrement, are observed, in most cases, as similar bar plots in Figure 3 and tight clusters in Figure 5. The fraction of variance observed across replicates (Residuals in Table 1) ranges from 11–26% based on different indices (the most spread, Jaccard, is shown in Figure 5). The PERMANOVA analysis identified the differences observed at this level as highly significant overall (p = 0.0001). Pairwise post hoc tests resulted in corrected p-values of ~0.1, the minimum achievable given the number of samples in a permutation-based test, in 97% of comparisons.
Focusing on the two biologically relevant levels (excrement and pack), most of the variation was observed across excrements and, to a lesser extent, across packs (see above). Due to the nested nature of the dataset, testing for differences was conducted in one single analysis (resampling over replicates to study excrements, resampling over excrements to study packs) or by combining technical replicates and studying packs only. Differences among excrements in PERMANOVA are significant overall based on all indices (Table 2), and pairwise tests are significant in 58–92% of comparisons based on different indices. Differences among packs are significant overall based on the Jaccard index and non-significant based on other indices (Table 2). Pairwise tests are non-significant in strict terms. Nevertheless, most values are ~0.1, which corresponds to the theoretical maximum level of significance achievable with this number of samples in a non-parametric test. As such, we envision the possibility that this may be more an outcome of the reduced power of the test than an indication of an absence of differentiation. After combining technical replicates to eliminate nestedness, differences among packs are similarly significant based on the Jaccard index and non-significant based on other indices. Pairwise tests are non-significant (see above). Differences among excrements were not tested as replicates were combined. In summary, the two procedures produced totally overlapping results.

4. Discussion

In this study, we provided a preliminary and descriptive picture of the gut microbiota in four wolf packs living in very different environmental conditions, from the Mediterranean coast to the Alps. Although our sample size was undoubtedly small, results suggested that (i) microbiota composition was in line, in terms of variability and dominant taxa, with other accounts in wolves and consistent with a diet largely based on wild prey; (ii) the composition of the gut microbiota was similar across packs, with only minor differences emerging at this level. From a purely technical standpoint, the procedure applied appears practicable; some indications are nevertheless provided for an optimization of the experimental design (see below).
Concerning the composition of the microbiota of the wolf packs studied here, Firmicutes, Bacteroidetes, and Fusobacteria were the three most represented phyla in wolf scats from both Maremma and Alpine packs, where they built up 86% of OTUs and 98% of counts, overall. This is in line with the observation that these phyla have been described as the most widespread components of gut microbiota of wolves sampled in other continents as well (China: [11,13]; North America, Yellowstone National Park [12]). The same groups have been consistently reported as dominant also in the gut or in the skin microbiota of other canids (gut: red wolf Canis rufus [23], coyote Canis latrans [7,24], island fox Urocyon littoralis [25]; skin: coyote, red fox, grey fox Urocyon cinereoargenteus [26], domestic dog [27]). Moreover, Fusobacteria has been reported as abundant in carnivore vertebrates [3,28,29]. In ecological terms, the occurrence of these bacteria in the microbiota has been associated with diets rich in proteins in canids [7,30], where they likely play a role in the digestion of amino acids [31,32]. Accordingly, coyotes living in rural habitats and using a diet richer in ungulates and other wild herbivores showed a microbiome composition characterized by abundant Fusobacteria, opposite to those living in urban contexts and using a greater amount of anthropogenic food [7]. Moreover, the genera Succinivibrio and Turicibacter, which have been associated with areas characterized by a high anthropogenic pressure [11], have been detected with negligible frequency in our studied packs. In fact, one OTU belonging to the genus Succinivibrio was detected, though rare (0.0016% of counts), and it was present in PackM1 only. Two different OTUs of genus Turicibacter were detected but similarly rare (0.016% and 0.0046% of counts): one was present in PackLTA1, the latter in PackM1. As to other taxa, C. perfingens, typical of decaying vegetable material and the intestinal tract, was virtually ubiquitous. Thus, our results are consistent with food habits based on a carnivorous diet, largely based on wild prey (for Maremma: [15,17]). A relatively constant composition of gut microbiota across Canidae is consistent with patterns of microbiota diversity in predatory mammals, which is generally lower than it has been reported in herbivores [3]. Overall, these results are in line with the findings of studies within the Canidae family, supporting the hypothesis of a common origin resulting from shared evolutionary history or trophic ecology [3,25,33].
Consistent with the relatively low diversity of microbiota across carnivores [3], a rather homogeneous composition of gut microbiota has also been observed at the pack scale, with substantial overlap among different packs despite their geographical distance and different environment. Nevertheless, although the resolution of our analyses, as well as the limited sample size, were probably not optimal to properly assess inter-pack differences, some emerging differences appeared among the studied packs. Multiple pieces of evidence support the notion that differences among packs are mostly due to the differential presence of rare taxa. Sharing of OTUs among taxa is substantial in general, and for the numerically most represented taxa, it is absent—in fact, limited to one OTU shared by two neighboring packs—for the numerically rarest taxa, here defined as the 25% most rare. Furthermore, the only Beta diversity index capable of capturing a significant difference among packs was Jaccard. The four indices applied here convey different types of information, with Jaccard expected to be the most influenced by low-abundance OTUs.
The composition of gut microbiota of PackLTA1 (Tonale, Alps) was relatively more homogenous than those observed in the other packs, and that of PackM1 (Ombrone, Maremma) emerged as the most distant from other packs. In a gregarious carnivore such as the wolf [14], the social environment is expected to play a major role also in shaping microbiota composition [12]. Pack members share their prey and are usually involved in frequent intraspecific interactions, which are expected to lead to a significant sharing of microbes, thus homogenizing microbiome composition within packs. In Yellowstone National Park, a study on a largely investigated and pedigreed population of wolves has reported that sampling pack and genetic relatedness between individuals were associated with a major sharing of microbiota composition [12], and sampling pack was the factor explaining the greatest portion of variance within gut microbial communities [12].
Diet composition and season are significant determinants of microbiota [7,34]. Prey communities were different between Alpine and Maremma packs, with roe deer being the only large prey common to the two areas and wild boar being abundant in Maremma [35] and only occasionally in the territories of the two study packs in the Alps. Conversely, mountain ungulates such as Alpine chamois and ibex, red deer as well as mountain rodents such as marmots are abundant in our Alpine study areas. All these species do not occur in Maremma, where fallow deer and coypu are important prey to wolves [15,17]. The Tonale area in Stelvio National Park is characterized by an ungulate community dominated by red deer, which would agree with the relatively more homogeneous composition of microbiota in this pack than in the others, although relationships between local diet and microbiota diversity require appropriate investigation. Also, considering the potential role of genetic relatedness and diet in influencing microbiota, studies based on larger samples would be needed to evaluate the relative role of pack membership and connectivity among packs, as well as diet composition, in the spatial and temporal variation of microbiota composition [12].
Aiming at an a posteriori evaluation of the experimental design, two indications will be of use in the planning of future studies. The observation that technical replicates (i.e., multiple fragments from one and the same scat) always result in tight clusters suggests that, in order to balance informativeness and costs/workload, one single fragment may be taken from each scat and the number of excrements, to be treated as replicates within a pack, increased. Furthermore, given the constraints imposed by nestedness to PERMANOVA resampling, the experimental design should be simplified to one single level, i.e., packs, unless the number of samples can be largely increased. This, together with an increase in the number of fecal samples per pack, as well as the possibility of treating all excrements at par, is likely to significantly increase the statistical power in differentiating packs that, in full evidence, are the most biologically relevant level of observation.

Supplementary Materials

The following supporting information can be downloaded at: www.mdpi.com/article/10.3390/d15010037/s1, Table S1: Reads passing different filters (number and percentage). Numbers represent read pairs. The last column reports the number of bona fide sequences that were analyzed in the following steps.; Table S2: Bacterial OTUs observed in samples, vertically ordered from the most common to the rarest. Columns D_0 to D_6 provide taxonomic identification at different levels. Columns Total to PackM2 report count numbers per OTUS as total and in different locations. Columns PackLTA2_A1 to PackM2_N3 report count number per OTU in different replicates.

Author Contributions

Conceptualization, F.N., A.C. and F.F. (Francesco Ferretti); Formal analysis, F.N., N.I. and C.C.; Funding acquisition, F.N., F.F. (Francesco Frati), A.C. and F.F. (Francesco Ferretti); Investigation, L.L., N.I., V.D., C.C. and I.B.; Supervision, F.F. (Francesco Ferretti); Writing—original draft, F.N., L.L., V.D. and F.F. (Francesco Ferretti); Writing—review & editing, F.N., L.L., N.I., V.D., C.C., I.B., F.F. (Francesco Frati), A.C. and F.F. (Francesco Ferretti). All authors have read and agreed to the published version of the manuscript.

Funding

This research was funded by the University of Siena under the PAR program.

Institutional Review Board Statement

Not applicable.

Informed Consent Statement

Not applicable.

Data Availability Statement

Raw data have been submitted to the NCBI SRA archive under BioProject PRJNA769562 and SRA accessions SRR16248238 to SRR16248273. Processed data are available in Table S2.

Acknowledgments

We are grateful to L. Pedrotti and L. Corlatti (ERSAF—Stelvio National Park) and to the Provincia Autonoma di Trento for providing samples from the Alpine areas to the Maremma Regional Park Agency for allowing data collection in the Maremma Regional Park and to Magnoni for insights on the statistical analysis.

Conflicts of Interest

The authors declare no conflict of interest.

References

  1. Hooper, L.V.; Wong, M.H.; Thelin, A.; Hansson, L.; Falk, P.G.; Gordon, J.I. Molecular analysis of commensal host–microbial relationships in the intestine. Science 2001, 291, 881–884. [Google Scholar] [CrossRef] [PubMed] [Green Version]
  2. Barko, P.C.; McMichael, M.A.; Swanson, K.S.; Williams, D.A. The Gastrointestinal Microbiome: A Review. J. Vet. Intern. Med. 2018, 32, 9–25. [Google Scholar] [CrossRef] [PubMed] [Green Version]
  3. Nishida, A.H.; Ochman, H. Rates of gut microbiome divergence in mammals. Mol. Ecol. 2018, 27, 1884–1897. [Google Scholar] [CrossRef]
  4. Menke, S.; Meier, M.; Sommer, S. Shifts in the gut microbiome observed in wildlife faecal samples exposed to natural weather conditions: Lessons from time-series analyses using next-generation sequencing for application in field studies. Methods Ecol. Evol. 2015, 6, 1080–1087. [Google Scholar] [CrossRef]
  5. Kartzinel, T.R.; Hsing, J.C.; Musili, P.M.; Brown, B.R.; Pringle, R.M. Covariation of diet and gut microbiome in African megafauna. Proc. Natl. Acad. Sci. USA 2019, 116, 23588–23593. [Google Scholar] [CrossRef] [Green Version]
  6. Pannoni, S.B.; Proffitt, K.M.; Holben, W.E. Non-invasive monitoring of multiple wildlife health factors by fecal microbiome analysis. Ecol. Evol. 2022, 12, e8564. [Google Scholar] [CrossRef]
  7. Sugden, S.; St Clair, C.C.; Stein, L.Y. Individual and site-specific variation in a biogeographical profile of the coyote gastrointestinal microbiota. Microb. Ecol. 2020, 81, 240–252. [Google Scholar] [CrossRef]
  8. Bird, S.; Prewer, E.; Kutz, S.; Leclerc, L.-M.; Vilaça, S.T.; Kyle, C.J. Geography, seasonality, and host-associated population structure influence the fecal microbiome of a genetically depauparate Arctic mammal. Ecol. Evol. 2019, 9, 13202–13217. [Google Scholar] [CrossRef] [Green Version]
  9. Zhu, Z.; Sun, Y.; Zhu, F.; Liu, Z.; Pan, R.; Teng, L.; Guo, S. Seasonal Variation and Sexual Dimorphism of the Microbiota in Wild Blue Sheep (Pseudois nayaur). Front. Microbiol. 2020, 11, 1260. [Google Scholar] [CrossRef]
  10. Boitani, L.; Phillips, M.; Jhala, Y. Canis lupus. The IUCN Red List of Threatened Species; IUCN: Gland, Switzerland, 2018; p. e.T3746A119623865. [Google Scholar] [CrossRef]
  11. Wu, X.; Zhang, H.; Chen, J.; Shang, S.; Yan, J.; Chen, Y.; Tang, X.; Zhang, H. Analysis and comparison of the wolf microbiome under different environmental factors using three different data of Next Generation Sequencing. Sci. Rep. 2017, 7, 11332. [Google Scholar] [CrossRef] [Green Version]
  12. DeCandia, A.L.; Cassidy, K.A.; Stahler, D.R.; Stahler, E.A.; VonHoldt, B.M. Social environment and genetics underlie body site specific microbiomes of Yellowstone National Park gray wolves (Canis lupus). Ecol. Evol. 2021, 11, 9472–9488. [Google Scholar] [CrossRef] [PubMed]
  13. Zhang, H.; Chen, L. Phylogenetic analysis of 16S rRNA gene sequences reveals distal gut bacterial diversity in wild wolves (Canis lupus). Mol. Biol. Rep. 2010, 37, 4013–4022. [Google Scholar] [CrossRef] [PubMed]
  14. Mech, L.D.; Boitani, L. Wolf social ecology. In Wolves: Behavior, Ecology, and Conservation; Mech, L.D., Boitani, L., Eds.; University of Chicago Press: Chicago, IL, USA, 2003. [Google Scholar]
  15. Ferretti, F.; Lovari, S.; Mancino, V.; Burrini, L.; Rossa, M. Food habits of wolves and selection of wild ungulates in a prey-rich Mediterranean coastal area. Mamm. Biol. 2019, 99, 119–127. [Google Scholar] [CrossRef]
  16. Kruuk, H.; Parish, T. Feeding specialization of the European badger Meles meles in Scotland. J. Anim. Ecol. 1981, 50, 773–788. [Google Scholar] [CrossRef]
  17. Ferretti, F.; Pacini, G.; Belardi, I.; Ten Cate, B.; Sensi, M.; Oliveira, R.; Rossa, M.; Burrini, L.; Lovari, S. Recolonizing wolves and opportunistic foxes: Interference or facilitation? Biol. J. Linn. Soc. 2021, 132, 196–210. [Google Scholar] [CrossRef]
  18. Caporaso, J.G.; Lauber, C.L.; Walters, W.A.; Berg-Lyons, D.; Lozupone, C.A.; Turnbaugh, P.J.; Fierer, N.; Knight, R. Global patterns of 16S rRNA diversity at a depth of millions of sequences per sample. Proc. Natl. Acad. Sci. USA 2011, 15, 4516–4522. [Google Scholar] [CrossRef] [Green Version]
  19. Bolyen, E.; Rideout, J.R.; Dillon, M.R.; Bokulich, N.A.; Abnet, C.C.; Al-Ghalith, G.A.; Alexander, H.; Alm, E.J.; Arumugam, M.; Asnicar, F.; et al. Reproducible, interactive, scalable and extensible microbiome data science using QIIME 2. Nat. Biotechnol. 2019, 37, 852–857. [Google Scholar] [CrossRef]
  20. Yilmaz, P.; Parfrey, L.W.; Yarza, P.; Gerken, J.; Pruesse, E.; Quast, C.; Schweer, T.; Peplies, J.; Ludwig, W.; Glöckner, F.O. The SILVA and “All-species Living Tree Project (LTP)” taxonomic frameworks. Nucleic Acids Res. 2014, 42, D643–D648. [Google Scholar] [CrossRef] [Green Version]
  21. Chen, H.; Boutros, P.C. VennDiagram: A package for the generation of highly-customizable Venn and Euler diagrams in R. BMC Bioinform. 2011, 12, 35. [Google Scholar] [CrossRef]
  22. Anderson, M.J.; Gorley, R.N.; Clarke, K.R. PERMANOVA + for PRIMER: Guide to Software and Statistical Methods; PRIMER-E: Auckland, New Zealand, 2008. [Google Scholar]
  23. Bragg, M.; Freeman, E.W.; Lim, H.C.; Songsasen, N.; Muletz-Wolz, C.R. Gut microbiomes differ among dietary types and stool consistency in the captive red wolf (Canis rufus). Front. Microbiol. 2020, 11, 590212. [Google Scholar] [CrossRef]
  24. Colborn, A.S.; Kuntze, C.C.; Gadsden, G.I.; Harris, N.C. Spatial variation in diet–microbe associations across populations of a generalist North American carnivore. J. Anim. Ecol. 2020, 89, 1952–1960. [Google Scholar] [CrossRef] [PubMed]
  25. DeCandia, A.L.; Brenner, L.J.; King, J.L.; vonHoldt, B.M. Ear mite infection is associated with altered microbial communities in genetically depauperate Santa Catalina Island foxes (Urocyon littoralis catalinae). Mol. Ecol. 2020, 29, 1463–1475. [Google Scholar] [CrossRef] [PubMed]
  26. DeCandia, A.L.; Leverett, K.N.; Vonholdt, B.M. Of microbes and mange: Consistent changes in the skin microbiome of three canid species infected with Sarcoptes scabiei mites. Parasit. Vectors 2019, 12, 488. [Google Scholar] [CrossRef] [PubMed]
  27. Rodrigues Hoffmann, A.; Patterson, A.P.; Diesel, A.; Lawhon, S.D.; Ly, H.J.; Elkins Stephenson, C.; Masnell, J.; Steiner, J.M.; Dowd, S.E.; Olivry, T.; et al. The Skin Microbiome in Healthy and Allergic Dogs. PLoS ONE 2014, 9, e83197. [Google Scholar] [CrossRef] [PubMed] [Green Version]
  28. Nelson, T.M.; Rogers, T.L.; Brown, M.V. The gut bacterial community of mammals from marine and terrestrial habitats. PLoS ONE 2013, 8, e83655. [Google Scholar] [CrossRef]
  29. Roggenbuck, M.; Schnell, I.B.; Blom, N.; Bælum, J.; Bertelsen, M.F.; Sicheritz-Ponten, T.; Hansen, L.H. The microbiome of New World vultures. Nat. Commun. 2014, 5, 5498. [Google Scholar] [CrossRef] [Green Version]
  30. Bermingham, E.N.; Maclean, P.; Thomas, D.G.; Cave, N.J.; Young, W. Key bacterial families (Clostridiaceae, Erysipelotrichaceae and Bacteroidaceae) are related to the digestion of protein and energy in dogs. PeerJ 2017, 5, e3019. [Google Scholar] [CrossRef] [Green Version]
  31. Pilla, R.; Suchodolski, J.S. The role of the canine gut microbiome and metabolome in health and gastrointestinal disease. Front. Vet. Sci. 2020, 6, 498. [Google Scholar] [CrossRef] [Green Version]
  32. Vázquez-Baeza, Y.; Hyde, E.R.; Suchodolski, J.S.; Knight, R. Dog and human inflammatory bowel disease rely on overlapping yet distinct dysbiosis networks. Nat. Microbiol. 2016, 1, 16177. [Google Scholar] [CrossRef]
  33. Ross, A.A.; Müller, K.M.; Scott Weese, J.; Neufeld, J.D. Comprehensive skin microbiome analysis reveals the uniqueness of human skin and evidence for phylosymbiosis within the class Mammalia. Proc. Natl. Acad. Sci. USA 2018, 115, E5786–E5795. [Google Scholar] [CrossRef] [Green Version]
  34. Vital, M.; Gao, J.; Rizzo, M.; Harrison, T.; Tiedje, J.M. Diet is a major factor governing the fecal butyrate-producing community structure across Mammalia, Aves and Reptilia. ISME J. 2015, 9, 832–843. [Google Scholar] [CrossRef] [PubMed] [Green Version]
  35. Fattorini, N.; Ferretti, F. Estimating wild boar density and rooting activity in a Mediterranean protected area. Mamm. Biol. 2020, 100, 241–251. [Google Scholar] [CrossRef]
Figure 1. Study areas.
Diversity 15 00037 g001
Figure 2. Sharing of OTUs across packs. (a) full data. (b) 25% most abundant OTUs. (c) 25% rarest OTUs.
Diversity 15 00037 g002
Figure 3. Bird’s eye view of taxa distribution, at the species level, across samples. Each bar represents a replicate, and levels of excrement and pack are indicated. See Table S2 for full information.
Diversity 15 00037 g003
Figure 4. Features per sample as a function of the rarefaction level. The dotted line indicates the rarefaction level employed (7095).
Diversity 15 00037 g004
Figure 5. PCoA based on the Jaccard dissimilarity index. Replicates from the same excrement appear in the same color.
Diversity 15 00037 g005
Table 1. Partitioning of variance across levels quantified as R2 values.
JaccardBray-CurtisUnifracWeighted Unifrac
Pack0.2750.2660.2290.273
Excrement0.4640.6240.5350.608
Residuals0.2610.1100.2360.119
Table 2. PERMANOVA testing for differences among excrements and packs.
JaccardBray-CurtisUnifracWeighted Unifrac
PRIMER/PERMANOVA+
test statistic (packs)1.57731.13581.14221.1975
p (packs)0.0346 *0.36150.33270.3247
post hoc pairwise tests p (packs)LTA2–LTA1: 0.144
LTA2–M1: 0.113
LTA2–M2: 0.227
LTA1–M1: 0.103
LTA1–M2: 0.266
M1–M2: 0.217
N/A **N/A **N/A **
test statistic (excrements)5.334417.0396.820715.281
p (excrements)0.0001 *0.0001 *0.0001 *0.0001 *
post hoc pairwise tests p (excrements)all significant
(p < 0.05)
except two
pairs in PackLTA2
all significant
(p < 0.05)
except one
pair in PackLTA2
all significant
(p < 0.05)
except one pair
in PackLTA2,
one pair in PackLTA1 and all pairs in PackM2
all significant
(p < 0.05)
except one pair in PackLTA2
qiime diversity beta-group-significance (combining technical replicates)
test statistic1.3661.2001.4061.239
p (packs)0.0011 *0.24810.14060.2701
post hoc pairwise tests p (packs)LTA2–LTA1: 0.105
LTA2–M1: 0.101
LTA2–M2: 0.097
LTA1–M1: 0.099
LTA1–M2: 0.266
M1–M2: 0.217
N/A **N/A **N/A **
* Significant differences. ** Pairwise post hoc tests were not performed due to the absence of a significant difference overall at this level.
Disclaimer/Publisher’s Note: The statements, opinions and data contained in all publications are solely those of the individual author(s) and contributor(s) and not of MDPI and/or the editor(s). MDPI and/or the editor(s) disclaim responsibility for any injury to people or property resulting from any ideas, methods, instructions or products referred to in the content.

