Article

The Role of the Environment in Shaping the Genomic Variation in an Insular Wild Boar Population

1
Department of Veterinary Medicine, University of Sassari, 07100 Sassari, Italy
2
Faculty of Mathematics, Natural Sciences and Information Technologies, University of Primorska, 6000 Koper, Slovenia
3
Department of Chemistry and Bioscience, Aalborg University, 9220 Aalborg, Denmark
*
Author to whom correspondence should be addressed.
Diversity 2022, 14(9), 774; https://doi.org/10.3390/d14090774
Submission received: 22 August 2022 / Revised: 11 September 2022 / Accepted: 13 September 2022 / Published: 19 September 2022
(This article belongs to the Collection Genetic Diversity)

Abstract

:
The Sardinian population of wild boar (WB, Sus scrofa meridionalis) has evolved on this Mediterranean island since its arrival in Neolithic age. Climate and land use vary across the island; high temperatures and dryness represent limiting factors for the development and reproduction of the species. Hence, the environment can have contributed to create the morphological differences we observe today across the island and could sustain the genetic structure that has been previously observed using neutral molecular markers. We therefore searched for genomic signatures of local adaptation in a sample of Sardinian WB genotyped at almost 50 K single nucleotide polymorphisms (SNPs). Genetic structure was observed in the population separating the northwest and southwest from the east of the island, where internal substructure also emerged. We identified 49 SNPs as candidate loci involved in adaptation and 61 genes. Gene ontology enrichment analysis revealed over-representation of terms related to cell localization, motility, and adhesion, but also related to anatomical development and immunity. According to our results, the environment seems to have played a role in shaping the genetic differentiation of the Sardinian wild boar in a limited evolutionary timescale.

1. Introduction

The environment can influence the genetic variation of a population through natural selection, a process that can lead to adaptation to local conditions [1,2,3]. The observable effect is genetically structured metapopulations [4,5,6], which can be sustained by patterns of gene flow between similar environments, a phenomenon called isolation by environment [7,8]. However, neutral demographic processes like bottlenecks, genetic drift, or isolation by distance (IBD) can create similar patterns of differentiation, hence the necessity to accurately characterize neutral population structure [9,10]. Although the general assumption is that demographic events affect the entire genome, whereas selection targets only the advantageous allele—and its surroundings—because of physical linkage [11,12], this is not always the case [13]. Several statistical approaches have been developed and implemented in a number of software programs to detect patterns of local adaptation [14,15,16,17,18].
The preferred genetic markers to study local adaptation are single nucleotide polymorphisms (SNPs) because they are abundant and widespread across the genome, and can directly influence the sequence or the expression level of a protein [19,20]. Compared to short tandem repeats (STR), SNPs depict more ancient events because of their lower mutation rate [21,22], so the two markers may give different results in terms of population structure because of the different timescales they represent [23,24].
The Sardinian wild boar (WB) (Sus scrofa meridionalis, Major 1883) has probably reached the island of Sardinia as a primordial domestic form together with the first human settlers in the early Neolithic and then escaped and became feral [25]. It has evolved ever since on this Mediterranean island, with occasional introductions of European WB to restock the population for hunting purposes and with the possibility to hybridize with the domestic pigs that were bred in semi-natural husbandry regime until the ban of 2012 [26]. Despite this occasional gene flow, the Sardinian population has diverged from mainland populations both morphologically, developing some typical features like a small body size and different skull/teeth shape [25,27], and genetically [28,29,30].
Previous studies on STRs have identified population structure in a wide sample of Sardinian WB, with the strongest signal separating the east from the northwest and the southwest when using 10 STRs [31] and further differentiation within the northwestern and eastern clusters when using 16 STRs [32]. Likewise, the climate on the island is characterized by geographic variation in the precipitation regime and extreme temperatures reached in the coldest and hottest months of the year [33,34]; water scarcity can limit food availability and extreme heat could indirectly influence piglet growth and survival [35]. Land use is also diversified, providing different levels of resource availability that influences species abundance [36]. The role of the environment in shaping the genetic diversity of the Sardinian WB as opposed to simple isolation due to distance or landscape resistance is not known. Despite the high plasticity that characterizes the WB (e.g., [37,38,39]), it is possible that local adaptation could explain a portion of the differentiation we observe today. This is especially true considering that it was shown that climatic variables can influence population distribution and dynamics, both directly and indirectly through resource availability [40,41,42]. Moreover, the timing of reproduction can also be influenced by climatic variables [38] producing different survival patterns of piglets.
In this study, we characterize the population structure in the Sardinian WB with a panel of thousands of SNPs distributed across the genome, and then test the hypothesis that the environment has affected the detected genetic differentiation. We expect to confirm the coarse pattern of population structure previously highlighted by STRs, and, concurrently, to highlight a moderate but significant contribution of environmental variables to the observed genetic structure. Eventually, we search for genomic regions that might be involved in local adaptation and explore the possible functions of the genes that map within them.

2. Materials and Methods
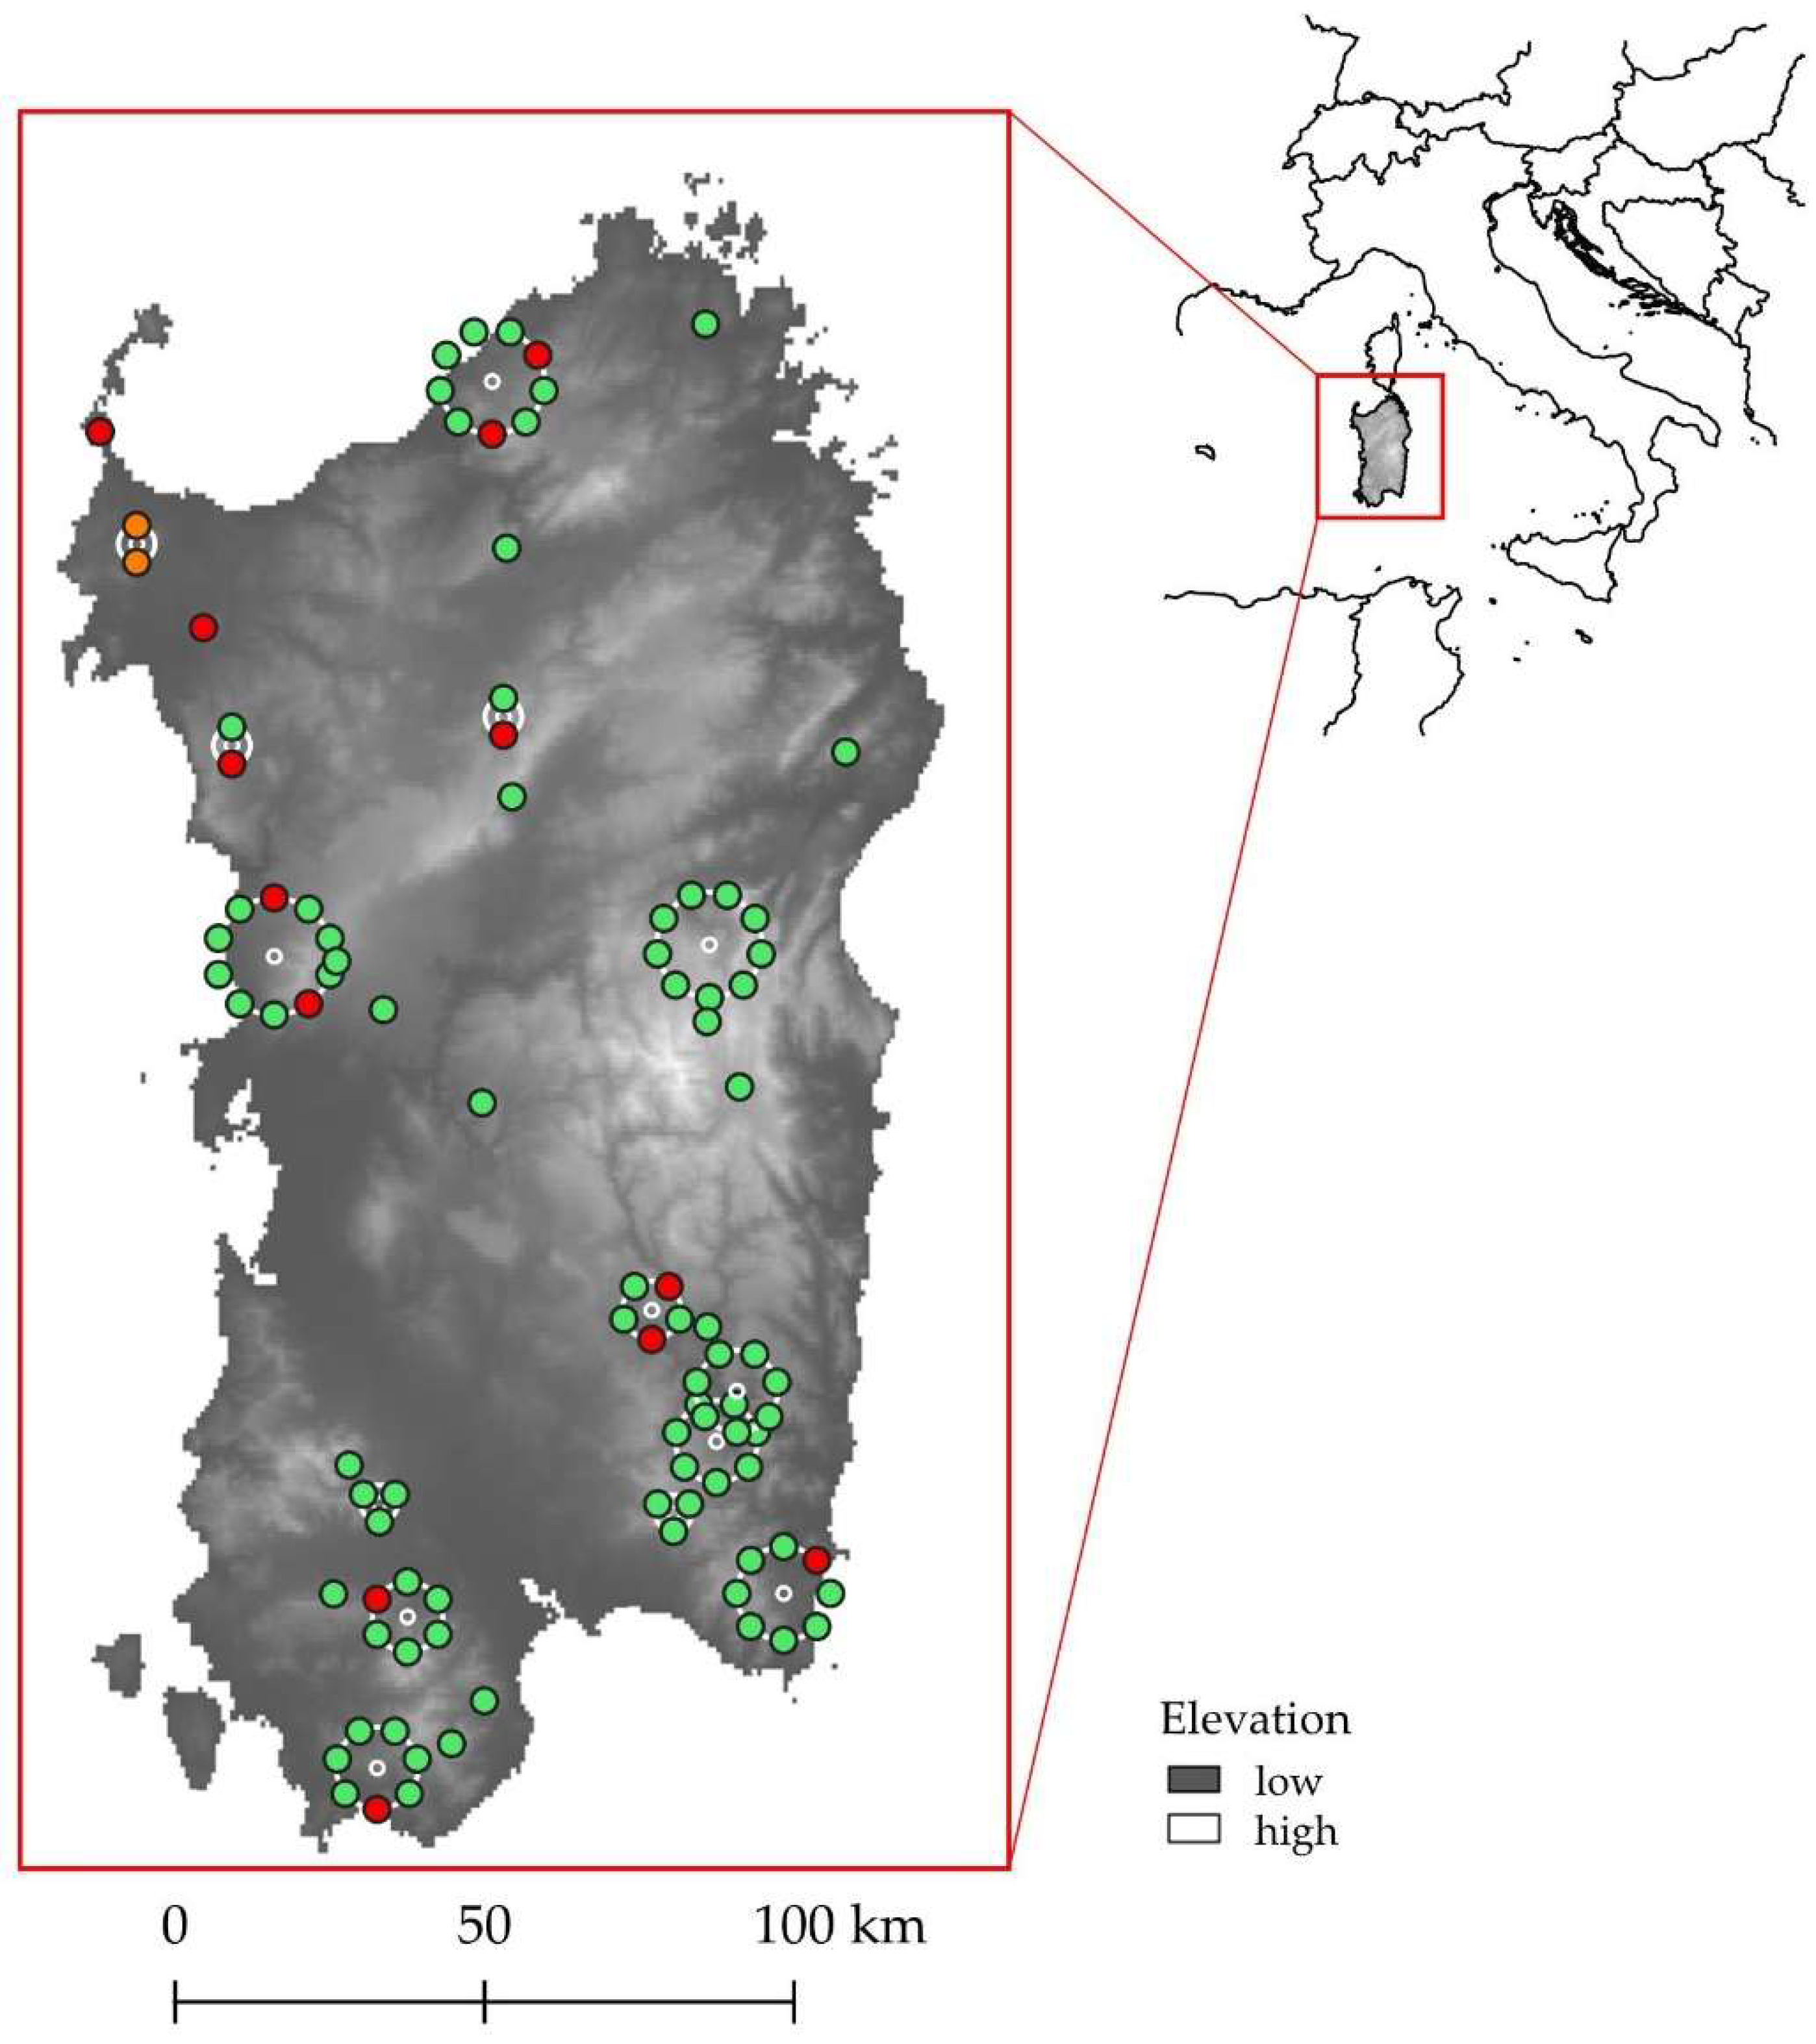
2.1. Study Area

The study was conducted in the island of Sardinia, Italy, located at the center of the western Mediterranean basin (between 38°51′ N to 41°15′ N and 8°80′ E to 9°50′ E) and extending for around 24,000 km2. It is predominantly hilly and mountainous, with the main massifs represented by the Gennargentu, in the central–eastern side (maximum elevation 1834 m a.s.l.) and the chain of Marghine and Goceano, crossing the island along a SW-NE direction in the northern part of the island. The main lowlands are the Campidano plain in the southwest and the Nurra in the northwest. Rivers have mostly the features of streams during the hot season. Other sources of water are constituted by a single small natural lake (0.6 km2), some tens of artificial basins (the largest of which is 29 km2), and ponds and lagoons along the coast. Two macrobioclimates occur in the island: Mediterranean pluviseasonal oceanic (99% of the island) and Temperate oceanic (1%) [34]. The former occurs in the form of thermomediterranean dry, prevailing in the southwest and along the coasts, and mesomediterranean dry or subhumid, typical of inner lowlands, hilly areas and low-elevation mountains (especially in the north, center and east of the island). Only the highest mountains in central-eastern Sardinia show a Temperate oceanic bioclimate. Precipitations mostly fall during autumn and winter with higher frequency on the northern and the eastern sides of the island. Annual precipitations range on average between 400 and more than 1200 mm, with snowfalls occurring only in winter on the highest mountainous massifs. Mean temperatures range between 8 °C in January and 25 °C in August, with less variation on a daily and seasonal basis along the coasts (https://sardegna-clima.it/climatologia/temperature (accessed on 16 August 2022)). During its history since human colonization, the landscape of the island has been transformed from one dominated by closed primary forests to a mosaic of agro-silvopastoral patches [43]. During the last 50 years, socio-economic transformations have led to an increase in forest cover, associated with a strong decrease of open semi-natural areas [44]. Nowadays, these areas cover about half of the territory, whilst in inner hilly areas and highlands maquis and woodlands (mainly Quercus ilex, Q. suber and Q. pubescens), combined with pastures for livestock, are prevalent.

2.2. Dataset Selection and Quality Control

The initial dataset consisted of ninety-six Sardinian WB genotyped on the Illumina SNP60 Porcine Beadchip v2 [45] already used for the assessment of genomic variation of the Sardinian wild boar [28] (Dryad data repository: doi:10.5061/dryad.8bf48). The geographic location of each individual was assumed to be the centroid of the hunting area or a random point in the suitable area of the municipality where it was hunted (Figure 1).
Since relatives inflate the analysis, while hybridization and rare variants (i.e., low minor allele frequency, MAF) can introduce bias, we used PLINK 1.9 [46] to retain samples with no more than 5% missing data and Identity By Descent (IBD) < 0.5; hybrids detected in [28] were excluded. We filtered out SNPs with a call rate < 0.95, Minor Allele Frequency (MAF) < 0.01, and we pruned for linkage disequilibrium (LD) where r2 > 0.2.

2.3. Population Structure Analysis

Two different approaches were used to evaluate the population structure in the data: the principal component analysis (PCA) as an unsupervised method [47], and an ancestry analysis with the program ADMIXTURE v.1.2.3 as a model–based method [48]. PCA was performed with the R package adegenet v.2.1.3 [49]. We inspected the distribution of samples along the principal components and tested axes significance with the Tracy–Widom test using the ‘tracy.widom’ function in the R package LEA v.3.0.0 [50]. ADMIXTURE was run for K from 1 to 10 and the best K was determined by the lowest cross-validation error.
Two samples from the northwest (Nurra region) deviated from an otherwise uniform grouping corresponding to the northwestern part of Sardinia according to both PCA and ADMIXTURE analyses. Hence, we decided to remove them from the dataset for the search for local adaptation.

2.4. Search for Local Adaptation

As the two landscape genomic analyses that we used do not accept missing data, we used the procedure implemented in the package LEA to impute the residual missing alleles (on average seventeen SNPs per sample), using a function that applies a sparse nonnegative matrix factorization (snmf). We used the resulting dataset for the outlier analysis and the two landscape genomics approaches.

2.4.1. Outlier Analysis

Pcadapt R package v.4.3.3 [14] was used to apply an outlier detection method to identify putative SNPs under diversifying selection. It corrects for population structure by selecting the number of PCs that best summarize the structure in the genetic dataset.
We focused on the first four PCs according to the result of snmf, as we obtained that K = 4 was the best clustering solution on the basis of the cross-entropy value when imputing the missing data (see Results). We ran the function ‘pcadapt’ that uses the robust Mahalanobis distance to regress each SNP on each PC and computes the Z scores that are then converted into p-values. After applying the Benjamini–Hockberg (BH) correction with the RBase function ‘p.adjust’, we considered outliers the SNPs with adjusted p-value < 0.05.

2.4.2. Environmental Data Retrieval and Elaboration

We characterized the environment at sampling sites by relying on the Bioclimatic variables available from Worldclim2 [51] at fine scale resolution of 30 s. We downloaded climatic variables meaningful to the wild boar biology [35,36,40,41,42]: Bio4, Bio5, Bio9, Bio10, Bio12, Bio15, Bio16, Bio17, Bio18 (see Table 1 for details). We also included elevation data interpolated from the Shuttle Radar Topography Mission (SRTM) and downloaded from the same database. In order to describe the environment around the samples in our dataset, we calculated for each bioclimatic variable the mean value in a 1-km radius circular area around each sampling location in ArcGIS 10.2.2. This value was chosen because it approximates the estimated home range of wild boars in Sardinia according to radiotelemetry [52]. The climatic data were normalized [53].
We further considered the environmental characteristics of the island by means of the land use data obtained by photointerpretation of different image sources (update 2008, scale 1:25,000; www.sardegnageoportale.it). We merged the land use categories into seven classes: urban and industrial areas, cultivated areas, broadleaved forests, coniferous forests, shrublands, areas with rare or absent vegetation, and finally humid areas and water bodies. We thus computed the relative proportion of each land use class within the 1-km radius circular area around each sample. We decided to further elaborate these data and calculate the Shannon Index to account for the diversity of available resources, as it seems to play a role for the wild boar [35]. We used the function ‘diversity’ from the R package vegan v.2.5-7 [54] to obtain the index within every area.
Finally, we checked for correlation in the environmental data because multicollinearity violates one of the assumptions of the multidimensional statistical test applied in the landscape genomic approach. We first used the R package psych v.2.1.6 [55] to compute Pearson’s correlation coefficient between the nine bioclimatic variables, elevation, and the Shannon Index. Since the pairwise correlations were high in many comparisons (i.e., above the recommended threshold of 0.7 [56]), we reduced the bioclimatic variables by performing a PCA in adegenet. We saved the coordinates on the first three PCs after inspecting the loading plot for every axis. We checked again for correlation among the eigenvalues obtained for the principal components, elevation, and Shannon Index. We also checked the variance inflation factor (VIF) after a simple redundancy analysis (RDA) in vegan using the function ‘vif.cca’ (suggested threshold VIF ≤ 10 [57]). As elevation was still strongly correlated with PC1, and both had a VIF > 10, we removed the former, obtaining a VIF < 10 for all the remaining four variables we included in the analyses: PC1, PC2 and PC3 (from the dimensionality reduction of the bioclimatic variables), and the Shannon Index (Table S1)

2.4.3. Genotype–Environment Association

We used two landscape genomics analyses: latent factor mixed models (LFMM) as a univariate approach—testing for correlation one SNP and one environmental variable at a time—while RDA is a multivariate analysis, which is especially useful in case of polygenic selection.
We applied LFMM with the functions included in LEA package. Latent factors account for population structure and are conceptually similar to PCs; thus, like we did for pcadapt, we chose K = 4 and checked the uniformity of the distribution of p-values for each environmental variable to know the hypothesis was well calibrated (i.e., uniform with a peak on zero [39]). Then, we adjusted the p-values with the BH method and identified the SNPs showing an adjusted p-value < 0.05 as outliers.
We ran simple and partial RDA (pRDA) with vegan, the difference being that pRDA calculates the correlation among the predictor variables and the SNPs and at the same time it controls for the effect of neutral population structure [58]. To account for the population structure in our dataset, we assigned each sample to the cluster where its admixture coefficient was the highest according to the best run in snmf. We then tested the significance and computed the adjusted R2 of the simple and partial models, and finally partitioned the overall variance between environment and neutral population structure with the function ‘varpart’. Following Forester and colleagues [56], a SNP was considered an outlier if its Z-score deviated more than 1.96 standard deviation from the mean, which corresponds to a significance level of α = 0.05.

2.5. Annotation and Gene Ontology Enrichment Analysis

The next steps were focused on the SNPs identified by at least two of the three methods implemented to look for local adaptation, as suggested by [56]. Therefore, first, we identified the outlier SNPs shared by the three methods with a Venn diagram (http://bioinformatics.psb.ugent.be/webtools/Venn/ (accessed on 14 July 2021)). Then, we inspected the allele frequencies of the candidate loci by the four genetic clusters identified with LEA for north–south or west–east gradients; finally, we correlated the allele frequencies of those SNPs that appeared to follow any of the two possible geographic patterns with the mean values of the environmental variables calculated within the areas occupied by the same four clusters. SNP coordinates were first converted from Sscrofa10.2 into the Sscrofa11.1 genome assembly coordinates, the most complete reference genome for the pig [59]. The conversion was done with the tool LiftOver from UCSC (http://genome.ucsc.edu (accessed on 14 July 2021)); one of the candidate SNPs was not found any longer in the newest assembly, so it was treated separately (see below). We annotated the candidate SNPs using the program SnpEff [60] and Sscrofa11.1.99 database. Subsequently, we used the Biomart tool from Ensembl to look for genes within 100,000 bp around each candidate SNP; this window was chosen after calculating, for each of the four genetic clusters identified in snmf, the LD decay with PLINK (Figure S1; [2,61]). We performed a gene ontology (GO) enrichment analysis with g:Profiler [62], using Sus scrofa as the reference organism and considered as significant each GO term that had a p–value ≤ 0.05 after BH correction. The candidate SNP left out during the map conversion was manually annotated by looking into it on the Ensembl database [63] for Sscrofa10.2 genome assembly.

3. Results

The initial dataset was thinned to 83 Sardinian WB and 13,917 autosomal biallelic SNPs after filtering individuals for genotyping rate, IBD, and hybrids with the DP, and markers for MAF and LD.

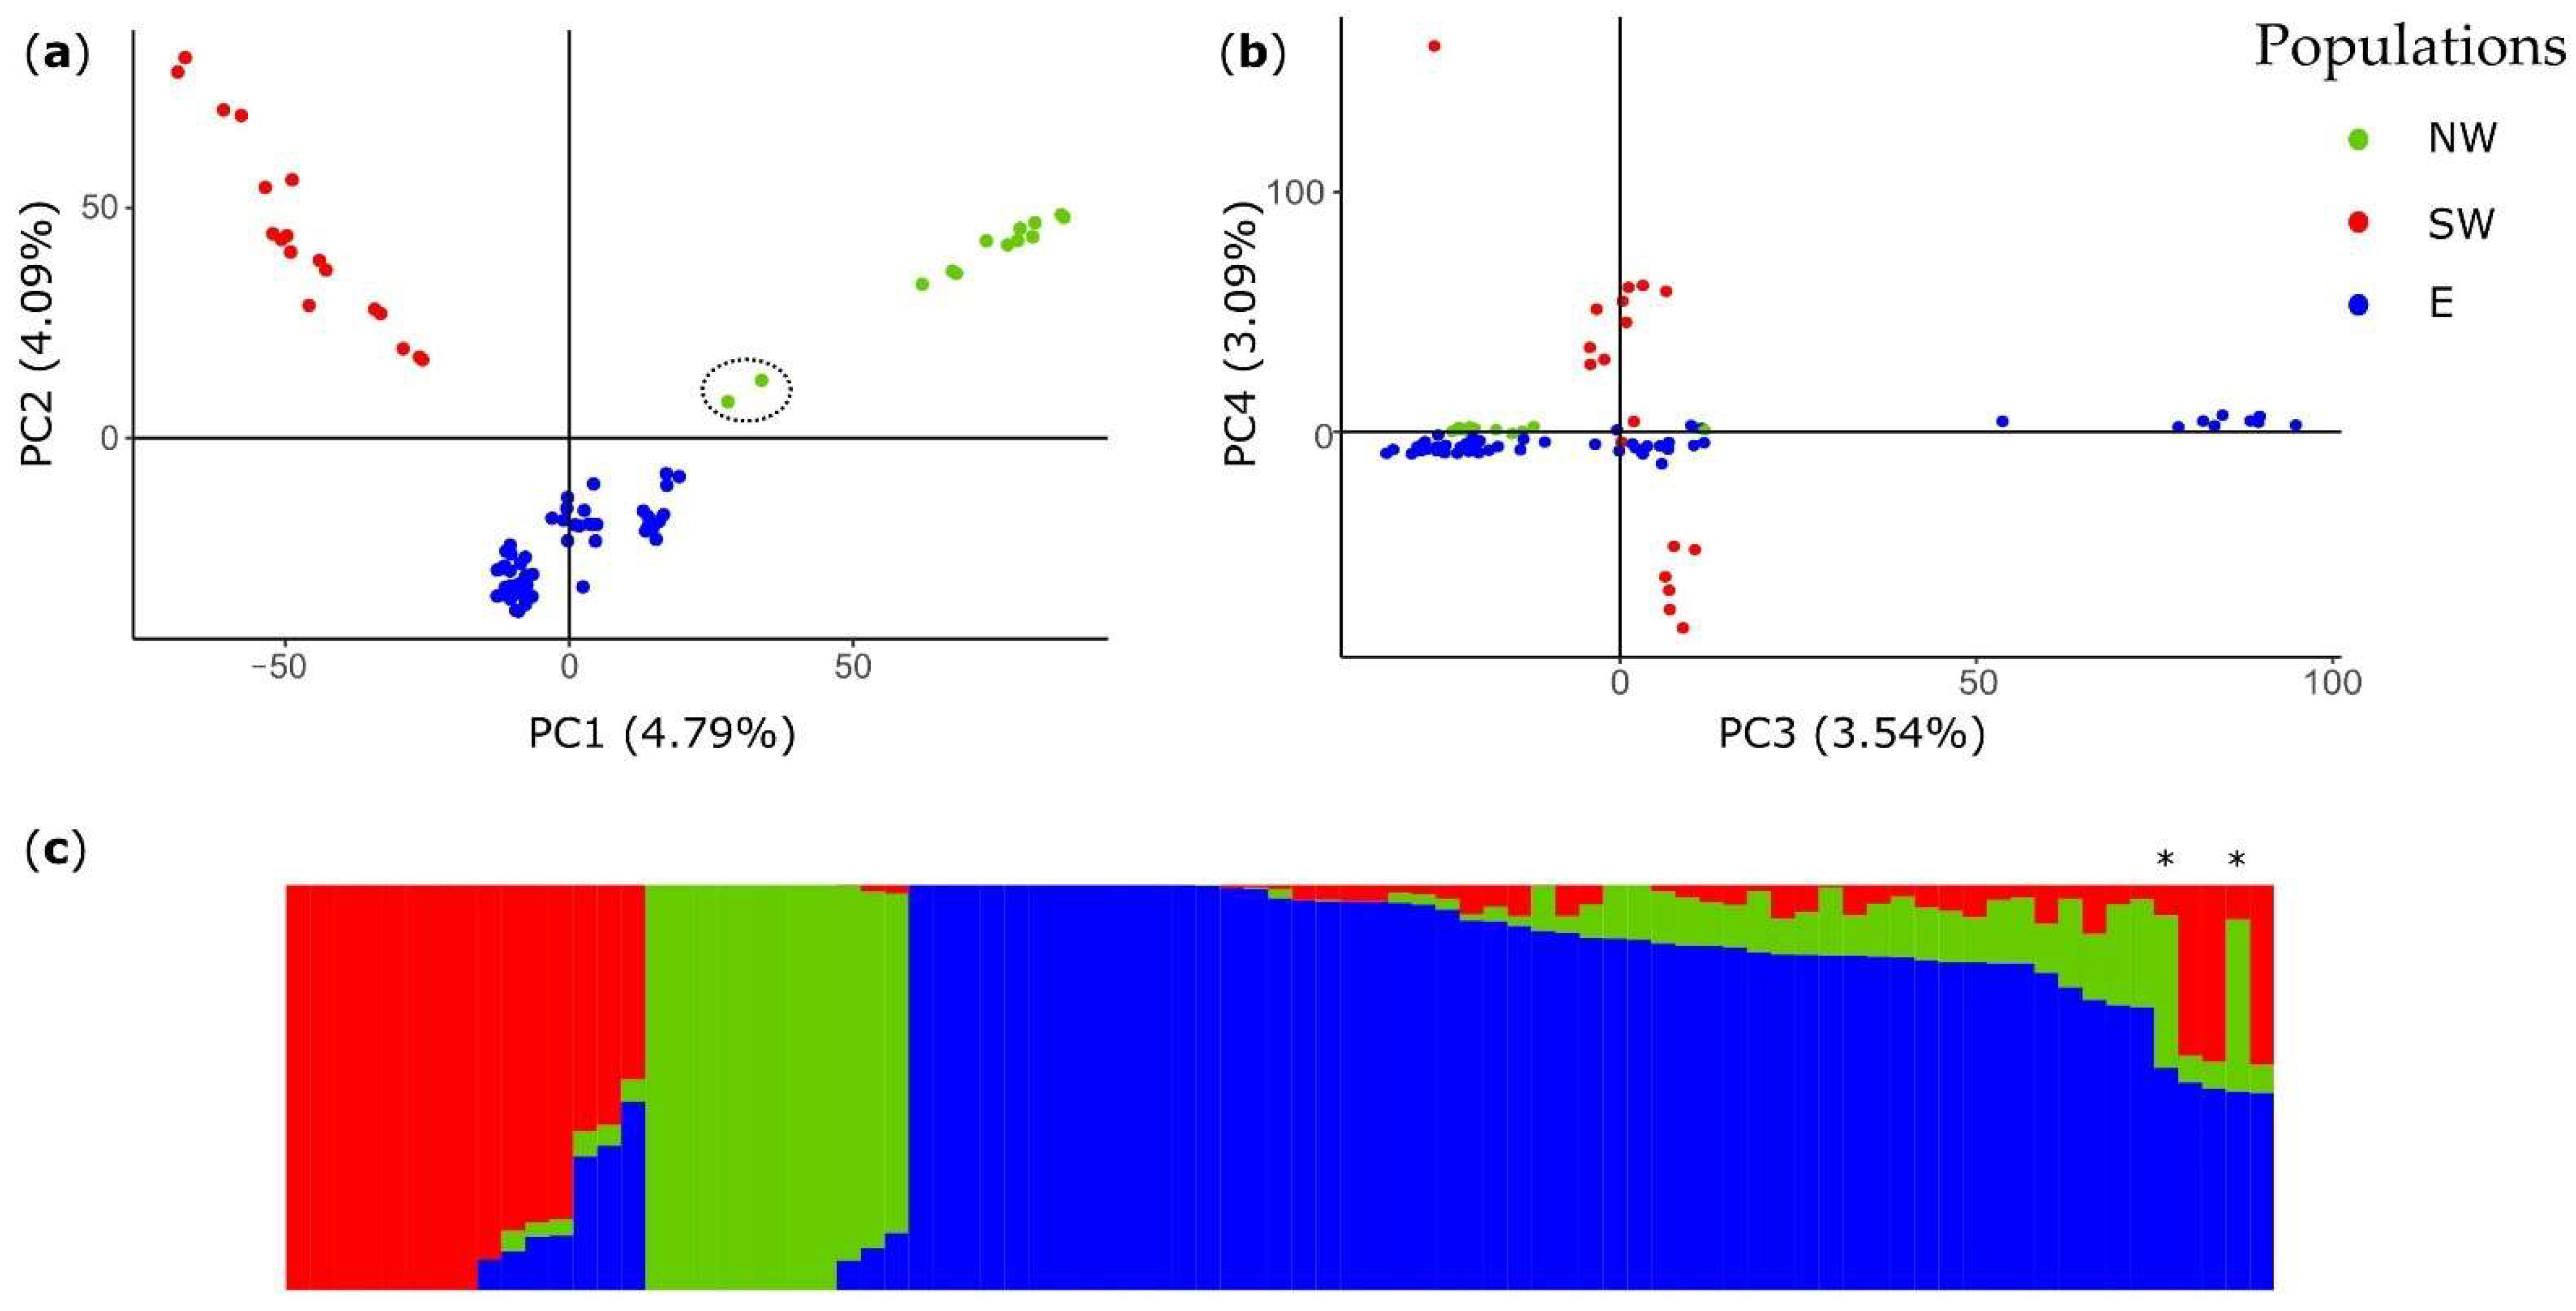
3.1. Population Structure

Population structure was detected with both unsupervised and model-based methods, with northwestern (NW) and southwestern (SW) subpopulations clearly differentiated between them and from the eastern (E) subpopulation (Figure 2, Figures S2 and S3). NW was very homogeneous according to both PCA and ADMIXTURE; only two individuals from Nurra were split between the NW and E clusters in ADMIXTURE and leaned towards the E population in the PCA (Figure 2). SW was also pretty homogeneous in its genetic composition; four individuals resulted to be admixed between SW and E, but they are part of the gradient characterizing SW (especially along PC4, Figure 2b). This subdivision was further dissected in snmf, with E divided into a northeastern subpopulation (NE) and a central and southeastern subpopulation (CSE) (Figure S4).

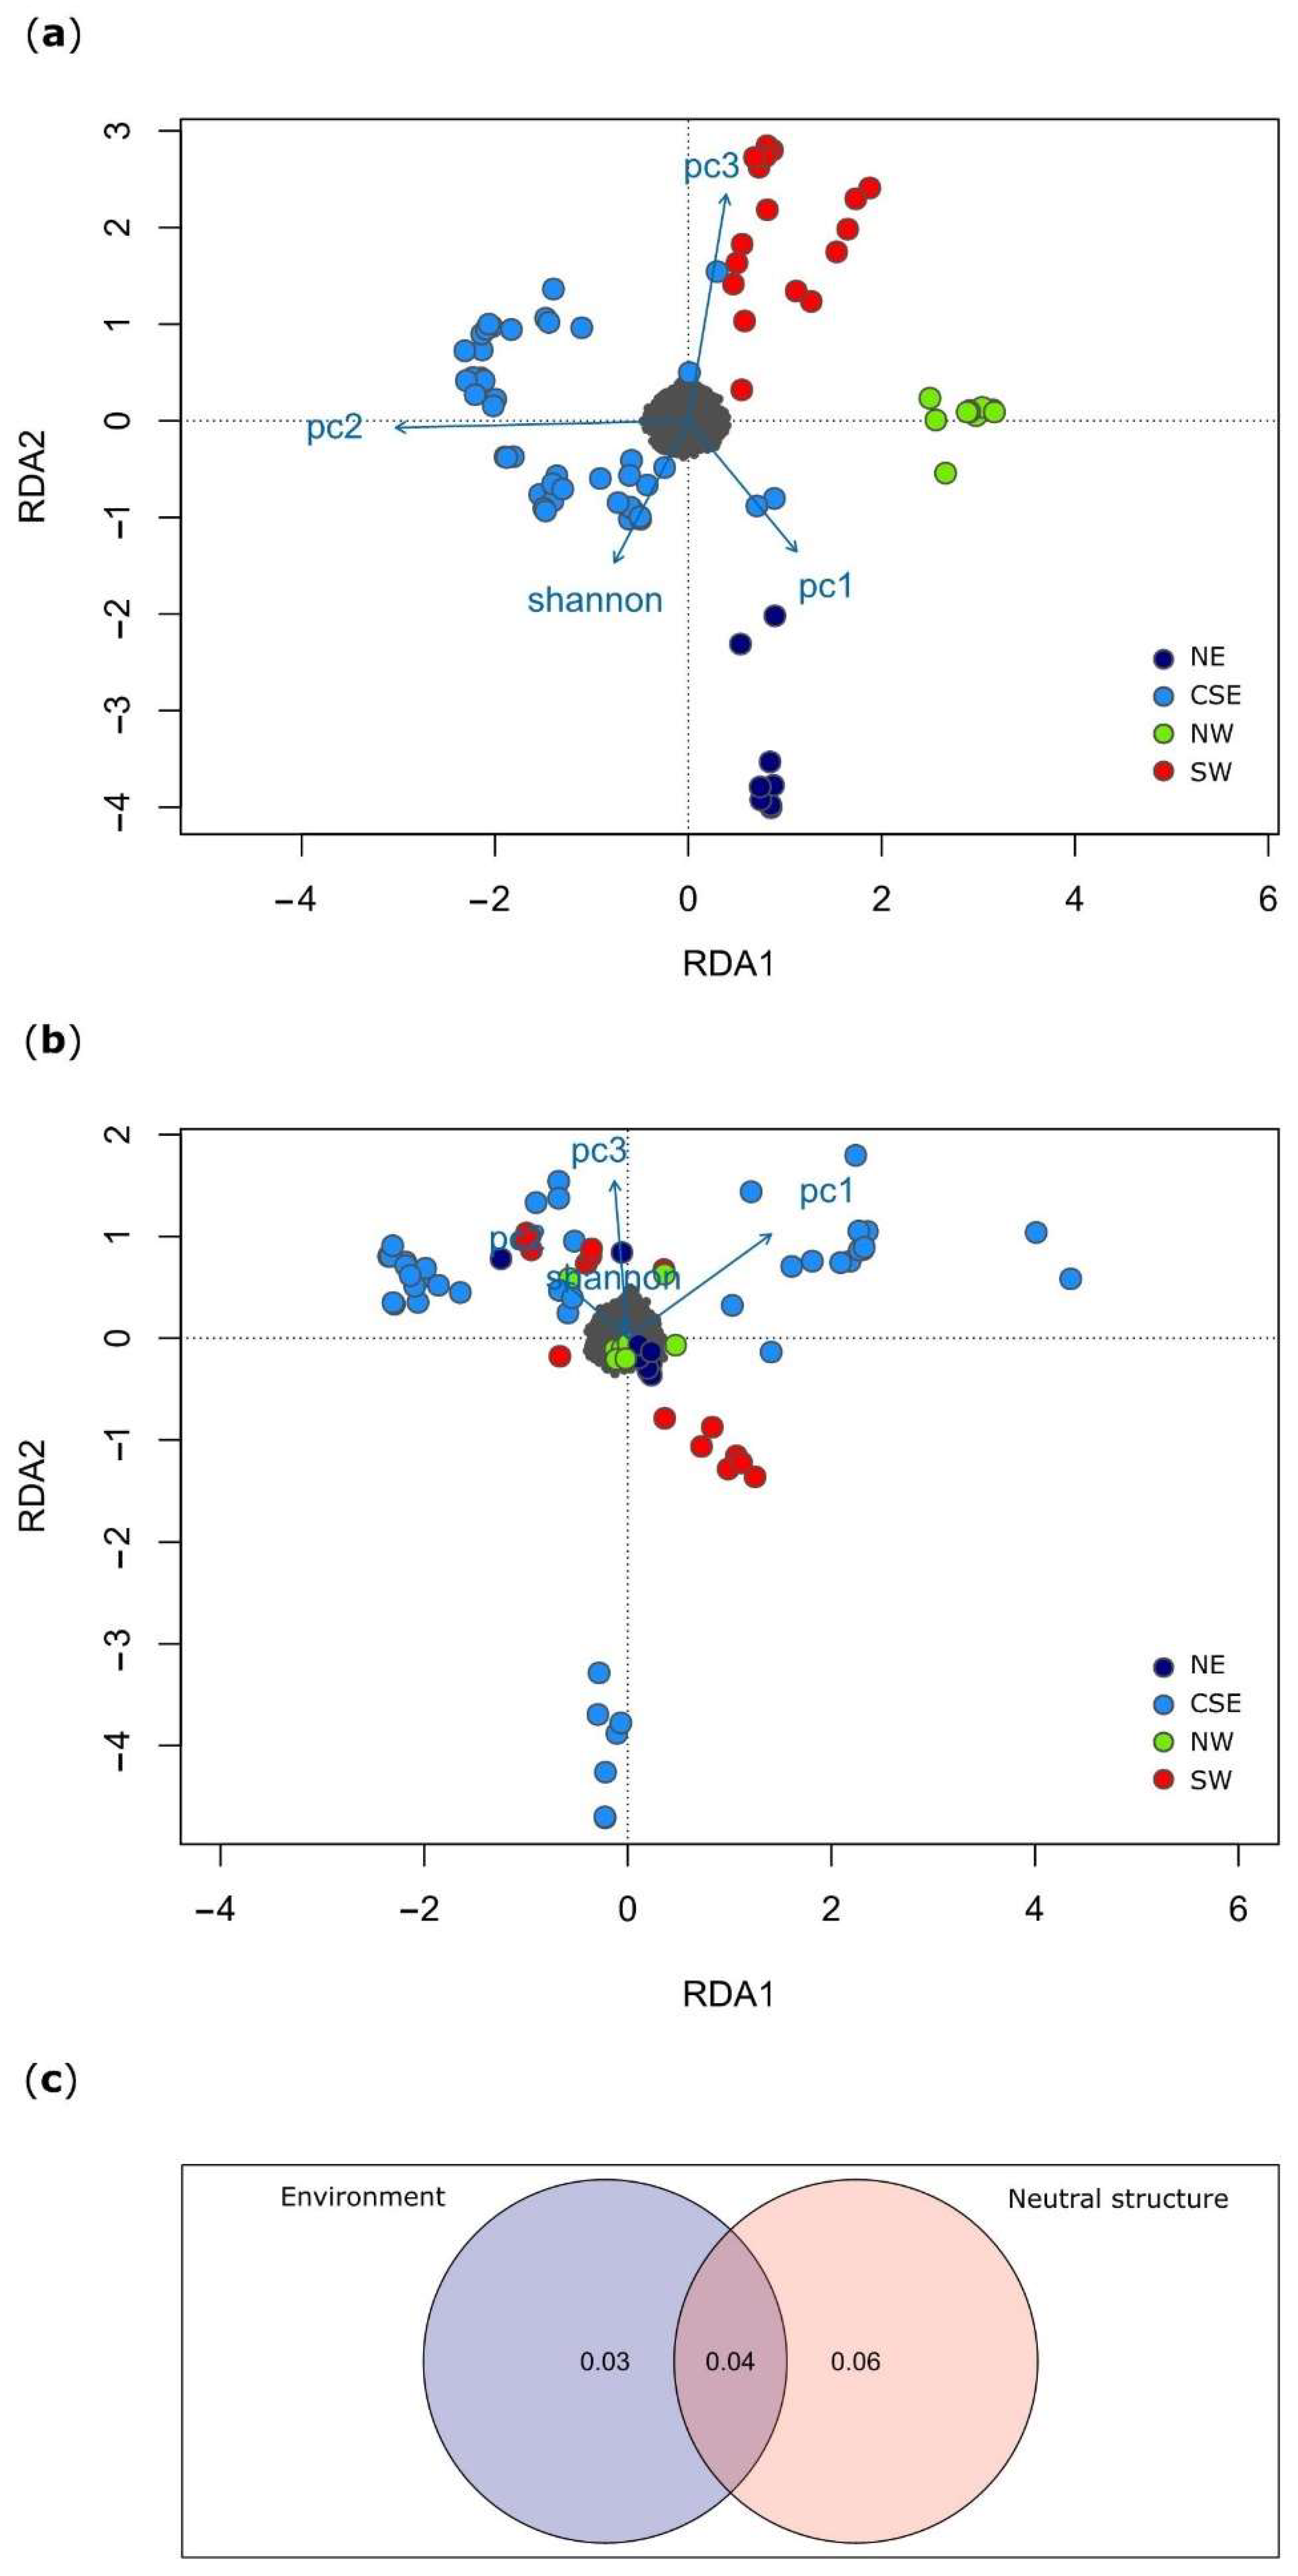
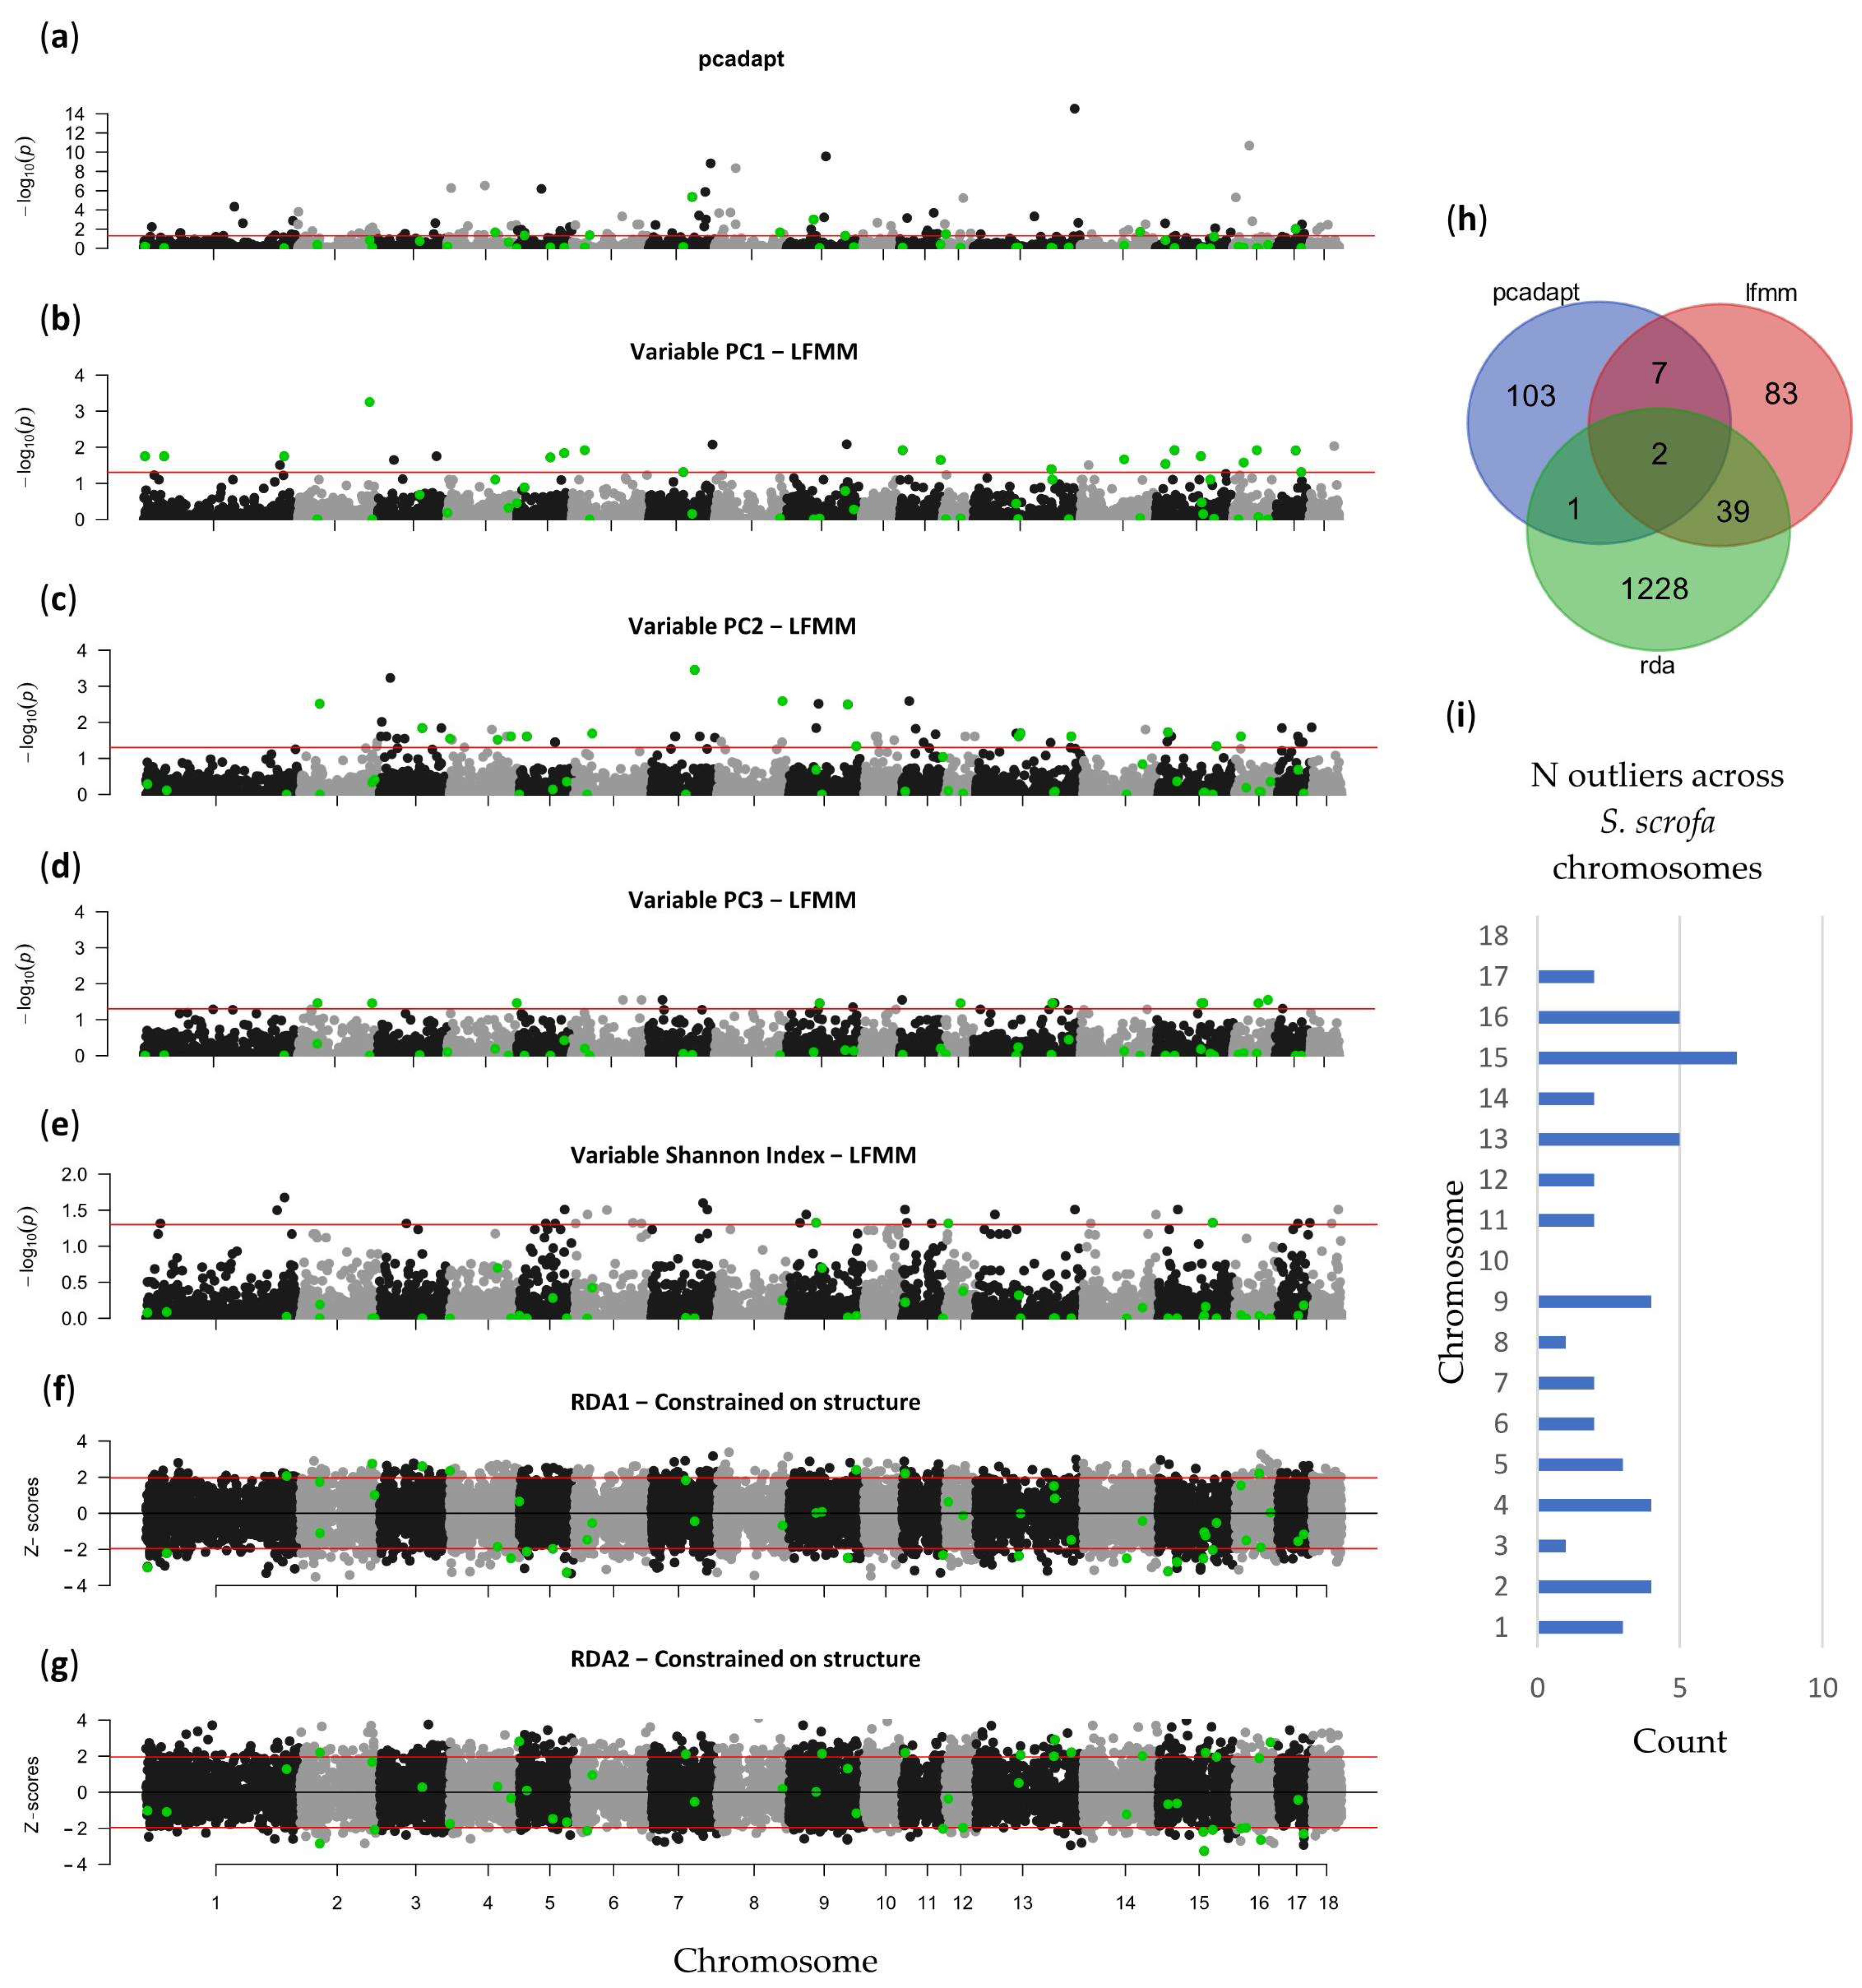
3.2. Local Adaptation

Due to the high collinearity between environmental variables (Figure S5), the PCA produced highly informative PCs (the first three PCs accounted for > 96% of the overall variance in the data). According to the loading plots for the first three PCs on the bioclimatic variables alone (Figure S5), most of the variables loaded on PC1. The two bioclimatic variables referred to variation in temperature and precipitation (bio4 and bio15) loaded more on PC3 and PC2, respectively.
Pcadapt found 113, LFMM 134, and RDA 1289 SNP outliers (Figure 3), distributed across all chromosomes. Forty-eight outliers in pcadapt (42%) were associated to PC4—the axis describing genetic variation within SW—while a similar number of outliers were found to be associated to PC1 (25) or PC2 (30), that separated NW from SW and western from eastern sides of the island, respectively. In LFMM, the environmental descriptor that was associated with most outliers was PC2, primarily influenced by precipitation seasonality (bio15) and precipitation of the warmest quarter (bio18) (Figure S5); these variables follow a west–east cline of variation (see Figure S6). The adjusted R2 for the RDA and the pRDA were 0.06 and 0.03, respectively, and both models were significant after permutation test (p-values = 0.001 in both cases). The first three axes resulted in being significant after permutation for the simple RDA. The triplot of simple RDA (Figure 3a) clearly separated the four populations; CSE positively correlated with PC2 (i.e., bio15 and bio18), while NW was negatively associated with it. SW was positively correlated with PC3 (i.e., temperature seasonality), while NE showed an association with PC1 (most of the variables related to temperature and precipitation) and the Shannon index. When we plotted RDA1 vs. RDA3 (Figure S7), NE and SW populations almost overlapped, whereas CSE spread along RDA3 with three loose clusters positively, neutrally and negatively correlated with PC1 and PC3 when moving from top to bottom. When population structure was accounted for in pRDA, however, only the first two axes were significant after the permutation test. The most striking difference from the simple RDA was that the northern populations (NW and NE) were not really affected by any variable considered in the model because they were compressed in the middle (Figure 3b). CSE was widespread with different clusters: two separated along RDA2, where PC1 loaded the most; hence, this group of samples was positively correlated with lower mean temperatures or with more precipitations (bioclimatic variables bio9, bio10, bio12, bio16, bio17), and the other group was negatively correlated with them; the other group of samples far from the rest along RDA2 was negatively correlated with PC3, which represented temperature seasonality. SW was split into two groups along RDA1, which loaded on PC1 and PC2. The variance partitioning (Figure 3c) showed that the environmental contribution to the variation in the data was minor—accounting for 3% only—and that a good portion was not attributable to neither structure alone nor structure and environment taken together (87% not explained).
Forty-nine SNPs—out of a total 1536 outliers—were detected by at least two methods (Figure 4h). Notably, when a marker was found by both LFMM and RDA—the two approaches that take the environment into account—the environmental descriptor associated with the marker was the same for the two methods (39 SNPs, 78% of the outliers in common). Moreover, seven out of 10 SNPs in common between the outlier analysis and at least one of the other two methods were associated with PC2 from genetic clustering, that separated West from East, and with PC2 from the environmental analysis, that summarizes the bioclimatic variables with a west–east pattern of variation (Table S2). Inspection of the allele frequencies by cluster identified two SNPs that followed a north–south (N–S) pattern of variation and three SNPs that followed a west–east (W–E) pattern (Figure S8). By correlating the allele frequencies with the values of the environmental variables that followed the same N–S or W–E pattern, we found that SNP ASGA0059130 was highly correlated with the maximum temperature of the warmest month (Figure S9), thus being one of the most promising markers (see Discussion).
Annotation of these candidate loci on the latest pig genome assembly Sscrofa11.1 [59] revealed that most of the candidate SNPs were intronic variants or located in intergenic regions. Chromosome 15 was the most represented while chromosomes 10 and 18 were not listed (Table S2). We recovered 61 genes within a 100 kbp window around each SNP position (Table S3). The genes in close proximity to the 2 SNPs identified as candidate loci by all methods are TEX49, ADCY6, CACNB3, DDX23, and RND1 on chromosome 5, and AMPH on chromosome 9. TEX49 is the testis expressed 49 gene, whose function is not described in literature. ADCY6 encodes for the adenylate cyclase 6, a member of the adenylate cyclase protein family, which are implied in the synthesis of cyclic AMP and hence has a role in the transmembrane signaling pathways [64]. CACNB3 gene product is a beta subunit of the voltage dependent calcium channel; it contributes to regulating the calcium transport [65]. DDX23 is a putative RNA helicase, thus responsible for the secondary modifications to mRNA and miRNAs formation [66]. RND1 belongs to the Rho GTPase family, which plays a role in the regulation of the actin cytoskeleton [67]. AMPH encodes for a protein found in the cytoplasmatic side of synaptic vesicles and is found to have a role in their endocytosis [68].
We found several GO terms significantly enriched in our gene list for biological processes related to cell junction and adhesion, and to development (Table S4). Among these, BBX is implied in sequence-specific double-stranded DNA binding activity and could be implied in bone development [69]. CTNNA1 encodes for a protein belonging to the catenin family that are important for establishing the connection between the cadherins on the plasma membrane with the actin filaments inside the cell, and it is reported to be a myogenesis inhibitor [70]. Myogenic functions are found also for ZBED2, which helps the binding to the cis–regulatory region for transcription activity and is differentially expressed in myogenic and adipogenic precursors [71]; PRKRA encodes for a protein kinase that is activated by double–stranded RNA and hence intervenes during viral infections [72], but it is also reported to be implied in morphogenesis and to interact with a miRNA that targets many genes that negatively regulate cell proliferation [73,74]. JAM3 belongs to the junctional adhesion molecule family, and the resulting protein is found in the tight junctions between high endothelial cells, probably interacting with leukocyte cell lines [75,76,77]. It is interesting that other genes appearing several times in the above-mentioned GO categories have roles in immunity. For example, PIK3CB encodes for a protein kinase that was shown to take part in the activation pathway in neutrophils in case of an injury or infection [78]; FAIM instead protects against apoptosis when it is receptor-triggered and regulates signaling and differentiation in B–cells [79]; CRTAM encodes for a transmembrane protein and is upregulated in CD4 and CD8-positive T cells [80].

4. Discussion

In this study, we analyzed a sample of Sardinian wild boar and looked for genomic signatures of adaptation to local environmental conditions. We considered climatic variables and land use characteristics that could influence the biology of the species. Given its relatively ancient arrival on the island (i.e., arguably during the 8th millennium BP, [25]), we expected that the variation in climate and land use correlated with the allele frequencies at a few loci in correspondence or close to genes that are relevant for local adaptation. Another study carried out on a recently introduced insular population, the white-tailed deer (Odocoileus virginianus), that colonized the Anticosti Island off the Canadian coasts around 200 years ago, found that the population is currently differentiating from the founding population on the mainland, with some markers significantly showing signs of divergent selection [81].
We can expect that the majority of the loci under selection was part of the standing genetic variation of the population that colonized the island rather than originated from new mutations. The sampling time frame in this study spanning a decade should not introduce bias in the analyses of local adaptation to the environmental conditions because the process of evolution usually takes much longer to produce considerable shifts in allele frequencies.

4.1. Population Structure in the Sardinian Wild Boar

The neutral population structure detected on the island by three different methods shed light on possible hierarchical sub–structuring of the population: even though PCA and ADMIXTURE results are concordant in dividing the northwestern (NW) and southwestern (SW) populations from the eastern one (E), we should note that PCs were significant up to the 6th axis (Figure S2), with clear differentiation within E and SW subpopulations. Moreover, snmf supported the differentiation of a northeastern (NE) group of samples from the rest of samples from central and southeastern areas (CSE). Previous studies on microsatellite markers showed concordant results: the same three main clusters were identified by Scandura et al. [31] after cleaning the dataset from samples showing traces of introgression from either European populations of wild boar or from the domestic pig, while five clusters were detected increasing both sample size and number of markers [26]. Here, the western side of the population was divided into north (Nurra), center and south, while the eastern side was weakly differentiated with the northern and central populations clustering together and the southern population in a different cluster. The minor mismatch between that work and the present one can be explained by the difference in sample spatial distribution and size. In addition, the increased diagnostic power of thousands of genome-wide markers like our SNP dataset with respect to the usual set of microsatellites can play a role as well [82]. Interestingly, in the study by Lecis et al. [32], the authors excluded that isolation by distance is sufficient to justify the identified genetic structure, and concluded that roads and land use are actively sustaining the differentiation on the island thus limiting the gene flow among different areas. This creates the perfect conditions to develop adaptations to local environmental conditions. Additionally, the resulting pattern of differentiation emerged in a limited time interval; if restriction to gene flow persists, we can expect that population structure is maintained and that the chances to develop detectable signatures of adaptation to local environmental conditions will increase even more.

4.2. The Effect of the Environment on the Genetic Diversity of the Sardinian Wild Boar

When different methods are implemented to investigate the possible genetic signature of selection in response to local environmental conditions, the results do not match completely because of the intrinsically different methodological approaches. It is indeed recommended to apply more than one method and consider as strong candidates of selection only the markers identified by at least two of them [5,56,83]. In our study, RDA detected many more outliers than pcadapt and LFMM; if standing genetic variation is the main source on which selection acted, we can expect that the resulting soft sweep causes a multi-locus pattern of shift in allele frequencies and therefore multi-locus approaches like RDA are more effective in identifying them [56,84]. When we controlled for neutral population structure in the partial RDA (pRDA), the environment appeared to be influencing the genetic variability within the single clusters SW and CSE more than among the four different clusters we previously detected. Friis and colleagues [6] observed that, in the distribution of the Oregon junco complex (Junco hyemalis oreganus), the genetic structure was created by different processes: one of the most isolated populations of the complex was not influenced by the environment when removing the effect of neutral population structure in the pRDA, thus highlighting the effect of evolution under isolation and genetic drift, while the populations with a continuous distribution were diverging from each other following some environmental variables. Since Lecis and co–authors [32] found that both isolation by resistance and isolation by barrier were influencing the gene flow in the Sardinian wild boar, we can argue that the genetic differentiation observed in some populations is the result of restricted gene flow and genetic drift rather than of diversifying selection driven by adaptation to local environmental conditions.
The variance partitioning (Figure 3c) showed that the environmental variables we included in the analysis explain 3% of the genetic variation in the dataset, while the simple neutral population structure accounts for twice as much. These results are in line with other landscape genomics studies on plants [85] and animals [6], and may be explained by either balancing selection acting on the majority of the SNPs included in this study, or by the absence of other important ecological factors in our environmental set of variables. The first hypothesis is supported by the great ability of the wild boar to adapt to different conditions, a characteristic that made it one of the most abundant ungulates [86]; such plasticity can be indeed sustained by balancing selection [87,88].
A final note on the environmental descriptors included in this work regards the change that the landscape and land use have undergone in Sardinia, especially during the last three centuries [43]; it is possible that the data we retrieved were not optimal proxies to describe the environmental diversity—in the form of Shannon Index—in which the population has evolved. A possible confirmation of this could come from the low number of outlier SNPs that correlated with the Shannon Index.

4.3. Genomic Adaptation to Local Environmental Conditions

Our expectation that the morphological differences observed on the island could be at least partially due to an adaptive response to the local environment was supported by the list of genes we found close to some outlier loci. It is interesting that some of these genes encode for regulatory elements, as over a short evolutionary time we can expect that phenotypic differences are more likely produced by a change in the regulation of protein expression rather than by mutational steps modifying the structure itself of a protein, as noticed in the case of the rapid phenotypic changes associated with domestication in the pig [89] or in the case of strategies to cope with climate change [90].
The gene BBX was found to be significant in a GWAS study on supernumerary nipples in sheep [91]. In pigs, the number of teats influences the number of offspring that the sow can nurse and shows a high heritability [92]. The SNP in this gene was correlated with temperature seasonality in both LFMM and RDA analyses. It is known that body size impacts the ability of an organism to thermoregulate [93], thus it could be that, where the temperature varies more throughout the year, it is better to have larger body size. Another gene implied in transcription regulation is ZBED2, and the SNP close to it was found to be strongly correlated with the maximum temperature of the warmest month (bio5; Figure S9). This gene is highly expressed in myogenic versus adipogenic precursors in pigs [71], suggesting a role in energy allocation for muscle over fat formation in the presence of high temperatures. Differences in muscle versus fat development were also found for the CTNNA1 gene when comparing Chinese and European pig breeds [70,94], and the corresponding outlier SNP was associated with PC1 in both LFMM and RDA, following again a N–S pattern of variation in maximum temperature and precipitation.
Another relevant gene is UBASH3B, which encodes for a protein that is found to inhibit endocytosis of epidermal growth factor receptor and platelet–derived growth factor receptor [95]. This gene was found to be under selection in a semi-feral Maremmana cattle breed that evolved in semi-arid and scarcely productive pastures [96]. However, the SNP close to this gene was correlated with PC2 in pcadapt and with the Shannon index in LFMM; thus, habitat diversity rather than dryness in the SW area seems to play a role.

5. Conclusions

Despite living on an island, the Sardinian wild boar population shows a remarkable genomic diversity (e.g., [97,98]). Several factors seem to have contributed to this variation, some of which have been explored in previous researches (e.g., introgressive hybridization [28,31], barriers to gene flow [32]) and some others have not been considered yet—specifically, the contribution of Near Eastern alleles that arrived on the island in historical times [99]. In the present study, we have gathered new evidence that supports a possible role of local adaptation to the inner differentiation. Although the overall contribution of adaptive variation to the genetic structure of the population appears minor with respect to the impact of landscape, we detected signals in specific regions of the genome that are suggestive of an ongoing selection on specific loci in response to environmental gradients that are present on the island. The role of the candidate genes identified and the possible implications on morphology and fitness of these selective forces deserve further investigations, especially to forecast the impact of climate change on this species [100].

Supplementary Materials

The following supporting information can be downloaded at: https://www.mdpi.com/article/10.3390/d14090774/s1, Table S1: summary table reporting sample coordinates, normalized bioclimatic variables, elevation, Shannon Index (computed on land use data), and sample coordinates on the first three axes of PCA for dimensionality reduction on the bioclimatic variables, Table S2: list of candidate SNPs implied in local adaptation, Table S3: Candidate genes within a 100,000 kb window around the candidate SNPs, Table S4: Gene Ontology (GO) enrichment analysis of the list of candidate genes from g:Profiler, Figure S1: LD decay in the four genetic clusters, Figure S2: proportion of variance explained by the first 20 PCs, Figure S3: Cross-validation error from ADMIXTURE for 83 Sardinian wild boar, Figure S4: Genetic structure identified with the analysis snmf from the R package LEA, Figure S5: Loading plots of the first three PCs resulting from the principal component analysis (PCA) summarizing the variation in the environmental conditions considered in this study, Figure S6: Bioclimatic variables from Worldclim2 considered in this study, Figure S7: Triplot showing the first (RDA1) versus third (RDA3) axes from the simple redundancy analysis (RDA), Figure S8: Heatmap of the allele frequencies by cluster for the 49 candidate loci, Figure S9: Spatial distribution of the two alleles at SNP ASGA0059130 over bio5 (maximum temperature of the warmest month) and correlation plot.

Author Contributions

Conceptualization, G.F. and M.S.; methodology, G.F. and L.I.; software, G.F.; validation, G.F. and L.I.; formal analysis, G.F.; investigation, G.F. and L.I.; resources, G.F. and L.I.; data curation, G.F.; writing—original draft preparation, G.F. and M.S.; writing—review and editing, G.F., L.I. and M.S.; visualization, G.F.; supervision, M.S.; project administration, M.A. and M.S.; funding acquisition, M.A. and M.S. All authors have read and agreed to the published version of the manuscript.

Funding

This research was supported by the Ministry of Environment, the program FSC 2014–2020—“Patto per lo Sviluppo della Regione Sardegna” (project RC_CRP_013), and the program “Fondo di Ateneo per la Ricerca 2019”. GF had a Ph.D. grant funded by the European Social Fund–Operational Program 2014/2020 (POR FSE 2014/2020).

Institutional Review Board Statement

Not applicable.

Informed Consent Statement

Not applicable.

Data Availability Statement

The data presented in this study are openly available in Dryad at https://doi.org/10.5061/dryad.30tk6.

Acknowledgments

We thank the Animal Breeding and Genomics group at WUR for the genotyping. We are also grateful to Olivia Dondina and Romolo Caniglia for their suggestions on some analytical steps.

Conflicts of Interest

The authors declare no conflict of interest.

References

  1. Librado, P.; Orlando, L. Detecting Signatures of Positive Selection along Defined Branches of a Population Tree Using LSD. Mol. Biol. Evol. 2018, 35, 1520–1535. [Google Scholar] [CrossRef] [PubMed]
  2. Flori, L.; Moazami-Goudarzi, K.; Alary, V.; Araba, A.; Boujenane, I.; Boushaba, N.; Casabianca, F.; Casu, S.; Ciampolini, R.; D’Acier, A.C.; et al. A Genomic Map of Climate Adaptation in Mediterranean Cattle Breeds. Mol. Ecol. 2019, 28, 1009–1029. [Google Scholar] [CrossRef] [PubMed]
  3. Manthey, J.D.; Moyle, R.G. Isolation by Environment in White-Breasted Nuthatches (Sitta carolinensis) of the Madrean Archipelago Sky Islands: A Landscape Genomics Approach. Mol. Ecol. 2015, 24, 3628–3638. [Google Scholar] [CrossRef] [PubMed]
  4. Chávez-Galarza, J.; Henriques, D.; Johnston, J.S.; Azevedo, J.C.; Patton, J.C.; Muñoz, I.; De La Rúa, P.; Pinto, M.A. Signatures of Selection in the Iberian Honey Bee (Apis mellifera iberiensis) Revealed by a Genome Scan Analysis of Single Nucleotide Polymorphisms. Mol. Ecol. 2013, 22, 5890–5907. [Google Scholar] [CrossRef] [PubMed]
  5. Dalongeville, A.; Benestan, L.; Mouillot, D.; Lobreaux, S.; Manel, S. Combining Six Genome Scan Methods to Detect Candidate Genes to Salinity in the Mediterranean Striped Red Mullet (Mullus surmuletus). BMC Genom. 2018, 19, 1–13. [Google Scholar] [CrossRef]
  6. Friis, G.; Fandos, G.; Zellmer, A.J.; McCormack, J.E.; Faircloth, B.C.; Milá, B. Genome-Wide Signals of Drift and Local Adaptation during Rapid Lineage Divergence in a Songbird. Mol. Ecol. 2018, 27, 5137–5153. [Google Scholar] [CrossRef]
  7. Wang, I.J.; Bradburd, G.S. Isolation by Environment. Mol. Ecol. 2014, 23, 5649–5662. [Google Scholar] [CrossRef]
  8. Sexton, J.P.; Hangartner, S.B.; Hoffmann, A.A. Genetic Isolation by Environment or Distance: Which Pattern of Gene Flow Is Most Common? Evolution 2014, 68, 1–15. [Google Scholar] [CrossRef]
  9. Rellstab, C.; Gugerli, F.; Eckert, A.J.; Hancock, A.M.; Holderegger, R. A Practical Guide to Environmental Association Analysis in Landscape Genomics. Mol. Ecol. 2015, 24, 4348–4370. [Google Scholar] [CrossRef]
  10. Ahrens, C.W.; Rymer, P.D.; Stow, A.; Bragg, J.; Dillon, S.; Umbers, K.D.L.; Dudaniec, R.Y. The Search for Loci under Selection: Trends, Biases and Progress. Mol. Ecol. 2018, 27, 1342–1356. [Google Scholar] [CrossRef] [Green Version]
  11. Hohenlohe, P.A.; Bassham, S.; Currey, M.; Cresko, W.A. Extensive Linkage Disequilibrium and Parallel Adaptive Divergence across Threespine Stickleback Genomes. Philos. Trans. R. Soc. B Biol. Sci. 2012, 367, 395–409. [Google Scholar] [CrossRef] [PubMed]
  12. Felsenstein, J. Skepticism Towards Santa Rosalia, or Why Are There so Few Kinds of Animals? Evolution 1981, 35, 124. [Google Scholar] [CrossRef] [PubMed]
  13. Li, J.; Li, H.; Jakobsson, M.; Li, S.; Sjödin, P.; Lascoux, M. Joint Analysis of Demography and Selection in Population Genetics: Where Do We Stand and Where Could We Go? Mol. Ecol. 2012, 21, 28–44. [Google Scholar] [CrossRef]
  14. Privé, F.; Luu, K.; Vilhjálmsson, B.J.; Blum, M.G.B. Performing Highly Efficient Genome Scans for Local Adaptation with R Package Pcadapt Version 4. Mol. Biol. Evol. 2020, 37, 2153–2154. [Google Scholar] [CrossRef] [PubMed]
  15. Frichot, E.; Schoville, S.D.; Bouchard, G.; François, O. Testing for Associations between Loci and Environmental Gradients Using Latent Factor Mixed Models. Mol. Biol. Evol. 2013, 30, 1687–1699. [Google Scholar] [CrossRef] [PubMed]
  16. Gautier, M. Genome-Wide Scan for Adaptive Divergence and Association with Population-Specific Covariates. Genetics 2015, 201, 1555–1579. [Google Scholar] [CrossRef]
  17. Coop, G.; Witonsky, D.; Di Rienzo, A.; Pritchard, J.K. Using Environmental Correlations to Identify Loci Underlying Local Adaptation. Genetics 2010, 185, 1411–1423. [Google Scholar] [CrossRef]
  18. Stucki, S.; Orozco-TerWengel, P.; Forester, B.R.; Duruz, S.; Colli, L.; Masembe, C.; Negrini, R.; Landguth, E.; Jones, M.R.; Bruford, M.W.; et al. High Performance Computation of Landscape Genomic Models Including Local Indicators of Spatial Association. Mol. Ecol. Resour. 2017, 17, 1072–1089. [Google Scholar] [CrossRef]
  19. Morin, P.A.; Luikart, G.; Wayne, R.K. SNPs in Ecology, Evolution and Conservation. Trends Ecol. Evol. 2004, 19, 208–216. [Google Scholar] [CrossRef]
  20. Manel, S.; Perrier, C.; Pratlong, M.; Abi-Rached, L.; Paganini, J.; Pontarotti, P.; Aurelle, D. Genomic Resources and Their Influence on the Detection of the Signal of Positive Selection in Genome Scans. Mol. Ecol. 2016, 25, 170–184. [Google Scholar] [CrossRef] [Green Version]
  21. Hess, J.E.; Matala, A.P.; Narum, S.R. Comparison of SNPs and Microsatellites for Fine-Scale Application of Genetic Stock Identification of Chinook Salmon in the Columbia River Basin. Mol. Ecol. Resour. 2011, 11, 137–149. [Google Scholar] [CrossRef] [PubMed]
  22. Defaveri, J.; Viitaniemi, H.; Leder, E.; Merilä, J. Characterizing Genic and Nongenic Molecular Markers: Comparison of Microsatellites and SNPs. Mol. Ecol. Resour. 2013, 13, 377–392. [Google Scholar] [CrossRef] [PubMed]
  23. Narum, S.R.; Banks, M.; Beacham, T.D.; Bellinger, M.R.; Campbell, M.R.; Dekoning, J.; Elz, A.; Guthrie, C.M.; Kozfkay, C.; Miller, K.M.; et al. Differentiating Salmon Populations at Broad and Fine Geographical Scales with Microsatellites and Single Nucleotide Polymorphisms. Mol. Ecol. 2008, 17, 3464–3477. [Google Scholar] [CrossRef] [PubMed]
  24. Haasl, R.J.; Payseur, B.A. Multi-Locus Inference of Population Structure: A Comparison between Single Nucleotide Polymorphisms and Microsatellites. Heredity 2011, 106, 158–171. [Google Scholar] [CrossRef] [PubMed]
  25. Albarella, U.; Manconi, F.; Rowley-Conwy, P.; Vigne, J.-D. Pigs of Corsica and Sardinia: A Biometrical Re-Evaluation of Their Status and History. In Archaeozoological Studies in Honour of Alfredo Riedel; Tecchiati, U., Sala, B., Eds.; Ufficio Beni Archeologici: Bolzano, Italy, 2006; pp. 285–302. [Google Scholar]
  26. Mur, L.; Atzeni, M.; Martínez-López, B.; Feliziani, F.; Rolesu, S.; Sanchez-Vizcaino, J.M. Thirty-Five-Year Presence of African Swine Fever in Sardinia: History, Evolution and Risk Factors for Disease Maintenance. Transbound. Emerg. Dis. 2016, 63, e165–e177. [Google Scholar] [CrossRef]
  27. Albarella, U.; Dobney, K.; Rowley-Conwy, P. Size and Shape of the Eurasian Wild Boar (Sus scrofa), with a View to the Reconstruction of Its Holocene History. Environ. Archaeol. 2009, 14, 103–136. [Google Scholar] [CrossRef]
  28. Iacolina, L.; Scandura, M.; Goedbloed, D.J.; Alexandri, P.; Crooijmans, R.P.M.A.; Larson, G.; Archibald, A.; Apollonio, M.; Schook, L.B.; Groenen, M.A.M.; et al. Genomic Diversity and Differentiation of a Managed Island Wild Boar Population. Heredity 2016, 116, 60–67. [Google Scholar] [CrossRef]
  29. Scandura, M.; Fabbri, G.; Caniglia, R.; Iacolina, L.; Mattucci, F.; Mengoni, C.; Pante, G.; Apollonio, M.; Mucci, N. Resilience to Historical Human Manipulations in the Genomic Variation of Italian Wild Boar Populations. Front. Ecol. Evol. 2022, 10, 833081. [Google Scholar] [CrossRef]
  30. Petrelli, S.; Buglione, M.; Maselli, V.; Troiano, C.; Larson, G.; Frantz, L.; Manin, A.; Ricca, E.; Baccigalupi, L.; Wright, D.; et al. Population Genomic, Olfactory, Dietary, and Gut Microbiota Analyses Demonstrate the Unique Evolutionary Trajectory of Feral Pigs. Mol. Ecol. 2022, 31, 220–237. [Google Scholar] [CrossRef]
  31. Scandura, M.; Iacolina, L.; Cossu, A.; Apollonio, M. Effects of Human Perturbation on the Genetic Make-up of an Island Population: The Case of the Sardinian Wild Boar. Heredity 2011, 106, 1012–1020. [Google Scholar] [CrossRef] [Green Version]
  32. Lecis, R.; Dondina, O.; Orioli, V.; Biosa, D.; Canu, A.; Fabbri, G.; Iacolina, L.; Cossu, A.; Bani, L.; Apollonio, M.; et al. Main Roads and Land Cover Shaped the Genetic Structure of a Mediterranean Island Wild Boar Population. Ecol. Evol. 2022, 12, e8804. [Google Scholar] [CrossRef] [PubMed]
  33. Delitala, A.M.S.; Cesari, D.; Chiessa, P.A.; Ward, M.N. Precipitation over Sardinia (Italy) during the 1946–1993 Rainy Seasons and Associated Large-scale Climate Variations. Int. J. Climatol. 2000, 20, 519–541. [Google Scholar] [CrossRef]
  34. Canu, S.; Rosati, L.; Fiori, M.; Motroni, A.; Filigheddu, R.; Farris, E. Bioclimate Map of Sardinia (Italy). J. Maps 2015, 11, 711–718. [Google Scholar] [CrossRef]
  35. Muns, R.; Nuntapaitoon, M.; Tummaruk, P. Non-Infectious Causes of Pre-Weaning Mortality in Piglets. Livest. Sci. 2016, 184, 46–57. [Google Scholar] [CrossRef]
  36. Acevedo, P.; Escudero, M.A.; Muñoz, R.; Gortázar, C. Factors Affecting Wild Boar Abundance across an Environmental Gradient in Spain. Acta Theriol. 2006, 51, 327–336. [Google Scholar] [CrossRef]
  37. Brogi, R.; Merli, E.; Grignolio, S.; Chirichella, R.; Bottero, E.; Apollonio, M. It Is Time to Mate: Population-Level Plasticity of Wild Boar Reproductive Timing and Synchrony in a Changing Environment. Curr. Zool. 2021, 68, 371–380. [Google Scholar] [CrossRef]
  38. Gamelon, M.; Douhard, M.; Baubet, E.; Gimenez, O.; Brandt, S.; Gaillard, J.M. Fluctuating Food Resources Influence Developmental Plasticity in Wild Boar. Biol. Lett. 2013, 9, 20130419. [Google Scholar] [CrossRef]
  39. Fulgione, D.; Buglione, M. The Boar War: Five Hot Factors Unleashing Boar Expansion and Related Emergency. Land 2022, 11, 887. [Google Scholar] [CrossRef]
  40. Vetter, S.G.; Ruf, T.; Bieber, C.; Arnold, W. What Is a Mild Winter? Regional Differences in within-Species Responses to Climate Change. PLoS ONE 2015, 10, e0132178. [Google Scholar] [CrossRef]
  41. Cutini, A.; Chianucci, F.; Chirichella, R.; Donaggio, E.; Mattioli, L.; Apollonio, M. Mast Seeding in Deciduous Forests of the Northern Apennines (Italy) and Its Influence on Wild Boar Population Dynamics. Ann. For. Sci. 2013, 70, 493–502. [Google Scholar] [CrossRef] [Green Version]
  42. Bisi, F.; Chirichella, R.; Chianucci, F.; Von Hardenberg, J.; Cutini, A.; Martinoli, A.; Apollonio, M. Climate, Tree Masting and Spatial Behaviour in Wild Boar (Sus scrofa L.): Insight from a Long-Term Study. Ann. For. Sci. 2018, 75, 1–9. [Google Scholar] [CrossRef]
  43. Pungetti, G. Anthropological Approach to Agricultural Landscape History in Sardinia. Landsc. Urban Plan. 1995, 31, 47–56. [Google Scholar] [CrossRef]
  44. Puddu, G.; Falcucci, A.; Maiorano, L. Forest Changes over a Century in Sardinia: Implications for Conservation in a Mediterranean Hotspot. Agrofor. Syst. 2012, 85, 319–330. [Google Scholar] [CrossRef]
  45. Ramos, A.M.; Crooijmans, R.P.M.A.; Affara, N.A.; Amaral, A.J.; Archibald, A.L.; Beever, J.E.; Bendixen, C.; Churcher, C.; Clark, R.; Dehais, P.; et al. Design of a High Density SNP Genotyping Assay in the Pig Using SNPs Identified and Characterized by next Generation Sequencing Technology. PLoS ONE 2009, 4, e6524. [Google Scholar] [CrossRef]
  46. Purcell, S.; Neale, B.; Todd-Brown, K.; Thomas, L.; Ferreira, M.A.R.; Bender, D.; Maller, J.; Sklar, P.; De Bakker, P.I.W.; Daly, M.J.; et al. PLINK: A Tool Set for Whole-Genome Association and Population-Based Linkage Analyses. Am. J. Hum. Genet. 2007, 81, 559–575. [Google Scholar] [CrossRef]
  47. Patterson, N.; Price, A.L.; Reich, D. Population Structure and Eigenanalysis. PLoS Genet. 2006, 2, 2074–2093. [Google Scholar] [CrossRef]
  48. Alexander, D.H.; Novembre, J.; Lange, K. Fast Model-Based Estimation of Ancestry in Unrelated Individuals. Genome Res. 2009, 19, 1655–1664. [Google Scholar] [CrossRef]
  49. Jombart, T. Adegenet: A R Package for the Multivariate Analysis of Genetic Markers. Bioinformatics 2008, 24, 1403–1405. [Google Scholar] [CrossRef]
  50. Frichot, E.; François, O. LEA: An R Package for Landscape and Ecological Association Studies. Methods Ecol. Evol. 2015, 6, 925–929. [Google Scholar] [CrossRef]
  51. Fick, S.E.; Hijmans, R.J. WorldClim 2: New 1-Km Spatial Resolution Climate Surfaces for Global Land Areas. Int. J. Climatol. 2017, 37, 4302–4315. [Google Scholar] [CrossRef]
  52. Brogi, R.; Brivio, F.; Grignolio, S.; Cossu, A.; Apollonio, M. Behavior-Specific Resource Selection of the Sardinian Wild Boar. Manuscr. Prep. 2022. [Google Scholar]
  53. Bian, K.; Zhou, M.; Hu, F.; Lai, W. RF-PCA: A New Solution for Rapid Identification of Breast Cancer Categorical Data Based on Attribute Selection and Feature Extraction. Front. Genet. 2020, 11, 566057. [Google Scholar] [CrossRef] [PubMed]
  54. Oksanen, J.; Blanchet, F.G.; Friendly, M.; Kindt, R.; Legendre, P.; McGlinn, D.; Minchin, P.R.; O’Hara, B.; Simpson, G.L.; Solymos, P.; et al. Vegan: Community Ecology Package. In Package ‘Vegan’; CRAN: Evanston, IL, USA, 2020. [Google Scholar]
  55. Revelle, W. Psych: Procedures for Psychological, Psychometric, and Personality Research; R Package Version 1.0–95; CRAN: Evanston, IL, USA, 2021. [Google Scholar]
  56. Forester, B.R.; Lasky, J.R.; Wagner, H.H.; Urban, D.L. Comparing Methods for Detecting Multilocus Adaptation with Multivariate Genotype—Environment Associations. Mol. Ecol. 2018, 27, 2215–2233. [Google Scholar] [CrossRef] [PubMed]
  57. Zuur, A.F.; Ieno, E.N.; Elphick, C.S. A Protocol for Data Exploration to Avoid Common Statistical Problems. Methods Ecol. Evol. 2010, 1, 3–14. [Google Scholar] [CrossRef]
  58. Legendre, P.; Legendre, L. Numerical Ecology; Elsevier: Amsterdam, The Netherlands, 1998; ISBN 978044453868. [Google Scholar]
  59. Warr, A.; Affara, N.; Aken, B.; Beiki, H.; Bickhart, D.M.; Billis, K.; Chow, W.; Eory, L.; Finlayson, H.A.; Flicek, P.; et al. An Improved Pig Reference Genome Sequence to Enable Pig Genetics and Genomics Research. Gigascience 2020, 9, 1–14. [Google Scholar] [CrossRef]
  60. Cingolani, P.; Platts, A.; Wang, L.L.; Coon, M.; Nguyen, T.; Wang, L.; Land, S.J.; Lu, X.; Ruden, D.M. A Program for Annotating and Predicting the Effects of Single Nucleotide Polymorphisms, SnpEff: SNPs in the Genome of Drosophila Melanogaster Strain W1118; Iso-2; Iso-3. Fly 2012, 6, 80–92. [Google Scholar] [CrossRef]
  61. Lv, F.H.; Agha, S.; Kantanen, J.; Colli, L.; Stucki, S.; Kijas, J.W.; Joost, S.; Li, M.H.; Marsan, P.A. Adaptations to Climate-Mediated Selective Pressures in Sheep. Mol. Biol. Evol. 2014, 31, 3324–3343. [Google Scholar] [CrossRef]
  62. Raudvere, U.; Kolberg, L.; Kuzmin, I.; Arak, T.; Adler, P.; Peterson, H.; Vilo, J. G:Profiler: A Web Server for Functional Enrichment Analysis and Conversions of Gene Lists (2019 Update). Nucleic Acids Res. 2019, 47, 191–198. [Google Scholar] [CrossRef]
  63. Howe, K.L.; Achuthan, P.; Allen, J.; Allen, J.; Alvarez-Jarreta, J.; Amode, M.R.; Armean, I.M.; Azov, A.G.; Bennett, R.; Bhai, J.; et al. Ensembl 2021. Nucleic Acids Res. 2021, 49, D884–D891. [Google Scholar] [CrossRef]
  64. Gros, R.; Van Uum, S.; Hutchinson-Jaffe, A.; Ding, Q.; Pickering, J.G.; Hegele, R.A.; Feldman, R.D. Increased Enzyme Activity and β-Adrenergic-Mediated Vasodilation in Subjects Expressing a Single-Nucleotide Variant of Human Adenylyl Cyclase 6. Arterioscler. Thromb. Vasc. Biol. 2007, 27, 2657–2663. [Google Scholar] [CrossRef]
  65. Singh, U.; Sun, T.; Looman, C.; Heuchel, R.; Elliott, R.; Freichel, M.; Meissner, M.; Flockerzi, V.; Fundele, R. Expression and Function of the Gene Encoding the Voltage-Dependent Calcium Channel Β3-Subunit in the Mouse Placenta. Placenta 2007, 28, 412–420. [Google Scholar] [CrossRef] [PubMed]
  66. De Chu, Y.; Chen, H.K.; Huang, T.; Chan, S.P. A Novel Function for the DEAD-Box RNA Helicase DDX-23 in Primary MicroRNA Processing in Caenorhabditis elegans. Dev. Biol. 2016, 409, 459–472. [Google Scholar] [CrossRef]
  67. Nobes, C.D.; Lauritzen, I.; Mattei, M.G.; Paris, S.; Hall, A.; Chardin, P. A New Member of the Rho Family, Rnd1, Promotes Disassembly of Actin Filament Structures and Loss of Cell Adhesion. J. Cell Biol. 1998, 141, 187–197. [Google Scholar] [CrossRef] [PubMed]
  68. Ren, G.; Vajjhala, P.; Lee, J.S.; Winsor, B.; Munn, A.L. The BAR Domain Proteins: Molding Membranes in Fission, Fusion, and Phagy. Microbiol. Mol. Biol. Rev. 2006, 70, 37–120. [Google Scholar] [CrossRef] [PubMed]
  69. Bassett, J.H.D.; Gogakos, A.; White, J.K.; Evans, H.; Jacques, R.M.; van der Spek, A.H.; Ramirez-Solis, R.; Ryder, E.; Sunter, D.; Boyde, A.; et al. Rapid-Throughput Skeletal Phenotyping of 100 Knockout Mice Identifies 9 New Genes That Determine Bone Strength. PLoS Genet. 2012, 8, e1002858. [Google Scholar] [CrossRef] [PubMed]
  70. Wang, H.; Wang, C.; Yang, K.; Liu, J.; Zhang, Y.; Wang, Y.; Xu, X.; Michal, J.J.; Jiang, Z.; Liu, B. Genome Wide Distributions and Functional Characterization of Copy Number Variations between Chinese and Western Pigs. PLoS ONE 2015, 10, e0131522. [Google Scholar] [CrossRef]
  71. Zhang, X.; Sun, W.; He, L.; Wang, L.; Qiu, K.; Yin, J. Global DNA Methylation Pattern Involved in the Modulation of Differentiation Potential of Adipogenic and Myogenic Precursors in Skeletal Muscle of Pigs. Stem Cell Res. Ther. 2020, 11, 536. [Google Scholar] [CrossRef]
  72. Tafforeau, L.; Chantier, T.; Pradezynski, F.; Pellet, J.; Mangeot, P.E.; Vidalain, P.-O.; Andre, P.; Rabourdin-Combe, C.; Lotteau, V. Generation and Comprehensive Analysis of an Influenza Virus Polymerase Cellular Interaction Network. J. Virol. 2011, 85, 13010–13018. [Google Scholar] [CrossRef]
  73. Alonso, I.; Ibáñez-Escriche, N.; Noguera, J.L.; Casellas, J.; de Hijas-Villalba, M.M.; Gracia-Santana, M.J.; Varona, L. Genomic Differentiation among Varieties of Iberian Pig. Span. J. Agric. Res. 2020, 18, e0401. [Google Scholar] [CrossRef]
  74. Tang, Z.; Yang, Y.; Wang, Z.; Zhao, S.; Mu, Y.; Li, K. Integrated Analysis of MiRNA and MRNA Paired Expression Profiling of Prenatal Skeletal Muscle Development in Three Genotype Pigs. Sci. Rep. 2015, 5, 15544. [Google Scholar] [CrossRef]
  75. Mochida, G.H.; Ganesh, V.S.; Felie, J.M.; Gleason, D.; Hill, R.S.; Clapham, K.R.; Rakiec, D.; Tan, W.H.; Akawi, N.; Al-Saffar, M.; et al. A Homozygous Mutation in the Tight-Junction Protein JAM3 Causes Hemorrhagic Destruction of the Brain, Subependymal Calcification, and Congenital Cataracts. Am. J. Hum. Genet. 2010, 87, 882–889. [Google Scholar] [CrossRef] [PubMed] [Green Version]
  76. Santoso, S.; Sachs, U.J.H.; Kroll, H.; Linder, M.; Ruf, A.; Preissner, K.T.; Chavakis, T. The Junctional Adhesion Molecule 3 (JAM-3) on Human Platelets Is a Counterreceptor for the Leukocyte Integrin Mac-1. J. Exp. Med. 2002, 196, 679–691. [Google Scholar] [CrossRef] [PubMed]
  77. Arrate, M.P.; Rodriguez, J.M.; Tran, T.M.; Brock, T.A.; Cunningham, S.A. Cloning of Human Junctional Adhesion Molecule 3 (JAM3) and Its Identification as the JAM2 Counter-Receptor. J. Biol. Chem. 2001, 276, 45826–45832. [Google Scholar] [CrossRef]
  78. Kulkarni, S.; Sitaru, C.; Jakus, Z.; Anderson, K.E.; Damoulakis, G.; Davidson, K.; Hirose, M.; Juss, J.; Oxley, D.; Chessa, T.A.M.; et al. PI3Kβ Plays a Critical Role in Neutrophil Activation by Immune Complexes. Sci. Signal. 2011, 4, ra23. [Google Scholar] [CrossRef] [PubMed]
  79. Huo, J.; Xu, S.; Lam, K.P. Faim: An Antagonist of Fas-Killing and Beyond. Cells 2019, 8, 541. [Google Scholar] [CrossRef]
  80. Takeuchi, A.; Badr, M.E.S.G.; Miyauchi, K.; Ishihara, C.; Onishi, R.; Guo, Z.; Sasaki, Y.; Ike, H.; Takumi, A.; Tsuji, N.M.; et al. CRTAM Determines the CD4+ Cytotoxic T Lymphocyte Lineage. J. Exp. Med. 2016, 213, 123–138. [Google Scholar] [CrossRef]
  81. Fuller, J.; Ferchaud, A.-L.; Laporte, M.; Le Luyer, J.; Davis, T.B.; Côté, S.D.; Bernatchez, L. Absence of Founder Effect and Evidence for Adaptive Divergence in a Recently Introduced Insular Population of White-Tailed Deer (Odocoileus Virginianus). Mol. Ecol. 2019, 29, 86–104. [Google Scholar] [CrossRef]
  82. Biello, R.; Zampiglia, M.; Fuselli, S.; Fabbri, G.; Bisconti, R.; Chiocchio, A.; Mazzotti, S.; Trucchi, E.; Canestrelli, D.; Bertorelle, G. From STRs to SNPs via DdRAD-Seq: Geographic Assignment of Confiscated Tortoises at Reduced Costs. bioRxiv 2022. Evolutionary application is the journal. [Google Scholar] [CrossRef]
  83. Cayuela, H.; Rougemont, Q.; Laporte, M.; Mérot, C.; Normandeau, E.; Dorant, Y.; Tørresen, O.K.; Hoff, S.N.K.; Jentoft, S.; Sirois, P.; et al. Shared Ancestral Polymorphisms and Chromosomal Rearrangements as Potential Drivers of Local Adaptation in a Marine Fish. Mol. Ecol. 2020, 29, 2379–2398. [Google Scholar] [CrossRef]
  84. Flanagan, S.P.; Forester, B.R.; Latch, E.K.; Aitken, S.N.; Hoban, S. Guidelines for Planning Genomic Assessment and Monitoring of Locally Adaptive Variation to Inform Species Conservation. Evol. Appl. 2018, 11, 1035–1052. [Google Scholar] [CrossRef]
  85. Gibson, M.J.S.; Moyle, L.C. Regional Differences in the Abiotic Environment Contribute to Genomic Divergence within a Wild Tomato Species. Mol. Ecol. 2020, 29, 2204–2217. [Google Scholar] [CrossRef] [PubMed]
  86. Massei, G.; Kindberg, J.; Licoppe, A.; Gačić, D.; Šprem, N.; Kamler, J.; Baubet, E.; Hohmann, U.; Monaco, A.; Ozoliņš, J.; et al. Wild Boar Populations up, Numbers of Hunters down? A Review of Trends and Implications for Europe. Pest Manag. Sci. 2015, 71, 492–500. [Google Scholar] [CrossRef] [PubMed]
  87. Stern, D.B.; Lee, C.E. Evolutionary Origins of Genomic Adaptations in an Invasive Copepod. Nat. Ecol. Evol. 2020, 4, 1084–1094. [Google Scholar] [CrossRef] [PubMed]
  88. Viscardi, L.H.; Paixão-Côrtes, V.R.; Comas, D.; Salzano, F.M.; Rovaris, D.; Bau, C.D.; Amorim, C.E.G.; Bortolini, M.C. Searching for Ancient Balanced Polymorphisms Shared between Neanderthals and Modern Humans. Genet. Mol. Biol. 2018, 41, 67–81. [Google Scholar] [CrossRef]
  89. Groenen, M.A.M.; Archibald, A.L.; Uenishi, H.; Tuggle, C.K.; Takeuchi, Y.; Rothschild, M.F.; Rogel-Gaillard, C.; Park, C.; Milan, D.; Megens, H.J.; et al. Analyses of Pig Genomes Provide Insight into Porcine Demography and Evolution. Nature 2012, 491, 393–398. [Google Scholar] [CrossRef]
  90. Franks, S.J.; Hoffmann, A.A. Genetics of Climate Change Adaptation. Annu. Rev. Genet. 2012, 46, 185–208. [Google Scholar] [CrossRef]
  91. Peng, W.F.; Xu, S.S.; Ren, X.; Lv, F.H.; Xie, X.L.; Zhao, Y.X.; Zhang, M.; Shen, Z.Q.; Ren, Y.L.; Gao, L.; et al. A Genome-Wide Association Study Reveals Candidate Genes for the Supernumerary Nipple Phenotype in Sheep (Ovis aries). Anim. Genet. 2017, 48, 570–579. [Google Scholar] [CrossRef]
  92. Arakawa, A.; Okumura, N.; Taniguchi, M.; Hayashi, T.; Hirose, K.; Fukawa, K.; Ito, T.; Matsumoto, T.; Uenishi, H.; Mikawa, S. Genome-Wide Association QTL Mapping for Teat Number in a Purebred Population of Duroc Pigs. Anim. Genet. 2015, 46, 571–575. [Google Scholar] [CrossRef]
  93. Gardner, J.L.; Peters, A.; Kearney, M.R.; Joseph, L.; Heinsohn, R. Declining Body Size: A Third Universal Response to Warming? Trends Ecol. Evol. 2011, 26, 285–291. [Google Scholar] [CrossRef]
  94. Zhao, X.; Mo, D.; Li, A.; Gong, W.; Xiao, S.; Zhang, Y.; Qin, L.; Niu, Y.; Guo, Y.; Liu, X.; et al. Comparative Analyses by Sequencing of Transcriptomes during Skeletal Muscle Development between Pig Breeds Differing in Muscle Growth Rate and Fatness. PLoS ONE 2011, 6, e19774. [Google Scholar] [CrossRef]
  95. Savoldi, I.R.; Ibelli, A.M.G.; Cantão, M.E.; de Peixoto, J.O.; Pires, M.P.; Mores, M.A.Z.; Lagos, E.B.; Lopes, J.S.; Zanella, R.; Ledur, M.C. A Joint Analysis Using Exome and Transcriptome Data Identifies Candidate Polymorphisms and Genes Involved with Umbilical Hernia in Pigs. BMC Genom. 2021, 22, 818. [Google Scholar] [CrossRef] [PubMed]
  96. Ben-Jemaa, S.; Senczuk, G.; Ciani, E.; Ciampolini, R.; Catillo, G.; Boussaha, M.; Pilla, F.; Portolano, B.; Mastrangelo, S. Genome-Wide Analysis Reveals Selection Signatures Involved in Meat Traits and Local Adaptation in Semi-Feral Maremmana Cattle. Front. Genet. 2021, 12, 675569. [Google Scholar] [CrossRef] [PubMed]
  97. Scandura, M.; Iacolina, L.; Apollonio, M. Genetic Diversity in the European Wild Boar Sus scrofa: Phylogeography, Population Structure and Wild x Domestic Hybridization. Mamm. Rev. 2011, 41, 125–137. [Google Scholar] [CrossRef]
  98. Maselli, V.; Rippa, D.; De Luca, A.; Larson, G.; Wilkens, B.; Linderholm, A.; Masseti, M.; Fulgione, D. Southern Italian Wild Boar Population, Hotspot of Genetic Diversity. Hystrix It. J. Mammal. 2016, 27, 137–144. [Google Scholar] [CrossRef]
  99. Frantz, L.A.F.; Haile, J.; Lin, A.T.; Scheu, A.; Geörg, C.; Benecke, N.; Alexander, M.; Linderholm, A.; Mullin, V.E.; Daly, K.G.; et al. Ancient Pigs Reveal a Near-Complete Genomic Turnover Following Their Introduction to Europe. Proc. Natl. Acad. Sci. USA 2020, 117, 14610–14611. [Google Scholar] [CrossRef]
  100. Fuller, A.; Mitchell, D.; Maloney, S.K.; Hetem, R.S. Towards a Mechanistic Understanding of the Responses of Large Terrestrial Mammals to Heat and Aridity Associated with Climate Change. Clim. Chang. Responses 2016, 3, 10. [Google Scholar] [CrossRef] [Green Version]
Figure 1. Sampling locations for the ninety-six Sardinian wild boars analyzed in this study. Samples collected in the same municipality are grouped in rings. Individuals excluded because of the initial quality filters are shown in red; the two individuals in the northwest excluded after the population structure analysis are shown in orange; the final dataset for the local adaptation tests is shown in green.
Diversity 14 00774 g001
Figure 2. Population structure of 83 Sardinian wild boar. (a,b) First four axes from principal component analysis (PCA), with the percentage of variance summarized by each axis in parentheses. PC1 and PC2 describe the strongest pattern in the data, while PC3 and PC4 describe finer differentiation within the southwestern and eastern clusters; (c) individual assignment to three genetic clusters according to ADMIXTURE analysis. The two individuals from Nurra that were removed from subsequent analyses are circled in Figure 2a to highlight their positioning with respect to the northwestern and eastern subpopulations, and flagged with an asterisk in Figure 2c.
Diversity 14 00774 g002
Figure 3. First (RDA1) and second (RDA2) axes from (a) simple RDA and (b) partial RDA on 81 Sardinian wild boars and 13,290 SNPs; (c) variance partitioning between the environmental and the genetic structure components (c). NE: northeastern subpopulation; CSE: central and southestern subpopulation; NW: northwestern subpopulation; SW: southwestern subpopulation.
Diversity 14 00774 g003
Figure 4. Distribution of test statistics for each SNP of the dataset (13,290 SNPs). (a) Manhattan plot of the outlier analysis conducted on pcadapt, considering the first four PCs to correct for population structure. (be) Manhattan plot of the univariate landscape genomics analyses conducted with LFMM. Results are shown for K = 4 to correct for population structure. As a univariate analysis, each environmental variable is considered separately. (f,g) Manhattan plot for the multivariate landscape genomics analyses conducted with constrained RDA to correct for population structure. (h) Venn diagram showing the intersection of the SNP outliers identified by the three different methods. Forty-nine SNPs (in green in each Manhattan plot) were identified by at least two methods and thus considered as candidates for local adaptation; (i) distribution of the 49 candidate loci across the Sus scrofa genome.
Diversity 14 00774 g004
Table 1. Environmental variables considered in this study.
Variable NameDescriptionSource
Bio4Temperature Seasonality
(standard deviation ×100)
Worldclim2
Bio5Max Temperature of Warmest MonthWorldclim2
Bio9Mean Temperature of Driest QuarterWorldclim2
Bio10Mean Temperature of Warmest QuarterWorldclim2
Bio12Annual PrecipitationWorldclim2
Bio15Precipitation Seasonality
(Coefficient of Variation)
Worldclim2
Bio16Precipitation of Wettest QuarterWorldclim2
Bio17Precipitation of Driest QuarterWorldclim2
Bio18Precipitation of Warmest QuarterWorldclim2
ElevationElevation derived from the SRTM dataWorldclim2
Shannon IndexDiversity index calculated on land use categoriesSardegnaGeoportale
Publisher’s Note: MDPI stays neutral with regard to jurisdictional claims in published maps and institutional affiliations.

