Article

Assessment of Genetic Diversity and Discovery of Molecular Markers in Durian (Durio zibethinus L.) in China

Haikou Experimental Station, Chinese Academy of Tropical Agricultural Sciences, Haikou 571101, China
*
Author to whom correspondence should be addressed.
Diversity 2022, 14(9), 769; https://doi.org/10.3390/d14090769
Submission received: 13 August 2022 / Revised: 10 September 2022 / Accepted: 13 September 2022 / Published: 17 September 2022

Abstract

:
Durian (Durio zibethinus L.) is a crop of economic and health importance globally. Efforts are being made to revamp China’s only successful commercial-scale durian plantations in Hainan; however, their genetic base is unknown. Therefore, the present study was undertaken to assess the genetic base and population structure of 32 genotypes in durian plantation sites in Hainan, China, and develop simple sequence repeat (SSR) markers by whole genome sequencing through restriction site-associated DNA sequencing technology to facilitate germplasm conservation and breeding. The results from identity by state (IBS), phylogenetic tree, population structure, and principal component analysis grouped the 32 genotypes into two clusters/sub-populations. Based on IBS, genotypes in Cluster I are largely duplicated genotypes; however, results from the model-based population structure demonstrated that most of the genotypes in Sub-population II shared a common genetic background with those in Sub-population I/Cluster I. The results revealed that the core durian collection in the plantation sites in Hainan include D24, D101, MSW, JH, D163, HFH, and NLX-5. In addition, we developed a total of 79,178 SSR markers with varied lengths and amplicon sizes. The genetic diversity and population structure reported in this study will be useful for durian conservation and utilization. In addition, the discovered and developed SSR markers will lay the foundation for molecular breeding via marker-assisted selection, quantitative trait loci mapping, and candidate gene discovery and validation.

1. Introduction

Plant breeding has made a profound impact on food production and increased the economic value of crops, and will continue to play a vital role in the global drive for food, nutritional, and income security [1]. Germplasm collection is a vital component of the success of plant breeding programs and the development of superior cultivars [2,3]. Traditional breeding is often used to improve the yield and quality of several crops, including durian (Durio zibethinus L.), with the disadvantages including long cultivation, slow reproduction cycle and complex nature of traits of economic importance [4]. In the past decades, the advent of genotyping and the reduction in its cost by next-generation sequencing (NGS)-based genotyping methods have made whole-genome sequencing (WGS) and resequencing feasible for numerous crops including durian [5,6,7]. This progress made molecular breeding more feasible in several crops in recent years [8,9,10,11,12].
Durian is a crop of economic importance and originated from Southeast Asia [4], with the three leading durian-producing countries: Thailand, Malaysia, and Indonesia [7]. Durian is well known in the Southeast Asia as the “King of Fruits” [13] and the “Heaven and Hell Fruit” [4] because of its formidable spiny husk, admirable flavor, and unique odor, which is noted as an onion-like, sulfury aroma of sweet fruitiness and savory soup seasoning [14]. In economic terms, Thailand’s durian generated export earnings of USD 2.08 billion, representing 75.31% of the global durian exports in 2020, according to data by Tridge Intelligence (https://www.dhl.com/discover/en-my/business/market-intelligence/The-Rise-of-Global-Market-Demand-for-Durians-Musang-King-Black-Thorn-and-More, accessed on 17 July 2022). Fresh durian imports into China reached 822,000 metric tons and USD 4.21 billion in 2021, representing year-on-year increases of 42.7 and 82.4%, respectively (https://www.producereport.com/article/guangdong-provinces-first-durian-orchard-fruiting, accessed on 17 July 2022). Aside from its economic importance, it contains different bioactive compounds that are beneficial to human health [4,15].
At present, Thailand is the only country mandated to export fresh durians to China. In an attempt to reduce importation of this bestselling fruit (durian) in China, efforts are being made to revamp China’s only successful commercial-scale durian plantations in Hainan, an island in the South China Sea situated southwest from Guangdong with a size of more than 2000 hectares. Globally, the genus Durio has 28 species, out which 19 are native to the island of Borneo, recognized as the original center of diversity [4]. Of the 19, at present, only six species are known in Thailand [4], whereas 16 species are found on Kalimantan, an Indonesian island well documented as having the highest durian genetic diversity [16]. The durian is a tropical fruit tree in the order Malvales, family Malvaceae. Even though some earlier taxonomists originally placed Durio in the family Bombacaceae, recent molecular data have placed it in the expanded Malvaceae, which includes the former members of the Bombacaceae [4].
In the past, attempts were made to characterize durian germplasm and its relatives via morphological markers. However, this is inefficient due to multigenic interaction and is heavily affected by environmental factors [17,18,19,20]. Mursyidin, et al. [21] characterized 18 exotic Durio spp. in Indonesia with ribulose-1, 5-bisphosphate carboxylase/oxygenase or rbcL markers, which separated the germplasm into four main clades and six groups by phylogenetic and principal component analyses, respectively. To facilitate molecular breeding, the draft genome of durian was released by [7] with a size of 800 Mb and with nearly 54.8% repeated genomic regions.
At present, thirty-two durians are available in the durian plantations in Hainan, China, with some having the same names but looking morphologically different (Table 1), whereas others exhibit other differences. This may be due to duplication of germplasm collection coupled with the unknown genetic bases of these genotypes. Therefore, the present study was undertaken by sequencing the 32 genotypes with restriction site-associated DNA sequencing (RAD-seq) to assess the genetic diversity and develop molecular markers to efficiently and effectively speed up Durio breeding programs in China. The findings from this study will be useful in selecting a small subset of germplasm that represents the maximum proportion of genetic diversity present in the entire collection [3,10]. The molecular markers (i.e., single nucleotide polymorphisms (SNPs) and simple sequence repeats (SSRs) will be useful for mapping studies, candidate gene identification, and verification experiments [2,11].

2. Materials and Methods

2.1. Plant Materials, Leaf Characterization, and DNA Isolation

Thirty-two genotypes of durian are planted in Hainan, specifically, Baoting (108°32′ E, 19°98′ N) and Ledong (108°48′ E, 18°37′ N) planting sites. The origins and actual names of the genotypes are largely unknown. The leaf shape, length, width, petiole length, ground diameter, and leaf veins pairs were measured by LAMINA (Leaf shApe deterMINAtion) [22].
The fresh and young leaves of the same age were sampled and frozen in liquid nitrogen for DNA extraction and sequencing. The genomic DNA from the 32 genotypes was isolated following the manufacturer’s protocol from a DNA quick plant system (TIANGEN) of Biotech (Beijing) Co. Ltd., Beijing, China. The quality and concentration of the isolated DNA were assessed by a Nano Drop 2000 Spectrophotometer (Thermo Scientific, Wilmington, DC, USA).

2.2. RAD-Seq and SNP Calling

The genomic DNAs from the 32 genotypes were used to create a RAD library where total the DNAs were digested with MseI before sequencing using Illumina NovaseqPE150TM, 10X depth by Novogene CO., Ltd. (Beijing, China). Trimmomatic software, version 0.32 [23] was used to delete the adapter sequences of the raw reads from the sequencing platform [24]. The raw reads with more than 10% N content of the read length ratio and low-quality reads were removed. Clean data with high quality were obtained after strict filtering and quality control of raw reads.
The BWA software (version 0.7.10) [25] was used to align the high-quality sequencing data to the draft reference genome of durian (D. zibethinus L.) [7], and after this analysis, duplicated reads were removed with the help of the SAMtools application [25]. Moreover, the SAMtools genotype likelihood model with the “doSaf” parameter was used to estimate genome-level DNA sequence polymorphisms caused as a result of single nucleotide variations or single nucleotide polymorphisms (SNPs), including single-base transitions and transversions, and the location of SNPs (either exon, intron, or intergenic regions). ANNOVAR software [26] was used to annotate the SNPs, and thus to identify locations of the detected SNPs.

2.3. Population Structure and Genetic Diversity Analyses

Population structure and identity by state (IBS) were computed using PLINK (V1.90) [27]. The optimum K was estimated with K = 2–8 runs in ADMIXTURE software [28] to obtain the cross-validation (CV) error curve. The IBS matrices obtained were heatmapped with the Pheatmap package in R [29]. The phylogenetic tree with the neighbor-joining (NJ) method was constructed in TASSEL 5.2.31 [30] and further visualized in Molecular Evolutionary Genetics Analysis (MEGA) software version 9 [31]. In addition, principal component analysis (PCA) based on the SNPs generated was performed using the R package SNPRelate [32].

2.4. SSR Identification and Primer Design

The MicroSAtellite (MISA) web server available on http://misaweb.ipk-gatersleben.de/ (accessed on 15 June 2021) was used to screen the sequences from the 32 genotypes for microsatellite repeat motifs [33] in which mononucleotide repeats were removed from the search criteria. The search criteria comprised the following series of parameters 2, 3, 4, 5, and 6 repeats for di-, tri-, tetra-, penta-, and hexa-repeat types, respectively. The primer pairs were designed using Primer3Plus software program [34] with stringent criteria of the amplicon size between 80 and 300 bp. All designed primer pairs were optimized before obtaining the best annealing temperature of the amplification process.

3. Results

3.1. Summary of Sequencing and SNP Characteristics

Thirty-two durian accessions were assessed in this study. They displayed morphological variations as exemplified by the leaf traits measured (Table 1). Some genotypes have the same names but look morphologically different. Leaf samples were used for RAD-seq and a total data size of 39 Gb was obtained. Among the 32 genotypes, the total reads ranged from 6,676,842 bp in genotype LD-4 to 9,425,272 bp in genotype NLX-7, with an average of 8,136,297 reads (Supplementary Table S1) with guanine-cytosine (GC) content of 34.95–35.12. From the clean reads, an average of 7,198,688 bp (≈88.46%) were successfully mapped to the draft reference genome [7] with an approximate depth of 9.96 (average). These output statistics indicate high sequencing quality, making the sequencing data reliable for further downstream analysis.
SAMtools software was utilized to detect SNPs in the D. zibethinus sequencing data, leading to a total of 232,148 SNPs; of these, 7765 (3.36%) and 8817 (3.80%) were detected in upstream and downstream, respectively, while the highest proportion (152,272, 65.59%) was detected in intergenic regions (Table 2). Furthermore, among the SNPs detected in the exonic regions, 0.05, 0.02, 3.41, and 4.53% resulted in stop gain (resulting in a premature termination codon), stop loss (single base-pair exchanges that happen within translational termination codons which could result in the continued translation of the messenger RNA into the 3′ UTR), synonymous (amino acids in the coding region are not changed) and non-synonymous (amino acids in the coding region changed), respectively (Table 2). The transition (ts) and transversion (tv) ratio (ts/tv) among the 32 genomes was 2.005 (Table 2; this ratio has been computed in several genetic studies as a quality control criterion as a way of understanding the patterns of DNA sequence evolution [35,36,37].

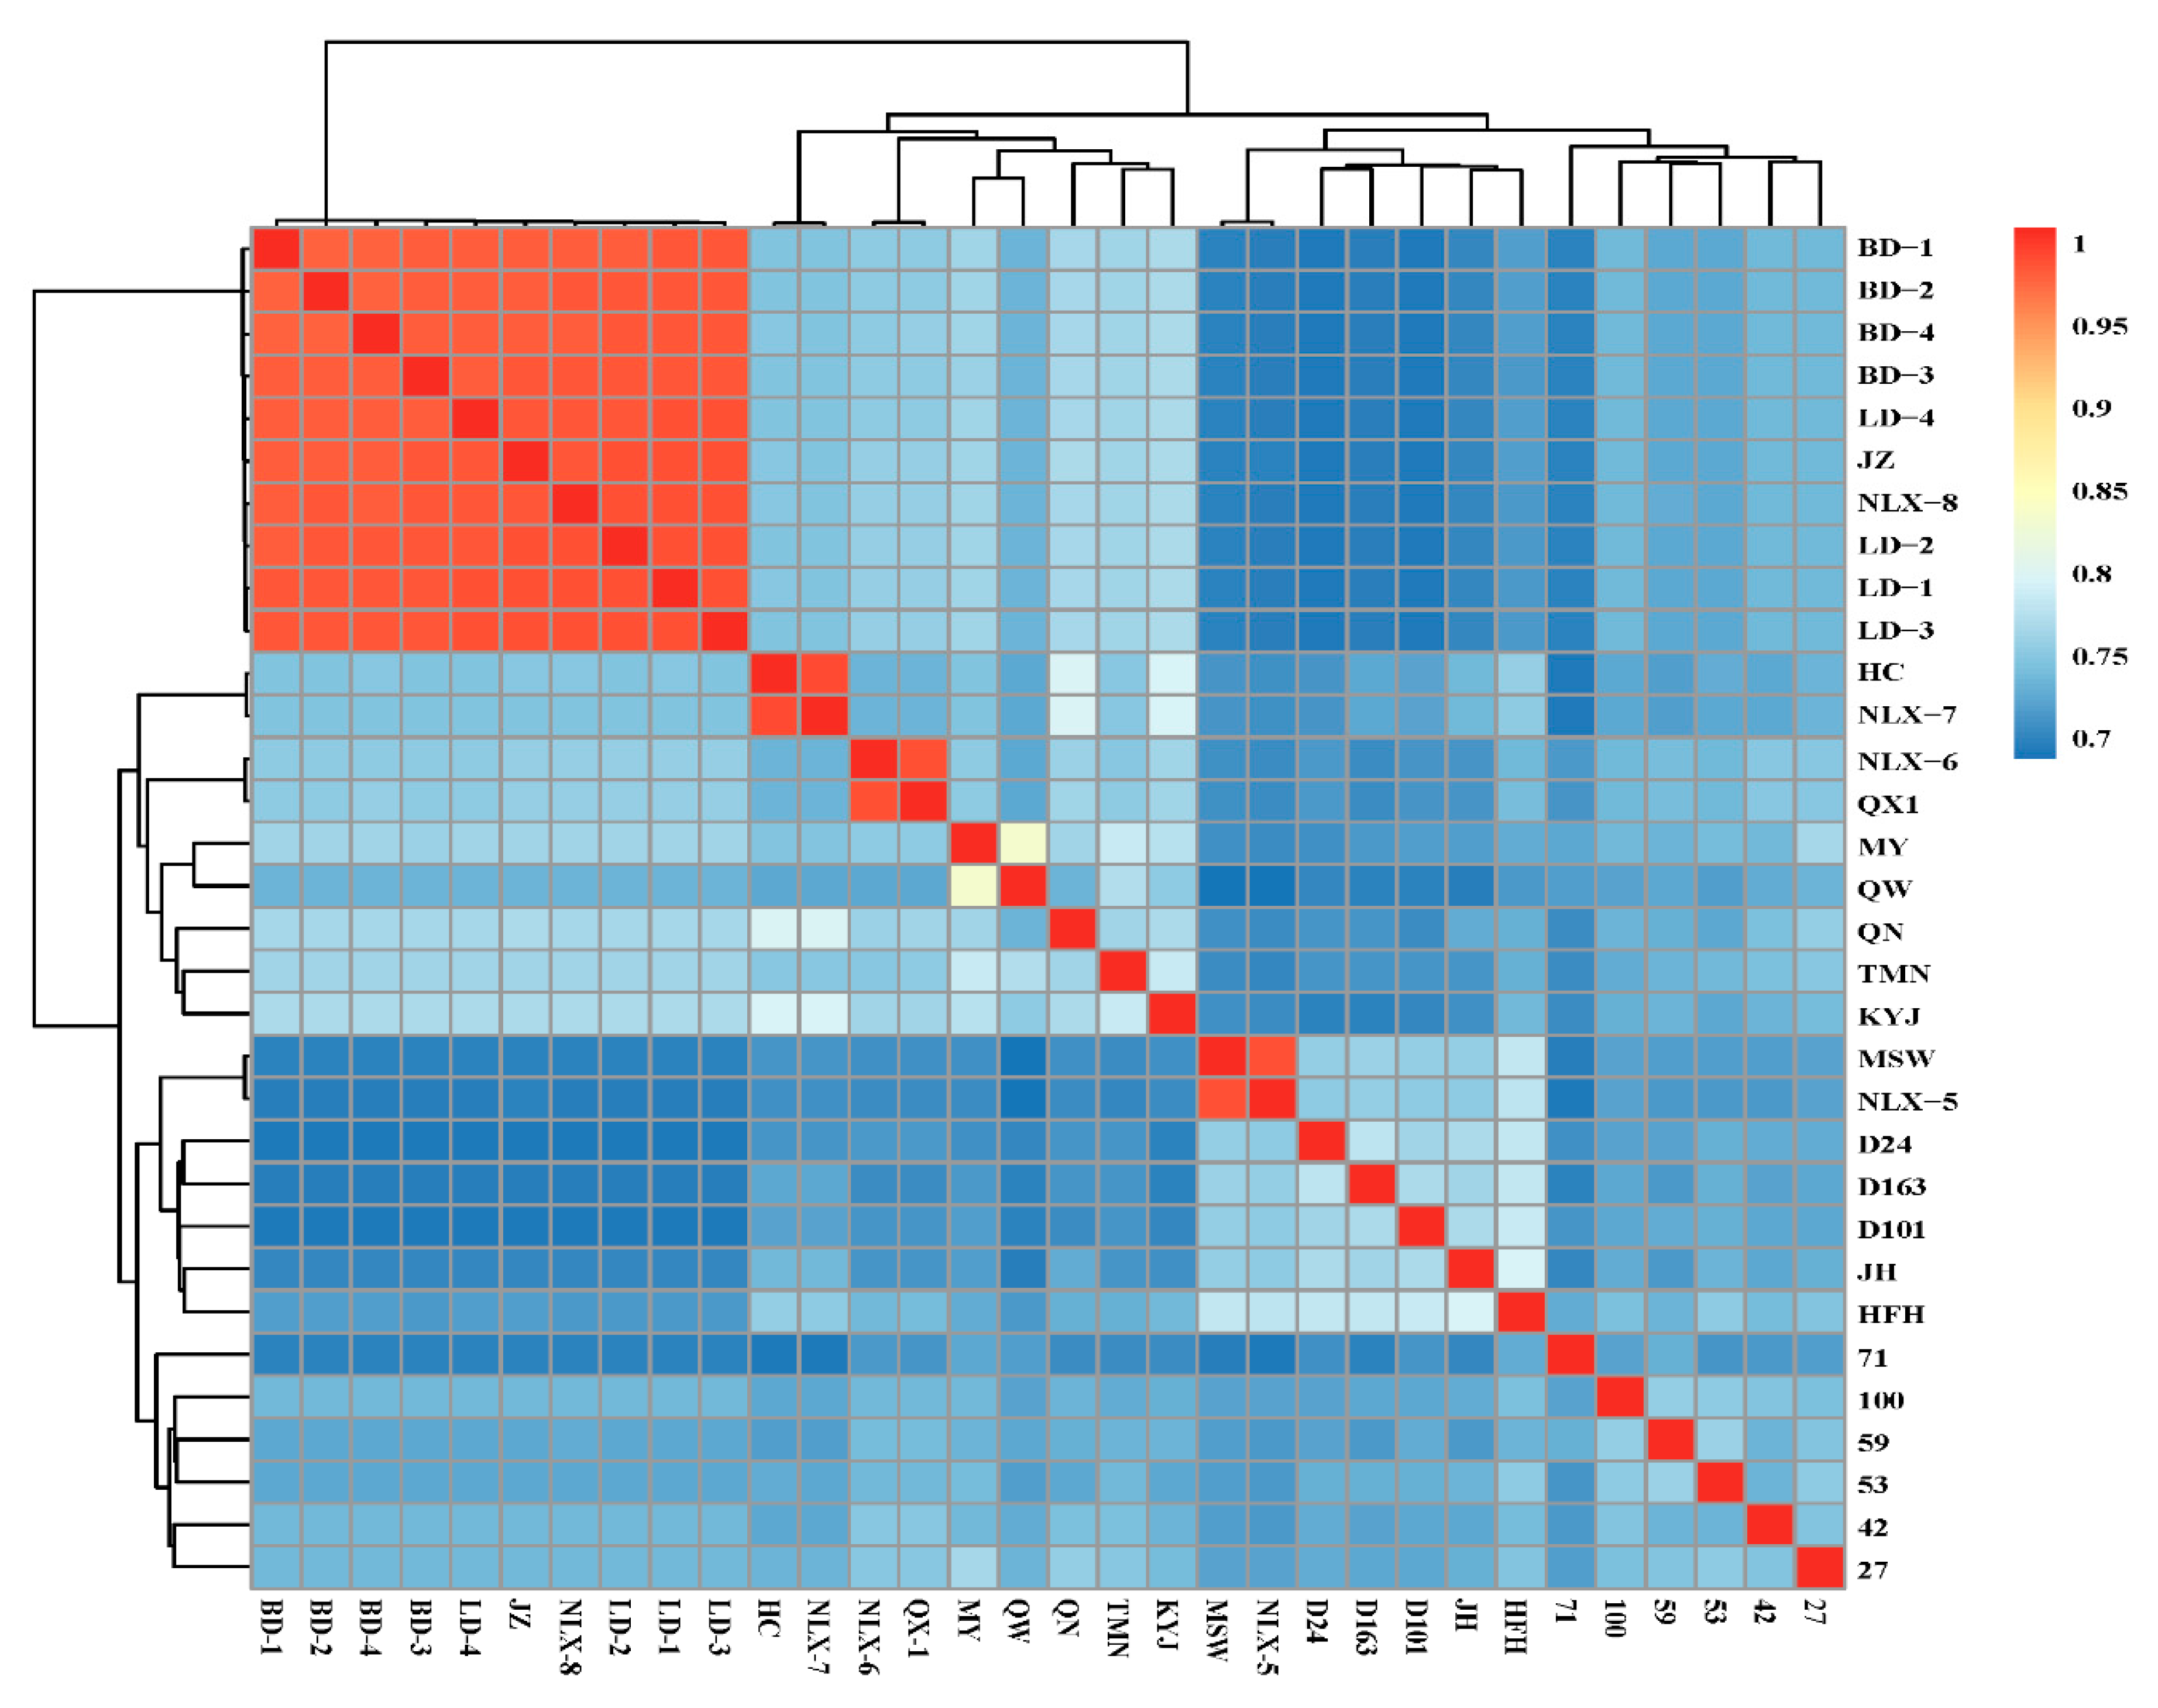
3.2. Genetic Distance of the Conserved Population of the 32 Durian Accessions

The 232,148 SNPs were pruned by the in-depth-pairwise command option of PLINK leaving a total of 117,006 SNPs for the estimation of IBS. This matrix estimates the consistency of all genetic markers [38]. The IBS matrix when heatmapped divided the 32 genotypes into two groups. Group 1 comprised BD-1, BD-2, BD-3, BD-4, JZ, NLX-8, LD-1, LD-2, LD-3, and LD-4 genotypes, while Group 2 consisted of the remaining 22 genotypes (HC, NLX-7, NLX-6, QX-1, MY, QW, QN, TMM, KYJ, MSW, NLX-5, D24, D163, D101, JH, HFH, 71, 100, 59, 53, 42, and 27) (Figure 1). The high values of IBS (≥0.70) suggest a high probability of familial relationships among the 32 genotypes. For instance, the 10 genotypes in Group 1 mostly have IBS of almost 1 in pairwise comparison, suggesting that these genotypes are likely to be the same. By comparison, those from Group 2—three pairwise genotypes, i.e., MSW and NLX-5; QX1 and NLX-6, and HC and NLX-7—had IBS = 0.98 ≈ 1.00, indicating that these pairwise genotypes are identical.

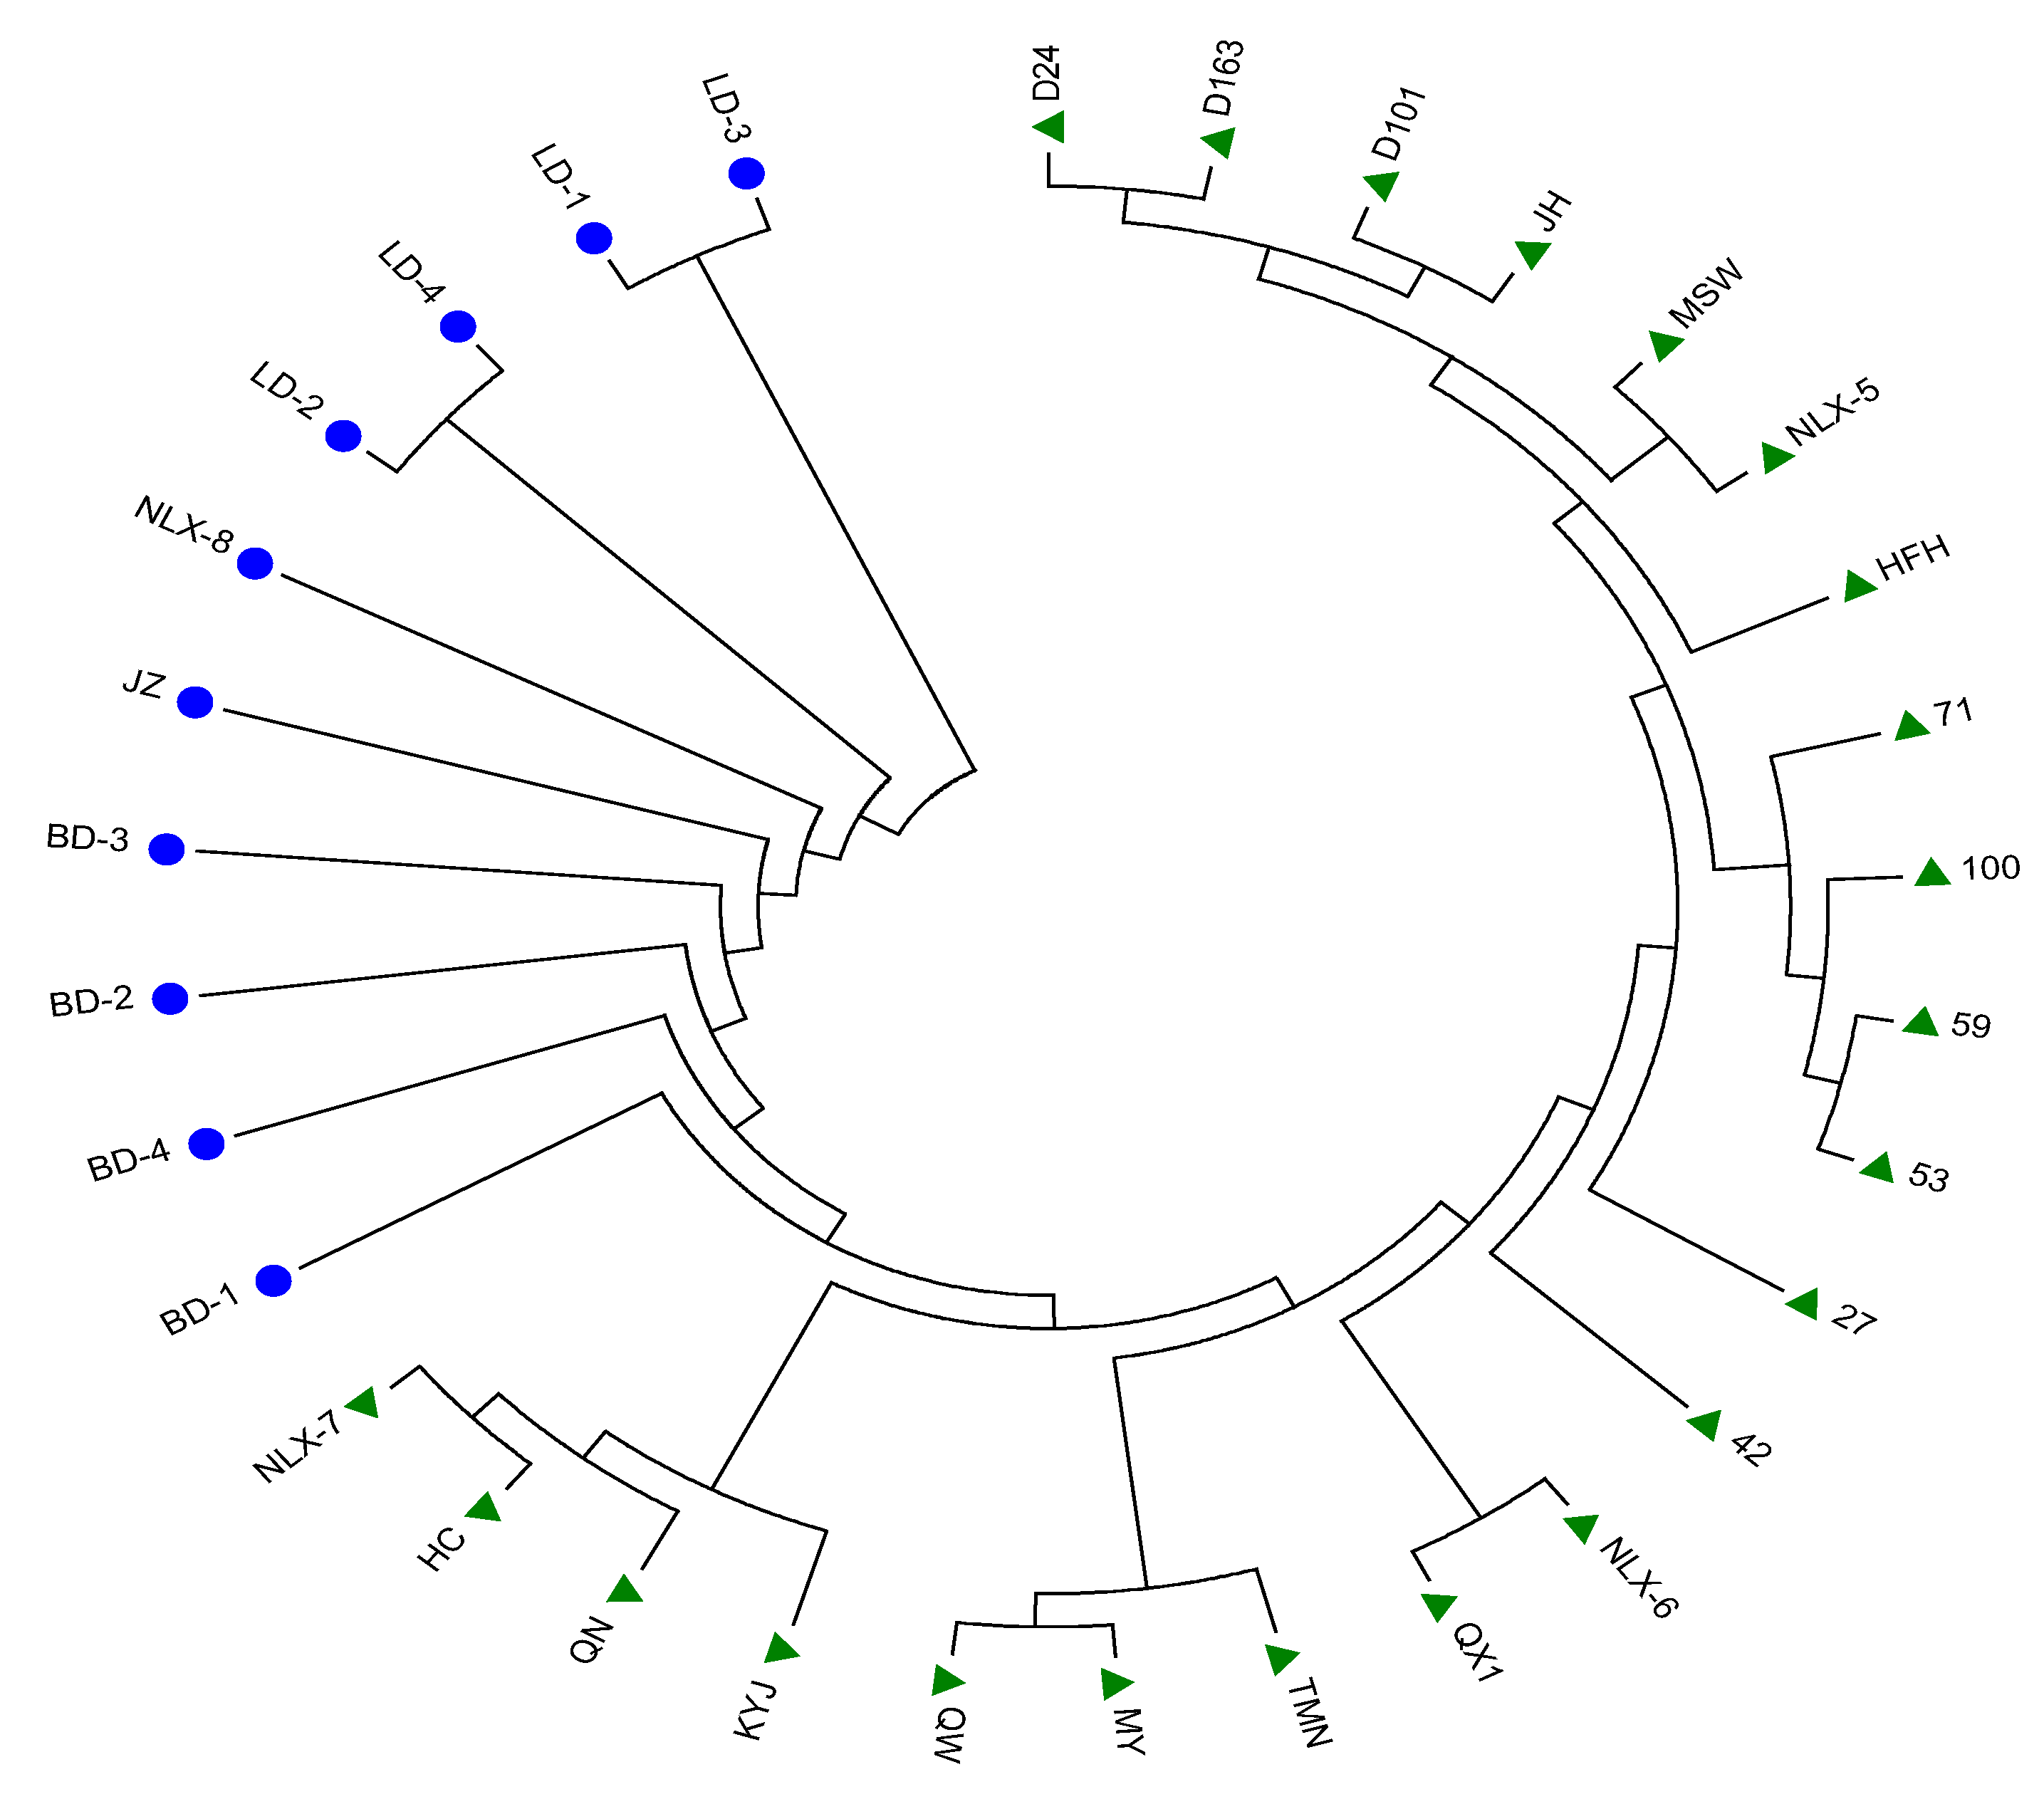
3.3. Phylogenetic Tree

We further constructed the NJ phylogenetic tree based on the whole-genome-based SNPs to evaluate genetic relationship among the 32 genotypes of durian. The 32 genotypes of durian were divided into two major clades (Figure 2). Clade I (blue node) comprised the 10 genotypes clustered together in the IBS heatmap (Figure 1) with BD-1 farther from BD-2, BD-3, and BD-4, indicating these genotypes seem relatively identical with some level genetic differentiation. The farther part of Clade I comprised LD-2 and LD-4 together with LD-1 and LD-3. Again, the JZ and NLX-8 genotypes were between the BD and LD genotypes, suggesting that JZ and NLX-8 share some similarities with the other two groups of genotypes in Clade I (Figure 2).
Clade II (green node) consisted of the 22 genotypes subdivided into three sub-clades (Figure 2). Sub-clade 1 consisted of NLX-7, MC, QN, and KYJ genotypes, whereas Sub-clade 2 included QW, MY, and TMM genotypes, and Sub-clade 3 consisted of the remaining QX1, NKX-6, 42, 27, 53, 59, 100, 71, HFH, NLX-5, MSW, JH, D101, D163, and D24 genotypes (Figure 2). This finding, together with IBS heatmap (Figure 1), indicates that the 32 genotypes of durian could be differentiated into two stratifications.

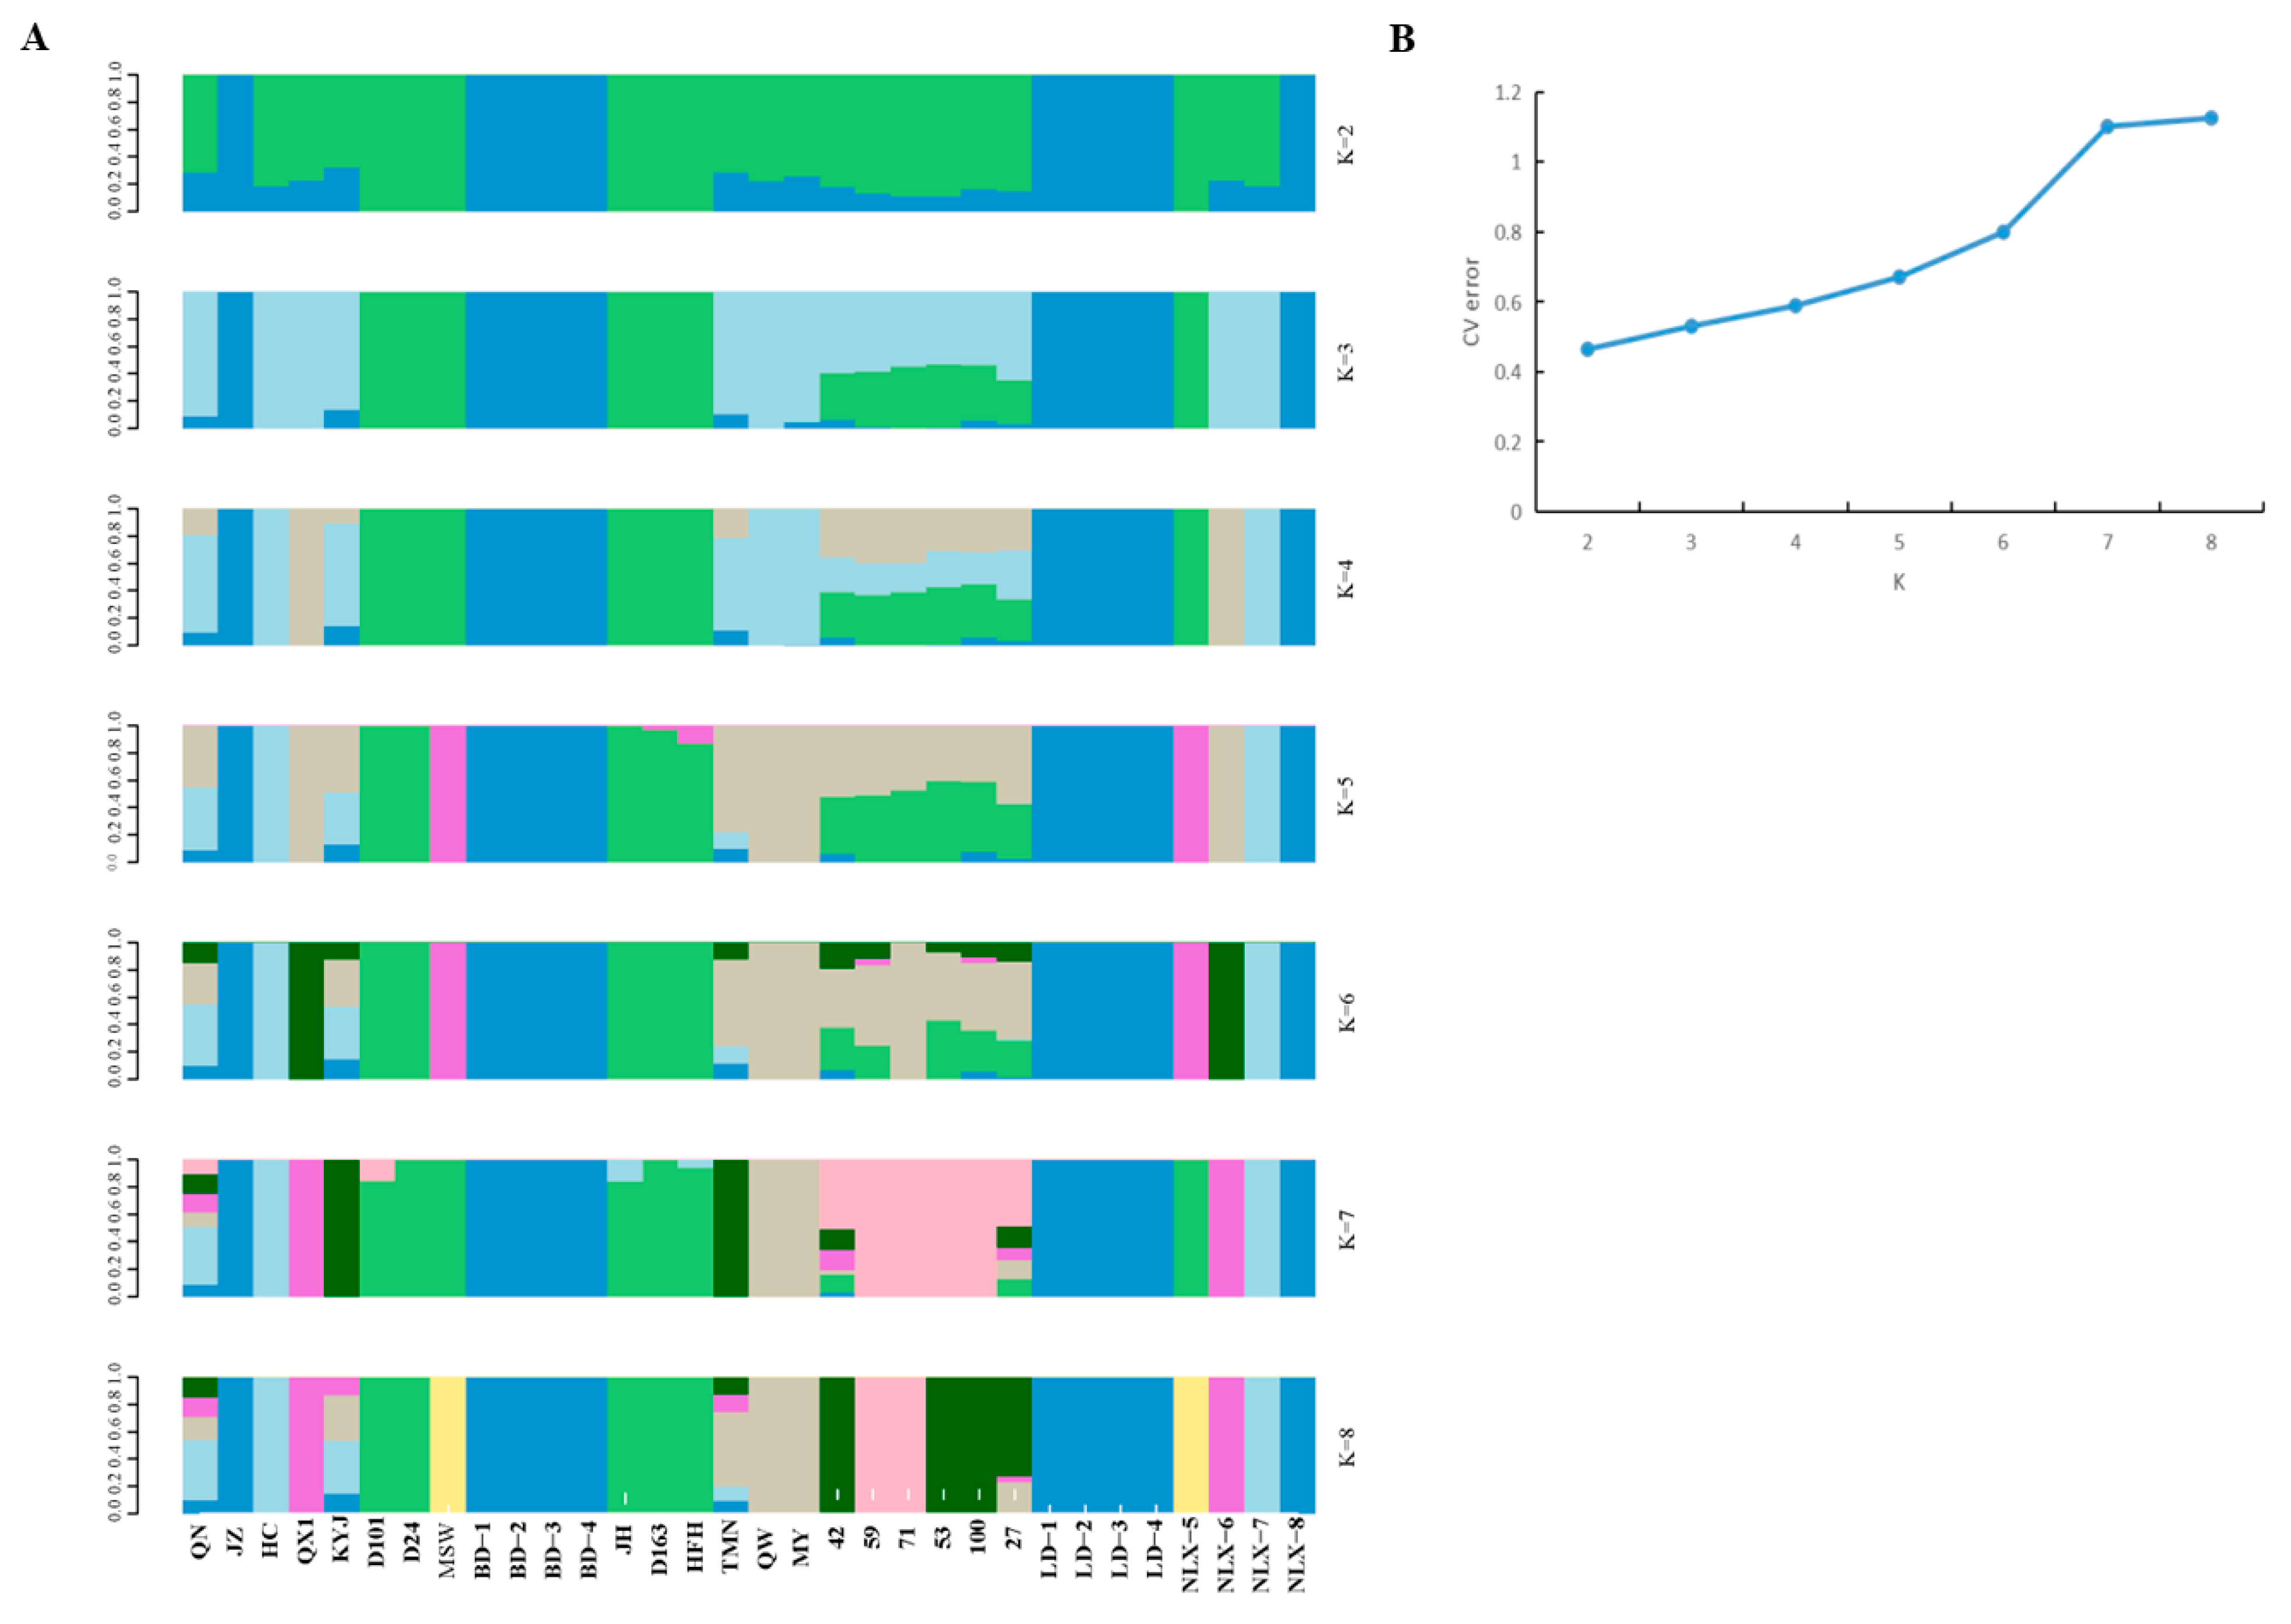
3.4. Model-Based Population Structure

The model-based population structure analysis was performed in PLINK software with K = 2–8 runs. The 32 genotypes of durian were divided into two sub-populations (Figure 3A) based the cross-validation (CV) error estimates from the ADMIXTURE software (Figure 3B). The sub-populations were consistent with the IBS heatmap (Figure 1) and phylogenetic tree (Figure 2). This further indicates that the 32 genotypes of durian may have originated from two possible ancestry sources. However, the genotypes QN, HC, QX1, KYJ, TMM, QW, MY, 42, 59, 71, 53, 100, 27, NLX-6, and NLX-7 from Sub-population II (green color bars) (Figure 3A) share a common ancestry with the genotypes in Sub-population I (blue).
With the exception of these 15 genotypes, the remaining 17 genotypes (10 and 7 from Sub-population I and II, respectively) can be considered as homozygous genotypes; hence, they may be used as a core collection that can constitute the primary resources for durian genetic breeding program in China and beyond. Aside from the likely duplicated genotypes in Sub-population I, D101, D24, MSW, JH, D163, HFH, and NLX-5 genotypes in Sub-population II may be considered as core genotypes for breeding and conservation purposes (Figure 3A).

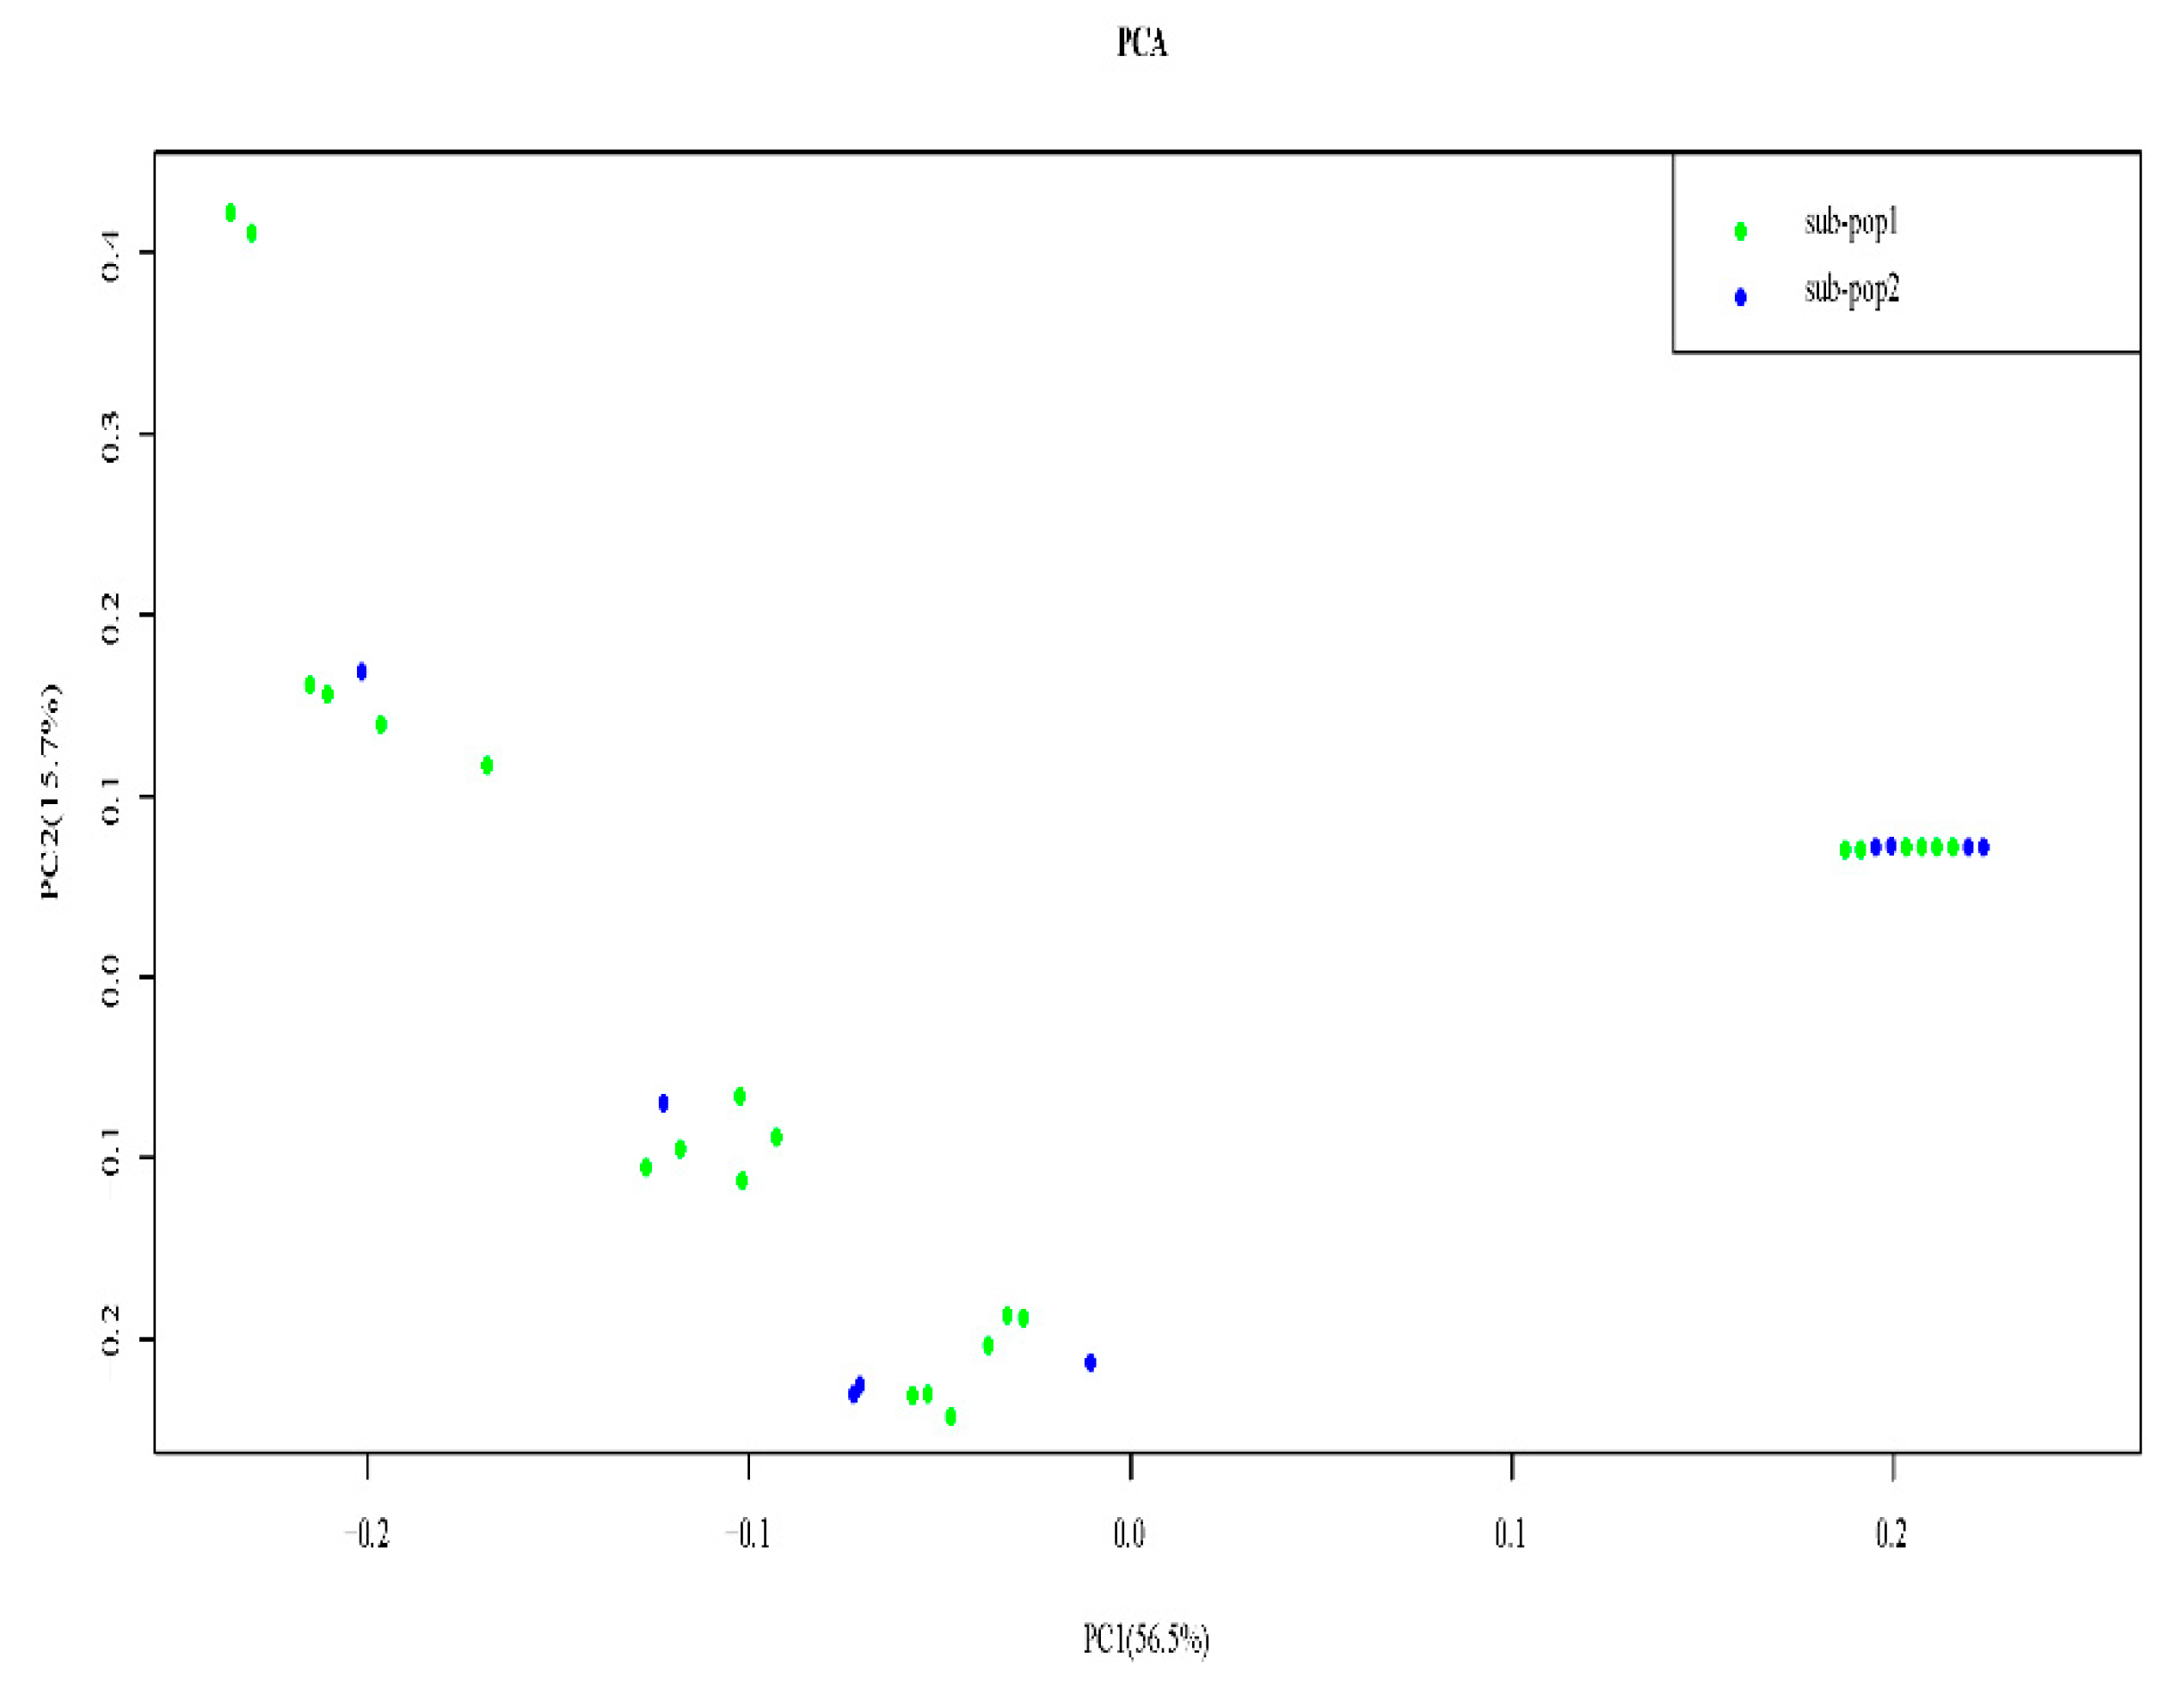
3.5. Principal Component Analysis

PCA of genetic data is routinely used to infer ancestry and genetic variability in various genetic analyses [39]. The first two principal component axes accounted for 72.2% of genetic variability among the 32 genotypes of durian (Figure 4). The clustering of the 32 genotypes of durian conforms to the IBS heatmap (Figure 1), phylogenetic tree (Figure 2), and model-based population structure at K = 2 (Figure 4).

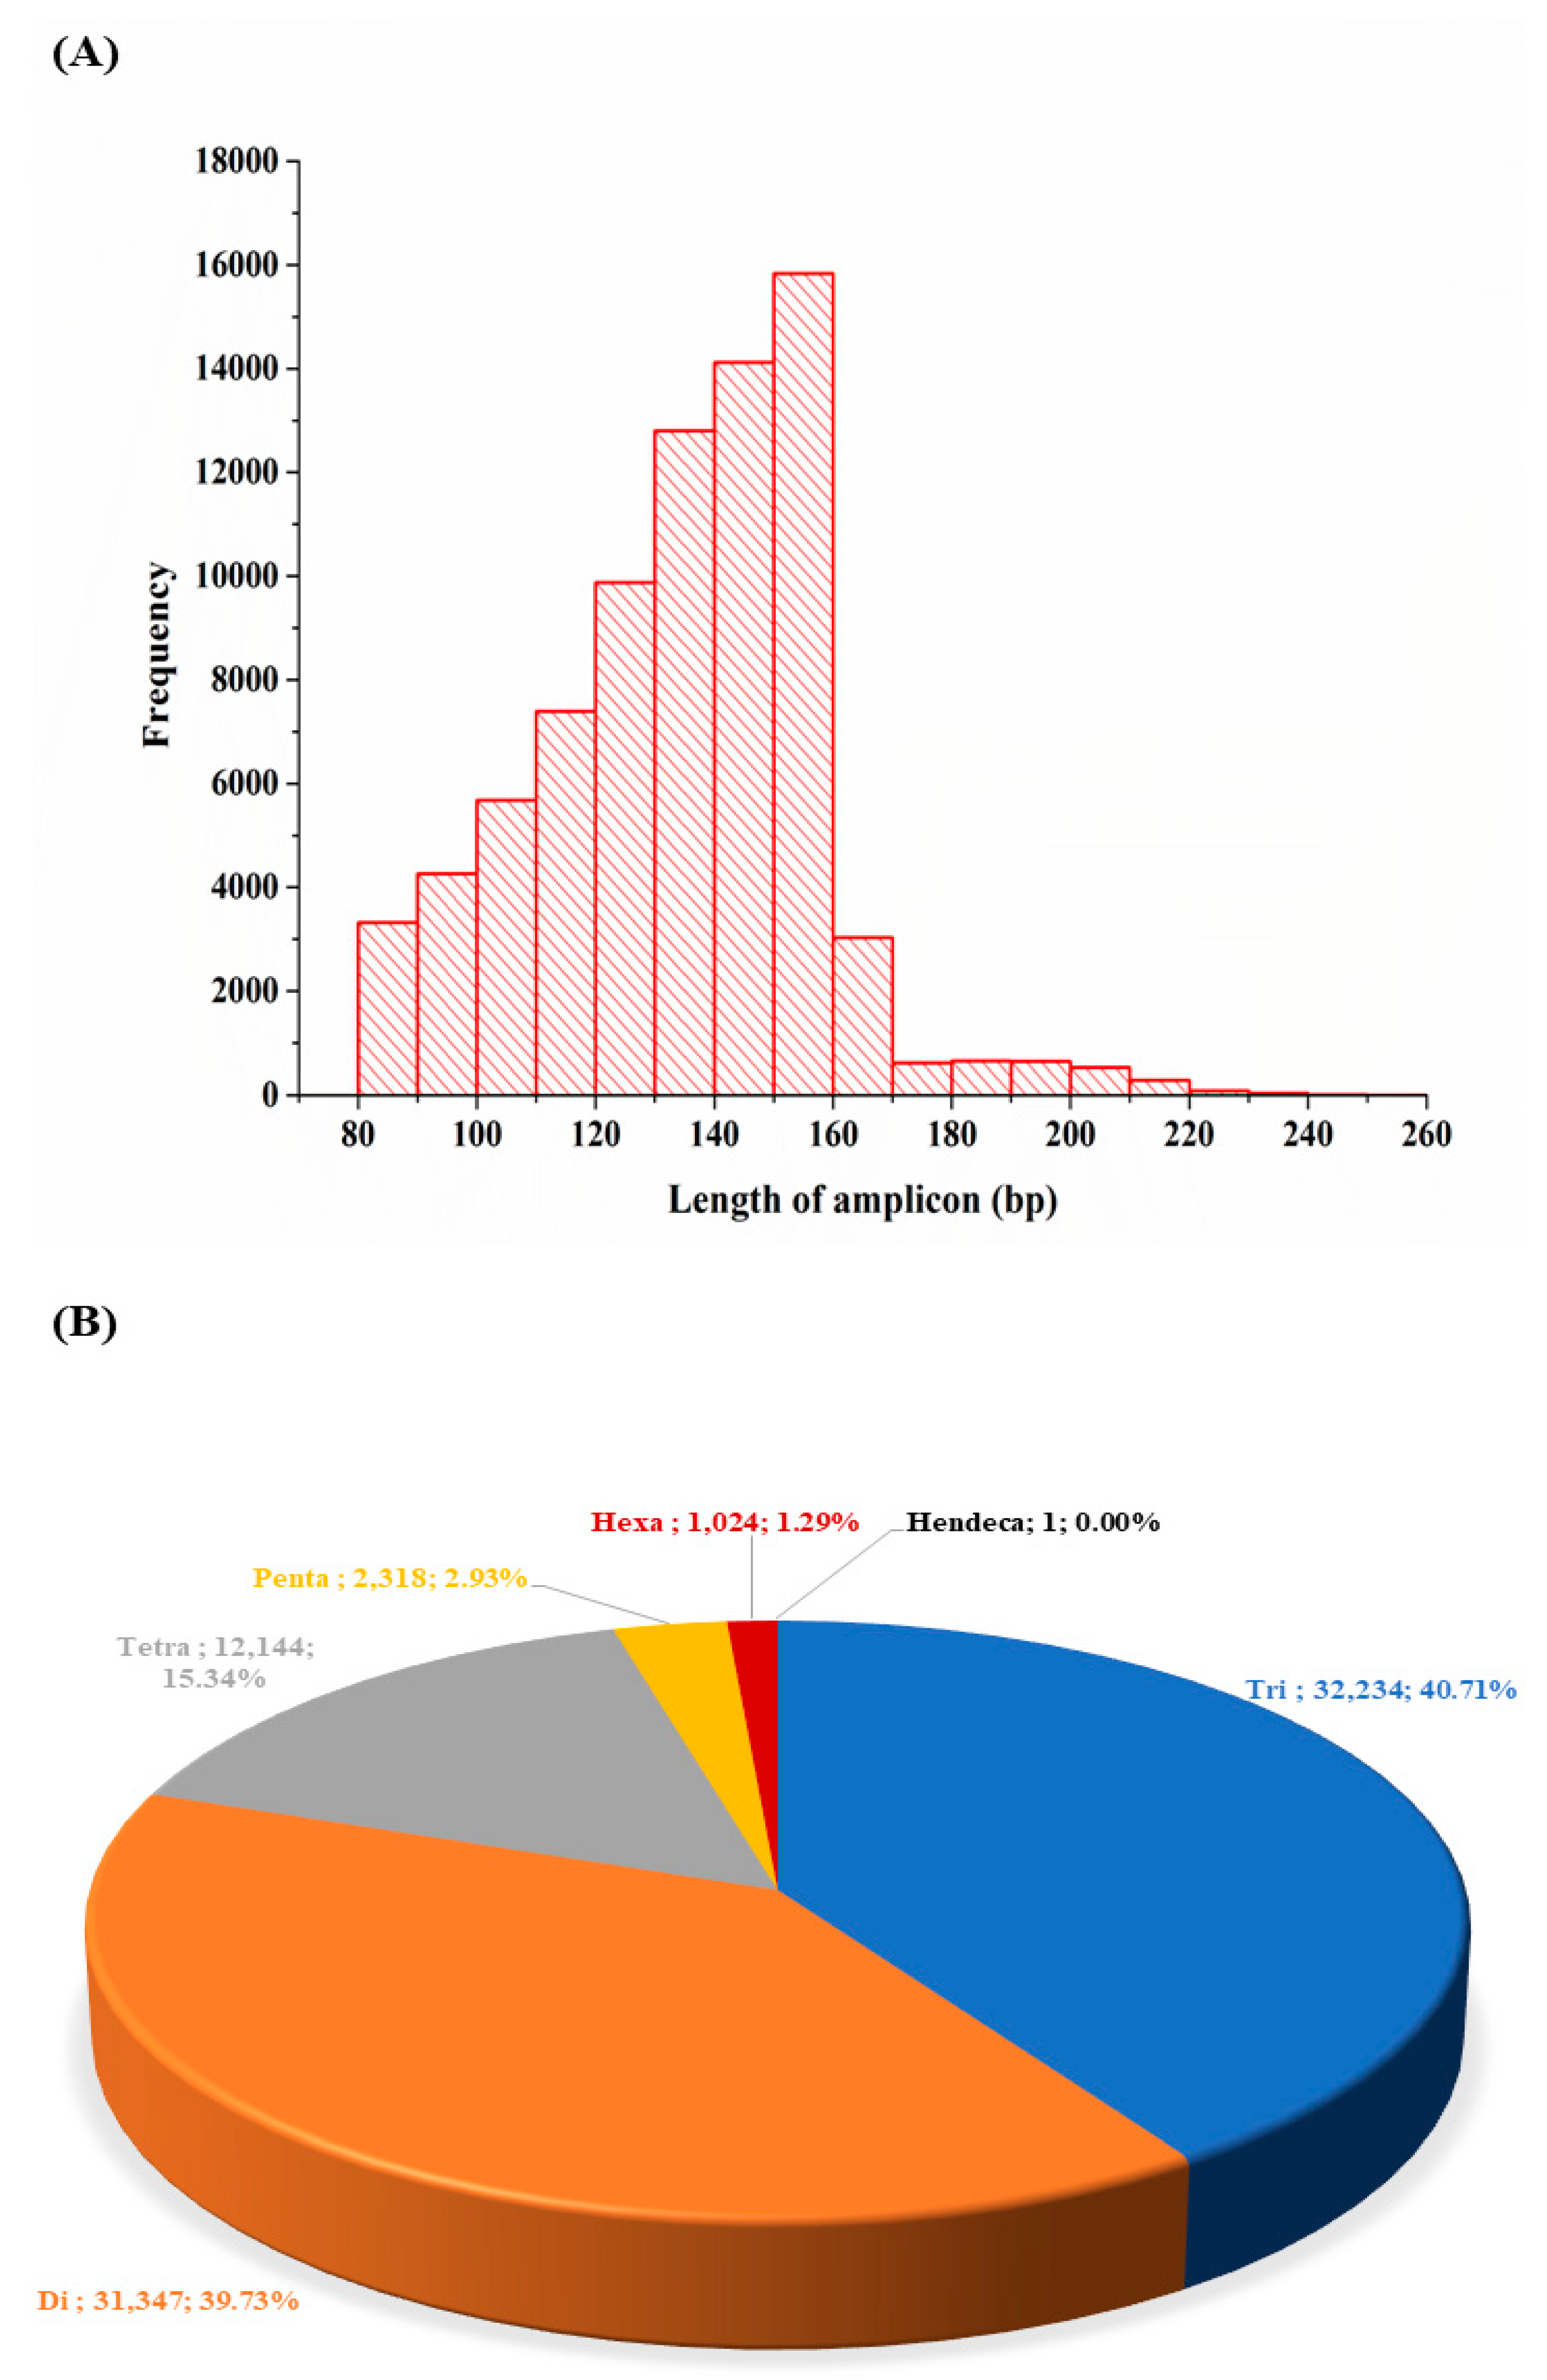
3.6. Simple Sequence Repeats Discovered and Their Characteristics

In order to speed up breeding of durian, we further identified simple sequence repeats (SSRs) in the genome of the 32 genotypes and designed specific primer pairs with the help of MISA [33] and Primer3Plus [34] software, respectively. A total of 79,178 SSR markers were detected with the length range of 12–150 bp (average of 50 bp) and range of occurrence of 1 (in 55, 81, 84, 98, and 150 bp) to 150 (in 12 bp) (Supplementary Table S2A,B). Of these, the amplicon length range was 80–259 bp, with the majority having amplicon lengths of 120–160 bp (Figure 5A). The 79,178 SSR markers comprised six types, i.e., tri-, di-, tetra-, penta-, hexa-, and hendeca-nucleotides, with 40.71, 39.73, 15.34, 2.94, 1.29, and <0.01%, respectively (Figure 5A). These markers can be utilized for variety identification, mapping, and marker-assisted selection (MAS) in durian conservation and improvement programs.

4. Discussion

In recent years, following the revolution in high-throughput sequencing techniques with lesser cost, new possibilities for empirically assessing populations and conservation genetics with much higher resolution have opened up [40]. By leveraging this scientific breakthrough, the present study assessed the genetic base of durian plantations in Hainan, aiming to develop molecular markers for durian breeding efforts. Genetic research on durian has developed relatively slowly due to inadequate genetic information and effective molecular marker systems, with those reported so far based on morphological markers [17,18,19,20]. The present study used leaf samples of durian in the plantation sites in Hainan whose genetic base largely remain unknown, coupled with the same genotype names but differences in morphology, and vice versa (Table 1), to elucidate the genetic bases to ensure effective conservation and utilization in breeding programs.
The WGRS results identified a total of 232,148 SNPs, of which 152,272, representing 65.59% (Table 1), were detected in the intergenic regions in relation to the reference genome [7]. It has been demonstrated that variation/alteration in the intergenic regions can result in changes in phenotype [41], indicating that SNPs generated in the current study are valuable to studying the difference/similarity among the 32 durian genotypes. In addition, the SNPs detected could cause 0.05–4.53% either as stop gain, stop loss, synonymous, and non-synonymous in the coding regions (Table 2). These SNPs will be valuable for candidate gene mining and tagging in the molecular breeding of durian [42].
To ensure effective utilization and conservation of germplasm in breeding programs, the epitome is used to identify genetic bases of all existing germplasm. In this study, the IBS matrix and heatmap grouped the 32 genotypes into two groups, and critical observation revealed that all genotypes in Group 1 (BD-1, BD-2, BD-3, BD-4, JZ, NLX-8, LD-1, LD-2, LD-3, and LD-4) are likely to be duplicated genotypes, as the genetic profile (IBS) indicates a value of nearly 1.00, while MSW and NLX-5, QX1 and NLX-6, and HC and NLX-7 from Group 2 follow a similar trend (Figure 1). However, these genotypes may still be useful as homogeneity/duplication of each accession is a prerequisite for phenotyping analyses [43]. In addition to IBS, phylogenetic trees based on genome-wide SNPs among genotypes may provide valuable and intuitive information for breeding and germplasm management in crops [44]. The evolutionary tree clustered the 32 genotypes into two major clades, similar to the cluster in the IBS heatmap, suggesting that the 32 genotypes can be grouped into two major groups.
For crop improvement, knowing the population structure is beneficial for parental selection or selecting parents with genetic divergence [45,46]. This also essential in preventing genetic base erosion of breeding populations [47,48]. In this study, the 32 genotypes were optimally divided into two sub-populations, with Sub-population I having some genetic overlap with a larger part of Sub-population II (Figure 3A,B). This analysis gives an indication of the core durian collection in the plantation sites in Hainan: D24, D101, MSW, JH, D163, HFH, and NLX-5 (Figure 3A). From theses genotypes, D24 has been identified and reported as the leading commercial clone in Malaysia due to its productivity [4,49,50], making this genotype a candidate for durian improvement program in China. Moreover, genotype D163 is characterized as having oval and cylindrical fruit, of a medium size, with a thick husk and a short peduncle; spines closely spaced and of medium length; 2–3 arils per locule; and yellow-colored, smooth, creamy sweet and excellent quality flesh [4,49]. Among the 32 genotypes, 21 were characterized for leaf morphology (Table 1). These genotypes (D24 and D163) are popular in Malaysia [4]. The core collection and population structure discovered in this study will be a valuable resource for broadening the genetic base of genes having poor germplasm, as it will enable the identification of superior alleles for several traits of economic importance [45].
Traditional SSR marker development methods are labor-intensive [33,51]. To date, no study has reported genomic SSR markers for D. zibethinus. SSRs are of importance for plant genetic studies of diversity evaluation, breeding, quantitative trait loci mapping, and variety identification [9,46,48]. One of the key features of SSR markers is that they can detect multiple alleles per locus, making them hypervariable and more informative per locus than SNP markers which are largely biallelic [52,53]. Therefore, the 79,178 SSR markers with varied lengths and amplicon sizes (Figure 5A,B, Supplementary Table S2) provide a powerful tool for genetic and genomic research in D. zibethinus in breeding programs and genebanks.
In summary, the present study identified core and duplicated durian plantations in Hainan, China, and 79,178 SSR markers were developed. These findings are of practical relevance for durian breeding in China and the world at a large scale.

Supplementary Materials

The following supporting information can be downloaded at: www.mdpi.com/article/10.3390/d14090769/s1, Table S1: Summary of RAD-sequencing among the 32 genotypes of durian; Table S2: A: Seventy-nine thousand, one hundred and seventy-eight (79,178) simple sequence repeats markers developed from the RAD-sequencing data of the 32 genotypes of durian; B: Summary of the 79,178 simple sequence repeats markers developed from the RAD-sequencing data of the 32 genotypes of durian.

Author Contributions

Conceptualization, X.L. (Xinge Lin), M.C., H.G. and Z.Z. (Zhaoxi Zhou); Data curation, X.L. (Xinge Lin); Formal analysis, X.L. (Xinge Lin), Z.D., X.L. (Xiaodi Liu), Z.Z. (Zhenzhong Zhu) and Z.Z. (Zhaoxi Zhou); Funding acquisition, Z.Z. (Zhaoxi Zhou); Investigation, X.L. (Xiaodi Liu), H.G. and Z.Z. (Zhenzhong Zhu); Methodology, X.L. (Xiaodi Liu), Z.D. and M.C.; Project administration, X.L. (Xiaodi Liu), Z.D. and H.G.; Resources, M.C.; Software, H.G. and Z.Z. (Zhenzhong Zhu); Supervision, M.C. and Z.Z. (Zhenzhong Zhu); Validation, H.G. and Z.Z. (Zhenzhong Zhu); Visualization, Z.Z. (Zhenzhong Zhu); Writing—original draft, Z.Z. (Zhaoxi Zhou); Writing—review and editing, Z.Z. (Zhaoxi Zhou). All authors have read and agreed to the published version of the manuscript.

Funding

This work was funded by the Key Research and Development Projects of Hainan Province (ZDYF2020071).

Institutional Review Board Statement

Not applicable.

Informed Consent Statement

Not applicable.

Data Availability Statement

The genome re-sequencing data generated in this study are deposited in the Sequence Read Archive database of National Center for Biotechnology Information with project number PRJNA867527.

Conflicts of Interest

The authors declare no conflict of interest.

References

  1. Fu, Y.-B. Understanding crop genetic diversity under modern plant breeding. Theor. Appl. Genet. 2015, 128, 2131–2142. [Google Scholar] [CrossRef]
  2. Cowling, W.A.; Li, L.; Siddique, K.H.M.; Henryon, M.; Berg, P.; Banks, R.G.; Kinghorn, B.P. Evolving gene banks: Improving diverse populations of crop and exotic germplasm with optimal contribution selection. J. Exp. Bot. 2016, 68, 1927–1939. [Google Scholar] [CrossRef]
  3. Wambugu, P.W.; Ndjiondjop, M.-N.; Henry, R.J. Role of genomics in promoting the utilization of plant genetic resources in genebanks. Briefings Funct. Genom. 2018, 17, 198–206. [Google Scholar] [CrossRef]
  4. Ketsa, S.; Wisutiamonkul, A.; Palapol, Y.; Paull, R.E. The Durian: Botany, Horticulture, and Utilization. Hortic. Rev. 2020, 47, 125–211. [Google Scholar]
  5. Czembor, E.; Czembor, J.H.; Suchecki, R.; Watson-Haigh, N.S. DArT-based evaluation of soybean germplasm from Polish Gene Bank. BMC Res. Notes 2021, 14, 343. [Google Scholar] [CrossRef]
  6. Melomey, L.D.; Danquah, A.; Offei, S.K.; Ofori, K.; Danquah, E.; Osei, M. Review on tomato (Solanum lycopersicum, L.) improvement programmes in Ghana. In Recent Advances in Tomato Breeding and Production; Seloame Tatu Nyaku, A.D., Ed.; Chapter 4; IntechOpen: London, UK, 2017; Volume 49, pp. 49–69. [Google Scholar]
  7. Teh, B.T.; Lim, K.; Yong, C.H.; Ng, C.C.Y.; Rao, S.R.; Rajasegaran, V.; Lim, W.K.; Ong, C.K.; Chan, K.; Cheng, V.K.Y.; et al. The draft genome of tropical fruit durian (Durio zibethinus). Nat. Genet. 2017, 49, 1633–1641. [Google Scholar] [CrossRef]
  8. Devran, Z.; Kahveci, E.; Hong, Y.; Studholme, D.J.; Tör, M. Identifying molecular markers suitable for Frl selection in tomato breeding. Theor. Appl. Genet. 2018, 131, 2099–2105. [Google Scholar] [CrossRef]
  9. Karikari, B.; Bhat, J.A.; Denwar, N.N.; Zhao, T. Exploring the genetic base of the soybean germplasm from Africa, America and Asia as well as mining of beneficial allele for flowering and seed weight. 3 Biotech 2020, 10, 195. [Google Scholar] [CrossRef]
  10. Mascher, M.; Schreiber, M.; Scholz, U.; Graner, A.; Reif, J.C.; Stein, N. Genebank genomics bridges the gap between the conservation of crop diversity and plant breeding. Nat. Genet. 2019, 51, 1076–1081. [Google Scholar] [CrossRef]
  11. Varshney, R.K.; Sinha, P.; Singh, V.K.; Kumar, A.; Zhang, Q.; Bennetzen, J.L. 5Gs for crop genetic improvement. Curr. Opin. Plant Biol. 2020, 56, 190–196. [Google Scholar] [CrossRef]
  12. Wickramasuriya, A.M.; Dunwell, J.M. Cacao biotechnology: Current status and future prospects. Plant Biotechnol. J. 2018, 16, 4–17. [Google Scholar] [CrossRef] [Green Version]
  13. Subhadrabandhu, S.; Ketsa, S. Durian: King of Tropical Fruit; Daphne Brasell Associates: Wellington, New Zealand, 2001; p. 194.
  14. Li, J.X.; Schieberle, P.; Steinhaus, M. Characterization of the major odor-active compounds in Thai durian ( Durio zibethinus L. ‘Monthong’) by aroma extract dilution analysis and headspace gas chromatography-olfactometry. J. Agric. Food Chem. 2012, 60, 11253–11262. [Google Scholar] [CrossRef]
  15. Pinsorn, P.; Oikawa, A.; Watanabe, M.; Sasaki, R.; Ngamchuachit, P.; Hoefgen, R.; Saito, K.; Sirikantaramas, S. Metabolic variation in the pulps of two durian cultivars: Unraveling the metabolites that contribute to the flavor. Food Chem. 2018, 268, 118–125. [Google Scholar] [CrossRef]
  16. Uji, T. Keanekaragaman jenis dan sumber plasma nutfah Durio (Durio spp.) di Indonesia. Bul. Plasma Nutfah 2005, 11, 28–33. [Google Scholar] [CrossRef]
  17. Hannum, S.; Wahyuningsih, H.; Sinaga, R.; Pasaribu, N.; Hartanto, A. Genetic diversity among durian (Durio zibethinus Murr.) Populations From Nias Island, Indonesia using RAPD markers. Appl. Ecol. Environ. Res. 2020, 18, 7337–7351. [Google Scholar] [CrossRef]
  18. Hariyati, T.; Kusnadi, J.; Arumingtyas, E.L. Genetic diversity of hybrid durian resulted from cross breeding between Durio kutejensis and Durio zibethinus based on random amplified polymorphic DNAs (RAPDs). Am. J. Mol. Biol. 2013, 3, 153–157. [Google Scholar] [CrossRef]
  19. Mursyidin, D.H.; Daryono, B.S. Genetic diversity of local durian (Durio zibethinus Murr.) cultivars of South Kalimantan’s province based on RAPD markers. AIP Conf. Proc. 2016, 1755, 040008. [Google Scholar] [CrossRef]
  20. Prihatini, R.; Ihsan, F.; Indriyani, N.L.P. Genomic profiling of F1 hybrids of durian (Durio zibethinus) revealed by RAPD-PCR. J. Hortic. Res. 2016, 24, 69–76. [Google Scholar] [CrossRef]
  21. Mursyidin, D.H.; Makruf, M.I.; Badruzsaufari; Noor, A. Molecular diversity of exotic durian (Durio spp.) germplasm: A case study of Kalimantan, Indonesia. J. Genet. Eng. Biotechnol. 2022, 20, 39. [Google Scholar] [CrossRef]
  22. Bylesjö, M.; Segura, V.; Soolanayakanahally, R.Y.; Rae, A.M.; Trygg, J.; Gustafsson, P.; Jansson, S.; Street, N.R. LAMINA: A tool for rapid quantification of leaf size and shape parameters. BMC Plant Biol. 2008, 8, 82. [Google Scholar] [CrossRef]
  23. Bolger, A.M.; Lohse, M.; Usadel, B. Trimmomatic: A flexible trimmer for Illumina sequence data. Bioinformatics 2014, 30, 2114–2120. [Google Scholar] [CrossRef] [Green Version]
  24. Lohse, M.; Bolger, A.M.; Nagel, A.; Fernie, A.R.; Lunn, J.E.; Stitt, M.; Usadel, B. RobiNA: A user-friendly, integrated software solution for RNA-Seq-based transcriptomics. Nucleic Acids Res. 2012, 40, W622–W627. [Google Scholar] [CrossRef]
  25. Li, H.; Handsaker, B.; Wysoker, A.; Fennell, T.; Ruan, J.; Homer, N.; Marth, G.; Abecasis, G.; Durbin, R.; Genome Project Data Processing Subgroup. The Sequence Alignment/Map format and SAMtools. Bioinformatics 2009, 25, 2078–2079. [Google Scholar] [CrossRef]
  26. Yang, H.; Wang, K. Genomic variant annotation and prioritization with ANNOVAR and wANNOVAR. Nat. Protoc. 2015, 10, 1556–1566. [Google Scholar] [CrossRef]
  27. Purcell, S.; Neale, B.; Todd-Brown, K.; Thomas, L.; Ferreira, M.A.R.; Bender, D.; Maller, J.; Sklar, P.; de Bakker, P.I.W.; Daly, M.J.; et al. PLINK: A tool set for whole-genome association and population-based linkage analyses. Am. J. Hum. Genet 2007, 81, 559–575. [Google Scholar] [CrossRef]
  28. Alexander, D.H.; Lange, K. Enhancements to the ADMIXTURE algorithm for individual ancestry estimation. BMC Bioinform. 2011, 12, 246. [Google Scholar] [CrossRef]
  29. Kolde, R. Pheatmap: Pretty heatmaps. R Package Version 2012, 1, 726. [Google Scholar]
  30. Bradbury, P.; Zhang, Z.; Kroon, D.; Casstevens, T.; Ramdoss, Y.; Buckler, E. TASSEL: Software for association mapping of complex traits in diverse samples. Bioinformatics 2007, 23, 2633–2635. [Google Scholar] [CrossRef]
  31. Tamura, K.; Stecher, G.; Peterson, D.; Filipski, A.; Kumar, S. MEGA6: Molecular evolutionary genetics analysis version 6.0. Mol. Biol. Evol. 2013, 30, 2725–2729. [Google Scholar] [CrossRef]
  32. Zheng, X.; Levine, D.; Shen, J.; Gogarten, S.M.; Laurie, C.; Weir, B.S. A high-performance computing toolset for relatedness and principal component analysis of SNP data. Bioinformatics 2012, 28, 3326–3328. [Google Scholar] [CrossRef]
  33. Beier, S.; Thiel, T.; Münch, T.; Scholz, U.; Mascher, M. MISA-web: A web server for microsatellite prediction. Bioinformatics 2017, 33, 2583–2585. [Google Scholar] [CrossRef]
  34. Untergasser, A.; Nijveen, H.; Rao, X.; Bisseling, T.; Geurts, R.; Leunissen, J.A.M. Primer3Plus, an enhanced web interface to Primer3. Nucleic Acids Res. 2007, 35, W71–W74. [Google Scholar] [CrossRef] [Green Version]
  35. Wang, J.; Raskin, L.; Samuels, D.C.; Shyr, Y.; Guo, Y. Genome measures used for quality control are dependent on gene function and ancestry. Bioinformatics 2015, 31, 318–323. [Google Scholar] [CrossRef] [PubMed]
  36. Guo, C.; McDowell, I.C.; Nodzenski, M.; Scholtens, D.M.; Allen, A.S.; Lowe, W.L.; Reddy, T.E. Transversions have larger regulatory effects than transitions. BMC Genom. 2017, 18, 394. [Google Scholar] [CrossRef]
  37. Maldonado dos Santos, J.V.; Valliyodan, B.; Joshi, T.; Khan, S.M.; Liu, Y.; Wang, J.; Vuong, T.D.; Oliveira, M.F.d.; Marcelino-Guimarães, F.C.; Xu, D.; et al. Evaluation of genetic variation among Brazilian soybean cultivars through genome resequencing. BMC Genom. 2016, 17, 110. [Google Scholar] [CrossRef]
  38. Yang, C.; Yan, J.; Jiang, S.; Li, X.; Min, H.; Wang, X.; Hao, D. Resequencing 250 Soybean Accessions: New Insights into Genes Associated with Agronomic Traits and Genetic Networks. Genom. Proteom. Bioinform. 2021. [Google Scholar] [CrossRef]
  39. Privé, F.; Luu, K.; Blum, M.G.B.; McGrath, J.J.; Vilhjálmsson, B.J. Efficient toolkit implementing best practices for principal component analysis of population genetic data. Bioinformatics 2020, 36, 4449–4457. [Google Scholar] [CrossRef]
  40. Shendure, J.; Ji, H. Next-generation DNA sequencing. Nat. Biotechnol. 2008, 26, 1135–1145. [Google Scholar] [CrossRef]
  41. Doll, N.M.; Gilles, L.M.; Gérentes, M.-F.; Richard, C.; Just, J.; Fierlej, Y.; Borrelli, V.M.G.; Gendrot, G.; Ingram, G.C.; Rogowsky, P.M.; et al. Single and multiple gene knockouts by CRISPR–Cas9 in maize. Plant Cell Rep. 2019, 38, 487–501. [Google Scholar] [CrossRef]
  42. Moin, M.; Bakshi, A.; Saha, A.; Dutta, M.; Kirti, P.B. Gain-of-function mutagenesis approaches in rice for functional genomics and improvement of crop productivity. Brief Funct Genom. 2017, 16, 238–247. [Google Scholar] [CrossRef]
  43. Cuevas, H.E.; Rosa-Valentin, G.; Hayes, C.M.; Rooney, W.L.; Hoffmann, L. Genomic characterization of a core set of the USDA-NPGS Ethiopian sorghum germplasm collection: Implications for germplasm conservation, evaluation, and utilization in crop improvement. BMC Genom. 2017, 18, 108. [Google Scholar] [CrossRef] [PubMed]
  44. Yang, H.-l.; Dong, L.; Wang, H.; Liu, C.-l.; Liu, F.; Xie, C.-X. A simple way to visualize detailed phylogenetic tree of huge genome-wide SNP data constructed by SNPhylo. J. Integr. Agric. 2018, 17, 1972–1978. [Google Scholar] [CrossRef]
  45. Aesomnuk, W.; Ruengphayak, S.; Ruanjaichon, V.; Sreewongchai, T.; Malumpong, C.; Vanavichit, A.; Toojinda, T.; Wanchana, S.; Arikit, S. Estimation of the Genetic Diversity and Population Structure of Thailand’s Rice Landraces Using SNP Markers. Agronomy 2021, 11, 995. [Google Scholar] [CrossRef]
  46. Wu, F.; Zhang, S.; Gao, Q.; Liu, F.; Wang, J.; Wang, X. Genetic diversity and population structure analysis in a large collection of Vicia amoena in China with newly developed SSR markers. BMC Plant Biol. 2021, 21, 544. [Google Scholar] [CrossRef]
  47. Kölliker, R.; Jones, E.S.; Jahufer, M.Z.Z.; Forster, J.W. Bulked AFLP analysis for the assessment of genetic diversity in white clover (Trifolium repens L.). Euphytica 2001, 121, 305–315. [Google Scholar] [CrossRef]
  48. Ma, S.; Han, C.; Zhou, J.; Hu, R.; Jiang, X.; Wu, F.; Tian, K.; Nie, G.; Zhang, X. Fingerprint identification of white clover cultivars based on SSR molecular markers. Mol. Biol. Rep. 2020, 47, 8513–8521. [Google Scholar] [CrossRef]
  49. Lim, T.K.; Luders, L. Boosting Durian Productivity; Publication No. 97/001W; Northern Territory Department of Primary Industry and Fisheries: Darwin, Australia, 1997.
  50. Yaacob, O.; Subhadrabandhu, S. The Production of Economic Fruits in South-East Asia; Oxford University Press: Oxford, UK, 1995. [Google Scholar]
  51. Zalapa, J.E.; Cuevas, H.; Zhu, H.; Steffan, S.; Senalik, D.; Zeldin, E.; McCown, B.; Harbut, R.; Simon, P. Using next-generation sequencing approaches to isolate simple sequence repeat (SSR) loci in the plant sciences. Am. J. Bot. 2012, 99, 193–208. [Google Scholar] [CrossRef]
  52. Hamblin, M.T.; Warburton, M.L.; Buckler, E.S. Empirical Comparison of Simple Sequence Repeats and Single Nucleotide Polymorphisms in Assessment of Maize Diversity and Relatedness. PLoS ONE 2007, 2, e1367. [Google Scholar] [CrossRef]
  53. Shahinnia, F.; Sayed-Tabatabaei, B.E. Conversion of barley SNPs into PCR-based markers using dCAPS method. Genet. Mol. Biol. 2009, 32, 564–567. [Google Scholar] [CrossRef] [Green Version]
Figure 1. Heatmap of identity by state (IBS) distance matrix of the conserved population of 32 durian genotypes. Each small square in the IBS distance matrix represents the genetic distance value between two pairs from the first sample to the last sample. The larger the value, the closer to red, thus the larger the genetic distance between two individuals, and vice versa.
Diversity 14 00769 g001
Figure 2. Neighbor-joining (NJ) phylogenetic tree showing the evolutionary relationships among the 32 genotypes of durian in durian plantations in Hainan. The branch node with blue (round shaped) and green (triangle) represent Group 1 and 2, respectively.
Diversity 14 00769 g002
Figure 3. Bayesian model-based population structure of the 32 durian genotypes. The membership coefficient (Q) is shown by a vertical bar. The colored subsections within each vertical bar show sub-populations. (A). The subgroup assignment by ADMIXTURE for a set of indicators of the 32 durian accessions when K = 2–8. (B). The optimum K. The cross-validation (CV) error curve based on ADMIXTURE output reveals that the CV error value of 2 was the smallest at K = 2, thus dividing the 32 durian accessions into 2 groups (that is, 2 subgroups is optimal).
Diversity 14 00769 g003
Figure 4. Principal component analysis of the 32 genotypes of durian in the durian plantations in Hainan. The genotypes with blue (round shaped) and green (triangle) colors represent Groups 1 and 2, respectively. The less the distance between the samples, the smaller the genetic background differences between the samples.
Diversity 14 00769 g004
Figure 5. Simple sequence repeats (SSRs) detected in the 32 Durio zibethinus L. genotypes. (A). Frequency of amplicon lengths from the SSRs detected in the 32 durian genotypes. (B). Types of SSRs detected.
Diversity 14 00769 g005
Table 1. Differences in leaf traits of selected durian accessions.
SamplesLeaf ShapeLeaf LengthLeaf WidthPetiole LengthLeaf BaseLeaf ApexLeaf Vein Pairs
42oval10.93.52roundacuminate10
59lanceolate11.73.51.2pointedtail tip9
71oval9.72.61.2pointedtail tip9
53lanceolate10.431.1round blunttail tip11
100oval12.54.21.5pointedacuminate14
27inverted egg shape10.23.11.3pointedtail tip13
BD-1egg shape7.32.71blunttail tip11
BD-2long oval12.74.91.7roundtail tip15
BD-3long oval133.81.3pointedtail tip10
BD-4long oval11.64.31.2roundtail tip7
LD-1lanceolate9.12.91.9pointedtail tip10
LD-2lanceolate8.93.21.5pointedtail tip9
LD-3long oval14.54.72pointedtail tip9
LD-4long oval15.24.61.7roundtail tip13
JZoval10.23.11.3pointedtail tip13
QWegg shape7.42.81.4bluntacuminate7
MYegg shape9.53.71.1blunttail tip10
NLX-5inverted egg shape5.82.21.1tooth shapetail tip9
NLX-6lanceolate8.721.2pointedtail tip7
NLX-7long oval13.33.71.2pointedtail tip15
NLX-8long oval13.54.71.7roundtail tip12
Table 2. SNPs detected and their characteristics among the 32 durian accessions.
CategoryNumber of SNPs% b
Upstream77653.36
Stop gain a1220.05
Stop loss a190.02
Synonymous a79143.41
Non-synonymous a10,5264.53
Intronic31,60913.62
Splicing810.04
Downstream88173.80
upstream/downstream11380.49
Intergenic152,27265.59
Transition (ts)154,89966.72
transversion (tv)77,24933.28
ts/tv2.005-
Total232,148-
a detected in the exonic regions. b % of the total.
Publisher’s Note: MDPI stays neutral with regard to jurisdictional claims in published maps and institutional affiliations.

