

Characterizing Crustose Lichen Communities—DNA Metabarcoding Reveals More than Meets the Eye
 and
and
Abstract
:1. Introduction
2. Materials and Methods
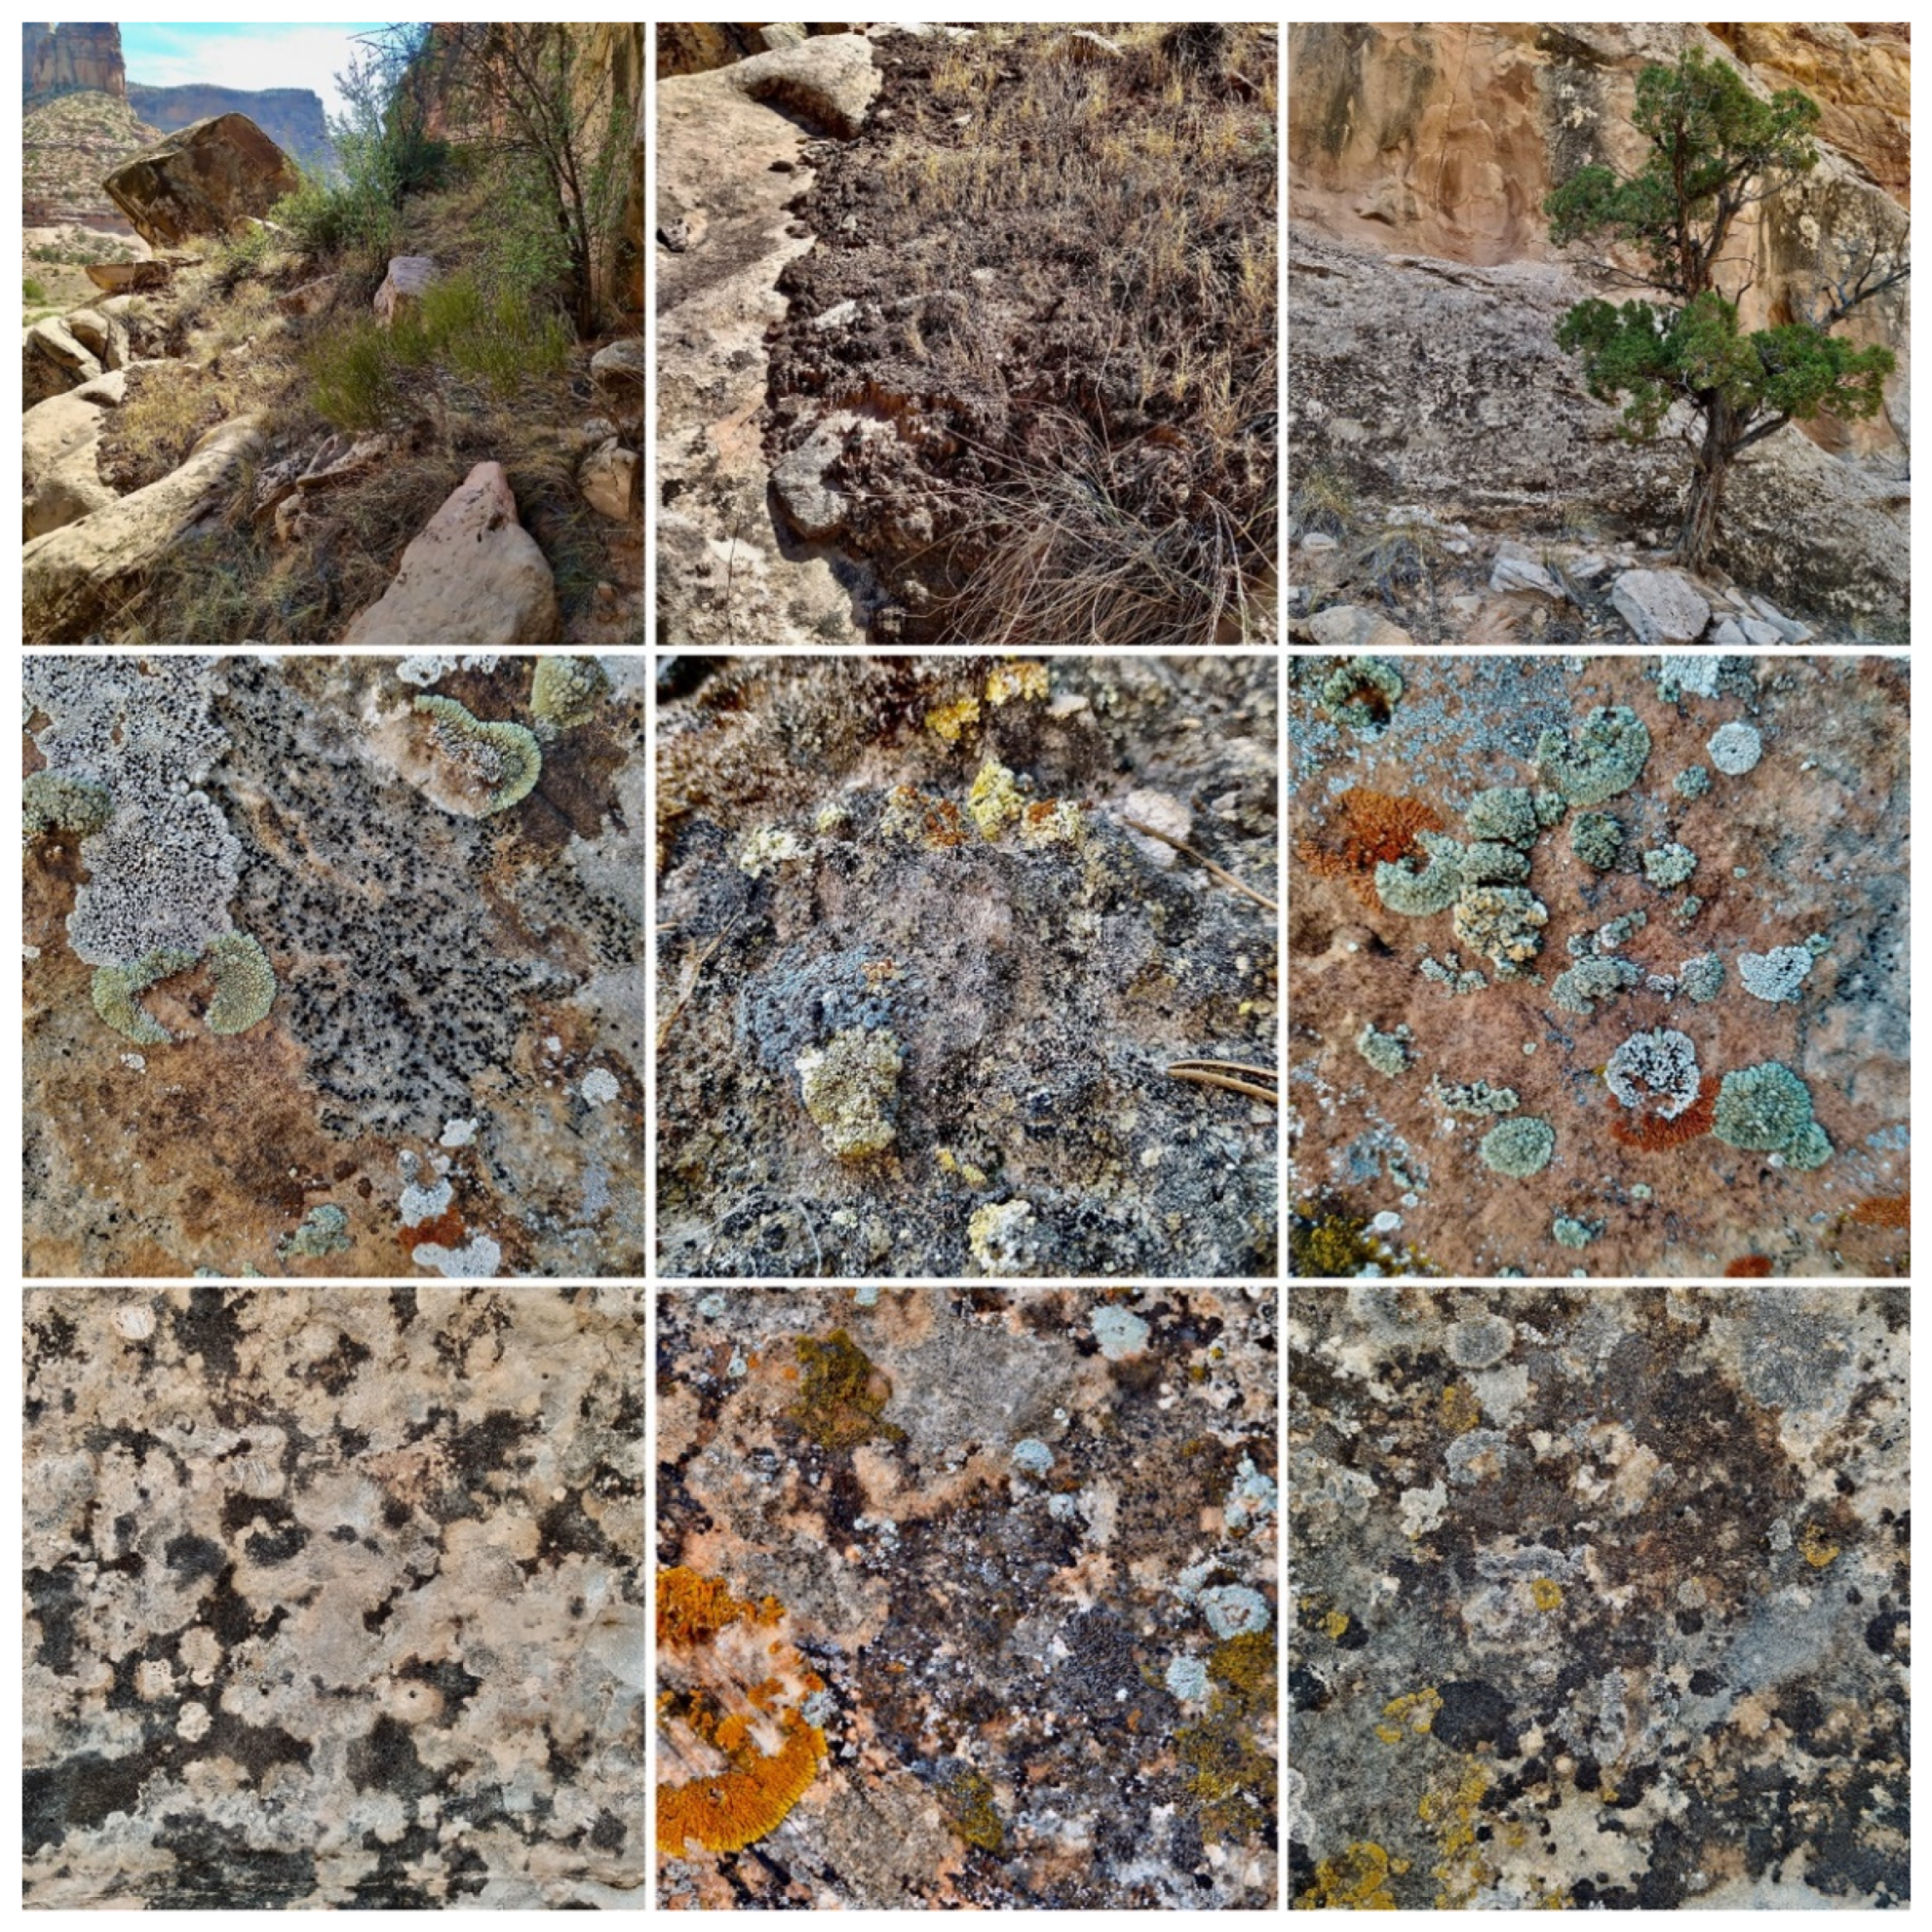
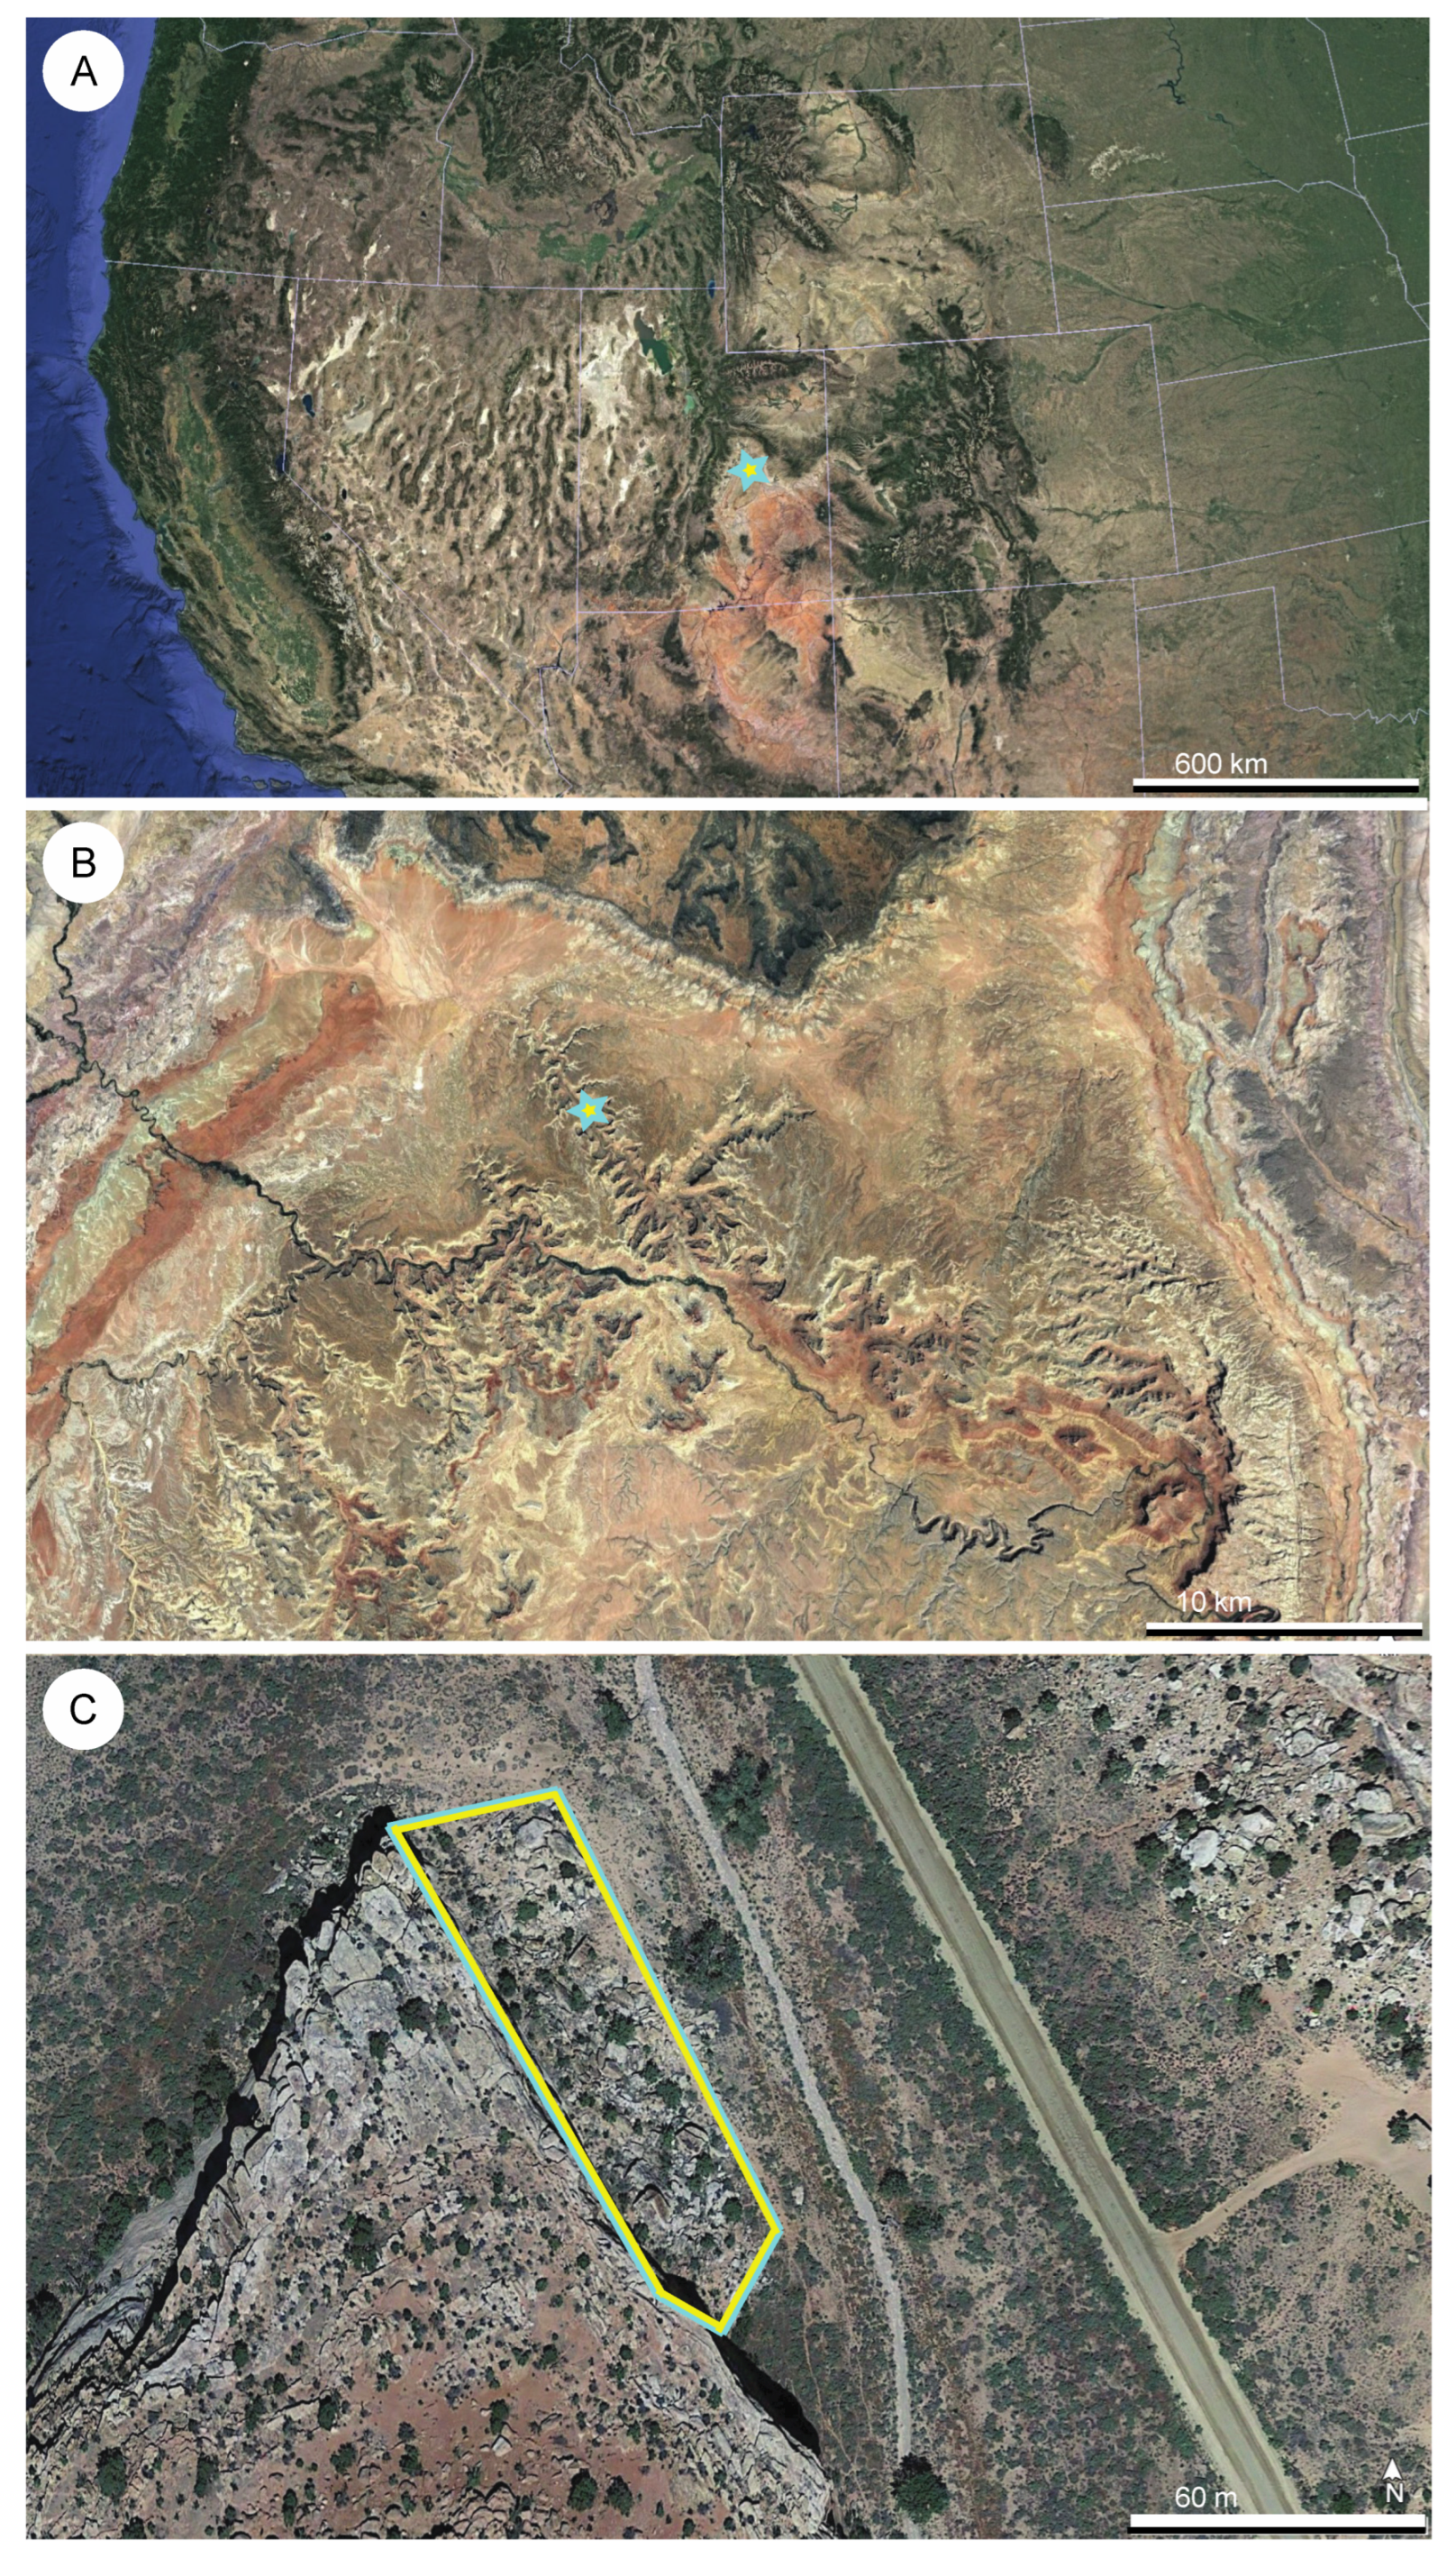
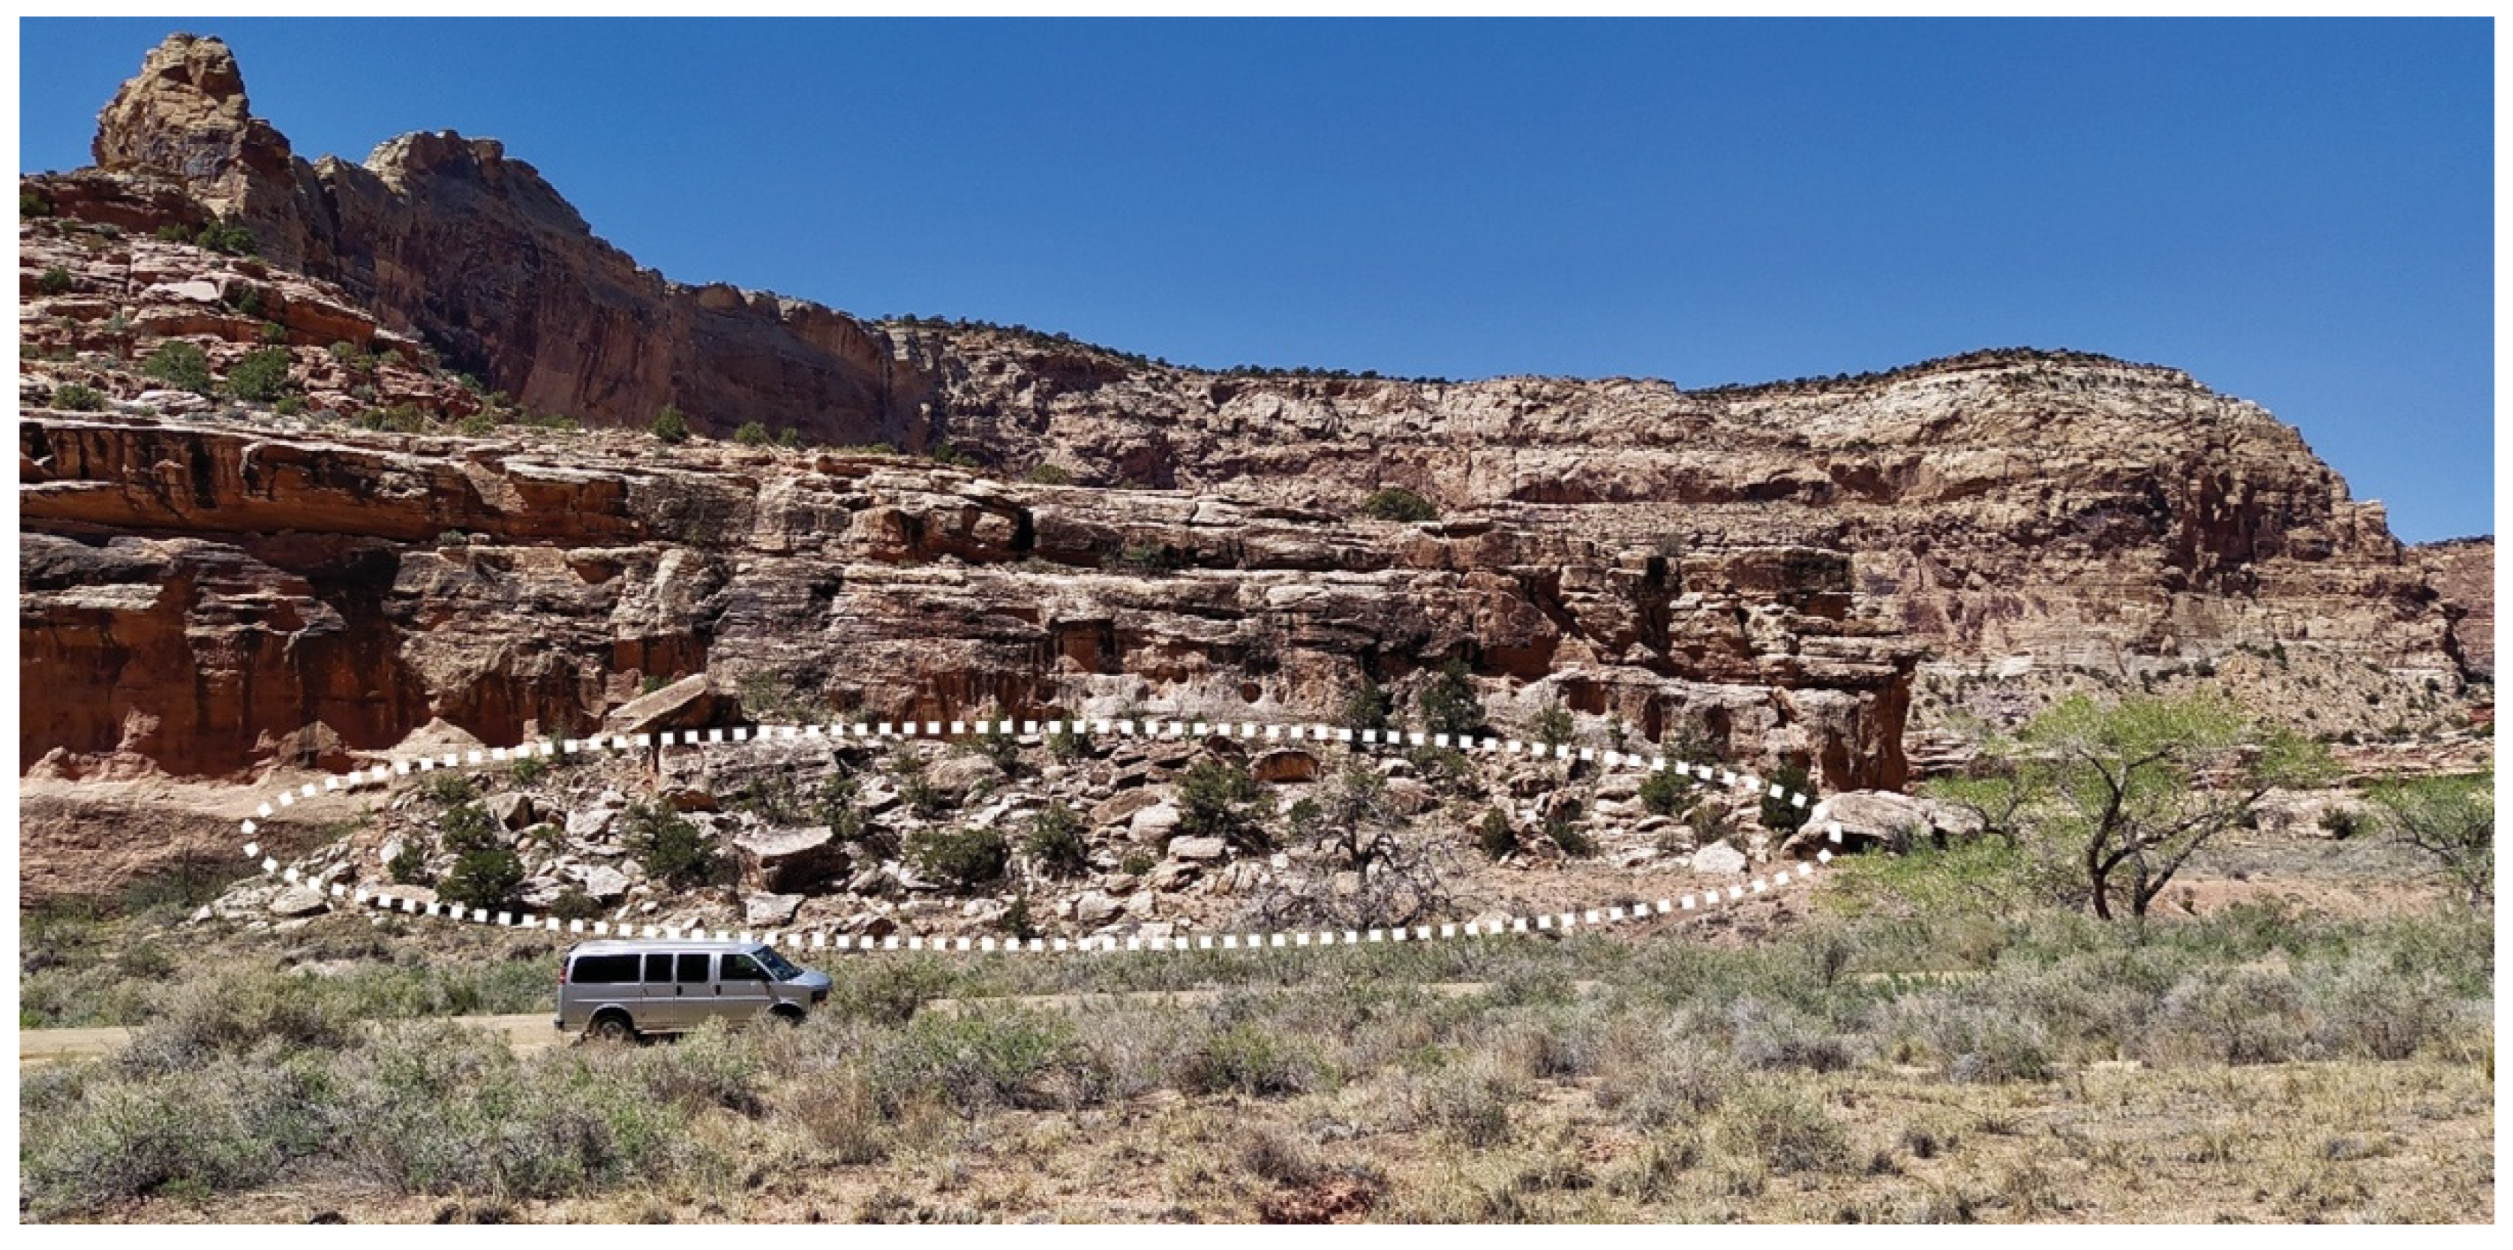
2.1. Site Selection and Field Methods
2.2. Laboratory Methods
2.3. Data Analyses
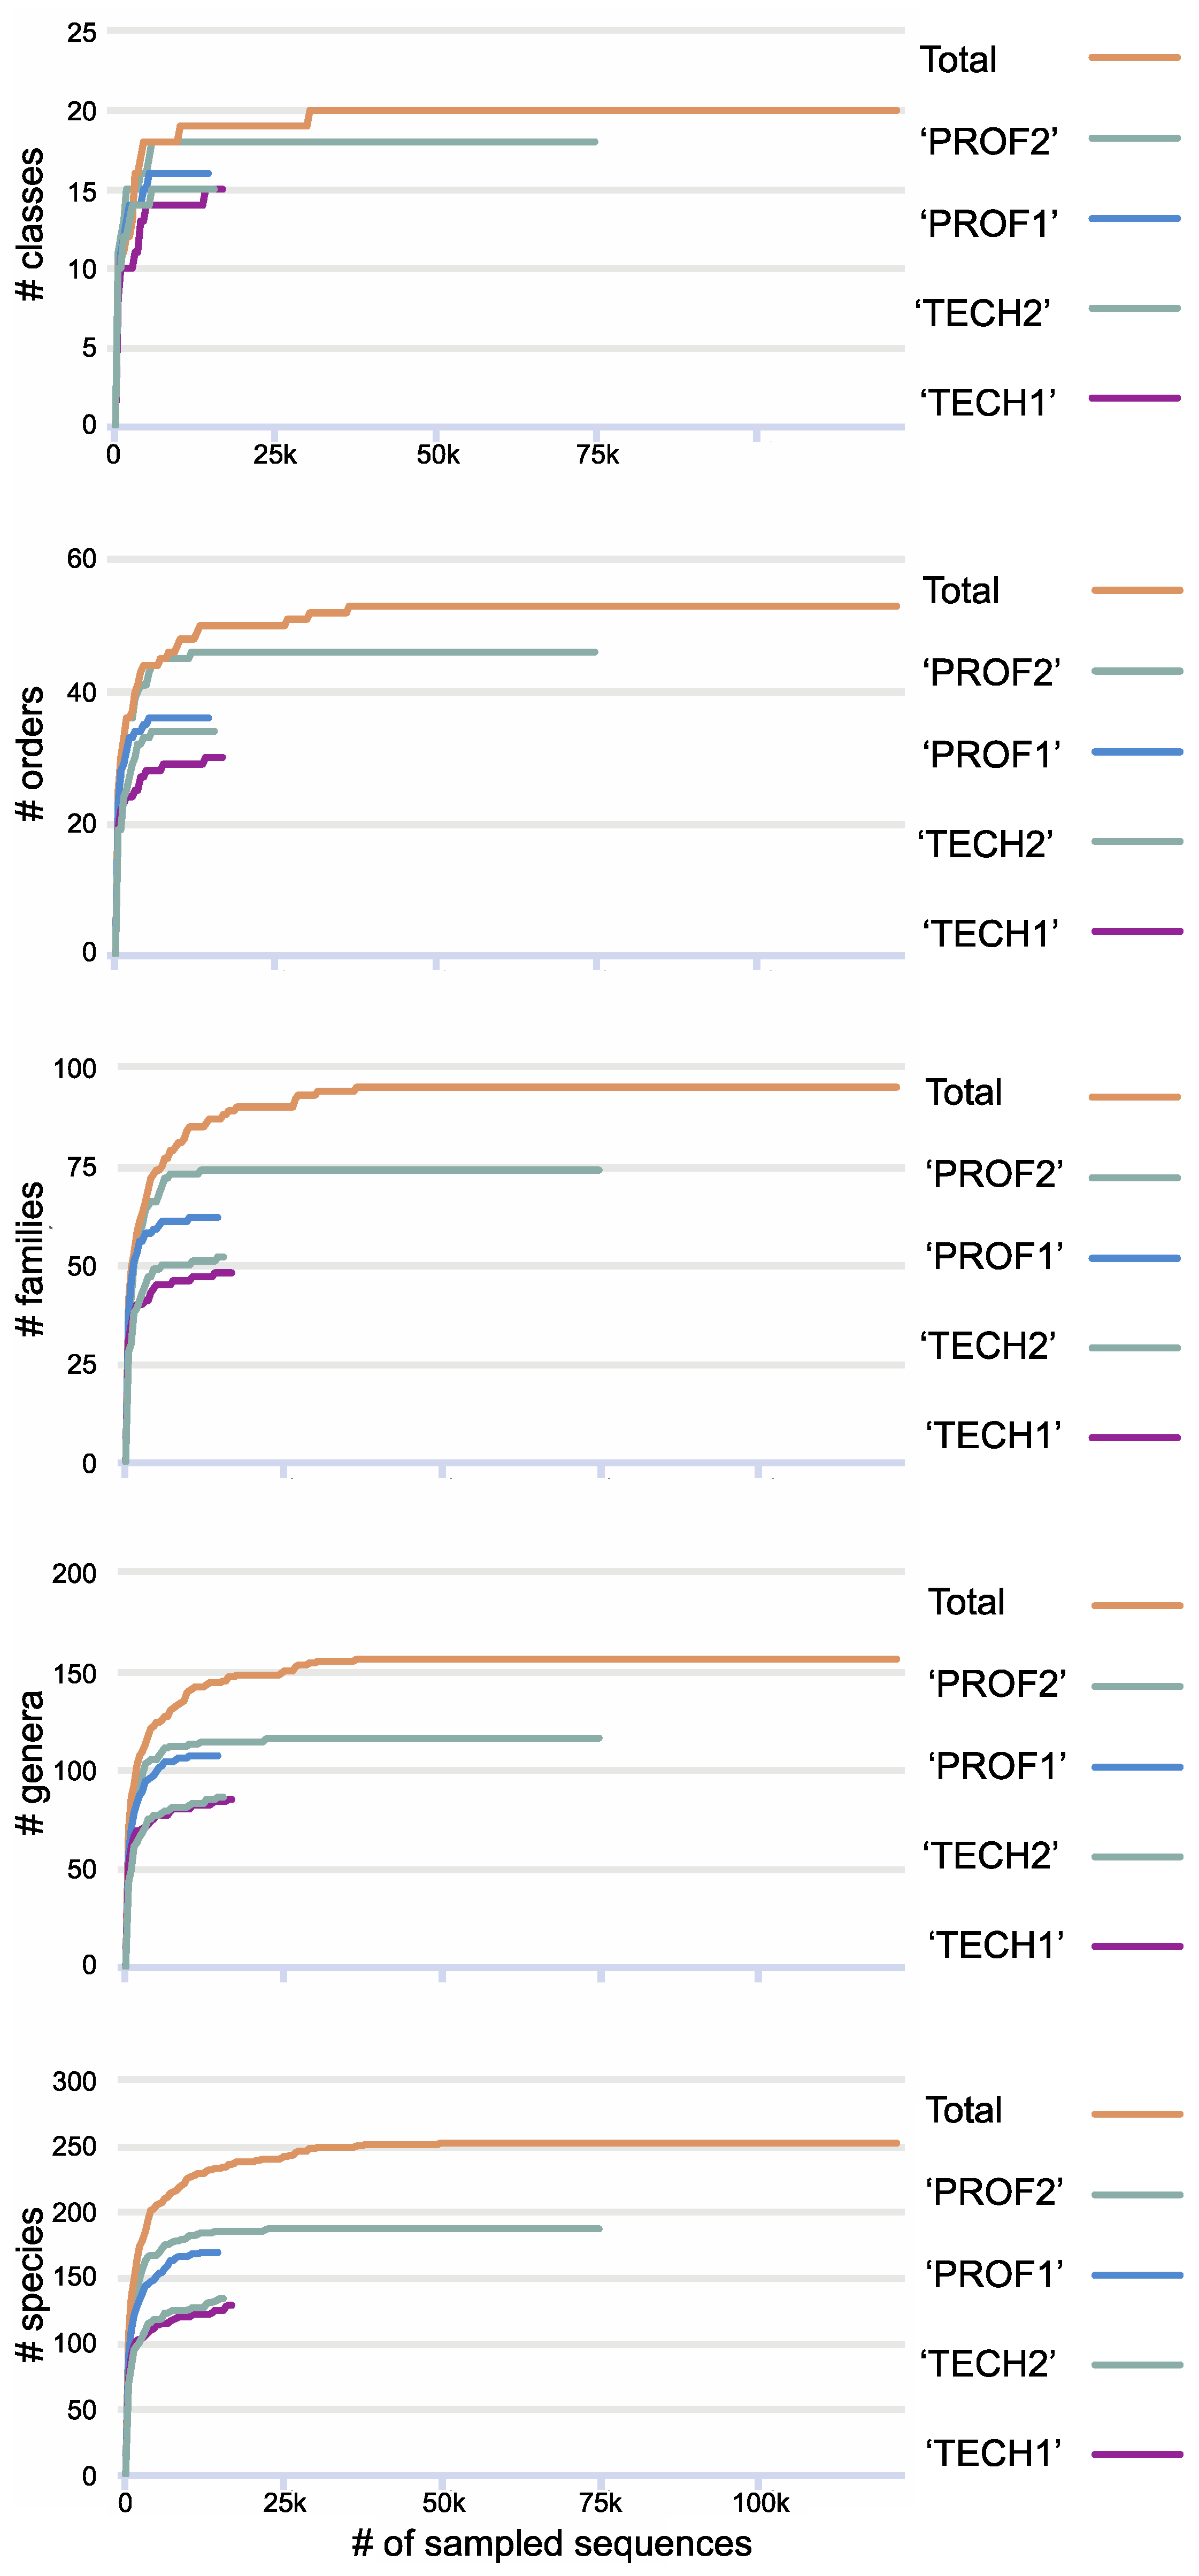
3. Results
4. Discussion
Supplementary Materials
Author Contributions
Funding
Institutional Review Board Statement
Data Availability Statement
Acknowledgments
Conflicts of Interest
References
- Cao, X.; Liu, J.; Chen, J.; Zheng, G.; Kuntner, M.; Agnarsson, I. Rapid dissemination of taxonomic discoveries based on DNA barcoding and morphology. Sci. Rep. 2016, 6, 37066. [Google Scholar] [CrossRef] [PubMed]
- Giordani, P.; Brunialti, G.; Benesperi, R.; Rizzi, G.; Frati, L.; Modenesi, P. Rapid biodiversity assessment in lichen diversity surveys: Implications for quality assurance. J. Environ. Monit. 2009, 11, 730–735. [Google Scholar] [CrossRef] [PubMed]
- O’Reilly, P.; Hamilton, L.; McConnell, S.; Wright, J. Rapid analysis of genetic variation in Atlantic salmon (Salmo salar) by PCR multiplexing of dinucleotide and tetranucleotide microsatellites. Can. J. Fish. Aquat. Sci. 1996, 53, 2292–2298. [Google Scholar] [CrossRef]
- Yu, D.W.; Ji, Y.; Emerson, B.C.; Wang, X.; Ye, C.; Yang, C.; Ding, Z. Biodiversity soup: Metabarcoding of arthropods for rapid biodiversity assessment and biomonitoring. Methods Ecol. Evol. 2012, 3, 613–623. [Google Scholar] [CrossRef]
- Sancho, L.G.; Pintado, A.; Green, T. Antarctic studies show lichens to be excellent biomonitors of climate change. Diversity 2019, 11, 42. [Google Scholar] [CrossRef]
- Rosentreter, R.; Eldridge, D.J. Monitoring Biodiversity and Ecosystem Function: Grasslands, Deserts, and Steppe. In Monitoring with Lichens—Monitoring Lichens; Nimis, P.L., Scheidegger, C., Wolseley, P.A., Eds.; Springer Netherlands: Dordrecht, The Netherlands, 2002; pp. 223–237. [Google Scholar] [CrossRef]
- Vondrák, J.; Malíček, J.; Palice, Z.; Coppins, B.; Kukwa, M.; Czarnota, P.; Sanderson, N.; Acton, A. Methods for obtaining more complete species lists in surveys of lichen biodiversity. Nord. J. Bot. 2016, 34, 619–626. [Google Scholar] [CrossRef]
- Spribille, T.; Fryday, A.M.; Pérez-Ortega, S.; Svensson, M.; Tønsberg, T.; Ekman, S.; Holien, H.; Resl, P.; Schneider, K.; Stabentheiner, E.; et al. Lichens and associated fungi from Glacier Bay National Park, Alaska. Lichenologist 2020, 52, 61–181. [Google Scholar] [CrossRef] [PubMed]
- McCune, B.; Lesica, P. The trade-off between species capture and quantitative accuaracy in ecological inventory of lichens and bryophytes in forest in Montana. Bryol. 1992, 95, 296–304. [Google Scholar] [CrossRef]
- Orange, A.; James, P.W.; White, F.J. Microchemical Methods for the Identification of Lichens; British Lichen Society: London, UK, 2001; p. 101. [Google Scholar]
- Culberson, C.F. Improved conditions and new data for identification of lichen products by standardized thin-layer chromatographic method. J. Chromatogr. A 1972, 72, 113–125. [Google Scholar] [CrossRef]
- Stehn, S.E.; Walton, J.K.; Nelson, P.R.; Hampton-Miller, C.J.; Roland, C.A. A Lichen Species List for Denali National Park and Preserve, Alaska, with Comments on Several New and Noteworthy Records. Evansia 2015, 32, 195–215. [Google Scholar] [CrossRef]
- Armstrong, R.A.; Bradwell, T. Groth of crustose lichens: A review. Geogr. Ann. Ser. A Phys. Geogr. 2010, 92, 3–17. [Google Scholar] [CrossRef]
- Will-Wolf, S. Analyzing Lichen Indicator Data in the Forest Inventory and Analysis Program; U.S. Department of Agriculture, Forest Service, Pacific Northwest Research Station: Portland, OR, USA, 2010; p. 61. [Google Scholar]
- Wiersma, Y.F.; McMullin, R.T. Are calicioids useful indicators of boreal forest continuity or condition? Biodivers. Conserv. 2022, 31, 1647–1664. [Google Scholar] [CrossRef]
- McCune, B.; Yang, S.; Jovan, S.; Root, H.T. Climate and epiphytic macrolichen communities in the Four Corners region of the U.S.A. Bryologist 2022, 125, 70–90. [Google Scholar] [CrossRef]
- Tripp, E.A.; Lendemer, J.C.; Barberán, A.; Dunn, R.R.; Fierer, N. Biodiversity gradients in obligate symbiotic organisms: Exploring the diversity and traits of lichen propagules across the United States. J. Biogeogr. 2016, 43, 1667–1678. [Google Scholar] [CrossRef]
- Abas, A. A systematic review on biomonitoring using lichen as the biological indicator: A decade of practices, progress and challenges. Ecol. Indic. 2021, 121, 107197. [Google Scholar] [CrossRef]
- Nelsen, M.P.; Lumbsch, H.T. A data-driven evaluation of lichen climate change indicators in Central Europe. Biodivers. Conserv. 2020, 29, 3959–3971. [Google Scholar] [CrossRef]
- Copeland, S.M.; Bradford, J.B.; Duniway, M.C.; Schuster, R.M. Potential impacts of overlapping land-use and climate in a sensitive dryland: A case study of the Colorado Plateau, USA. Ecosphere 2017, 8, e01823. [Google Scholar] [CrossRef]
- Tedersoo, L.; Bahram, M.; Zinger, L.; Nilsson, R.H.; Kennedy, P.G.; Yang, T.; Anslan, S.; Mikryukov, V. Best practices in metabarcoding of fungi: From experimental design to results. Mol. Ecol. 2022, 31, 2769–2795. [Google Scholar] [CrossRef]
- Baldrian, P.; Větrovský, T.; Lepinay, C.; Kohout, P. High-throughput sequencing view on the magnitude of global fungal diversity. Fungal Divers. 2022, 114, 539–547. [Google Scholar] [CrossRef]
- Lücking, R.; Aime, M.C.; Robbertse, B.; Miller, A.N.; Ariyawansa, H.A.; Aoki, T.; Cardinali, G.; Crous, P.W.; Druzhinina, I.S.; Geiser, D.M.; et al. Unambiguous identification of fungi: Where do we stand and how accurate and precise is fungal DNA barcoding? IMA Fungus 2020, 11, 14. [Google Scholar] [CrossRef]
- Nilsson, R.H.; Larsson, K.-H.; Taylor, A.F.S.; Bengtsson-Palme, J.; Jeppesen, T.S.; Schigel, D.; Kennedy, P.; Picard, K.; Glöckner, F.O.; Tedersoo, L.; et al. The UNITE database for molecular identification of fungi: Handling dark taxa and parallel taxonomic classifications. Nucleic Acids Res. 2019, 47, D259–D264. [Google Scholar] [CrossRef] [PubMed]
- Wurzbacher, C.; Larsson, E.; Bengtsson-Palme, J.; Van den Wyngaert, S.; Svantesson, S.; Kristiansson, E.; Kagami, M.; Nilsson, R.H. Introducing ribosomal tandem repeat barcoding for fungi. Mol. Ecol. Resour. 2019, 19, 118–127. [Google Scholar] [CrossRef] [PubMed]
- Wright, B.; St. Clair, L.L.; Leavitt, S.D. Is targeted community DNA metabarcoding suitable for biodiversity inventories of lichen-forming fungi? Ecol. Indic. 2019, 98, 812–820. [Google Scholar] [CrossRef]
- Keepers, K.G.; Pogoda, C.S.; White, K.H.; Anderson Stewart, C.R.; Hoffman, J.R.; Ruiz, A.M.; McCain, C.M.; Lendemer, J.C.; Kane, N.C.; Tripp, E.A. Whole Genome Shotgun Sequencing Detects Greater Lichen Fungal Diversity than Amplicon-Based Methods in Environmental Samples. Front. Ecol. Evol. 2019, 7, 484. [Google Scholar] [CrossRef]
- Lendemer, J.C.; Keepers, K.G.; Tripp, E.A.; Pogoda, C.S.; McCain, C.M.; Kane, N.C. A taxonomically broad metagenomic survey of 339 species spanning 57 families suggests cystobasidiomycete yeasts are not ubiquitous across all lichens. Am. J. Bot. 2019, 106, 1090–1095. [Google Scholar] [CrossRef]
- Paul, F.; Otte, J.; Schmitt, I.; Dal Grande, F. Comparing Sanger sequencing and high-throughput metabarcoding for inferring photobiont diversity in lichens. Sci. Rep. 2018, 8, 8624. [Google Scholar] [CrossRef]
- Gueidan, C.; Li, L. A long-read amplicon approach to scaling up the metabarcoding of lichen herbarium specimens. MycoKeys 2022, 86, 195–212. [Google Scholar] [CrossRef]
- Piervittori, R.; Salvadori, O.; Isocrono, D. Literature on lichens and biodeterioration of stonework. IV. Lichenologist 2004, 36, 145–157. [Google Scholar] [CrossRef]
- Tratebas, A.M. Biodeterioration of prehistoric rock art and issues in site preservation. In Biodeterioration of Stone Surfaces; St. Clair, L.L., Seaward, M.R.D., Eds.; Kluwer Academic Publishers: Dordrecht, The Netherlands, 2004; pp. 195–228. [Google Scholar]
- McCune, B.; Haramundanis, K.; Gaposchkin, E.M. Lichenometric Dating of Historic Inscriptions on a Rock Outcrop in Coastal Oregon. Northwest Sci. 2019, 92, 388–394. [Google Scholar]
- Kitchell, J.A. Basketmaker and Archaic Rock Art of the Colorado Plateau: A Reinterpretation of Paleoimagery. Am. Antiq. 2010, 75, 819–840. [Google Scholar] [CrossRef]
- Escudié, F.; Auer, L.; Bernard, M.; Mariadassou, M.; Cauquil, L.; Vidal, K.; Maman, S.; Hernandez-Raquet, G.; Combes, S.; Pascal, G. FROGS: Find, Rapidly, OTUs with Galaxy Solution. Bioinformatics 2017, 34, 1287–1294. [Google Scholar] [CrossRef] [PubMed]
- Bernard, M.; Rué, O.; Mariadassou, M.; Pascal, G. FROGS: A powerful tool to analyse the diversity of fungi with special management of internal transcribed spacers. Brief. Bioinform. 2021, 22, bbab318. [Google Scholar] [CrossRef] [PubMed]
- Munger, I.A.; Baugh, M.; Henrie, J.R.; Hollinger, J.; Crepeau, R.; Leavitt, S.D. Integrative Biodiversity Inventories: Characterizing Lichen-Forming Fungal Diversity in Glen Canyon National Recreation Area Using DNA Barcoding and Vouchered Specimens. West. N. Am. Nat. 2022, 82, 213–233. [Google Scholar] [CrossRef]
- Rozewicki, J.; Yamada, K.D.; Katoh, K. MAFFT online service: Multiple sequence alignment, interactive sequence choice and visualization. Brief. Bioinform. 2019, 20, 1160–1166. [Google Scholar] [CrossRef]
- Nguyen, L.-T.; Schmidt, H.A.; von Haeseler, A.; Minh, B.Q. IQ-TREE: A Fast and Effective Stochastic Algorithm for Estimating Maximum-Likelihood Phylogenies. Mol. Biol. Evol. 2014, 32, 268–274. [Google Scholar] [CrossRef]
- Hoang, D.T.; Chernomor, O.; von Haeseler, A.; Minh, B.Q.; Vinh, L.S. UFBoot2: Improving the Ultrafast Bootstrap Approximation. Mol. Biol. Evol. 2017, 35, 518–522. [Google Scholar] [CrossRef]
- Kalyaanamoorthy, S.; Minh, B.Q.; Wong, T.K.F.; von Haeseler, A.; Jermiin, L.S. ModelFinder: Fast model selection for accurate phylogenetic estimates. Nat. Methods 2017, 14, 587–589. [Google Scholar] [CrossRef]
- Rambaut, A. FigTree Version 1.4. 2008. Available online: http://tree.bio.ed.ac.uk/software/Wgtree/ (accessed on 1 July 2022).
- Chase, M.W.; Fay, M.F. Barcoding of plants and fungi. Science 2009, 325, 682–683. [Google Scholar] [CrossRef]
- Lücking, R.; Leavitt, S.D.; Hawksworth, D.L. Species in lichen-forming fungi: Balancing between conceptual and practical considerations, and between phenotype and phylogenomics. Fungal Divers. 2021, 109, 99–154. [Google Scholar] [CrossRef]
- Heberle, H.; Meirelles, G.V.; da Silva, F.R.; Telles, G.P.; Minghim, R. InteractiVenn: A web-based tool for the analysis of sets through Venn diagrams. BMC Bioinform. 2015, 16, 169. [Google Scholar] [CrossRef] [Green Version]
- Shrestha, G.; St. Clair, L.L. The Lichen Flora of Southwestern Colorado. Evansia 2009, 26, 102–123. [Google Scholar] [CrossRef]
- Leavitt, S.D.; Hollinger, J.; Summerhays, S.; Munger, I.; Allen, J.; Smith, B. Alpine lichen diversity in an isolated sky island in the Colorado Plateau, USA—Insight from an integrative biodiversity inventory. Ecol. Evol. 2021, 11, 11090–11101. [Google Scholar] [CrossRef] [PubMed]
- Casanovas, P.; Lynch, H.J.; Fagan, W.F. Using citizen science to estimate lichen diversity. Biol. Conserv. 2014, 171, 1–8. [Google Scholar] [CrossRef]
- Munson, S.M.; Belnap, J.; Schelz, C.D.; Moran, M.; Carolin, T.W. On the brink of change: Plant responses to climate on the Colorado Plateau. Ecosphere 2011, 2, art68. [Google Scholar] [CrossRef]
- Koch, N.M.; Stanton, D.; Müller, S.C.; Duarte, L.; Spielmann, A.A.; Lücking, R. Nuanced qualitative trait approaches reveal environmental filtering and phylogenetic constraints on lichen communities. Ecosphere 2022, 13, e4042. [Google Scholar] [CrossRef]
- Gjerde, I.; Blom, H.H.; Heegaard, E.; Sætersdal, M. Lichen colonization patterns show minor effects of dispersal distance at landscape scale. Ecography 2015, 38, 939–948. [Google Scholar] [CrossRef]
- Gjerde, I.; Blom, H.H.; Lindblom, L.; Sætersdal, M.; Schei, F.H. Community assembly in epiphytic lichens in early stages of colonization. Ecology 2012, 93, 749–759. [Google Scholar] [CrossRef]
- Lavoie, C. Biological collections in an ever changing world: Herbaria as tools for biogeographical and environmental studies. Perspect. Plant Ecol. Evol. Syst. 2013, 15, 68–76. [Google Scholar] [CrossRef]
- Chervitz, S.A.; Deutsch, E.W.; Field, D.; Parkinson, H.; Quackenbush, J.; Rocca-Serra, P.; Sansone, S.-A.; Stoeckert, C.J.; Taylor, C.F.; Taylor, R.; et al. Data Standards for Omics Data: The Basis of Data Sharing and Reuse. In Bioinformatics for Omics Data: Methods and Protocols; Mayer, B., Ed.; Humana Press: Totowa, NJ, USA, 2011; pp. 31–69. [Google Scholar] [CrossRef]
- ten Hoopen, P.; Finn, R.D.; Bongo, L.A.; Corre, E.; Fosso, B.; Meyer, F.; Mitchell, A.; Pelletier, E.; Pesole, G.; Santamaria, M.; et al. The metagenomic data life-cycle: Standards and best practices. GigaScience 2017, 6, gix047. [Google Scholar] [CrossRef]
- Martorelli, I.; Helwerda, L.S.; Kerkvliet, J.; Gomes, S.I.F.; Nuytinck, J.; van der Werff, C.R.A.; Ramackers, G.J.; Gultyaev, A.P.; Merckx, V.S.F.T.; Verbeek, F.J. Fungal metabarcoding data integration framework for the MycoDiversity DataBase (MDDB). J. Integr. Bioinform. 2020, 17, 20190046. [Google Scholar] [CrossRef]
- Baird, D.J.; Hajibabaei, M. Biomonitoring 2.0: A new paradigm in ecosystem assessment made possible by next-generation DNA sequencing. Mol. Ecol. 2012, 21, 2039–2044. [Google Scholar] [CrossRef] [PubMed]
- Pappalardo, P.; Collins, A.G.; Pagenkopp Lohan, K.M.; Hanson, K.M.; Truskey, S.B.; Jaeckle, W.; Ames, C.L.; Goodheart, J.A.; Bush, S.L.; Biancani, L.M.; et al. The role of taxonomic expertise in interpretation of metabarcoding studies. ICES J. Mar. Sci. 2021, 78, 3397–3410. [Google Scholar] [CrossRef]


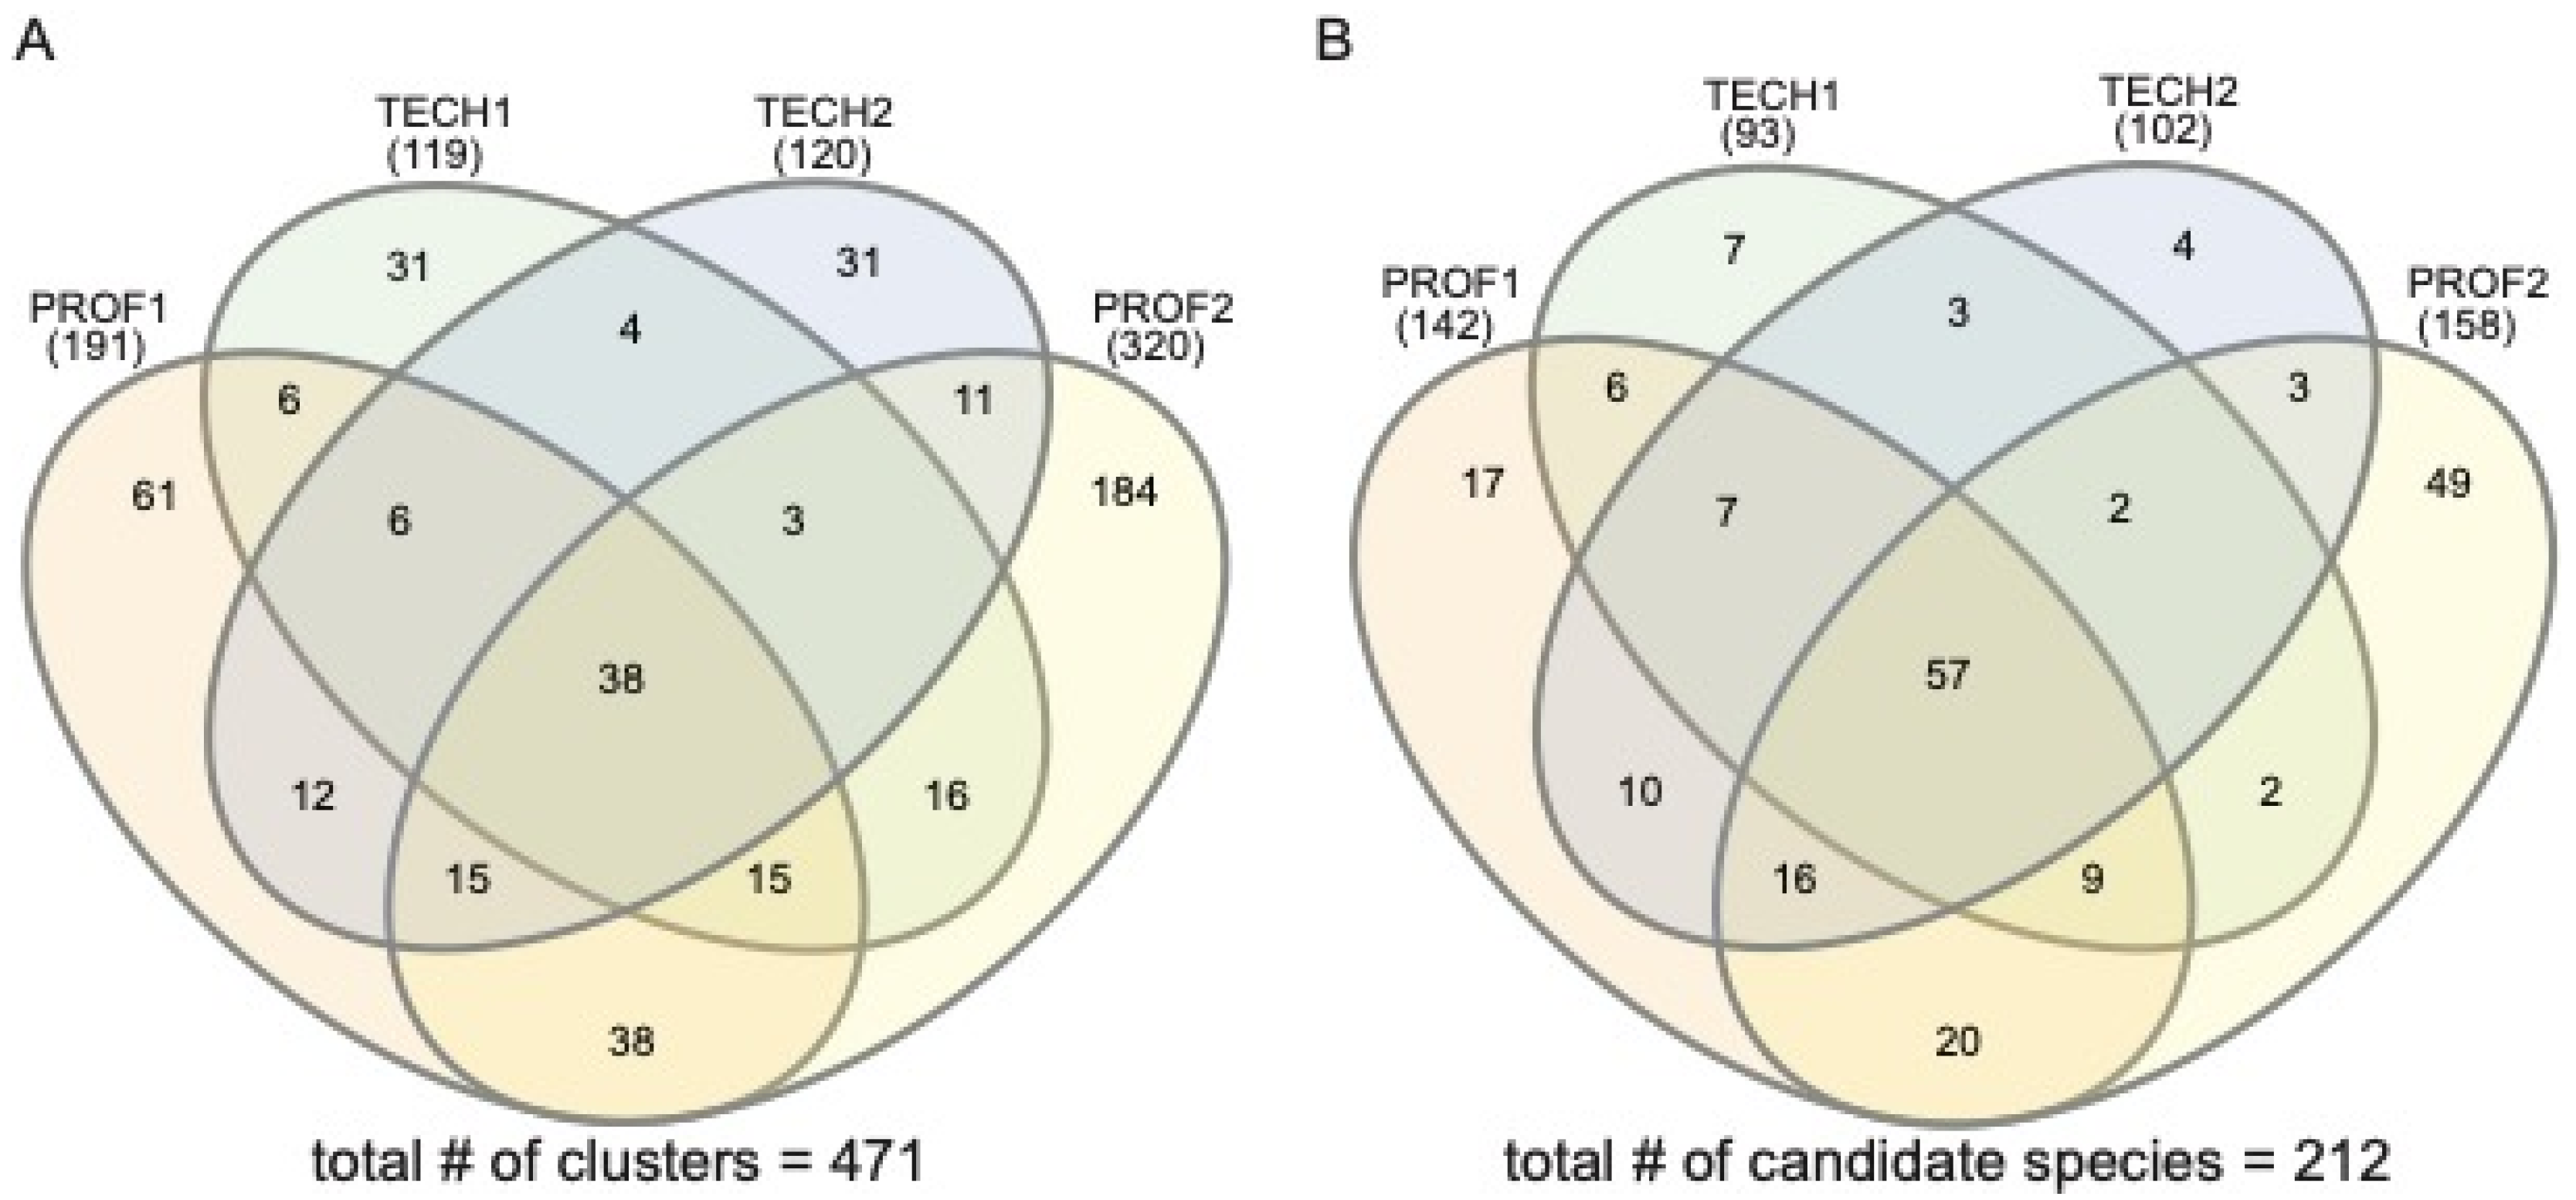
| Sample Name | Sampling Team | # of Reads | # Lichen-Forming Fungal Clusters/Species |
|---|---|---|---|
| “TECH1” | technician A & technician B—March 2022 | 48,051 | 119/93 |
| “TECH2” | technician C & technician D—March 2022 | 45,328 | 120/102 |
| “PROF1” | professional (SDL) & technician F—March 2022 | 53,492 | 191/142 |
| “PROF2” | professional (SDL), technician G & technician H—May 2022 | 127,049 | 320/158 |
| Total | composite of all sampling efforts | 273,920 | 473/212 |
| Family | Clusters | Candidate Species |
|---|---|---|
| Acarosporaceae | 110 | 44 (0.52) |
| Caliciaceae | 25 | 11 (0.55) |
| Candelariaceae | 51 | 9 (0.33) |
| Cladoniaceae | 1 | 1 (1.0) |
| Lecanoraceae | 80 | 35 (0.31) |
| Lichinaceae | 1 | 1 (1.0) |
| Megasporaceae | 18 | 12 (0.17) |
| Parmeliaceae | 3 | 3 (0) |
| Physciaceae | 28 | 18 (0.28) |
| Placynthiaceae | 2 | 2 (1.0) |
| Psoraceae | 3 | 3 (0.33) |
| Ramalinaceae | 10 | 7 (0.43) |
| Stereocaulaceae | 2 | 1 (0) |
| Teloschistaceae | 40 | 19 (0.10) |
| Thelotremataceae | 3 | 2 (0) |
| Trapeliaceae | 2 | 2 (1.0) |
| Verrucariaceae | 88 | 38 (0.34) |
| Unknown | 6 | 4 (1) |
| Total | 473 | 212 (0.37) |
Publisher’s Note: MDPI stays neutral with regard to jurisdictional claims in published maps and institutional affiliations. |
© 2022 by the authors. Licensee MDPI, Basel, Switzerland. This article is an open access article distributed under the terms and conditions of the Creative Commons Attribution (CC BY) license (https://creativecommons.org/licenses/by/4.0/).
Share and Cite
Henrie, J.R.; Thomson, B.M.; Yungfleisch, A.A.; Kerr, M.; Leavitt, S.D. Characterizing Crustose Lichen Communities—DNA Metabarcoding Reveals More than Meets the Eye. Diversity 2022, 14, 766. https://doi.org/10.3390/d14090766
Henrie JR, Thomson BM, Yungfleisch AA, Kerr M, Leavitt SD. Characterizing Crustose Lichen Communities—DNA Metabarcoding Reveals More than Meets the Eye. Diversity. 2022; 14(9):766. https://doi.org/10.3390/d14090766
Chicago/Turabian StyleHenrie, Jacob R., Brenden M. Thomson, Andrew August Yungfleisch, Michael Kerr, and Steven D. Leavitt. 2022. "Characterizing Crustose Lichen Communities—DNA Metabarcoding Reveals More than Meets the Eye" Diversity 14, no. 9: 766. https://doi.org/10.3390/d14090766