Article

Genetic Diversity in Leatherback Turtles (Dermochelys coriacea) along the Andaman Sea of Thailand

by
Chutima Wongfu
1,
Wareerat Prasitwiset
1,
Anocha Poommouang
1,
Kittisak Buddhachat
2,3,
Janine L. Brown
4,
Siriwadee Chomdej
2,5,
Jatupol Kampuansai
5,
Patcharaporn Kaewmong
6,
Kongkiat Kittiwattanawong
6 and
Korakot Nganvongpanit
1,2,*
1
Department of Veterinary Biosciences and Public Health, Faculty of Veterinary Medicine, Chiang Mai University, Chiang Mai 50100, Thailand
2
Excellence Center in Veterinary Bioscience, Chiang Mai University, Chiang Mai 50200, Thailand
3
Department of Biology, Faculty of Science, Naresuan University, Phitsanulok 65000, Thailand
4
Center for Species Survival, Smithsonian Conservation Biology Institute, Front Royal, VA 22630, USA
5
Department of Biology, Faculty of Science, Chiang Mai University, Chiang Mai 50200, Thailand
6
Phuket Marine Biological Center, Phuket 83000, Thailand
*
Author to whom correspondence should be addressed.
Diversity 2022, 14(9), 764; https://doi.org/10.3390/d14090764
Submission received: 24 August 2022 / Revised: 13 September 2022 / Accepted: 13 September 2022 / Published: 15 September 2022
(This article belongs to the Special Issue Genetic Diversity and Phylogeography of Turtles (Testudines))

Abstract

:
The leatherback sea turtle (Dermochelys coriacea) is the largest and one of the most migratory turtle species, inhabiting oceans throughout the world. There has been a steady decline in leatherback populations over the past several decades due to human activities. They are considered endangered in Thailand and global, so conservation strategies are needed to study and protect the species, including determining their genetic diversity. A total of 8 microsatellite loci and 658 bp amplicon of mitochondrial DNA (mtDNA) were used to assess genetic data from 149 dead leatherback turtle hatchlings among 14 nests in five locations along the Andaman Sea, Thailand, between 2018–2020. The microsatellite findings show that the observed heterozygosity (Ho) ranged from 0.44 ± 0.09 to 0.65 ± 0.10. Population structures were further divided into two genetically distinct groups by Bayesian inference. For the mtDNA control region, our samples consisted of three haplotypes. Globally, there are 27 haplotypes of leatherback turtles, with a relatively low genetic diversity (h = 0.43). These results reveal the genetic status of leatherback turtles in Thailand and globally, and raise concerns about their relative genetic health, which highlight the need for proactive, long-term management and conservation strategies for this endangered species.

Graphical Abstract

1. Introduction

The leatherback sea turtle (Dermochelys coriacea) is the largest turtle species with a carapace composed of tough rubbery skin. The species is highly migratory and has the widest global distribution of any reptile, nesting primarily on tropical and subtropical beaches [1]. Once inhabiting all oceans except the Arctic and Antarctic, leatherback populations are declining precipitously throughout their range, and today numbers are estimated to be only about 2300 adult females globally [2]. Threats to the species exist on both nesting beaches and in the ocean, and include incidental capture in fishing gear (bycatch), hunting, and egg collection for food [3]. The species is listed as Vulnerable by the International Union for Conservation of Nature (IUCN RED LIST) and in Appendix I by the Convention on International Trade in Endangered Species (CITES) [4]. It is considered endangered in Thailand [5]. The Pacific population is the most at risk, with near extinction predicted by 2040 based on the current rate of decline [6,7,8]. A previously large nesting population in Malaysia already has been declared extinct [9].
Leatherback turtles have complex migration and life history characteristics [10], including homing to natal nesting beaches [11]. The migration patterns of juveniles are largely unknown [12], but climate change is believed to have a significant impact on population and breeding success [13,14]. Moreover, studies have shown declining loggerhead and leatherback turtle populations in some areas because of anthropogenetic activities, such as fishery bycatch in the Pacific Ocean [15], and plastic debris for leatherback turtles along French Guiana [16] and the Mediterranean Sea [17]. Most of the worldwide genetic studies of leatherback turtle have focused on nesting areas where females lay eggs in the sand [11,18,19,20,21], particularly in the North Atlantic and South Atlantic oceans [22,23,24]. To date, there are no reports of the genetic structure of leatherback sea turtles inhabiting the waters of Andaman Sea; only nesting relocation and eggshells of this species were studied in this area [25].
Mitochondrial DNA (mtDNA) markers are mostly inherited maternally and are important for species identification, but it can lack resolving power due to the slow rate of mitochondrial evolution, including in turtle species [26]. By contrast, nuclear markers (e.g., microsatellites) are inherited from both parents and so incorporate male connectivity that is essential for delineating populations with greater accuracy and statistical power. For example, the genetic analysis of green turtles in Turkey found different microsatellite allele frequencies suggestive of an underlying population structure that was not detected by mtDNA analysis [27]. Similarly, in leatherback turtles, mtDNA analysis distinguished seven populations in the Atlantic, whereas nine populations were clearly identified based on microsatellite analyses [19]. Thus, combining mtDNA and nuclear marker analyses can provide insight into male-mediated gene flow and population boundaries, identify differences between regions and species, and further advance our understanding of female and natal homing and fine-scale population structure. It is possible that leatherback turtles nesting in the Andaman Sea of Thailand differ genetically from turtles inhabiting other parts of the world. Thus, in the present study, we investigate genetic diversity and population structure using microsatellite DNA marker and mtDNA control region analyses of dead hatchling leatherback turtles along the coasts of the Andaman Sea to understand how genetic patterns compare with data on worldwide populations provided by the National Center for Biotechnology Information. An understanding of differences in genetic diversity or population structure of leatherback turtles in Thai waters could have a significant impact on their conservation status and management.

2. Materials and Methods

2.1. Sample Collection and DNA Extraction

Samples (n = 149) from dead hatchling leatherback turtles in 14 nests along the Andaman Sea coastline of Thailand during 2018–2020 were collected and preserved in 95% ethanol at −20 °C (Table 1). Tissue samples were preserved in 70% ethanol and approximately 50 mg used for DNA isolation (E.Z.N.A.® Tissue DNA Kit, Omega, Norcross, GA, USA). DNA was measured for quality and quantity using a DU®730 spectrophotometer (Beckman Coulter, CA, USA) and the samples stored at −20 °C until analysis. This study was approved by the Laboratory Animal Research Center, Chiang Mai University, Thailand (No. R13/ 2021). All methods were carried out in accordance with relevant guidelines and regulations.

2.2. Microsatellite Amplification and Genotyping

Twelve microsatellite loci were selected from those previously identified and characterized for leatherback turtles [28] and screened using a polymerase chain reaction (PCR) technique, resulting in the selection of eight that produced reproducible and unambiguous bands (Table 2). The PCR reaction was carried out in a total volume of 25 µL: 1X ViBuffer S [16 mM (NH2)4SO4, 50 mM Tris-HCl, 1.75 mM MgCl2, and 0.01% TritonTM X-100)], 0.2 µM dNTP (Vivantis, Selangor Darul Ehsan, Malaysia), 0.2 µM microsatellite primer (each forward primer had a 50 M13 complementary tail to enable labeling with a fluorescent M13 primer), 1 U Taq DNA polymerase (Vivantis, Selangor Darul Ehsan, Malaysia), and 10 ng DNA template in deionized water. For every PCR reaction, deionized water was used instead of the DNA template to serve as a negative control. Amplifications were conducted in a PTC-200/DNA Engine thermal cycler (Bio-Rad Laboratories, Inc., Hercules, CA, USA). PCR cycling parameters were as follows: pre-denaturation at 95 °C for 5 min, followed by 40 cycles consisting of a denaturation step at 95 °C for 30 s, at an optimal annealing temperature (Table 2) and an extension step at 72 °C for 1 min with a final extension step at 72 °C for 10 min. The PCR products were stained by RedSafeTM Nucleic acid staining solution (iNtRON Biotechnology, Seongnam-Si, Gyeonggi-do, South Korea) and then separated electrophoretically on 2% agarose gel (PanReac AppliChem ITW companies, Darmstadt, Germany) by PowerPac 200 (Bio-Rad, Hercules, CA, USA) containing 1X Tris-acetate-ethylenediaminetetraacetate (TAE) buffer at 120 V for 30 min. The PCR products were then visualized by UV light under a GelMax 125Imager (UVP, Cambridge, UK). Fragment analysis was performed using an Applied Biosystems® Genetic Analyzer (Thermo Fisher Scientific®, Waltham, MA, USA) Ward Medic Ltd. Bangkok, Thailand. The fragments were sized on GENE MARKER® software.

2.3. Mitochondrial DNA

The primers LCM15382 (5′-GCTTAACCCTAAAGCATTGG-3′), H950g (5′-GTCTCGGATTTAGGGGTTTG-3′) [29] were used to amplify the mtDNA control region. PCR was conducted in a total volume of 25 μL. Reactions generally contained 1X PCR buffer, 50 ng DNA templates, 1 U Taq DNA polymerase, 0.2 mM dNTP, 0.2 μM of forward primer and reverse primer, adjusted to 25 μL with deionized or distilled water. DNA amplifications were performed in a PCR thermocycler machine (Bio-Rad Laboratories, Inc., CA, USA). The temperature was programmed at 95 °C for 5 min with 40 cycles of denaturation at 95 °C for 30 s, annealing at 55 °C for 30 s and extension at 72 °C for 1 min. The final extension was performed at 72 °C for 10 min followed by a hold step at 4 °C. The amplified fragment was analyzed by electrophoresis in a 2% agarose gel stained by 3 μL 5X GelRed and 3 μL of 6X loading dye in tris-acetic acid-EDTA (TAE) buffer at 120 V for 25–30 min and viewed under ultraviolet light. Sequencing analysis was performed by ATGC Co., Ltd. Pathumthani, Thailand Using 3730XL-96 GENETIC ANALYZER (Thermo Fisher Scientific®, UK).

2.4. Data Analysis

2.4.1. Microsatellite Analysis

Microsatellite comparisons were made among five nesting areas (Table 1): Khuk Khak Beach (Zone 1); Bor Dan Beach (Zone 2); Sai Keaw Beach (Zone 3); Nai Thon Beach (Zone 4); and Bang Kwan Beach (Zone 5). Hardy–Weinberg Equilibrium p-values (HWE p-value), observed number of alleles (Na), effective number of alleles (Ne), Shannon’s information index (I), observed heterozygosity (Ho), expected heterozygosity (He), and F-statistics were analyzed by GENALEX program version 6.5. The statistical parameters of forensic interest, including power of discrimination [30], matching probability [31], and power of exclusion (PE), were calculated by GENALEX program version 6.5.

2.4.2. Population Structure

A total of 149 samples were analyzed by distance and model-based clustering methods to reveal population affinity and structure. Pairwise linearized genetic distance based on the number of different alleles (Fst) was computed by GENALEX program version 6.5. A Bayesian clustering approach implemented in STRUCTURE version 2.3.4 was used to cluster individuals into populations on the basis of microsatellite genotypes with admixture-assumed and correlated allele frequencies. The LOCPRIOR model was used to infer cryptic population structure K = 1 to K = 10, using the admixture population model, 1,000,000 iterations, 50,000 burn-in replicates and five independent replicates per K value [21]. This method uses a Markov Chain Monte Carlo (MCMC) approach in order to group individuals into K populations based on their genotypes without any prior information. The best K value was defined using the log probability of the data Pr(X|K) for each value of K by the STRUCTURE HARVESTER to identify the optimal number of clusters in the data. Outputs from the STRUCTURE HARVESTER were graphically modified by DISTRUCT [32]. The pairwise Fst comparison confirmed the genetic difference among population. To visualize the relationships among the population, the principal component analysis (PCA) plot constructed from a distance matrix of linearized Fst. The unweighted pair-group method of arithmetic averages (UPGMA) tree was constructed based on Nei’s genetic distances using the Molecular Evolutionary Genetics Analysis (MEGA) 6.0 software [33].

2.4.3. Kinship Analysis

To evaluate relatedness among leatherback turtles, the ML-RELATE program [34] was used to calculate the maximum likelihood estimates of relatedness (r value) [35] based on [36]. ML-RELATE uses a downhill simplex routine to find the maximum likelihood estimate of r value. ML-RELATE estimates r for one pair of individuals only. The r value indicates a relatedness with a value of 0–1 (1 = strongly correlated, 0 = not correlated) with 0.05 level of significance. This method was chosen because the maximum likelihood estimates of relatedness are usually more accurate than other estimators [37]. Relatedness analysis produced results in both matrix and list output formats. Heatmap and clustering based on matrix output were produced by R-STUDIO program version 4.1 [38].

2.4.4. Mitochondrial DNA Control Region Analysis

Consensus sequences (GenBank accession number: OK040245–OK040379) (Supplementary Material Table S1) were edited and aligned manually using the program MEGA-X version 10.2.2 [31], performed with Crustal W implement in MEGA 3.1. We also used the median joining Thai leatherback turtle alignment, which consisted of 144 mtDNA control region sequences obtained from samples collected in the Andaman Sea. The global leatherback turtle alignment of 1484 sequences included these Thai sequences and additional sequences downloaded from GenBank (Table S2). The genetic diversity of mtDNA control region was computed through DnaSP version 6.12.3 [39] and illustrated as the term of the number of haplotypes (H), haplotype diversity (h), and nucleotide diversity (π).

2.4.5. The Median Joining Network (MJN) Analysis and Genetic Diversity

To depict the maternal lineage haplotypes relationship and the mutation steps of observed haplotype, the median joining networks were analyzed using Popart version 1.7 [40], performed in two analyses. The first analyzed the haplotype in Andaman Sea, the second analyzed the haplotype globally.

2.4.6. Phylogenetic Trees Construction

After the alimented mtDNA control region sequences of species were generated, J model test version 2.1.10 [41] was used to select the best tree evolutionary models for the species. The best-fit substitution model was found to be GTR + G. The phylogenetic trees of worldwide and Andaman Sea samples were constructed using MrBayes version 3.2.7. with MCMC 20,000,000 iterations for each tree, the first 1,000,000 iterations as burn-in [30], and envision the tree using iTOL version 6.1.1 [42].

2.4.7. Bayesian Skyline Plots (BSPs)

For the estimation of the effective population size of the worldwide and Andaman Sea leatherback turtle populations, Bayesian skyline plots were implemented in BEAUti and BEAST version 2.6.3 [43]. The substitution model and a strict clock model were used for mtDNA control region sequences. The BSPs were visualized using Bayesian Skyline Reconstruction executed in Tracer version 1.7.1 [44].

3. Results

3.1. Microsatellite Primers

The observed mean heterozygosity was lower than the expected heterozygosity. The highest observed heterozygosity (0.703) was shown by locus LB110, while the lowest (0.293) was shown by locus LB157. Maximum expected heterozygosity (0.839) was provided by LB143 and the minimum (0.448) was shown by LB157. The mean allele difference between the populations (Fst) was 0.260, mean inbreeding coefficient (Fis) was −0.020, and the mean number of migration (Nm) was 0.864 (Table 3). All microsatellite loci significantly deviated from the Hardy–Weinberg Equilibrium, which means there were some degrees of assortative mating, selection, or population stratification by these loci (Table 3).

3.2. Genetic Diversity

The genetic variation of leatherback turtles in Zone 1 was the highest compared to all other zones, with that in Zone 2 being the lowest (Table 4). The observed heterozygosity ranged from 0.437 to 0.646 and the expected heterozygosity ranged from 0.463 to 0.633 (Table 4). Forensic parameter estimates comprised a combined power of discrimination (PD) and power of exclusion (PE) [30] that was greater than 0.999 and 0.98, respectively, for the leatherback population in the Andaman Sea (Table 4).

3.3. Genetic Differentiation and Population Structure

The pairwise Fst values of Nei’s genetic distance analysis (Table S3) showed the lowest distance between Zones 2 and 3 (0.048), and the highest between Zones 3 and 5 (0.302). In the UPGMA dendrogram, two main clusters were identified (Figure 1a). In the main cluster, Zones 2, 3, and 4 grouped together, while Zones 1 and 5 were in the second main cluster. STRUCTURE analysis identified the highest ΔK at K = 2 for 10 simulations at K values from 1 to 10. Two genetic clusters were identified (Figure 1b), one in Zones 2 to 4 (yellow color) and the another in Zone 5 (blue). Zone 1 had a mix of the two genetic clusters. The PCA of microsatellite loci of the five zones plotted on cumulatively explained 39.02% of the variation. The PCA plot of the five zones revealed the populations were divided into two groups (Figure 1c).

3.4. Kinship Analysis

From analyzing the genetic relationship, two related groups were identified: leatherback turtles from all zones except Zone 5 (Bang Kwan Beach), and individuals in Zone 1 (Khuk Khak Beach) and Zone 5 (Bang Kwan Beach) (Figure 2).

3.5. Mitochondrial DNA

Based on mtDNA control region sequence data from 144 specimens (686 bp, 14 nests), three haplotypes were identified (Hap_1, Hap_2, and Hap_3). Fifty individuals (34.72%) presented with Hap_1 were found in nests 3, 4, and 5; 85 individuals (59.02%) in Hap_2 were found in nests 1, 2, and 7 to 14; and Hap_3 was found in nest 6 with only 9 individuals (6.25%) (Figure 3a). The genetic pattern of samples performed using mtDNA control region analyses showed that each nesting site had a specific haplotype, but not more than one. The 85 individuals with Hap_2 were found mainly in the Thai Andaman Sea.
One nest with samples from Khuk Khak Beach was represented in Hap_3, while two nests were found in Hap_2. The remaining four zones had only one haplotype in each zone. Hap_1 three nests was found in Bor Dan, Sai Kaew, and Nai Thon Beaches, while Hap_2 for eight nests was found in Bang Kwan Beach (Figure 3b).
The global analysis based on data from 1484 sequences of mtDNA control region identified 27 haplotypes (Figure 4a). The genetic diversity of population sites was expressed by haplotype diversity (h) and nucleotide diversities ( π ) within populations as h = 0.43 and π = 0.00203 , respectively. The number of polymorphic (segregating) sites was = 33. Hap_1 was the most common haplotype globally and was found in many areas (Figure 4). Examining the global haplotype distribution of leatherback turtles, three haplotypes in the Andaman Sea appeared to be linked to haplotypes found in South Africa and the Atlantic Ocean (Figure 4a).
The phylogenetic tree of global leatherback turtles (296 sequences) identified four clades: three paraphyly clades, A, B1, and B2, and one monophyly clade, B3. All samples in this study (n = 144) were found in clade B3 (Figure 4c). A Bayesian Skyline Plot (BSP) was used to estimate population size changes and found the leatherback turtle population since 400 million years ago has been fairly constant or slightly increased (Figure 5).

4. Discussion

To date, genetic studies of leatherback turtles in the Andaman Sea have been limited; thus, our findings are pivotal for use in the field of turtle conservation. In this paper, we used information from microsatellite and mtDNA control region analyses to understand the genetic diversity and structure of leatherback turtles inhabiting coastal areas of the Andaman Sea, compared to that of global populations. Both analyses indicate the low genetic diversity of turtles in the Andaman Sea, with the exception of the Khuk Khak Beach (zone 1) population. This zone appeared to be more diverse than the others because it contained two genetic clusters from the population structure analysis. Moreover, two mtDNA control region haplotypes were found in this zone, which was greater than the others. However, data should be interpreted with caution because the samples from Khuk Khak Beach were from two nesting periods while the others were from only one nesting period. We suggest that additional analyses in this region be conducted because there could be more genetic variation in later nesting periods. In light of the similarity of the genetic pattern between Khuk Khak Beach and Bang Kwan Beach for both population structure and mtDNA, it is possible the same female oviposited in both zones. The pairwise Fst Values of Nei’s genetic distance ranged from 0.048 to 0.302, suggesting the possibility of eight loci for estimating genetic relatedness among individuals in populations of unknown pedigree. From kinship analyses, we postulated that the two groups of leatherback turtles in Bang Kwan Beach and Khuk Khak Beach might be genetically related, while those at Bang Kwan Beach were not related to the others. Furthermore, it appears some individuals in the Khuk Khak Beach population (11.5%) are likely to be siblings of those at Bang Kwan Beach (88.5%). Thus, female turtles with the same genetic pattern or kinship may be laying eggs in different areas, perhaps because human activities (e.g., tourism) are disturbing historical laying sites, causing females to seek and lay eggs elsewhere.
Three haplotypes in the Andaman Sea were similar to haplotypes found in South Africa and the Atlantic Ocean, suggesting a common genetic history between these geographically different locations. In the global analysis, we observed 27 haplotypes of leatherback turtles, which differed from previous studies [11,19,24,45]. Different numbers of haplotypes between studies are likely linked to the length and number of sequences and SNP frequency [46]. In leatherback turtles, Dutton and colleagues [11] analyzed the mtDNA control region of Brazilian leatherback turtles with lengths of 496 and 711 bp and found longer sequences that identified seven haplotypes, while shorter sequences found only five. In 2013, an analysis of nucleotide sequences of 763 bp found 10 haplotypes [19]. Our study used 1484 sequences with a length of 658 bp and identified 27 haplotypes, compared to 1059 sequences with a length of 763 bp that resulted in 10 haplotypes [19]. So, while the length of the nucleotide sequences using the mtDNA control region in this study was somewhat shorter, the analysis revealed more haplotypes than previous studies.
Haplotype diversity in the Thai Andaman Sea, Atlantic coast [47], and Northwest Atlantic [21] populations all showed a similarly low genetic diversity, and a low haplotype diversity globally (h = 0.43). In Brazil (pelagic aggregate), the results showed low haplotype diversity and low nucleotide diversity (h = 0.37, π = 0.0014) in 52 samples with seven haplotypes [23]. In 2019, a report of nine nesting sites in the Atlantic and South-west Indian Ocean detected additional mtDNA variation with the longer sequences, identifying 10 haplotypes [45]. These results show that the genotype of leatherback turtles has low diversity, which may be due to female natal homing activity resulting in increased inbreeding. Future studies should investigate if population diversity continues to decline, and what impact that may be having on population fitness.
While we were interested in determining how many females were laying eggs in the 14 studied nests, that was not possible from the microsatellite data because we lacked maternal DNA. Microsatellite markers are capable of discriminating between related and unrelated individuals where no pedigree information is available [48], whereas control region data can estimate the number of females laying eggs at each nesting site through maternal inheritance based on haplotype and determine the genetic pattern. Based on our identification of three haplotypes, at least three female turtles with different DNA were laying eggs along the Andaman Sea. To estimate the number of females spawning, other mitochondrial regions (e.g., cytochrome C oxidase I) [49,50] and cytochrome b [51,52] could be used, or longer control region DNA sequencing could be performed.
Currently, high throughput methods such as RAD-Seq have been used for obtaining complete mitochondrial genome from sea turtles that can provide greater resolution than using some part of mtDNA genes [51]. It is considered a cost-effective and efficient method for gaining in-depth genetic information; however, the use of traditional markers in this study was also sufficient to estimate population status of leatherback turtle in the Thai Andaman Sea. The eight microsatellite markers used in this study were enough to evaluate the genetic diversity of leatherback turtles in the Andaman Sea. From our study, the MP value = 0.000000048, meaning that over 10 million leatherback turtles had the same genetic makeup of four leatherback turtles; however, the population in the Andaman Sea is not over 10 million animals [53]. Analyses of mtDNA are often used in evolution and genetic diversity studies. It is widely known that the mtDNA is inherited mostly from maternal lineages, and that descending mtDNA by male or paternal leakage is not a common phenomenon [54,55]. For sea turtles, the paternal inheritance of mtDNA is poorly understood, although heteroplasmy can occur by spontaneous mutation, as observed in green turtles (Chelonia mydas) [56], hawksbill turtle (Eretmochelys imbricata), and logger head turtle (Caretta caretta) [57]. This could lead to the variation of mtDNA of individuals and increase in population diversity [56]. However, for the leatherback turtle, evidence of the occurrence of heteroplasmy has not been demonstrated, including in this study. Our evaluations of both microsatellite and control region indicated that leatherback turtle populations have low genetic diversity in the Andaman Sea, while the control region enabled the estimation of the number of females that laid egg in different nests and beaches, estimated of at least three individuals in the study area. This information can be used to support and develop management strategies of wild leatherback turtles aiming to conserve genetic diversity in the future.
This study had some limitations. First, while sampling dead hatchlings is an accepted method for sea turtles [58,59,60], we only analyzed 149 samples from 14 nests, which might not be a good representation of the entire population. For this, all microsatellite loci were found to deviate significantly from HWE; however, some populations (zones) did not, which could be the effect of low sample size in each population. More hatchlings from more nests along the Andaman coastline could improve the data. Previous studies of leatherback turtle populations used as few as five microsatellites marker loci [61] and as many as 17 loci [19]. In this study, eight microsatellite markers were used, which was enough to study the genetic diversity in this population; however, more markers might provide better discrimination.

5. Conclusions

This study analyzed, for the first time, the genetic status of leatherback turtles in the Andaman Sea, Thailand. The results found three haplotypes in the Andaman Sea, information that could be useful in the development of long-term management and conservation guidelines for this species. Maintaining a high level of genetic diversity is essential for the conservation of at-risk populations and ensuring long-term population fitness. At present, the leatherback turtle has not been successfully raised in captivity, which limits the efficiency of conservation strategies for the species. Therefore, it is important to conserve the remaining populations of wild leatherback turtles throughout their range.

Supplementary Materials

The following supporting information can be downloaded at: https://www.mdpi.com/article/10.3390/d14090764/s1, Table S1 Metadata and sampling codes for Andaman Sea Thailand leatherback turtle populations, Table S2 Leatherback turtles mitochondrial DNA control region sequences retrieved from GenBank, Table S3 The pairwise population Fst values of genetic distance.

Author Contributions

Formal analysis, C.W. and W.P.; Funding acquisition, K.N.; Investigation, C.W. and W.P.; Methodology, C.W. and W.P.; Project administration, K.N.; Resources, P.K. and K.K.; Software, C.W., W.P., A.P. and J.K.; Supervision, K.B., S.C., J.K. and K.N.; Validation, A.P., K.B., S.C., J.K., K.K. and K.N.; Visualization, A.P., J.L.B. and K.N.; Writing—original draft, C.W., W.P. and K.N.; Writing—review and editing, J.L.B. and K.N. All authors have read and agreed to the published version of the manuscript.

Funding

This research was funded by Excellence Center in Veterinary Bioscience, Chiang Mai University, Chiang Mai 50200, Thailand (number; 009/2022).

Institutional Review Board Statement

This study was approved by the Laboratory Animal Research Center, Chiang Mai University, Thailand (No. R13/2021).

Data Availability Statement

The accession numbers presented in this study are available in Table S1.

Acknowledgments

We dedicate the value of this research to the Phuket Marine Biological Center, Phuket, Thailand, for supported samples, data, and additional information for analyzed the results.

Conflicts of Interest

The authors declare no conflict of interest. The funders had no role in the design of the study; in the collection, analyses, or interpretation of data; in the writing of the manuscript; or in the decision to publish the results.

References

  1. National Oceanic and Atmospheric Administration. Leatherback Turtle. 2022. Available online: https://www.fisheries.noaa.gov/species/leatherback-turtle (accessed on 20 February 2022).
  2. World Wildlife Fund. The Leatherback Turtle. Available online: https://wwf.panda.org/discover/knowledge_hub/endangered_species/marine_turtles/leatherback_turtle/ (accessed on 20 February 2022).
  3. Wallace, B.P.; Saba, V.S. Environmental and anthropogenic impacts on intra-specific variation in leatherback turtles: Opportunities for targeted research and conservation. Endanger. Species Res. 2009, 7, 11–21. [Google Scholar] [CrossRef]
  4. CITES. Dermochelys Coriacea. Available online: https://bit.ly/36i3E4m (accessed on 20 February 2022).
  5. Areekijseree, M.; Pumipaiboon, M.; Nuamsukon, S.; Kittiwattanawong, K.; Thongchai, C.; Sikiwat, S.; Chuen-Im, T. Leatherback turtle (Dermochelys coriacea) after incubation eggshell in Andaman Sea, Thailand study: Microanalysis on ultrastructure and elemental composition. Int. J. Bioeng. Life Sci. 2013, 7, 820–824. [Google Scholar]
  6. Tiwari, M.; Wallace, B.; Girondot, M. Dermochelys coriacea West Pacific Ocean subpopulation. In The IUCN Red List of Threatened Species 2013; IUCN: Gland, Switzerland, 2013; p. T46967817A46967821. [Google Scholar]
  7. Spotila, J.R.; Dunham, A.E.; Leslie, A.J.; Steyermark, A.C.; Plotkin, P.T.; Paladino, F.V. Worldwide population decline of Dermochelys coriacea: Are leatherback turtles going extinct? Reducción mundial de la población de Dermochelys coriaceae: Están las tortugas baula en vía de extinción. Chelonian Conserv. Biol. 1996, 2, 209–222. [Google Scholar]
  8. Spotila, J.R.; Reina, R.D.; Steyermark, A.C.; Plotkin, P.T.; Paladino, F.V. Pacific leatherback turtles face extinction. Nature 2000, 405, 529–530. [Google Scholar] [PubMed]
  9. Chan, E. Decline of the leatherback population in Terengganu, Malaysia, 1956–1995. Chelonian Conserv. Biol. 1996, 2, 196–203. [Google Scholar]
  10. Bolten, A.B.; Lutz, P.; Musick, J.; Wyneken, J. Variation in sea turtle life history patterns: Neritic vs. oceanic developmental stages. Biol. Sea Turt. 2003, 2, 243–257. [Google Scholar]
  11. Dutton, P.H.; Bowen, B.W.; Owens, D.W.; Barragan, A.; Davis, S.K. Global phylogeography of the leatherback turtle (Dermochelys coriacea). J. Zool. 1999, 248, 397–409. [Google Scholar] [CrossRef]
  12. Gaspar, P.; Benson, S.R.; Dutton, P.H.; Réveillère, A.; Jacob, G.; Meetoo, C.; Dehecq, A.; Fossette, S. Oceanic dispersal of juvenile leatherback turtles: Going beyond passive drift modeling. Mar. Ecol. Prog. Ser. 2012, 457, 265–284. [Google Scholar]
  13. Tomillo, P.S.; Oro, D.; Paladino, F.V.; Piedra, R.; Sieg, A.E.; Spotila, J.R. High beach temperatures increased female-biased primary sex ratios but reduced output of female hatchlings in the leatherback turtle. Biol. Conserv. 2014, 176, 71–79. [Google Scholar] [CrossRef]
  14. Santidrián Tomillo, P.; Saba, V.S.; Blanco, G.S.; Stock, C.A.; Paladino, F.V.; Spotila, J.R. Climate driven egg and hatchling mortality threatens survival of Eastern Pacific leatherback turtles. PLoS ONE 2012, 7, e37602. [Google Scholar]
  15. Lewison, R.L.; Freeman, S.A.; Crowder, L.B. Quantifying the effects of fisheries on threatened species: The impact of pelagic longlines on loggerhead and leatherback sea turtles. Ecol. Lett. 2004, 7, 221–231. [Google Scholar] [CrossRef]
  16. Plot, V.; Georges, J.-Y. Plastic debris in a nesting leatherback turtle in French Guiana. Chelonian Conserv. Biol. 2010, 9, 267–270. [Google Scholar] [CrossRef]
  17. Caracappa, S.; Persichetti, M.F.; Gentile, A.; Caracappa, G.; Curro, V.; Freggi, D.; Arculeo, M. New records of leatherback sea turtle, Dermochelys coriacea (Vandelli, 1761) (Testudines: Dermochelyidae) in the Strait of Sicily. Cah. Biol. Mar. 2017, 58, 353–357. [Google Scholar]
  18. Dutton, P.H.; Hitipeuw, C.; Zein, M.; Benson, S.R.; Petro, G.; Pita, J.; Rei, V.; Ambio, L.; Bakarbessy, J. Status and genetic structure of nesting populations of leatherback turtles (Dermochelys coriacea) in the western Pacific. Chelonian Conserv. Biol. 2007, 6, 47–53. [Google Scholar] [CrossRef]
  19. Dutton, P.H.; Roden, S.E.; Stewart, K.R.; LaCasella, E.; Tiwari, M.; Formia, A.; Thomé, J.C.; Livingstone, S.R.; Eckert, S.; Chacon-Chaverri, D. Population stock structure of leatherback turtles (Dermochelys coriacea) in the Atlantic revealed using mtDNA and microsatellite markers. Conserv. Genet. 2013, 14, 625–636. [Google Scholar] [CrossRef]
  20. Carreras, C.; Godley, B.J.; Leon, Y.M.; Hawkes, L.A.; Revuelta, O.; Raga, J.A.; Tomas, J. Contextualising the last survivors: Population structure of marine turtles in the Dominican Republic. PLoS ONE 2013, 8, e66037. [Google Scholar] [CrossRef]
  21. Molfetti, E.; Torres Vilaça, S.; Georges, J.-Y.; Plot, V.; Delcroix, E.; Le Scao, R.; Lavergne, A.; Barrioz, S.; Dos Santos, F.R.; De Thoisy, B. Recent demographic history and present fine-scale structure in the Northwest Atlantic leatherback (Dermochelys coriacea) turtle population. PLoS ONE 2013, 8, e58061. [Google Scholar]
  22. Stewart, K.R.; LaCasella, E.L.; Roden, S.E.; Jensen, M.P.; Stokes, L.W.; Epperly, S.P.; Dutton, P.H. Nesting population origins of leatherback turtles caught as bycatch in the US pelagic longline fishery. Ecosphere 2016, 7, e01272. [Google Scholar] [CrossRef] [Green Version]
  23. Vargas, S.M.; Araújo, F.C.; Monteiro, D.S.; Estima, S.C.; Almeida, A.P.; Soares, L.S.; Santos, F.R. Genetic diversity and origin of leatherback turtles (Dermochelys coriacea) from the Brazilian coast. J. Hered. 2008, 99, 215–220. [Google Scholar] [CrossRef]
  24. Prosdocimi, L.; Dutton, P.; Albareda, D.; Remis, M.I. Origin and genetic diversity of leatherbacks (Dermochelys coriacea) at Argentine foraging grounds. J. Exp. Mar. Biol. Ecol. 2014, 458, 13–19. [Google Scholar] [CrossRef]
  25. Kaewmong, P.; Punyapornwithaya, V.; Wongfu, C.; Prasitwiset, W.; Jongjit, P.; Boonkasemsanti, A.; Kittiwattanawong, K.; Bansiddhi, P. Nest Relocation of Leatherback Turtles (Dermochelys coriacea) Decrease the Rate of Non-Developed Eggs. Vet. Integr. Sci. 2022, 20, 279–289. [Google Scholar] [CrossRef]
  26. Komoroske, L.M.; Jensen, M.P.; Stewart, K.R.; Shamblin, B.M.; Dutton, P.H. Advances in the application of genetics in marine turtle biology and conservation. Front. Mar. Sci. 2017, 4, 156. [Google Scholar] [CrossRef]
  27. Bagda, E.; Bardakci, F.; Turkozan, O. Lower genetic structuring in mitochondrial DNA than nuclear DNA among the nesting colonies of green turtles (Chelonia mydas) in the Mediterranean. Biochem. Syst. Ecol. 2012, 43, 192–199. [Google Scholar] [CrossRef]
  28. Roden, S.E.; Dutton, P.H. Isolation and characterization of 14 polymorphic microsatellite loci in the leatherback turtle (Dermochelys coriacea) and cross-species amplification. Conserv. Genet. Resour. 2011, 3, 49–52. [Google Scholar] [CrossRef]
  29. Abreu-Grobois, F.A.; Horrocks, J.; Formia, A.; Dutton, P.; LeRoux, R.; Vélez-Zuazo, X.; Soares, L.; Meylan, P. New mtDNA Dloop primers which work for a variety of marine turtle species may increase the resolution of mixed stock analyses. In Proceedings of the 26th Annual Symposium on Sea Turtle Biology, Island of Crete, Greece, 3–8 April 2006; ISTS: Nashville, TN, USA, 2006; p. 179. [Google Scholar]
  30. Ronquist, F.; Huelsenbeck, J.; Teslenko, M.; Nylander, J. MrBayes Version 3.2 Manual: Tutorials and Model Summaries. Available online: mrbayes.sourceforge.net/mb32_manual.pdf (accessed on 19 October 2018).
  31. Thompson, J.D.; Gibson, T.J.; Higgins, D.G. Multiple sequence alignment using ClustalW and ClustalX. Curr. Protoc. Bioinform. 2003, 2, 2–3. [Google Scholar] [CrossRef]
  32. Rosenberg, N.A. DISTRUCT: A program for the graphical display of population structure. Mol. Ecol. Notes 2004, 4, 137–138. [Google Scholar] [CrossRef]
  33. Tamura, K.; Stecher, G.; Peterson, D.; Filipski, A.; Kumar, S. MEGA6: Molecular evolutionary genetics analysis version 6.0. Mol. Biol. Evol. 2013, 30, 2725–2729. [Google Scholar] [CrossRef]
  34. Kalinowski, S.T.; Wagner, A.P.; Taper, M.L. ML-Relate: A computer program for maximum likelihood estimation of relatedness and relationship. Mol. Ecol. Notes 2006, 6, 576–579. [Google Scholar] [CrossRef]
  35. Blouin, M.S. DNA-based methods for pedigree reconstruction and kinship analysis in natural populations. Trends Ecol. Evol. 2003, 18, 503–511. [Google Scholar] [CrossRef]
  36. Wagner, A.; Creel, S.; Kalinowski, S. Estimating relatedness and relationships using microsatellite loci with null alleles. Heredity 2006, 97, 336–345. [Google Scholar] [CrossRef]
  37. Milligan, B.G. Maximum-likelihood estimation of relatedness. Genetics 2003, 163, 1153–1167. [Google Scholar] [CrossRef] [PubMed]
  38. Jombart, T. adegenet: A R package for the multivariate analysis of genetic markers. Bioinformatics 2008, 24, 1403–1405. [Google Scholar] [CrossRef] [PubMed]
  39. Rozas, J.; Ferrer-Mata, A.; Sánchez-DelBarrio, J.C.; Guirao-Rico, S.; Librado, P.; Ramos-Onsins, S.E.; Sánchez-Gracia, A. DnaSP 6: DNA sequence polymorphism analysis of large data sets. Mol. Biol. Evol. 2017, 34, 3299–3302. [Google Scholar] [CrossRef]
  40. Leigh, J.W.; Bryant, D. Popart: Full-feature software for haplotype network construction. Methods Ecol. Evol. 2015, 6, 1110–1116. [Google Scholar] [CrossRef]
  41. Posada, D. jModelTest: Phylogenetic model averaging. Mol. Biol. Evol. 2008, 25, 1253–1256. [Google Scholar] [CrossRef] [PubMed]
  42. Letunic, I.; Bork, P. Interactive Tree of Life (iTOL) v5: An online tool for phylogenetic tree display and annotation. Nucleic Acids Res. 2021, 49, W293–W296. [Google Scholar] [CrossRef] [PubMed]
  43. Drummond, A.; Rambaut, A.; Bouckaert, R.; Xie, W. Divergence Dating Tutorial with BEAST 2.0. 2012. Available online: http://pstorage-plos-3567654.s3.amazonaws.com/1460094/Text_S1.pdf (accessed on 13 February 2022).
  44. Rambaut, A.; Drummond, A.J.; Xie, D.; Baele, G.; Suchard, M.A. Posterior summarization in Bayesian phylogenetics using Tracer 1.7. Syst. Biol. 2018, 67, 901. [Google Scholar] [CrossRef]
  45. Vargas, S.M.; Lins, L.S.; Molfetti, É.; Ho, S.Y.; Monteiro, D.; Barreto, J.; Colman, L.; Vila-Verde, L.; Baptistotte, C.; Thomé, J.C.A. Revisiting the genetic diversity and population structure of the critically endangered leatherback turtles in the South-west Atlantic Ocean: Insights for species conservation. J. Mar. Biol. Assoc. UK 2019, 99, 31–41. [Google Scholar] [CrossRef] [Green Version]
  46. Stumpf, M.P. Haplotype diversity and SNP frequency dependence in the description of genetic variation. Eur. J. Hum. Genet. 2004, 12, 469–477. [Google Scholar] [CrossRef]
  47. Dutton, P.H.; Squires, D. Reconciling biodiversity with fishing: A holistic strategy for Pacific sea turtle recovery. Ocean. Dev. Int. Law 2008, 39, 200–222. [Google Scholar] [CrossRef]
  48. Barbara, T.; Palma-Silva, C.; Paggi, G.M.; Bered, F.; Fay, M.F.; Lexer, C. Cross-species transfer of nuclear microsatellite markers: Potential and limitations. Mol. Ecol. 2007, 16, 3759–3767. [Google Scholar] [CrossRef] [PubMed]
  49. Torres-Pratts, H.; Schärer, M.T.; Schizas, N.V. Genetic diversity of Chelonibia caretta, commensal barnacles of the endangered hawksbill sea turtle Eretmochelys imbricata from the Caribbean (Puerto Rico). J. Mar. Biol. Assoc. UK 2009, 89, 719–725. [Google Scholar] [CrossRef]
  50. Daza-Criado, L.; Hernández-Fernández, J. Molecular identification and first report of mitochondrial COI gene haplotypes in the hawksbill turtle Eretmochelys imbricata (Testudines: Cheloniidae) in the Colombian Caribbean nesting colonies. Genet. Mol. Res. 2014, 13, 7123–7132. [Google Scholar] [CrossRef] [PubMed]
  51. Frandsen, H.R.; Figueroa, D.F.; George, J.A. Mitochondrial genomes and genetic structure of the Kemp's ridley sea turtle (Lepidochelys kempii). Ecol. Evol. 2020, 10, 249–262. [Google Scholar] [CrossRef]
  52. Prakas, P.; Butkauskas, D.; Švažas, S.; Bea, A.; Yanenko, V.; Ragauskas, A.; Vaitkuvienė, D. The Genetic Diversity and Structure of the European Turtle Dove Streptopelia turtur. Animals 2021, 11, 1283. [Google Scholar] [CrossRef]
  53. Hamann, M.; Limpus, C.; Hughes, G.; Mortimer, J.; Pilcher, N. Assessment of the Conservation Status of the Leatherback Turtle in the Indian Ocean and South East Asia, including Consideration of the Impacts of the December 2004 Tsunami on Turtles and Turtle Habitats; IOSEA Marine Turtle MoU Secretariat: Bangkok, Thailand, 2006. [Google Scholar]
  54. Rius, R.; Cowley, M.J.; Riley, L.; Puttick, C.; Thorburn, D.R.; Christodoulou, J. Biparental inheritance of mitochondrial DNA in humans is not a common phenomenon. Genet. Med. 2019, 21, 2823–2826. [Google Scholar] [CrossRef]
  55. Luo, S.; Valencia, C.A.; Zhang, J.; Lee, N.-C.; Slone, J.; Gui, B.; Wang, X.; Li, Z.; Dell, S.; Brown, J. Biparental inheritance of mitochondrial DNA in humans. Proc. Natl. Acad. Sci. USA 2018, 115, 13039–13044. [Google Scholar] [CrossRef]
  56. Tikochinski, Y.; Carreras, C.; Tikochinski, G.; Vilaça, S.T. Population-specific signatures of intra-individual mitochondrial DNA heteroplasmy and their potential evolutionary advantages. Sci. Rep. 2020, 10, 211. [Google Scholar] [CrossRef] [Green Version]
  57. Delgado-Cano, D.; Mariño-Ramírez, L.; Hernández-Fernández, J. Detection of high heteroplasmy in complete loggerhead and hawksbill sea turtles mitochondrial genomes using RNAseq. Mitochondrial DNA Part A 2021, 32, 106–114. [Google Scholar] [CrossRef]
  58. Avens, L.; Goshe, L.R.; Zug, G.R.; Balazs, G.H.; Benson, S.R.; Harris, H. Regional comparison of leatherback sea turtle maturation attributes and reproductive longevity. Mar. Biol. 2020, 167, 4. [Google Scholar] [CrossRef]
  59. Domiciano, I.G.; Domit, C.; Bracarense, A.P.F.R.L. The green turtle Chelonia mydas as a marine and coastal environmental sentinels: Anthropogenic activities and diseases. Semin. Ciênc. Agrárias 2017, 38, 3417–3434. [Google Scholar] [CrossRef]
  60. Hernández-Fernández, J.; Pinzón, A.; Mariño-Ramírez, L. De novo transcriptome assembly of loggerhead sea turtle nesting of the Colombian Caribbean. Genom. Data 2017, 13, 18–20. [Google Scholar] [CrossRef] [PubMed]
  61. Figgener, C.; Chacón-Chaverri, D.; Jensen, M.P.; Feldhaar, H. Paternity re-visited in a recovering population of Caribbean leatherback turtles (Dermochelys coriacea). J. Exp. Mar. Biol. Ecol. 2016, 475, 114–123. [Google Scholar] [CrossRef]
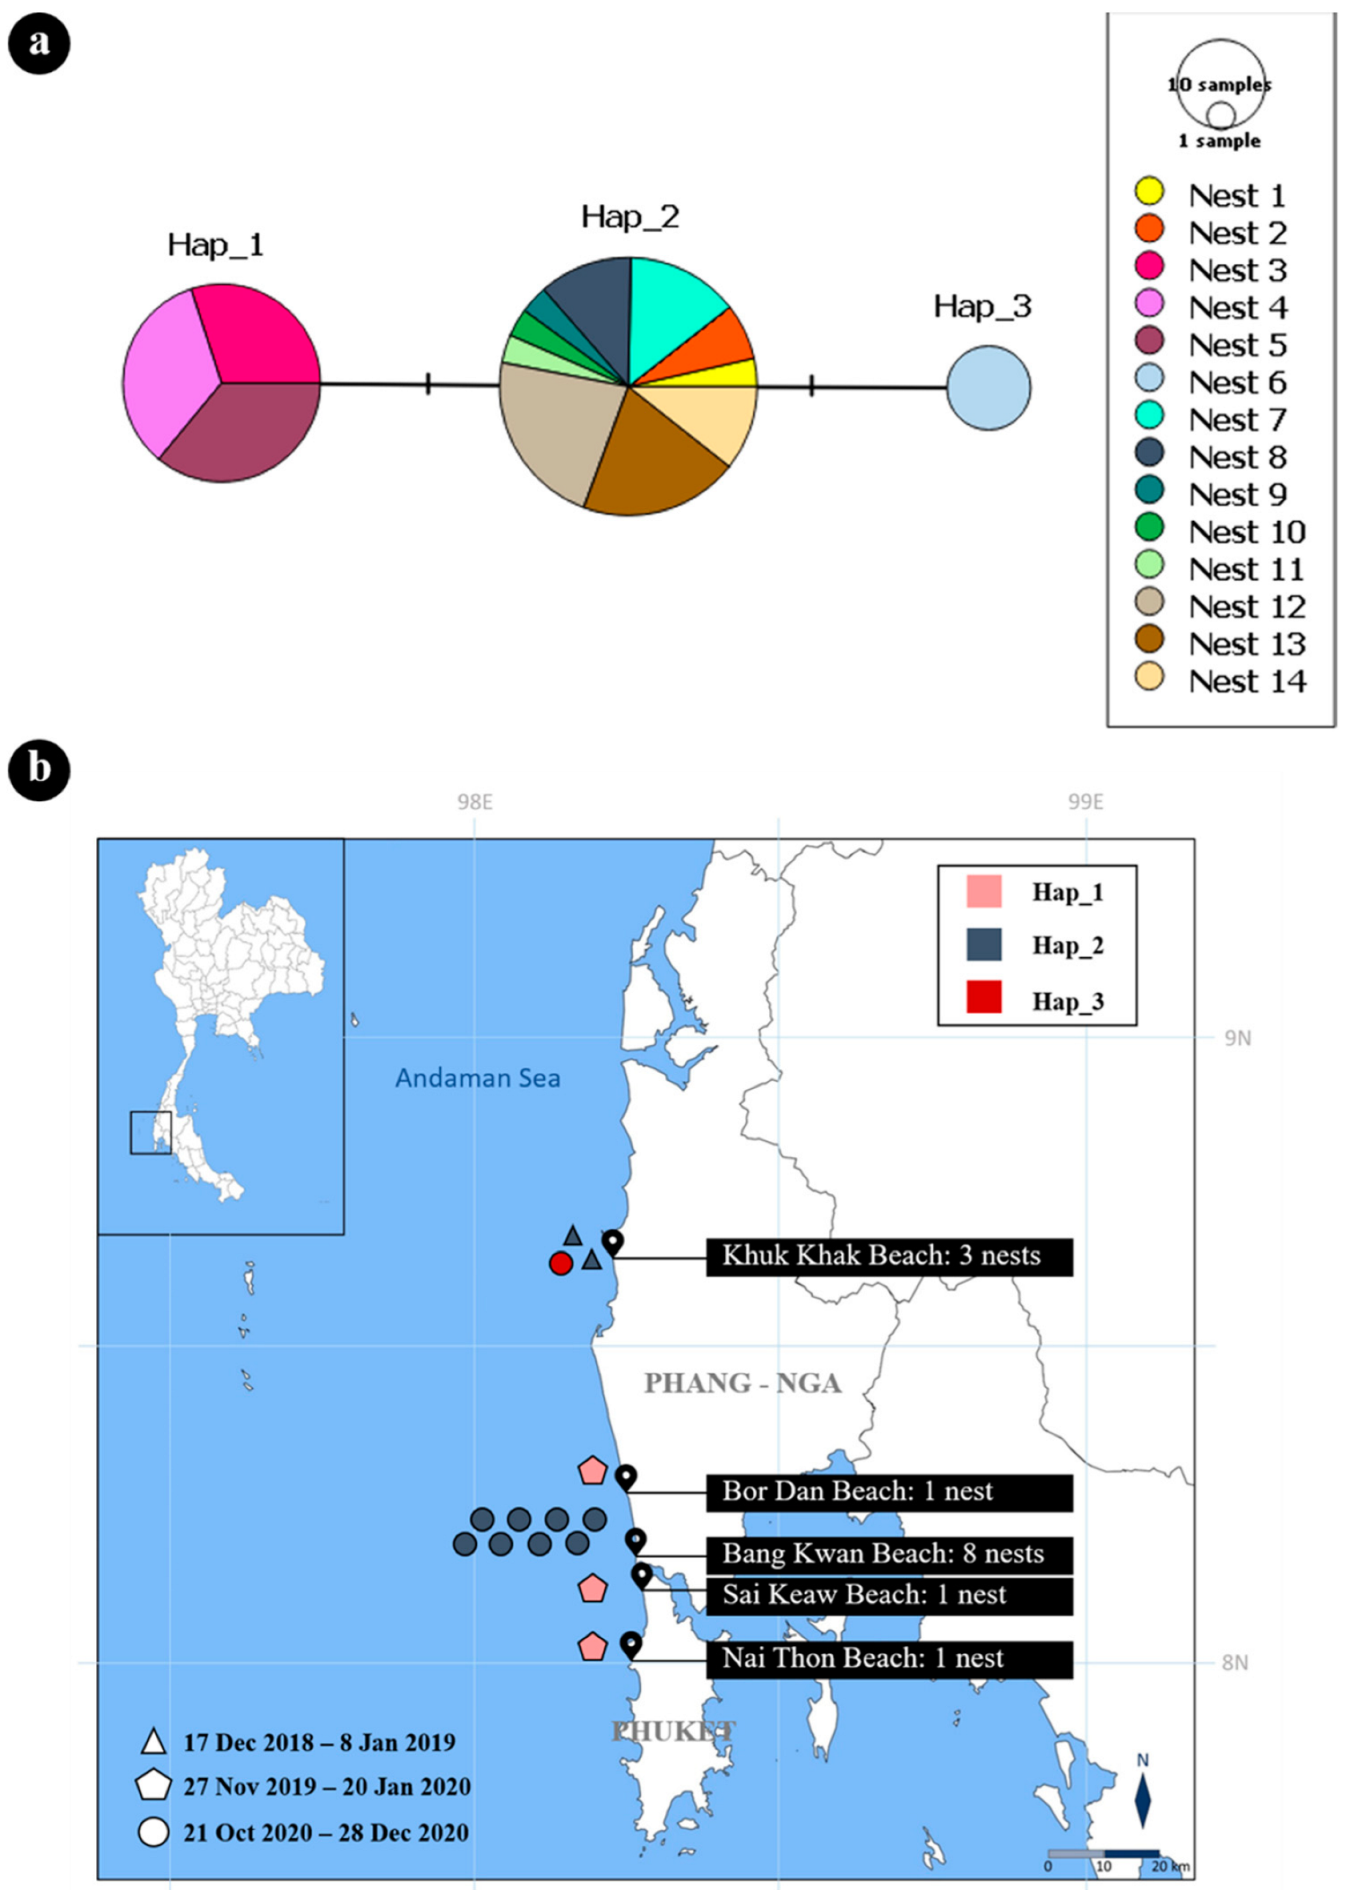
Figure 1. UPGMA-based dendrogram of genetic distances and population structure of leatherback turtles in the Andaman Sea. (a) UPGMA cluster analysis based on Nei’s genetic distances among five zones. Zone 1 = Khuk Khak Beach; Zone 2 = Bor Dan Beach; Zone 3 = Sai Keaw Beach; Zone 4 = Nai Thon Beach; Zone 5 = Bang Kwan Beach; (b) Population structure of leatherback turtle population for K = 2 using STRUCTURE software. Each individual is represented by a single vertical bar divided into K colors (blue and yellow); (c) Principal component analysis plot (autosomal microsatellite data). The five genetic clusters by zones of the leatherback turtle.
Diversity 14 00764 g001
Figure 2. Kinship relatedness among leatherback turtle populations. Samples were categorized into two groups: all zones except Zone 5 (Bang Kwan Beach) (a); and Zones 1 (Khuk Khak Beach) (11.5%) and 2 (Bang Kwan Beach) (88.5%) (b).
Diversity 14 00764 g002
Figure 3. Haplotype of leatherback turtles in the Andaman Sea. (a) Median-joining network from analyses of the mtDNA control region of leatherback turtles in the Andaman Sea. Size of the circles are proportional to the haplotype frequencies. Number of mutations between haplotypes is illustrated by dashes in connecting lines; (b) Number of nests from five locations collected from two provinces in the Andaman Sea.
Diversity 14 00764 g003
Figure 4. Median-joining network (MJNs) based on 658 bp of mtDNA control region. (a) MJNs of mtDNA control region 658 bp of the global leatherback turtles (b), geographic distribution of leatherback turtle haplotypes in the global scale (c), and phylogenetic tree of global leatherback turtle haplotypes. Leatherback turtle populations were divided into four clades: A (1 sequence: green branch); B1 (1 sequence: pink branch); B2 (1 sequence: blue branch); and B3 (291 sequences: purple branch). The inner color circle indicates haplotype and the outer circle indicates location—Thailand (THA), Indonesia (IND), Japan (JP), Brazil (BRA), Costa Rica (ACR), Florida (FLA), St. Croix (STX), Trinidad (TRI), Guiana (GUI), Dominican Republic (DR), Ghana (GHA), Gabon (GAB), South Africa (SAF), Buenos Aires (BA), Pacific (PCF), Southwest Atlantic (SWA), Northwest Atlantic (NWA), No location (NL).
Diversity 14 00764 g004
Figure 5. Bayesian Skyline Plots (BSPs) of effective population size over time of leatherback turtles in the Andaman Sea. The Y-axis indicates effective population size, X-axis indicates mean time in millions of years to the present, and the blue area represents the standard error.
Diversity 14 00764 g005
Table 1. Location and number of samples collected from leatherback turtles in each province of Thailand along the Andaman Sea.
ProvinceBeachNest NumberNumber of SamplesLatitude and Longitude
Phang-ngaKhuk Khak (Zone 1)3208.67829, 98.241
Bor Dan (Zone 2)1168.32848, 98.263
Bang Kwan (Zone 3)8778.20880, 98.282
PhuketSai Keaw (Zone 4)1178.19015, 98.287
Nai Thon (Zone 5)1198.05605, 98.277
Total 14149
Table 2. Nucleotide sequences of microsatellite primers used in this study.
PrimersSequence (5′-3′)Repeat MotifTa (°C)Length (bp)
LB99F: CACCCATTTTTTCCCATTG(TG)1155113–133
R: ATTTGAGCATAAGTTTTCGTGG
LB110F: TAGCAACTGCAGGAGC(CT)1558182–198
R: CATTCCCTAAGATTATCACC
LB123F: TGTAGTCaGGTGTCCAATG(GT)12 51170–186
R: CCAAGCCAAAGAAAGAA
LB125F: AACTAATGCCTTACAGAG(AC)1355182–196
R: CCTTAGAGGGAGAATCT
LB128F: AAGCATGGAGGAGAAGG(GT)1155157–165
R: GGTTCTTTGCCCCAGTA
LB133F: AGAGGCAGCAGAGCAAGG(AC)1360156–200
R: GGCTGAGGGTGGTGAGG
LB141F: CATCCTCATGTTCCCATC(TC)20(AC)955166–192
R: CATTGCCTCATAATAAGAGAAA
LB142F: GGCCAACTTTCCTTTCTTATTA(CA)1658219–237
R: CTGTGTGTATCTGCACCCA
LB143F: CCTATGGGCCACTGCAATGACA(GT)1058181–197
R: CAGCTGGAGGGATGCAAGATGT
LB145F: GGCCTCCACACAAATAAATAAA(AC)2855121–197
R: CATTCACCTTACGCAGAAGAA
LB157F: GGCATGAGTGTGAGTGA(AC)136072–102
R: CCTGGTTAAAGCTGTCTC
LB158F: AGGACAAGGCATTCTAGC(CA)1255162–178
R: ATGTACTTGCCCATCTGC
Table 3. Summary of F-coefficients and microsatellite polymorphism, Hardy–Weinberg Equilibrium (HWE) of eight microsatellite primers of leatherback turtles in the Andaman Sea of Thailand.
LocusFisFitFstNmGenetic VariabilitiesOverall HWE (p-Value)
NaNeIHoHe
LB99−0.080.150.220.9113.005.181.890.700.810.00 *
LB110−0.130.050.161.327.004.211.560.700.760.00 *
LB1410.110.500.440.329.003.391.410.430.710.00 *
LB157−0.030.290.310.556.001.810.810.290.450.00 *
LB128−0.030.190.220.917.003.661.540.380.730.00 *
LB142−0.370.190.410.376.003.531.390.690.720.00 *
LB1430.260.390.171.209.006.201.970.480.840.00 *
LB1580.110.250.161.345.002.221.000.450.550.00 *
Mean−0.020.250.260.86
±SE±0.07±0.05±0.04±0.15
Fis, Fit and Fst = F-statistics; Nm = gene flow; Na = observed number of alleles; Ne = effective number of alleles; I = Shannon’s information index; Ho = observed heterozygosity; He = expected heterozygosity; * = significant value (p < 0.05).
Table 4. Forensic parameters and diversity indices values (mean ± SE) for leatherback turtles in the Andaman Sea based on eight microsatellite loci across five regional zones.
PopulationForensic Parameters Diversity Indices
PDPEMPNaNeIHoHe
Zone 10.99999962410.99960826210.00000037595.13 ± 0.793.30 ± 0.451.26 ± 0.170.65 ± 0.100.63 ± 0.07
Zone 20.99994958240.99104003790.00005041763.38 ± 0.802.40 ± 0.420.86 ± 0.200.44 ± 0.090.48 ± 0.09
Zone 30.99985451640.98053463660.00014548363.25 ± 0.952.11 ± 0.260.80 ± 0.160.49 ± 0.110.46 ± 0.08
Zone 40.99992542950.98535152990.00007457053.38 ± 0.462.15 ± 0.250.86 ± 0.110.50 ± 0.090.50 ± 0.05
Zone 50.99993593680.98695468370.00006406324.00 ± 0.332.20 ± 0.260.88 ± 0.120.51 ± 0.100.50 ± 0.06
Overall0.99999995120.99990215200.0000000488
PD = power of discrimination; PE = power of exclusion; MP = matching probability; Na = observed number of alleles; Ne = effective number of alleles; I = Shannon’s information index; Ho = observed heterozygosity; He = expected heterozygosity.
Publisher’s Note: MDPI stays neutral with regard to jurisdictional claims in published maps and institutional affiliations.

