Article

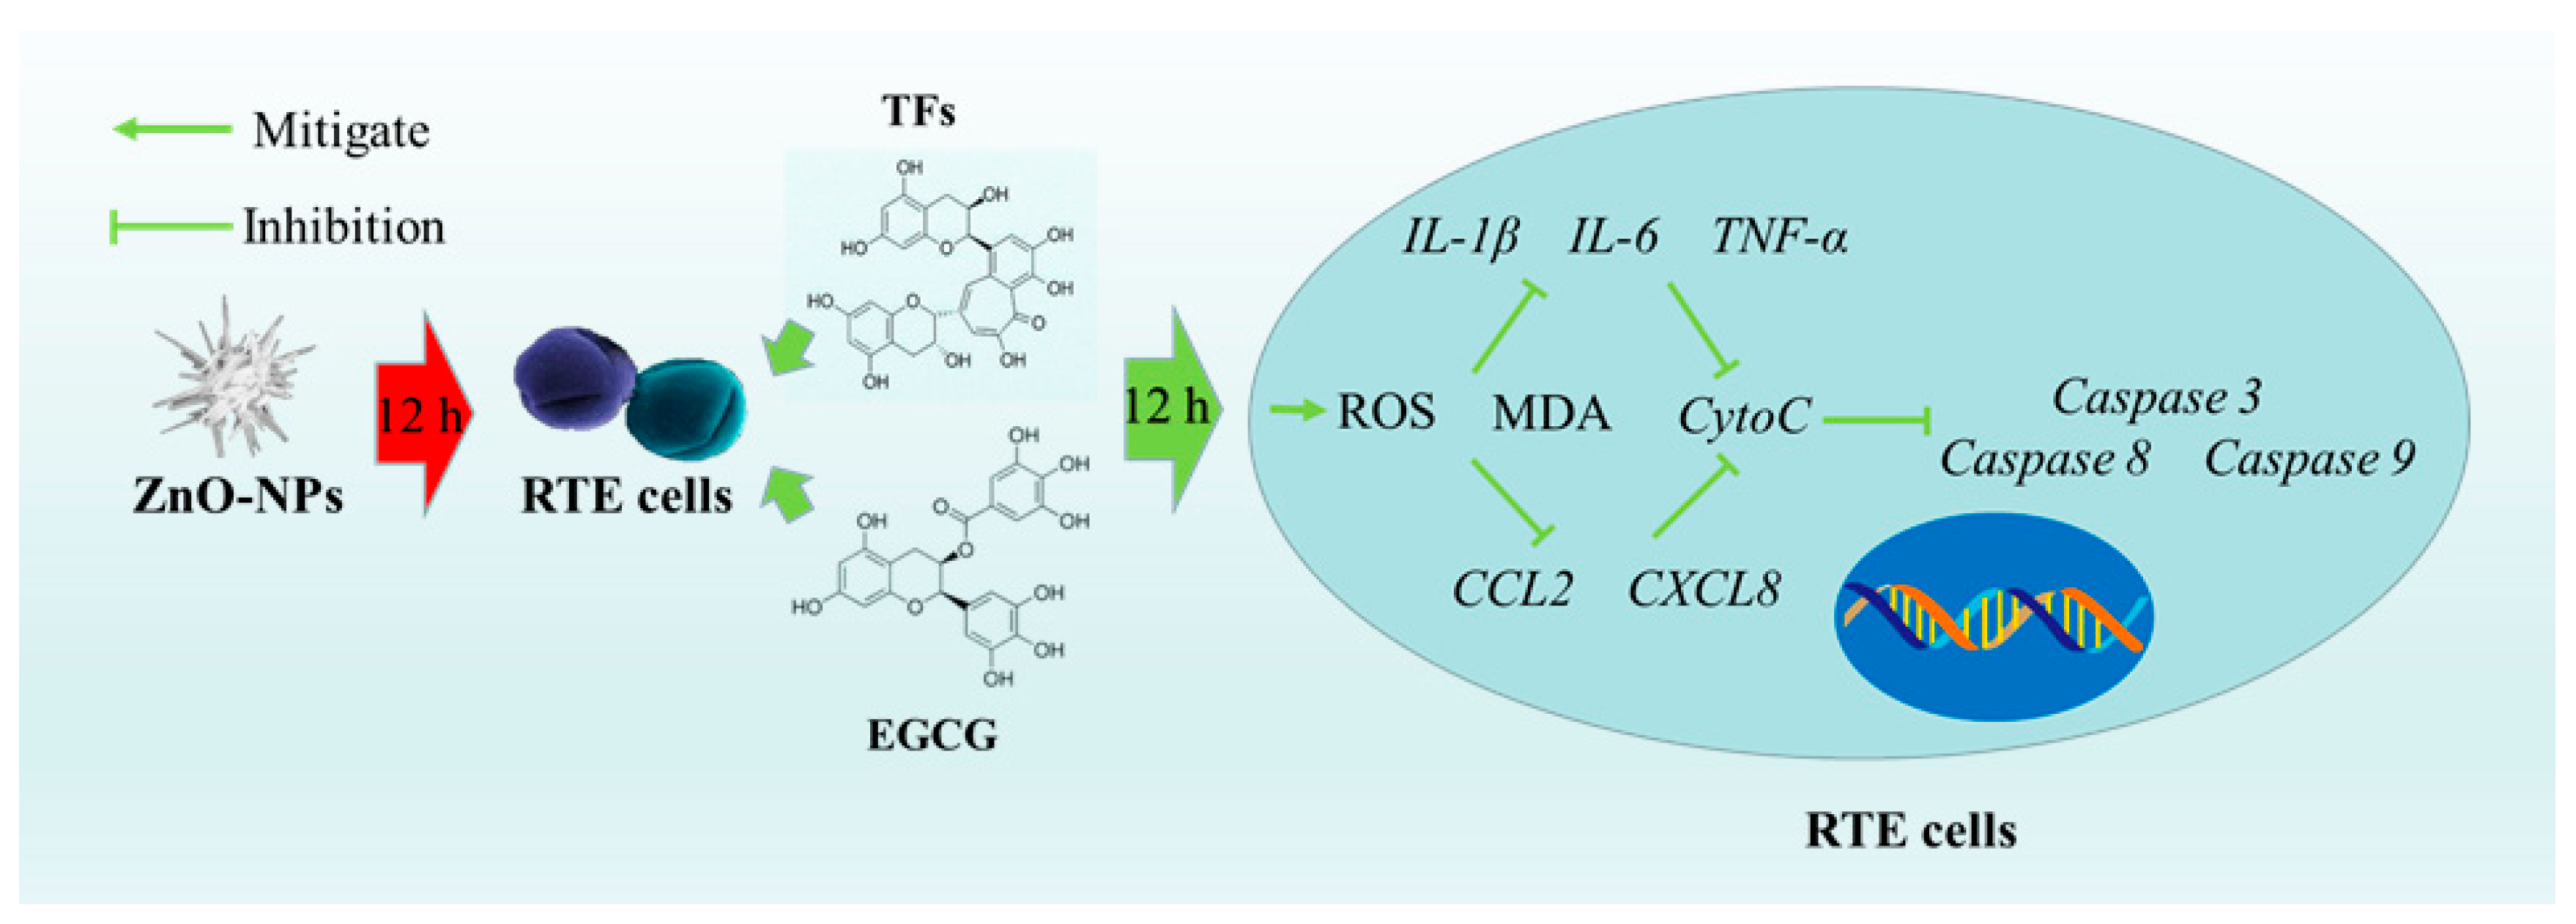
Protective Effects of Theaflavins and Epigallocatechin Gallate against ZnO-NP-Induced Cell Apoptosis In Vitro

1
School of Life and Environmental Sciences, Hangzhou Normal University, Yuhangtang Road NO.2318, Yuhang District, Hangzhou 311121, China
2
School of Engineering, Hangzhou Normal University, Yuhangtang Road NO.2318, Yuhang District, Hangzhou 311121, China
*
Author to whom correspondence should be addressed.
Diversity 2022, 14(9), 756; https://doi.org/10.3390/d14090756
Submission received: 30 July 2022 / Revised: 31 August 2022 / Accepted: 8 September 2022 / Published: 14 September 2022

Abstract

:
Zinc oxide nanoparticles (ZnO-NPs) are commonly used in various commercial applications, causing toxic effects on organisms and destroying biodiversity, but information about their protective approaches remains unknown. This study aims to evaluate the protective effects of theaflavins (TFs) and epigallocatechin gallate (EGCG) against ZnO-NP-induced cytotoxicity in rat tracheal epithelial (RTE) cells. Herein, RTE cells were exposed to 100 μg/L ZnO-NPs for 12 h, then treated with 0, 10, 100, and 1000 μg/L TFs or EGCG for another 12 h; subsequently, oxidative stress, inflammation, and apoptosis analyses were conducted. Relative to the control groups, TFs and EGCG treatment significantly inhibited the levels of reactive oxygen species and malondialdehyde content. Exposure to 1000 μg/L TFs or EGCG treatment downregulated cytochrome C gene expression levels by 59.10% and 77.27%; Caspase 3 gene expression by 50.03% and 60.01%; Caspase 8 gene expression by 45.11% and 55.57%; and Caspase 9 gene expression by 51.33% and 66.67%, respectively. Meanwhile, interleukin 1β and interleukin 6, tumor necrosis factor-α, and the other inflammatory chemokines such as C-C motif chemokine 2 and C-X-C motif chemokine 8 expression were all gradually rescued after the addition of TFs or EGCG. These results imply that TFs or EGCG possibly ameliorated ZnO-NPs-induced toxicity through antiapoptotic, antioxidant, and anti-inflammatory effects. This study provides novel approaches which mitigate the emerging nanoparticle pollutant toxicity in organisms, which may potentially slow down the destruction of biodiversity.

1. Introduction

Due to the wide application of nanoparticles, we can find them in oceans, river waters, bottled water, municipal wastewater, sediments, air, and soils [1]. As a multi-carrier, nanoparticles affect microbial communities, the growth and reproduction of organisms, and alter biodiversity [2,3,4]. Zinc oxide nanoparticles (ZnO-NPs) are a novel multifunctional inorganic material used in various commercial applications [5]. They can enter the body and stimulate respiratory epithelial cells, promoting lung diseases such as asthma [6]. Goma et al. [7] found that the ZnO-NPs induced oxidative stress damage in male rat lung fibroblasts, which triggered an inflammatory response. ZnO-NPs also induced inflammation and apoptosis in the lung cells of a female mouse [8]. Moreover, human alveolar basal epithelial cells showed significant cytotoxicity after ZnO-NPs exposure [9]. Jung et al. [10] showed that exposure to ZnO-NPs leads to inflammatory cell infiltration in rat alveoli, which may cause acute lung injury with granulocytic inflammation. Therefore, the respiratory health risk of ZnO-NPs deserves attention, and the threat to human health needs to be considered seriously. However, in the medical field, nanomaterials are used for macromolecular drug delivery and targeted therapy of tumors. For example, the nanoparticle CaH2 delivers cytotoxic T cells which induce tumor cell apoptosis and tumor microenvironment regulation; activates the immune system; promotes the infiltration of immune cells into the tumor; and acts together with immune checkpoint blockades to trigger a strong immune response, thereby inhibiting distal tumors [11]. Therefore, it is particularly important to reduce its negative effects and it is essential to find the necessary mitigation measures.
The above studies show that respiratory alterations induced by ZnO-NPs are often caused by oxidative stress damage [7]. As such, regulating the balance of the intracellular redox system is an important tool for treating such diseases. Bioactive substances from plants have a suitable efficacy in alleviating intracellular oxidative stress [12]. For example, chemicals derived from plants can have a potential therapeutic effect on cellular stress induced by NPs [13]. Theaflavins (TFs) are a class of bioactive polyphenols with antioxidant properties and anticancer effects on the skin and esophagus of rodents [14,15]. Meanwhile, TFs have antioxidant properties, free radical scavenging abilities, and high bioavailability in different biological tissues, thereby playing an important role in cell protection [16]. Twelve hours of treatment with TFs effectively slowed apoptosis in rat hippocampal nerve cells which were triggered by sevoflurane [17]. Wang et al. [18] found that treatment of GES-1 gastric mucosal epithelial cells with TFs effectively alleviated apoptosis, which itself is induced by ethanol exposure.
Epigallocatechin gallate (EGCG) in green tea has similar biological activity as TFs has in black tea [15,19,20]. Studies have shown that EGCG appears to be the most biologically active polyphenol at the cellular level [21], as shown with its antibacterial, anti-inflammatory, anticancer, and cardiovascular disease prevention properties [22,23]. Moreover, EGCG can also inhibit oxidative stress [24], abrogate cellular DNA damage, and improve the antioxidant effect of mitochondria [25]. Liang et al. [26] found that EGCG was effective in alleviating oxidative stress and inflammation in human AC16 cardiomyocytes under the influence of cigarette smoke and this had a significant effect on abnormal apoptosis. Microcystin-LR induced abnormal apoptosis in umbilical vein endothelial cells, which was alleviated by EGCG treatment and then gradually normalized the cells as a result [27]. As with TFs, EGCG has been reported to have suitable therapeutic effects on cellular oxidative stress, inflammatory responses, and apoptosis [28]; however, few studies have reported the alleviation of redox imbalance, inflammation, and apoptosis that is induced by ZnO-NPs.
As the basic unit of structure and the function of organisms, rat tracheal epithelial (RTE) cells are persistent, universal and stable [29]. In general, fully differentiated RTE cells will always remain in a post-differentiated state and their stability as cellular materials for experiments are the basis for ensuring the scientific validity of experimental results. In previous studies, we found that ZnO-NPs could induce apoptosis in many types of cells [8,10]; moreover, as the susceptible cells of NPs, it is especially important to study the apoptotic response of respiratory epithelial cells and the related action mechanism, to then provide a research basis for the treatment of respiratory tract diseases caused by NPs.
Herein, we exposed RTE cells to 100 μg/L ZnO-NPs for 12 h, then treated with 0, 10, 100, and 1000 μg/L TFs or EGCG for another 12 h; furthermore, to explore whether TFs and EGCG ameliorate ZnO-NPs-induced toxicity and elucidate its potential mechanism, we performed oxidative stress, inflammation, and apoptosis analyses. Our study, therefore, contributes to the understanding of the mechanisms by which TFs or EGCG mitigate the toxic effects of nanoparticles.

2. Materials and Methods

2.1. Materials

ZnO-NPs (30–90 nm, purity of 99.99%) were purchased from Aladdin (Aladdin Bio-Chem Technology Co., Ltd., Shanghai, China). TF (95.0%) and EGCG (98%) were obtained from Sigma Aldrich (Sigma-Aldrich Life Science&Tech. Co., Ltd., MO, USA) and Hetian Biotechnology (Hangzhou Hetian Biological Technology Co., Ltd., Hangzhou, China), respectively. Kits were obtained from Jiancheng Biotechnology (Nanjing Jiancheng Institute of Biotechnology, Nanjing, China). The RTE cell line was obtained from BeNa Culture Collection (BeNa Culture Collection, Beijing, China).

2.2. Preparation of ZnO-NPs Working Solution

The ZnO-NPs were dissolved using Dulbecco’s Modified Eagle’s Medium (DMEM, Gibco, CA, USA) via sonication and then diluted to a concentration of 100 μg/L as the working solution. This working solution was stored at 4 °C for 2 weeks.

2.3. Cell Culture and ZnO-NP Exposure

RTE cells were cultured in DMEM with 10% FBS in 37 °C and 5% CO2 and then exposed to 100 μg/L ZnO-NPs of different sizes (30 nm and 90 nm). After 12 h of incubation, each concentration (10, 100, and 1000 μg/L) of TFs and EGCG were treated with RTE cells and cultured together for another 12 h.

2.4. Cell Proliferation Inhibition Efficiency

RTE cells were seeded at a density of 4 × 10⁴ cells/mL in a 96-well plate. After 24 h of incubation, the cells were washed with Dulbecco’s Phosphate-Buffered Saline (DPBS, Gibco, CA, USA), and a total of 200 μL of NP working solution was added to the wells and incubated at 37 °C with 5% CO2 for 12 h. Cell proliferation inhibition efficiency was performed according to the CCK-8 kit (Sangon Biotech, Shanghai, China) instructions. The absorbance at 450 nm, using Tecan’s Spark multimode reader, was measured (Tecan, Männedorf, Switzerland). Lastly, it must be noted, the cell proliferation inhibition efficiency was calculated with the following formula: cell proliferation inhibition efficiency = [A(control)−A(treatment)]/[A(control)−A(blank)] × 100%.

2.5. Detection of Zn in RTE Cells

Zinc concentration was determined using microwave ablation inductively coupled plasma spectrometry (ICP). The cells were seeded at a density of 5 × 10³/well in a 96-well plate. The standard solutions of 0.5, 1, 10, and 20 mg/L Zn were prepared, and four parallel solutions were set up for each concentration. The sampling method was manual, and the operating conditions were set as follows: cooling gas of 18 LPM; peristaltic pump lift rate of 25 RPM; RF power of 1200 kW; improvement time of 18 s; nebulizer of 33 PSI; and integration time of 10 s. The elemental zinc spectrum was 206.200 [30].

2.6. Measurement of Intracellular Reactive Oxygen Species (ROS) and Malondialdehyde (MDA) Concentration

RTE cells were seeded at a density of 5 × 10³/well, incubated for 24 h, and exposed to ZnO-NPs for 12 h. Then, cells were treated with TFs or EGCG (10, 100, and 1000 μg/L), respectively, and incubated for another 12 h. After incubation, the medium was removed, the cells were rinsed three times with DPBS, digested with Trypsin-EDTA (0.05%, Gibco, CA, USA), and then resuspended in DPBS buffer. The RTE cells were collected by centrifugation; passed through a 40 µm mesh sieve; suspended in pre-cooled DPBS; followed by the addition of 2,7-Dichlorodihydrofluorescein diacetate dye (Sigma, MO, USA) to a final concentration of 10 μM; and then incubated for 20 min at room temperature and protected from light. The detection wavelength range was 488 nm–525 nm (fluorescence) by flow cytometry (Millipore, MA, USA).
RTE cells were inoculated into a plate at 5.0 × 10³ cells/well then incubated for 24 h prior to exposure. Cells were exposed with NP suspension at 100 μg/L for 12 h. The cells were treated with different concentrations of TFs or EGCG (10, 100, and 1000 μg/L) after exposure and incubated for 12 h. Then, the treated cells were scraped down with a cell scraper and mixed with the extraction reagent from the kit. Cells were sonicated in the water bath at 95 °C for 40 min, then cooled by running water and centrifuged at 4000 rpm/min, for 10 min, the supernatant was then collected for MDA measurement. The measurement of MDA content was at an absorbance of 532 nm according to the instructions of the MDA assay kit (Jiancheng Biotechnology, Nanjing, China). As such, the specific operation was performed according to the instructions of the kit.

2.7. RNA Isolation and Quantitative Real-Time Polymerase Chain Reaction (qPCR)

The cells were inoculated into a plate at 5.0 × 10³ cells/well and incubated for 24 h. Then, they were exposed for 12 h by nanosuspension. After exposure, the cells were treated with different concentrations (10, 100, and 1000 μg/L) of TFs or EGCG for another 12 h. RNA was extracted using the TRIzol method, and the concentration and purity was measured by a NanoDrop spectrometer (Thermo Fisher Scientific, MA, USA) [31]. RNA was reverse transcribed used the Invitrogen SuperScript™ III Reverse Transcriptase Kit (Invitrogen, CA, USA), following the manufacturer’s instructions. Then, 300 ng cDNA in each PCR reaction for 40 cycles were detected by a Real-Time PCR system (Bio-Rad, CA, USA) in triplicate with a SYBR Green PCR master mix. The quantitative PCR primer was designed by Primer Premier 6.0 and Beacon designer 7.8. The sequences are detailed in Table 1. The relative mRNA expression levels were following the method of Sedanza et al. [32]. The expression of each gene was measured with Ct (threshold cycle) values. The relative expression levels of each gene were statistically analyzed in 2−(Ct tested gene-Ct reference gene). We used Rat GAPDH as the reference gene; at the same time, Table 1 shows the increases in the quantitative primer information of the gene Rat GAPDH.

2.8. Statistical Analysis

All data were analyzed using the Original 8.0 Statistics software. Levene’s test and the Kolmogorov–Smirnov one-sample test were used to evaluate the homogeneity of variance and the normality of the data. One-way analysis of variance, based on Tukey post hoc tests, was applied to evaluate significant differences between groups. The results were expressed as the values ± standard deviation of the means [33]. The level of significance was set at * p < 0.05 or ** p < 0.01. Correlation data analyses were conducted with the R statistical software R 3.1.1 and the “leaps”, “lars”, “caret”, “psych”, and “relaimpo” packages.

3. Results

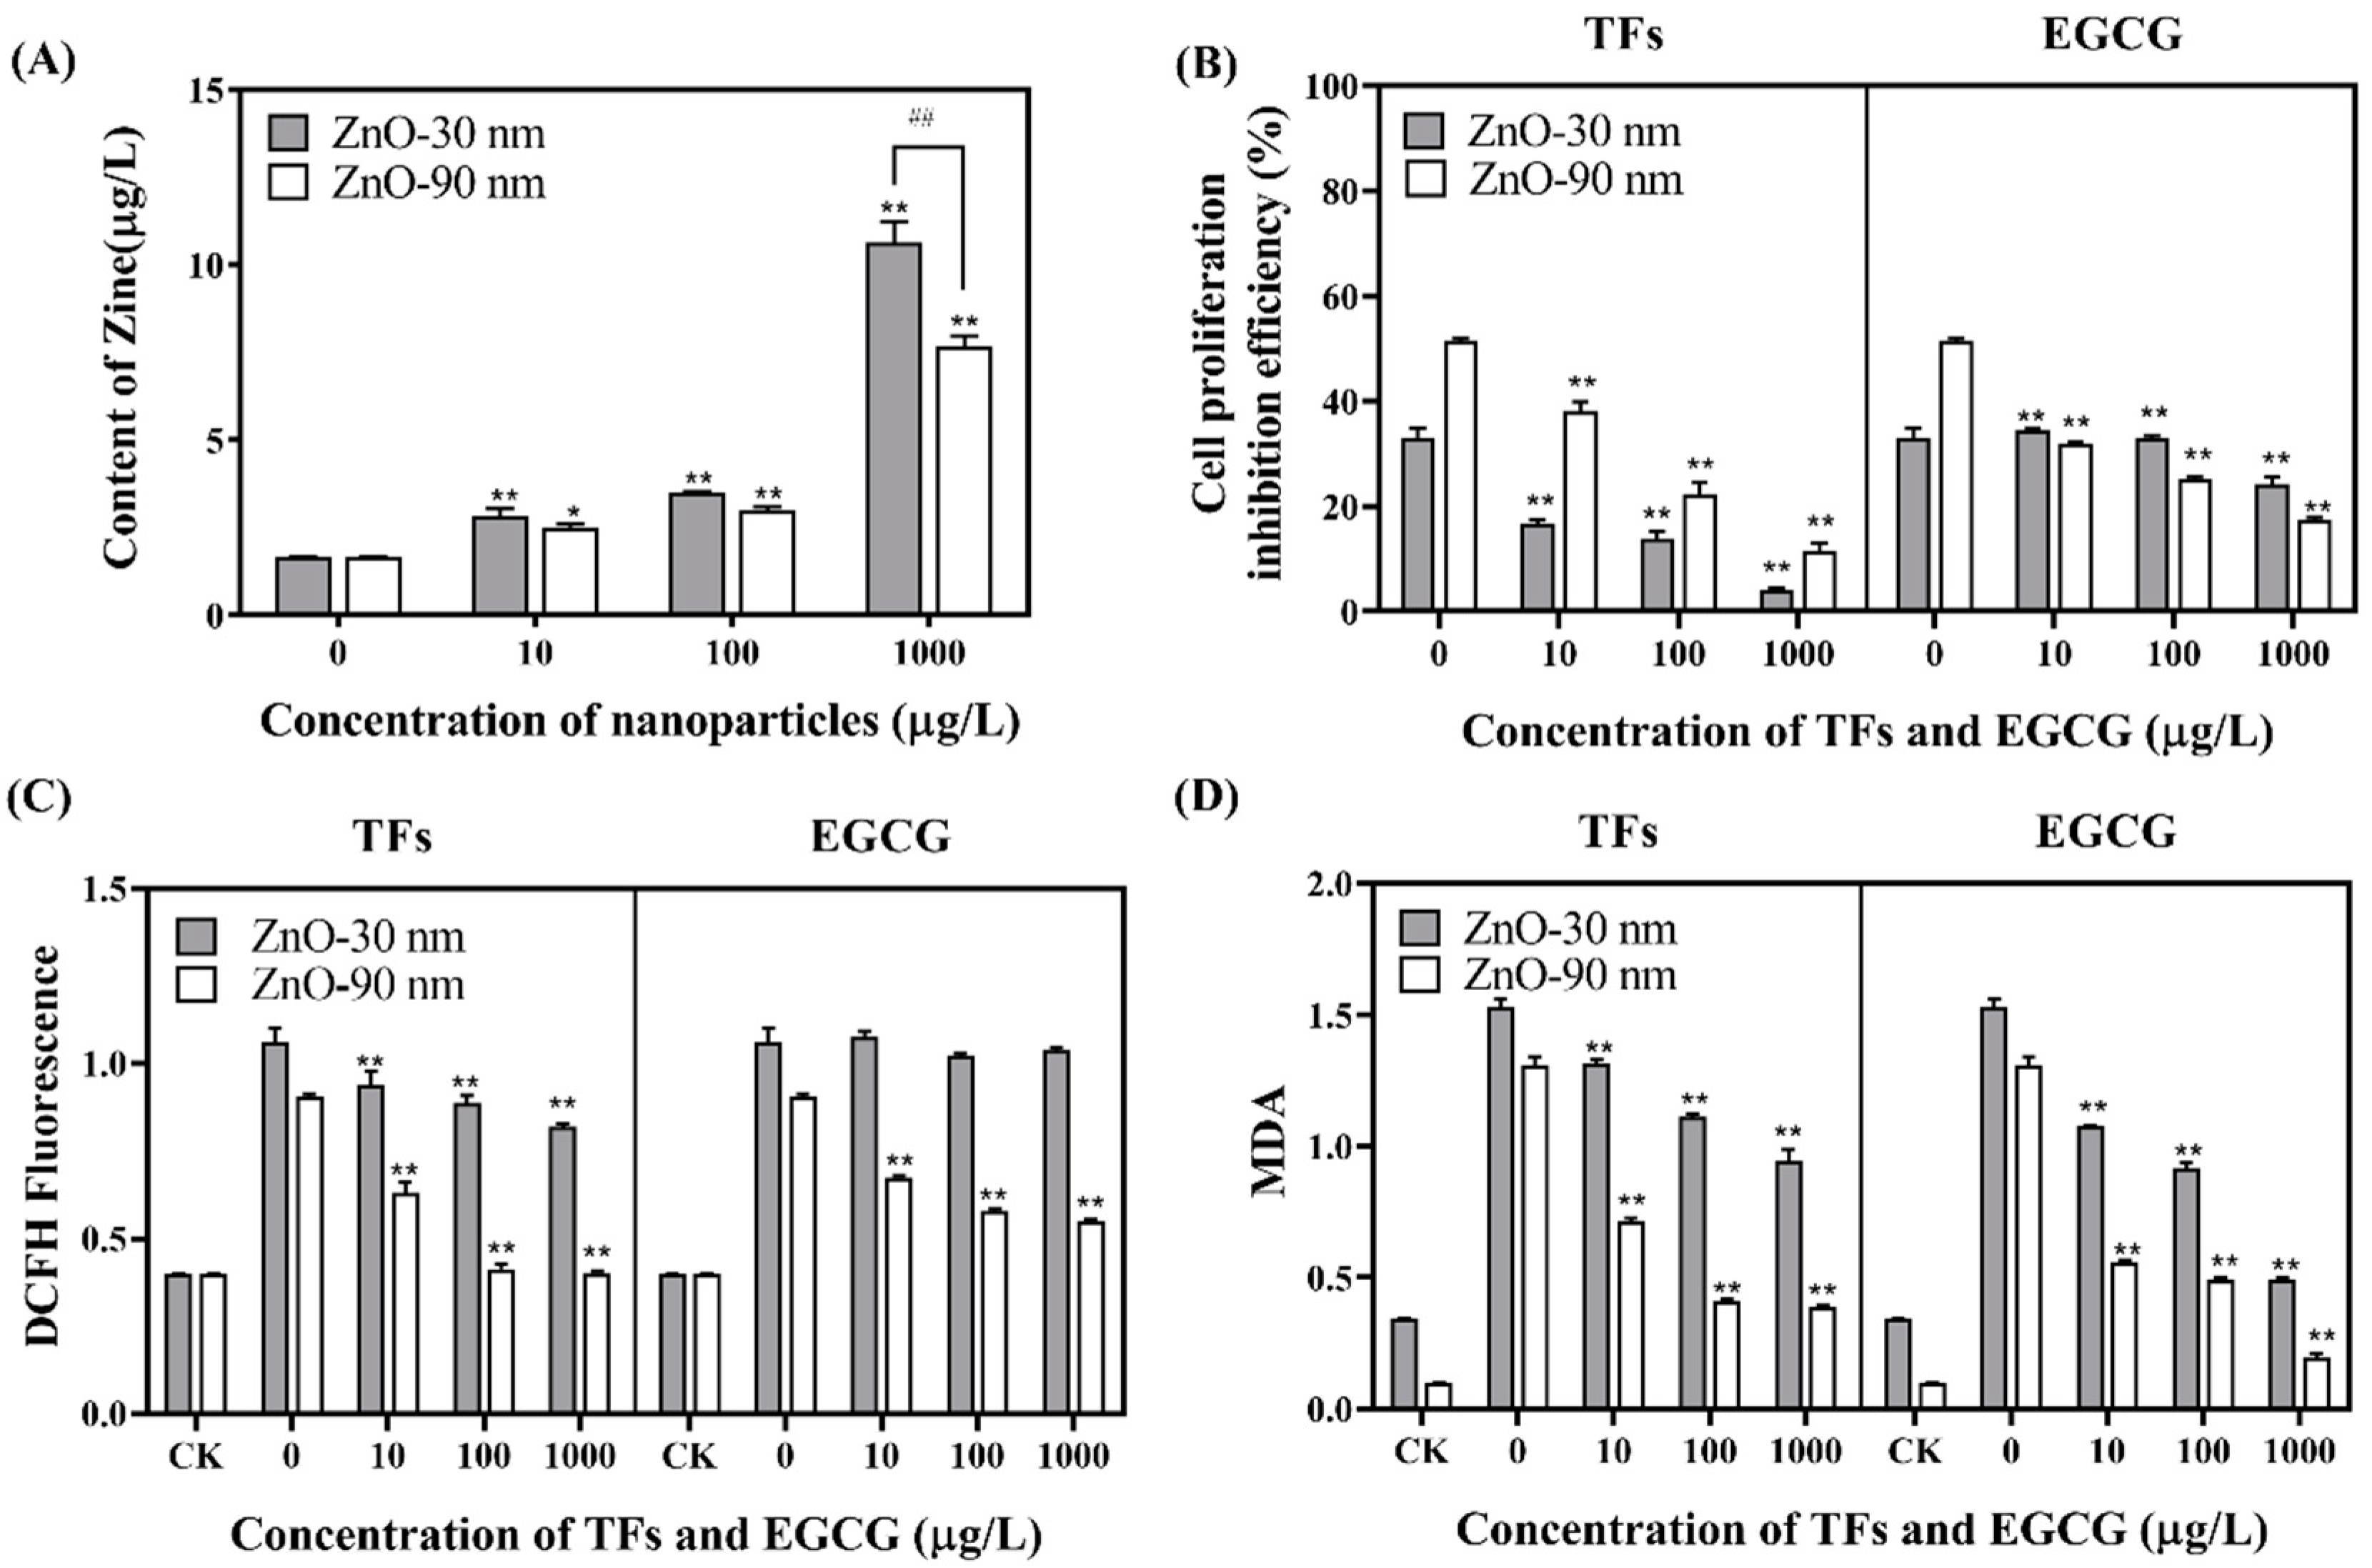
3.1. Uptake of Zinc by RTE Cells and the Proliferation Inhibition Efficiency of RTE Cells

The zinc content in RTE cells were negatively correlated with the particle size of ZnO-NPs and positively correlated with the NP concentration. All exposed groups showed a significant increase in Zn content compared to the control group (0 μg/L concentration group, p < 0.05, Figure 1A), which indicated that the amount of ZnO-NPs entering the cell increased when exposure concentration increased. This implies that ZnO-NPs could enter the cell membrane and accumulate within cells; 30 nm ZnO-NPs could enter RTE cells more easily than 90 nm ZnO-NPs, and it also has more opportunities to interact with intracellular substances than induced cytotoxicity does. In the studies of Wang et al. [34] and Shalini et al. [35] it was reaffirmed that a smaller size of NPs have more biotoxic effects. Meanwhile, the ZnO-90 nm exposure of cell proliferation inhibition efficiency was higher than the ZnO-30 nm exposure, as shown in Figure 1B. When TFs or EGCG were treated to ZnO-NP-exposure RTE cells, the cell proliferation inhibition efficiency was significantly reduced in a dose-dependent manner (p < 0.01).

3.2. Regulation Effects of ROS and MDA Generation

After exposure to 100 μg/L ZnO-NPs and treatment with TFs or EGCG in RTE cells, ROS levels decreased with increasing concentrations of TFs or EGCG (Figure 1C). Moreover, the intracellular MDA level of RTE cells decreased with the increasing concentrations of the antioxidants TFs or EGCG. TFs (1000 μg/L) decreased the MDA level by 46.7% (ZnO-30 nm) and 76.0% (ZnO-90 nm) in the TF-treated group, and 71.0% (ZnO-30 nm) and 83.3% (ZnO-90 nm) in the 1000 μg/L EGCG-treated group compared with the 0 μg/L TFs or EGCG group (Figure 1D).

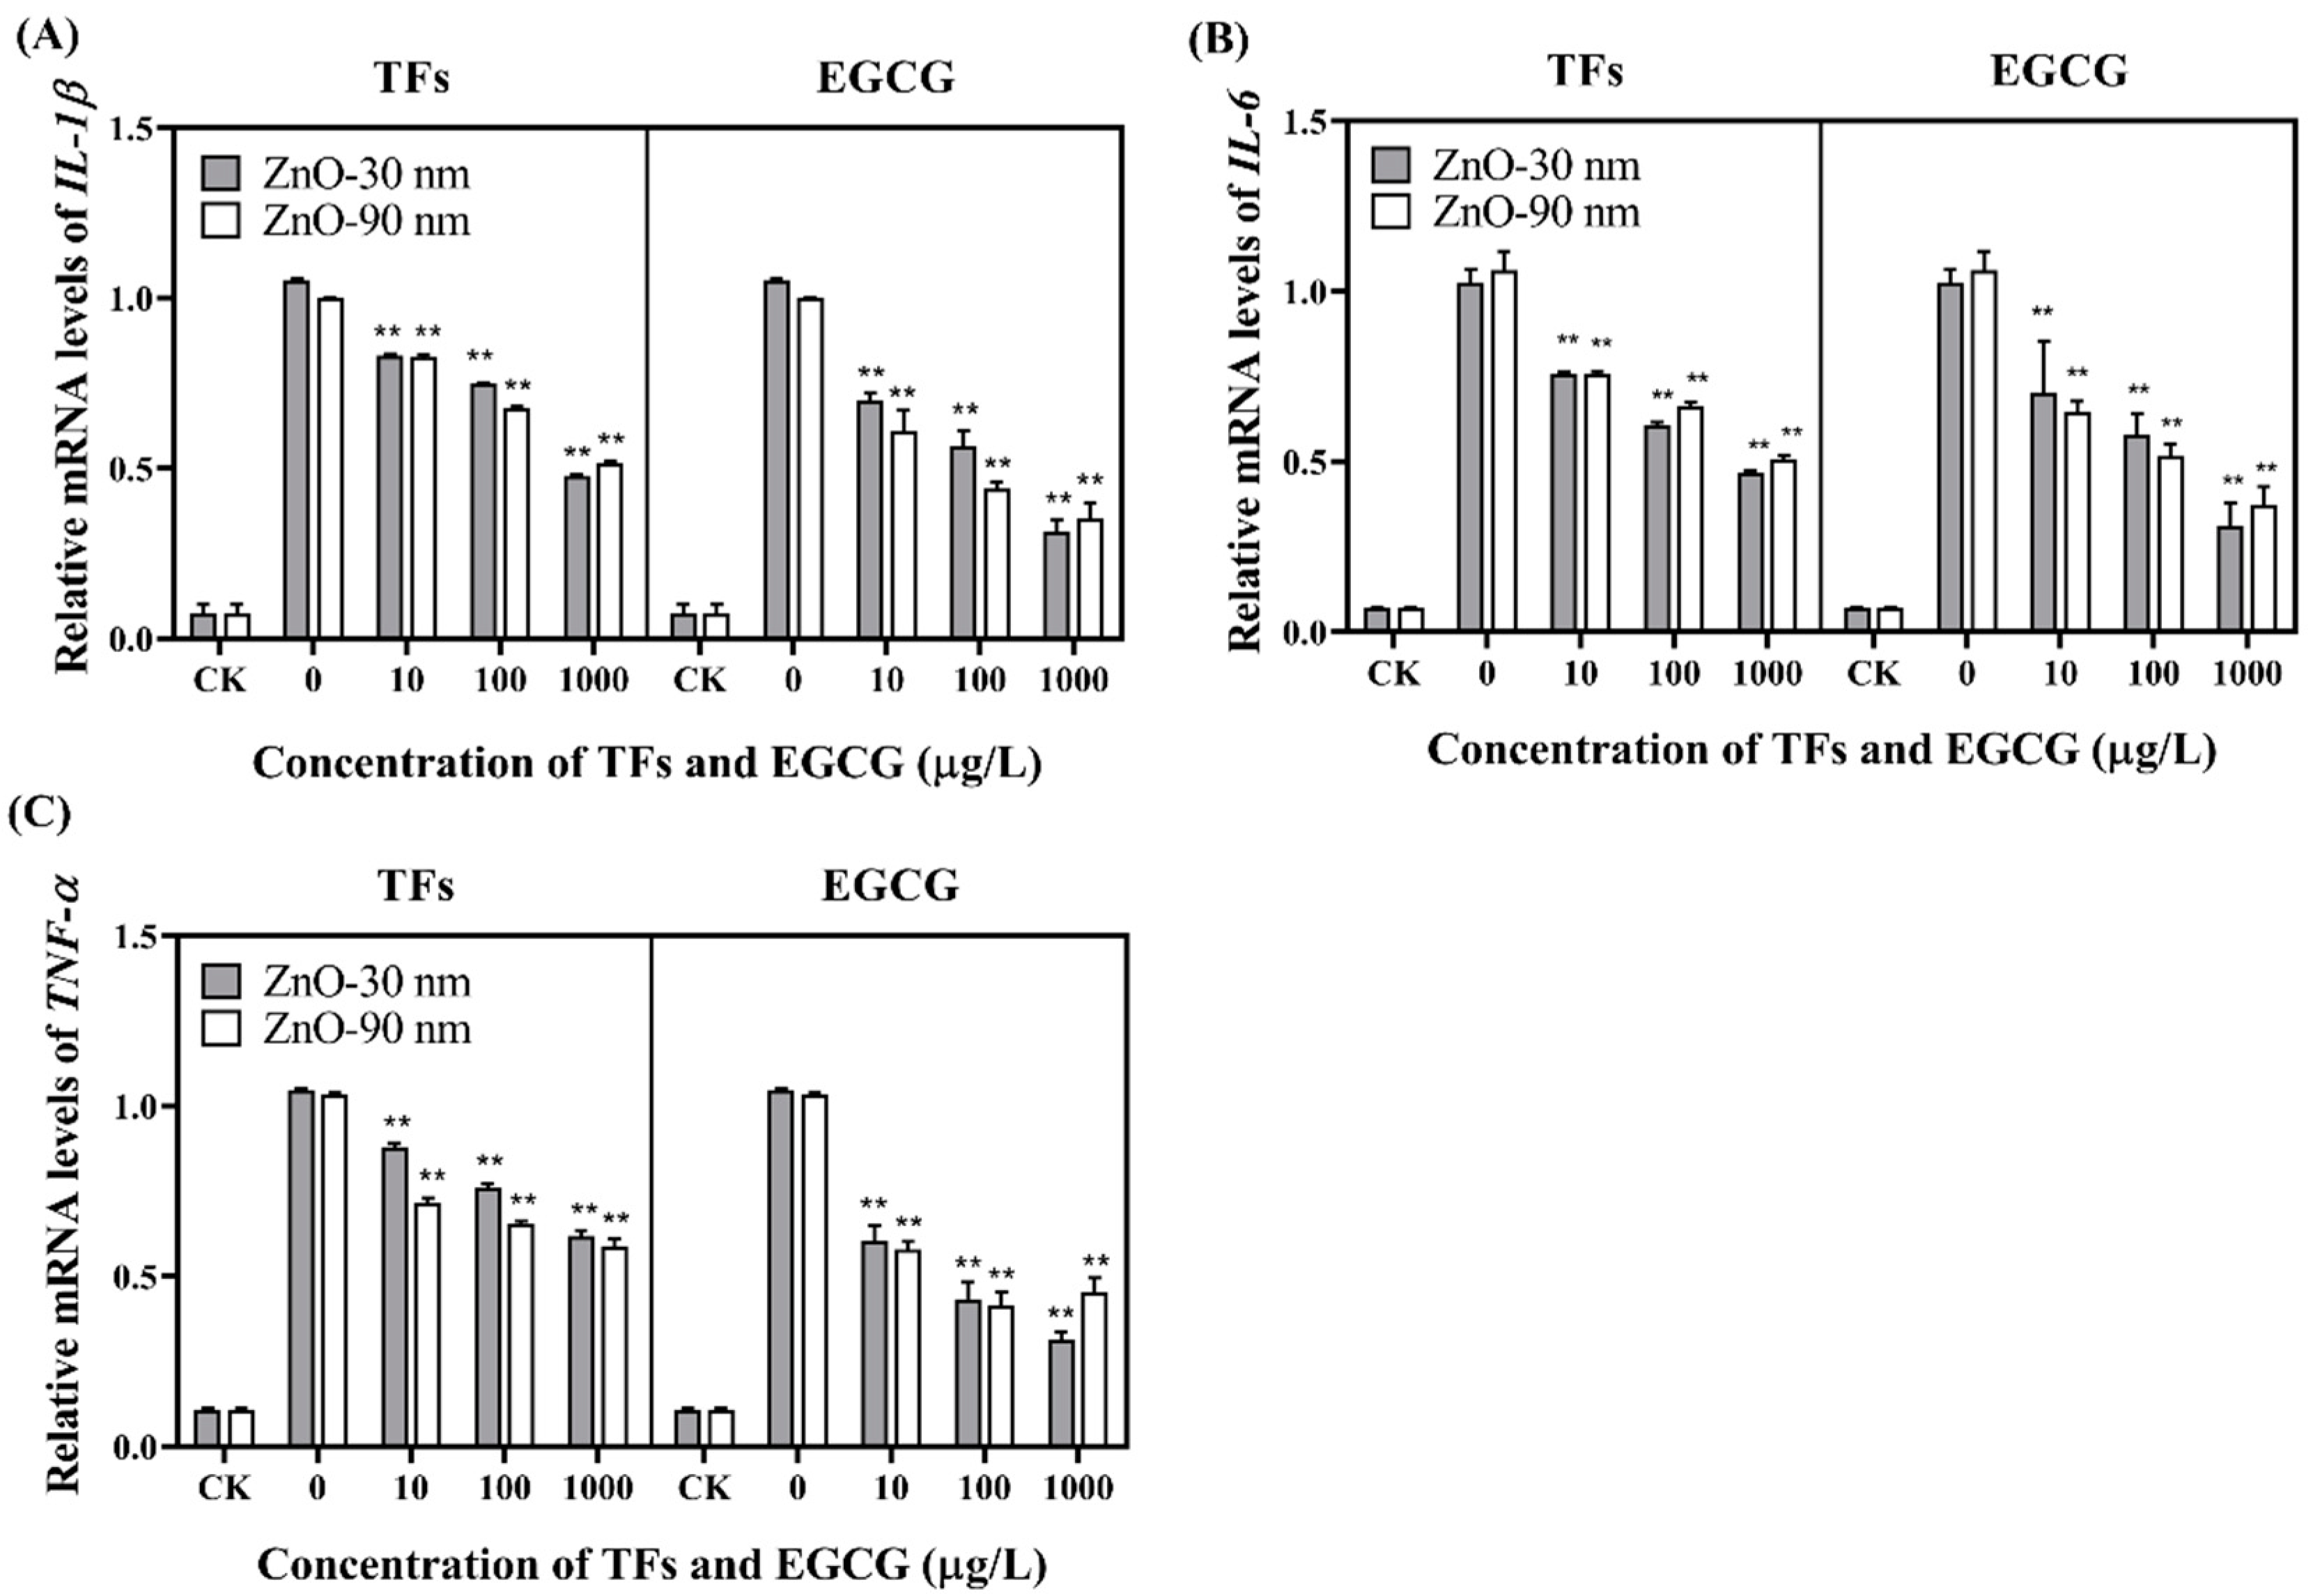
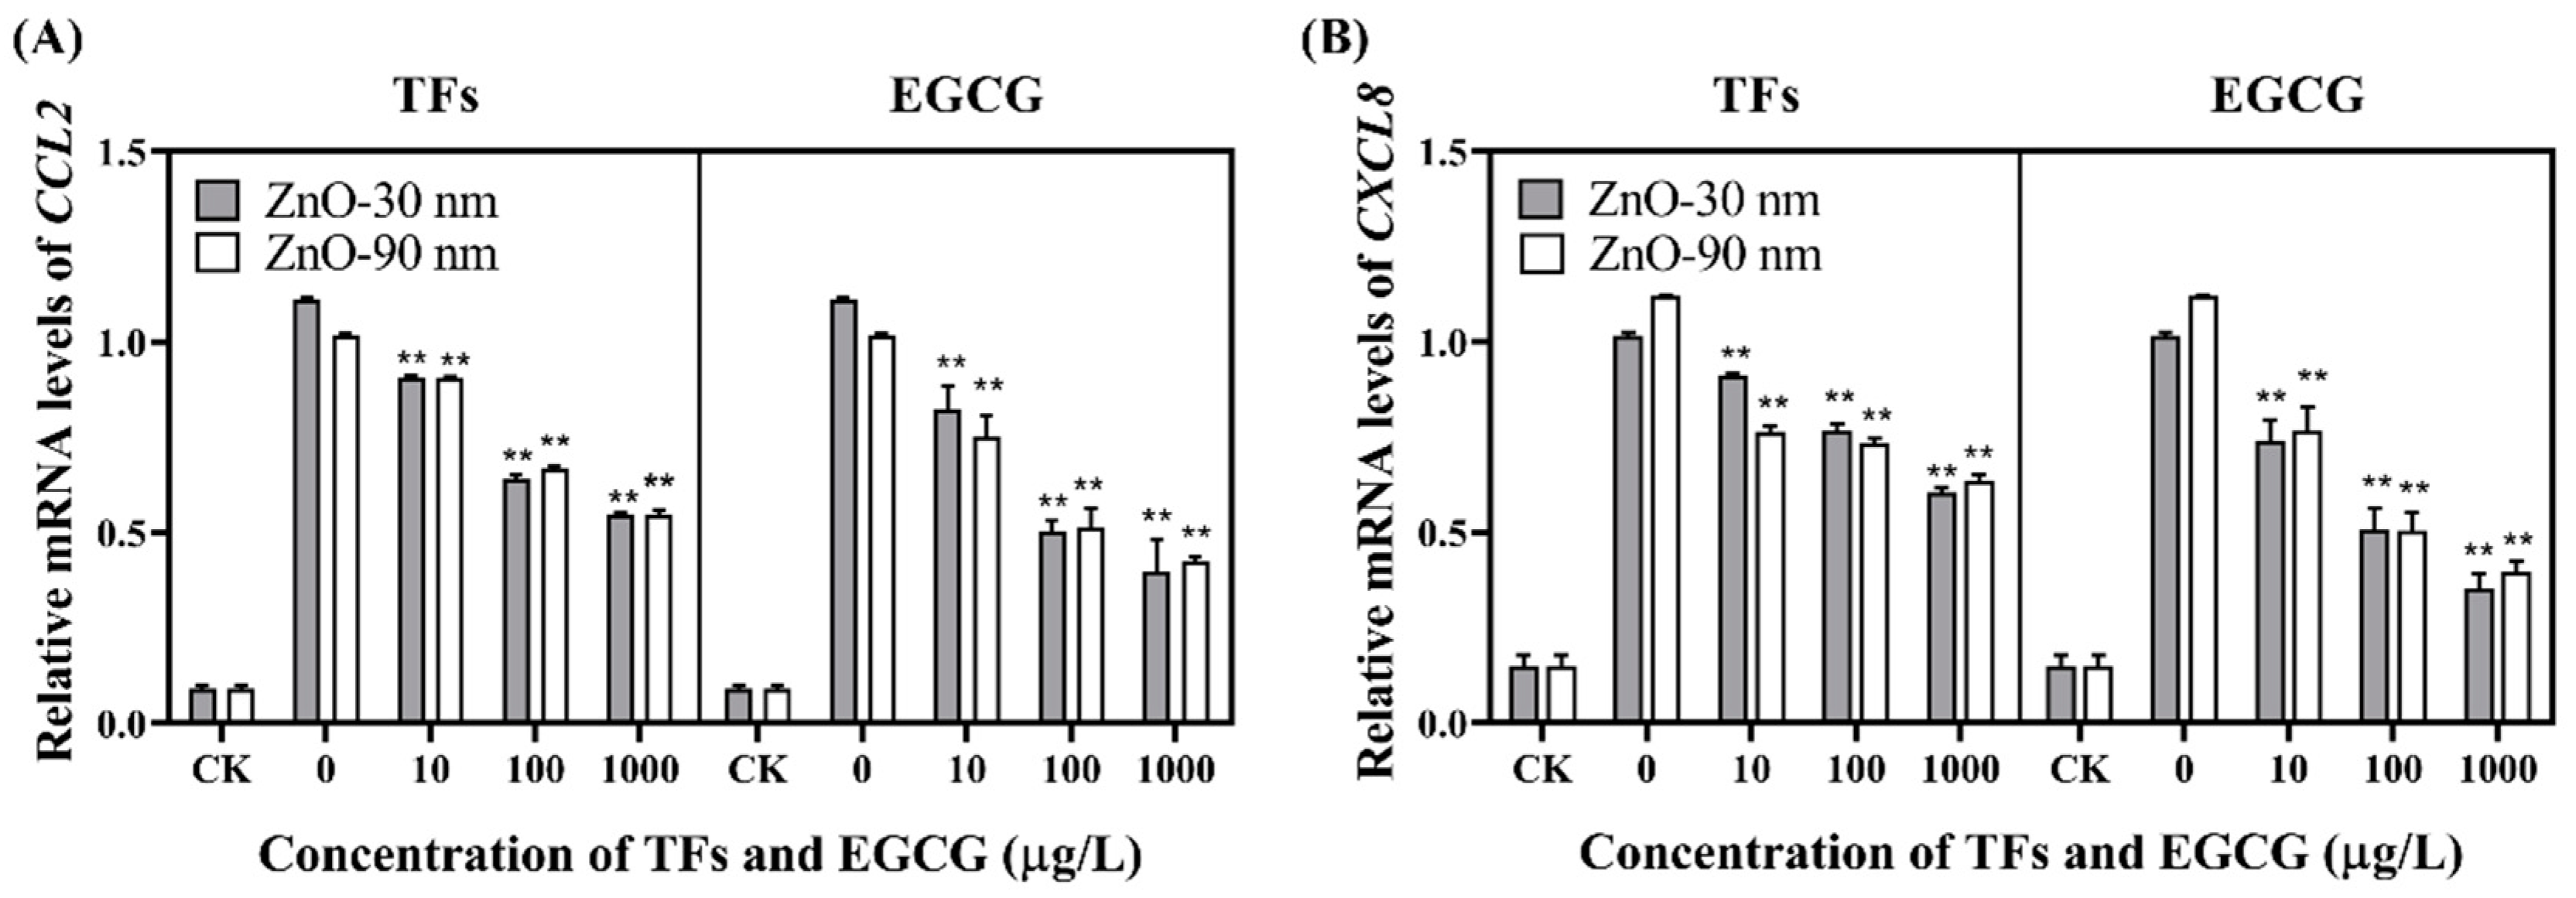
3.3. mRNA Expression Levels of IL-1β, IL-6, TNF-α and Inflammatory Cytokines

When the treatment with TFs or EGCG is conducted, the expression levels of interleukin 1β (IL-1β), interleukin 6 (IL-6), tumor necrosis factor-α (TNF-α) (Figure 2A–C), C-C motif chemokine 2 (CCL2), and C-X-C motif chemokine 8 (CXCL8) (Figure 3A,B) were significantly downregulated with increased concentrations of TFs or EGCG compared to the group exposed with ZnO-NPs only. As shown in Figure 2A–C, the expression of genes was most significantly downregulated after 1000 μg/L TFs or EGCG treatment.

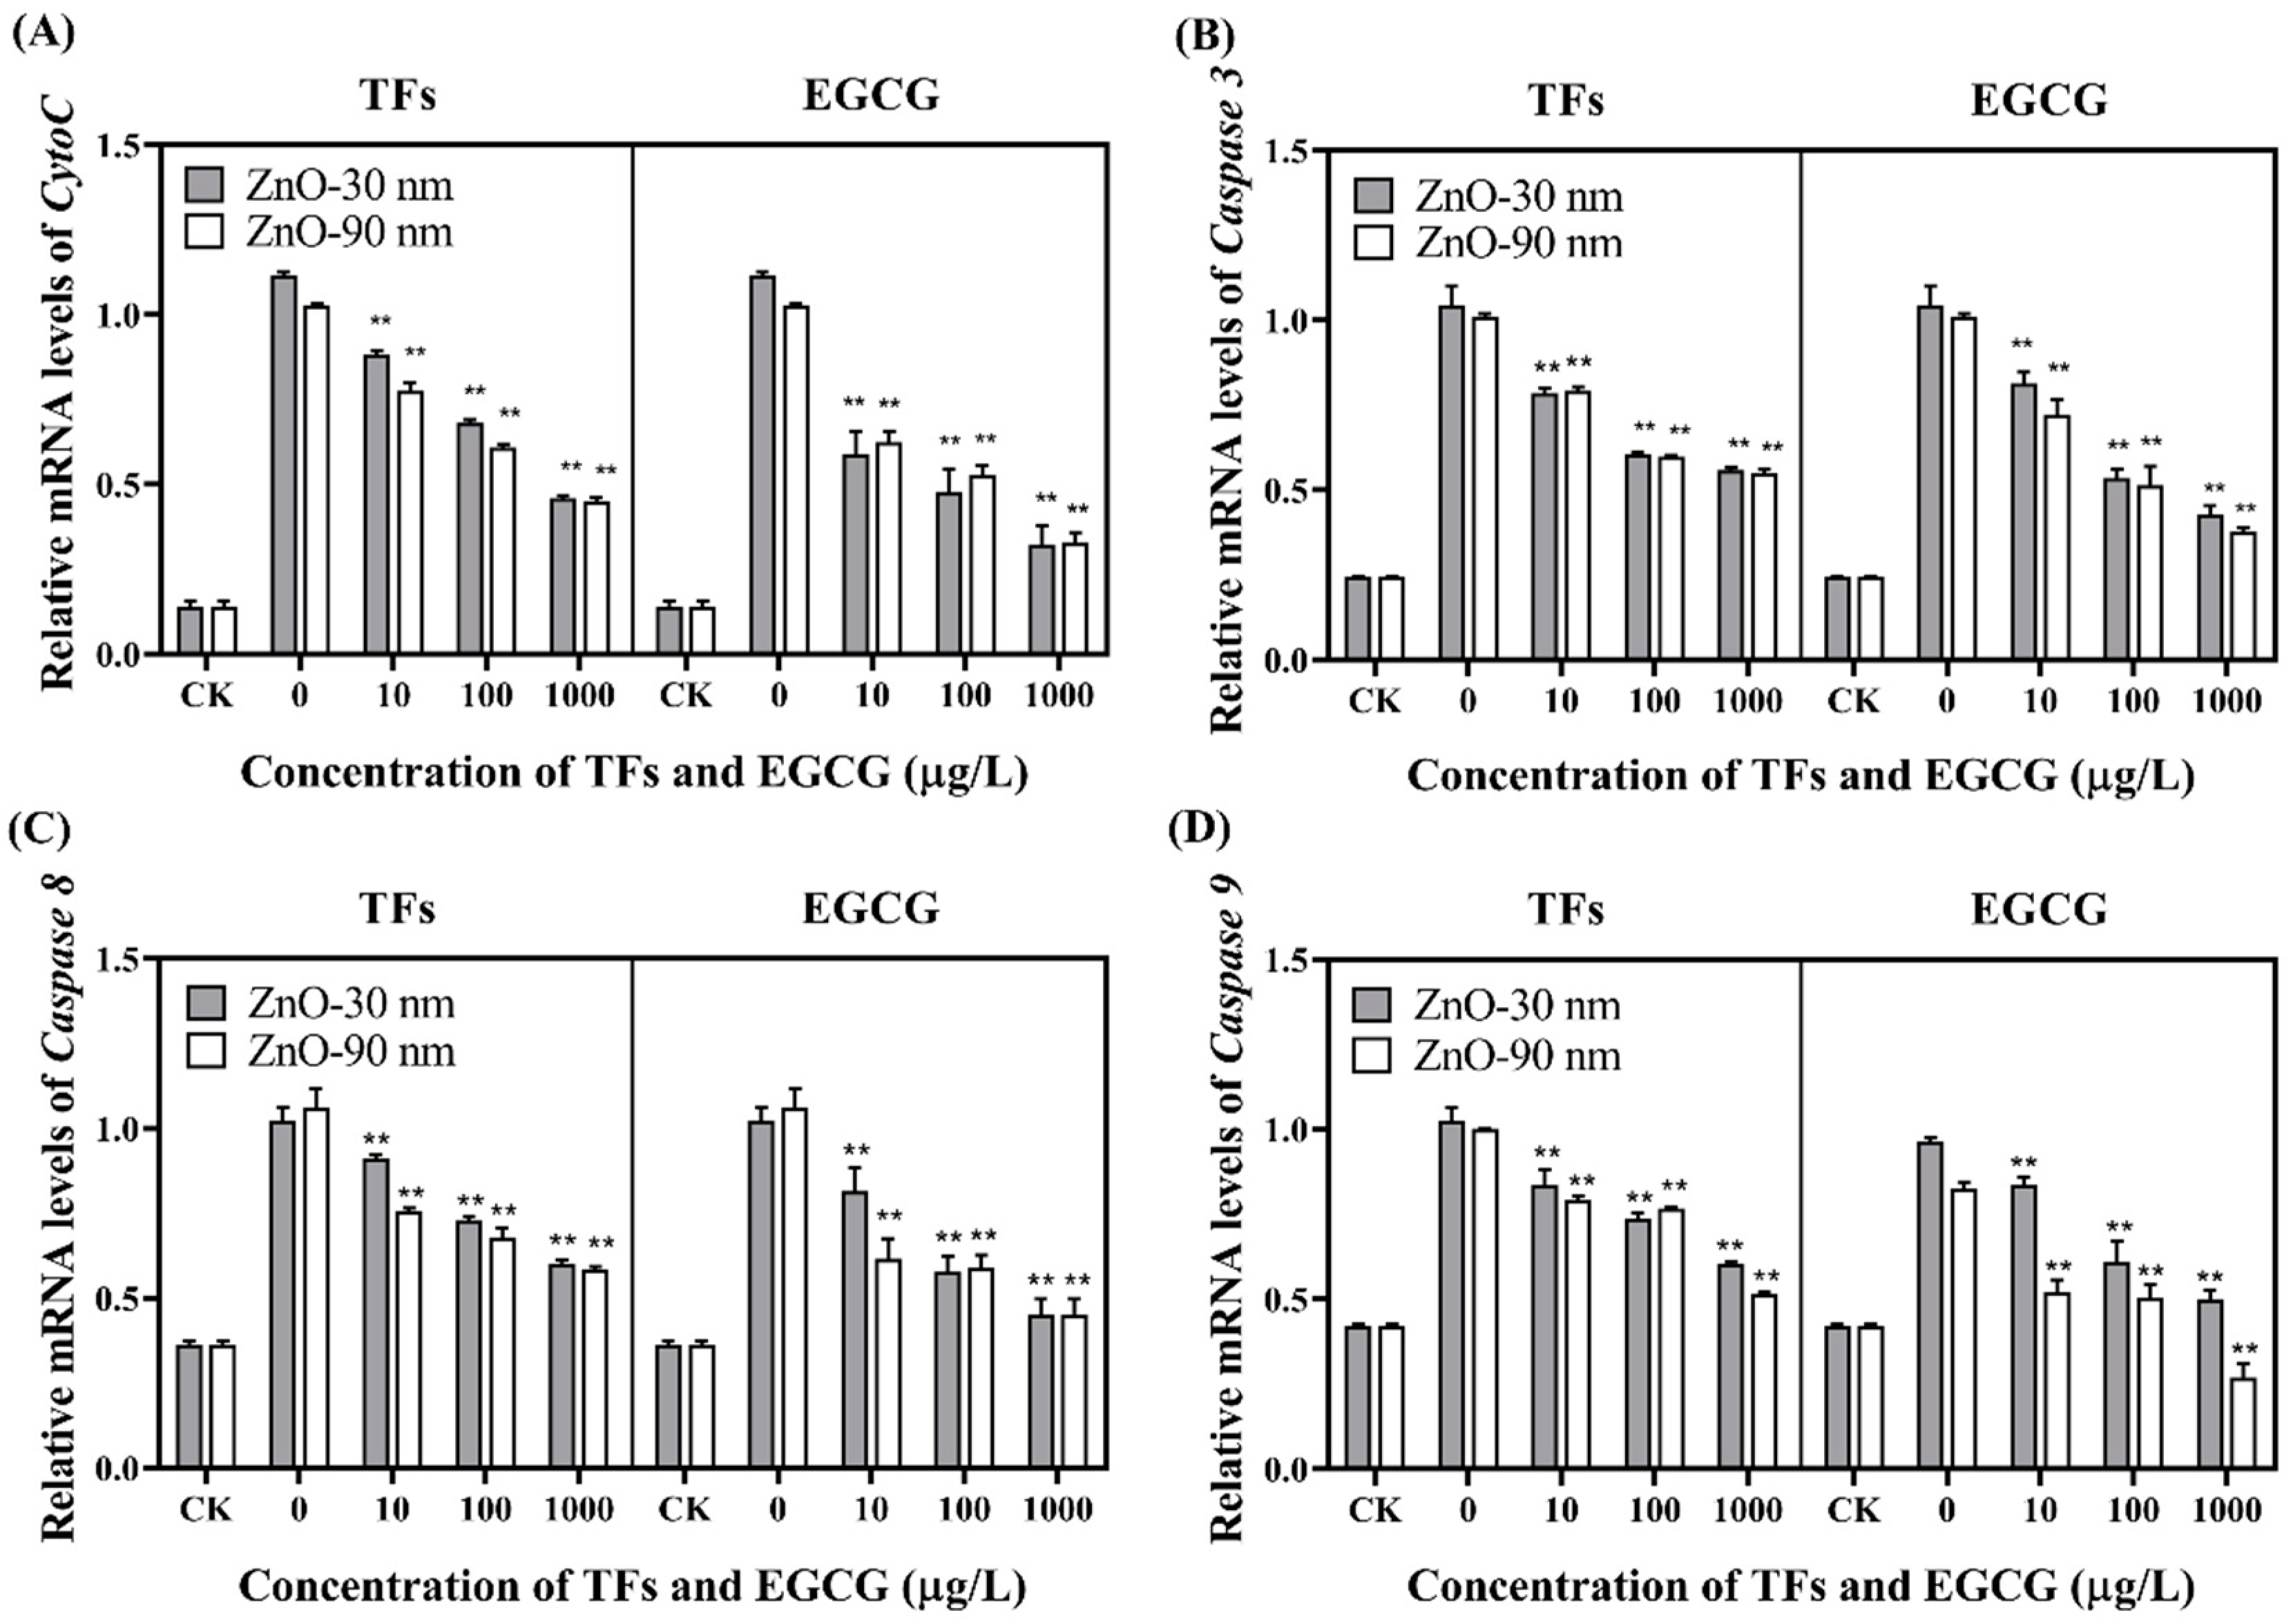
3.4. mRNA Level Expression of Cytochrome C (CytoC) and Caspase 3/8/9

As shown in Figure 4A, the mRNA expression level of CytoC was significantly decreased with increasing concentrations of TFs or EGCG. In response to the 1000 μg/L TFs group, the relative mRNA expression levels of CytoC in the 30 nm exposure group were decreased by 59.1% and the expression levels in the 90 nm exposure group were decreased by 55.0%. In the EGCG group, the relative mRNA expression levels of CytoC in the 30 nm exposure group were decreased by 77.3%, and the 90 nm exposure group were decreased by 75.0%. More interestingly, the expression levels of Caspase 3, Caspase 8, and Caspase 9 decreased significantly after 1000 μg/L TFs or EGCG treatment (Figure 4B–D).

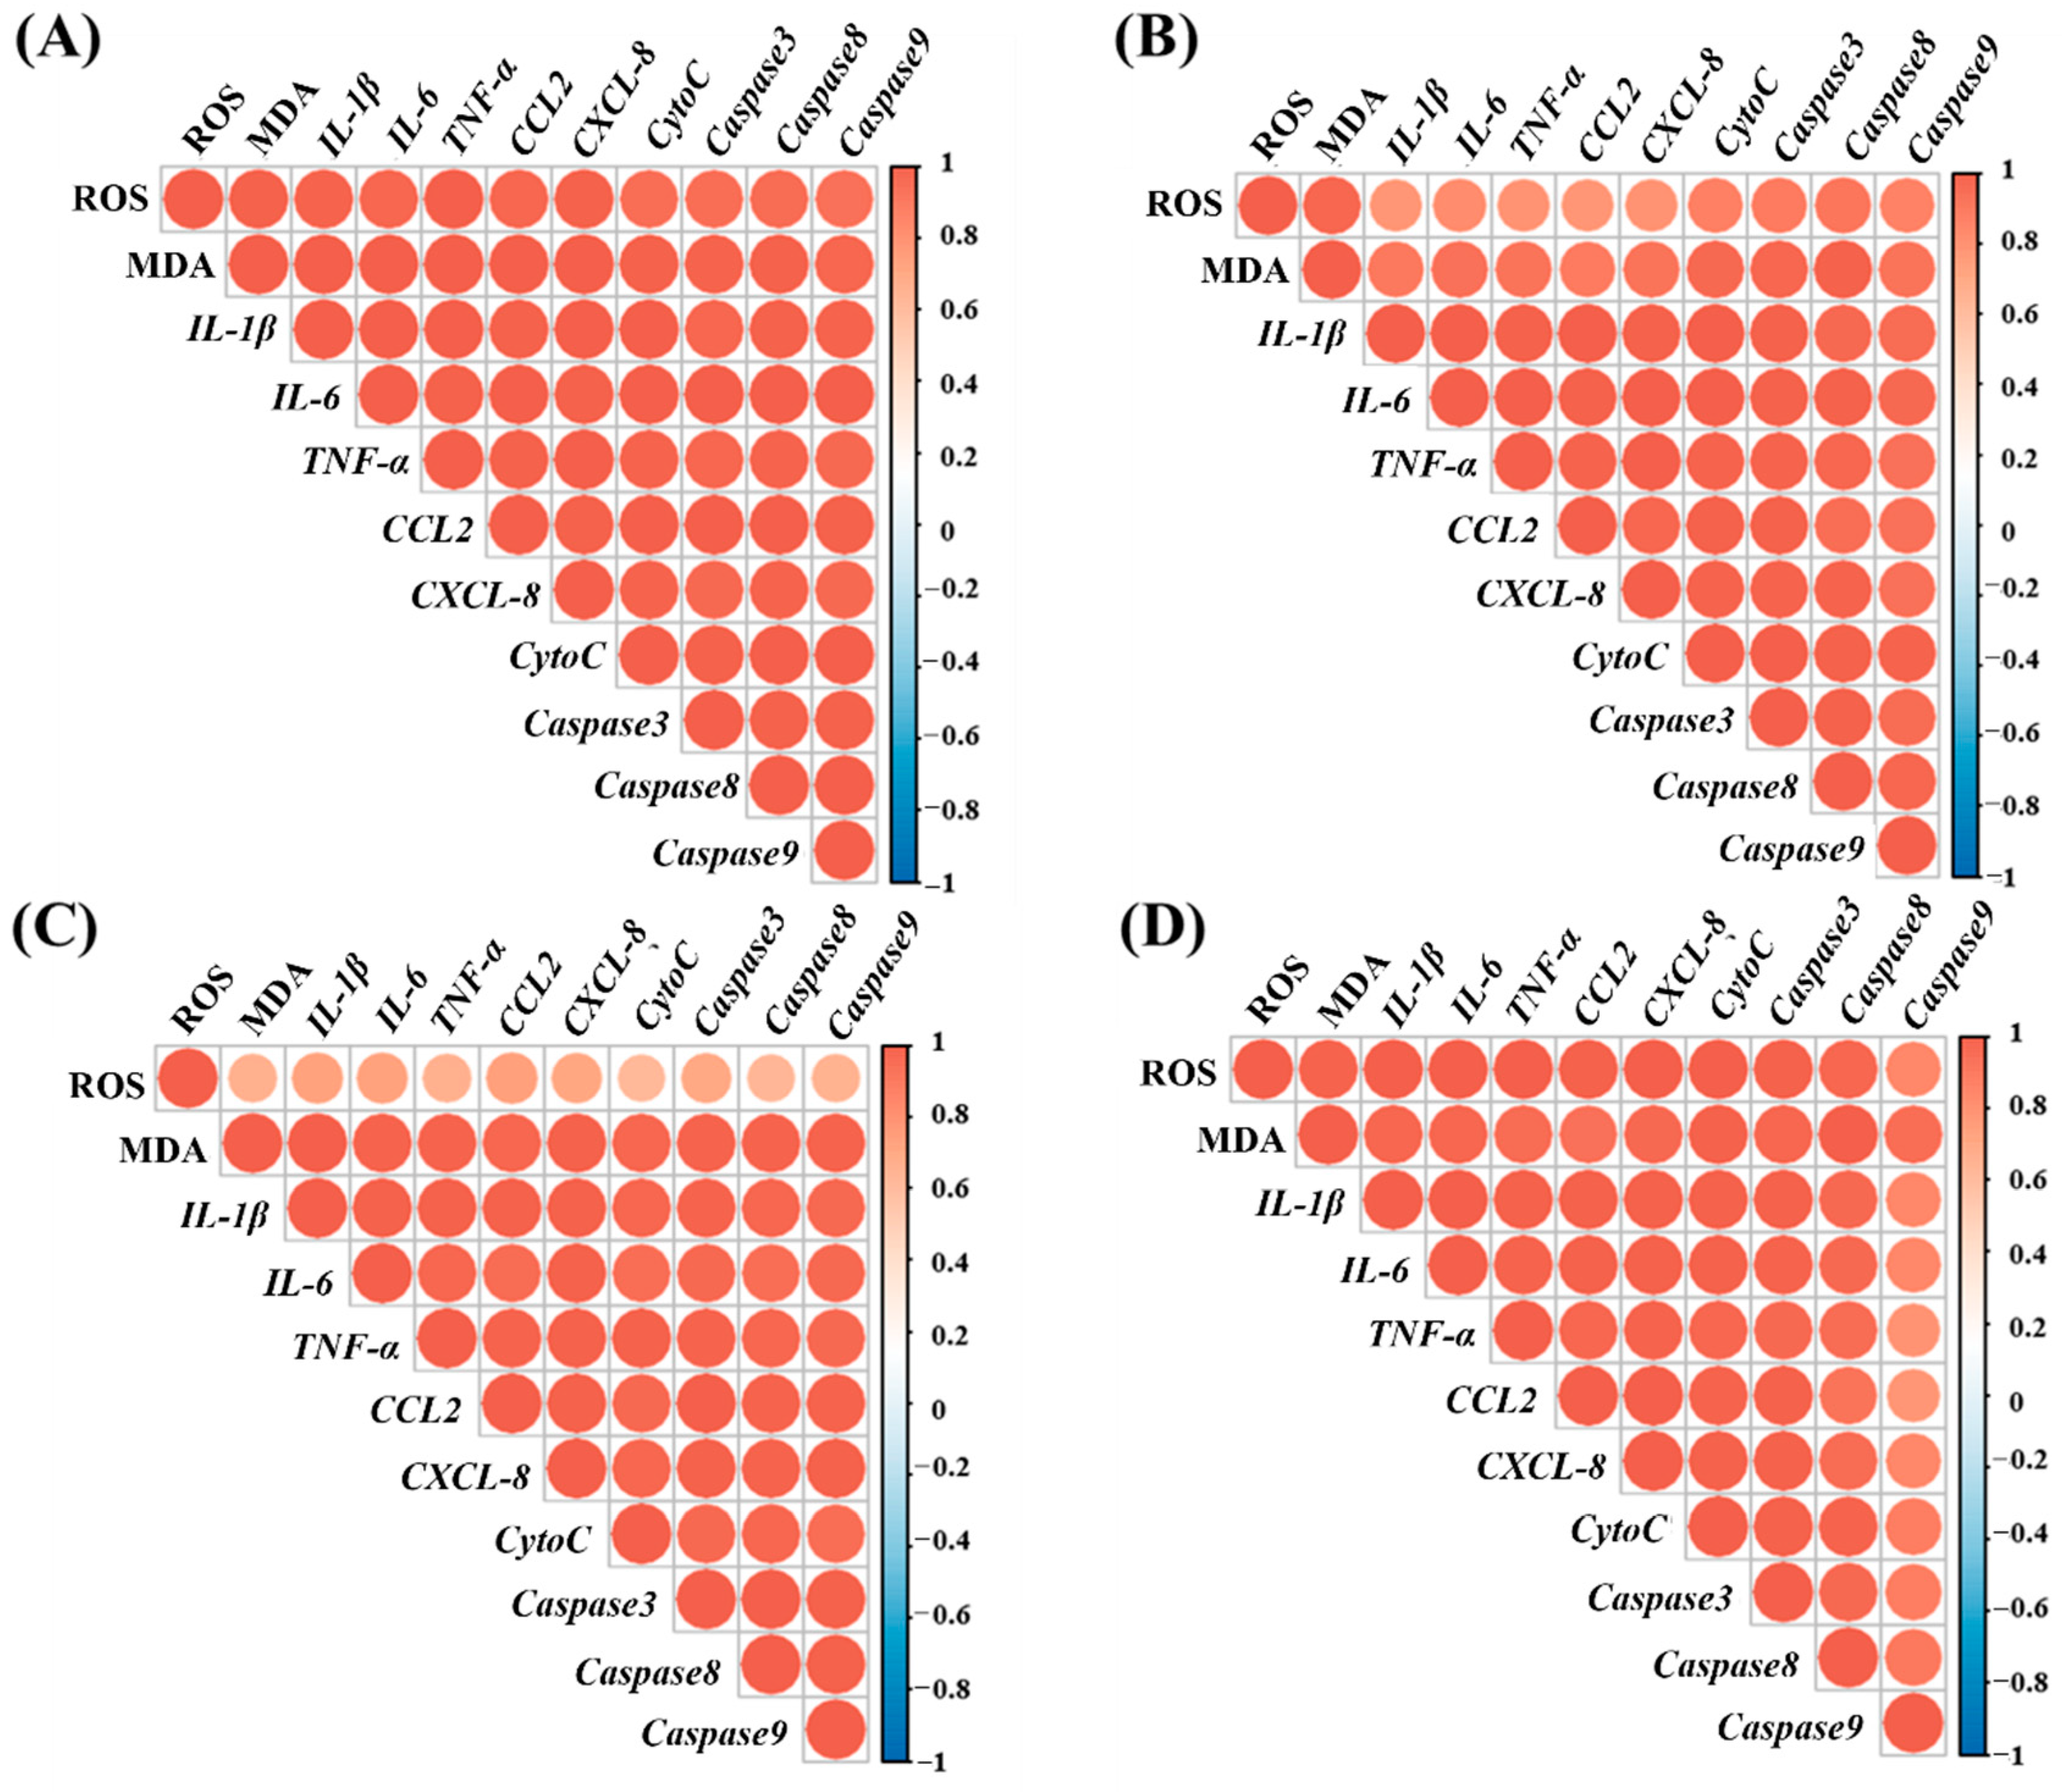
3.5. Correlation Analysis of Oxidative Stress, Inflammation, and Apoptosis

The correlation analysis confirmed that oxidative stress, inflammation, and apoptosis response variables were significantly positively correlated with each other in the TF-treated ZnO-NP-90-nm-treated group (Figure 5A). However, the ZnO-NP-90-nm treated group by TFs showed a slight decrease in Pearson correlation between ROS and the expression levels of IL-1β, IL-6, TNF-α, CCL2, and CXCL8, thereby maintaining a positive correlation (Figure 5B). Similarly, the EGCG-treated ZnO-NPs-30-nm-treated group showed a significant decrease in the Pearson correlation between ROS, inflammatory-related genes, and apoptosis (Figure 5C). In contrast to the above correlation analysis of the EGCG-treated ZnO-NP-90-nm-treated group, there was a slight decrease in the Pearson correlation between Caspase 9 and ROS, and inflammatory-related genes (Figure 5D).

4. Discussion

Due to the widespread use of nanomaterials, biodiversity is gradually being affected, and environmental safety is increasingly threatened [36,37,38]. Nanomaterials can induce inflammation, and small-sized particles of similar nanomaterials are more detrimental to the health of the respiratory system than large-sized particles [39]. Figure 1A shows that higher concentrations of ZnO-NPs exposure resulted in higher Zn levels in RTE cells and smaller particles are more likely to enter RTE cells than larger particles. This implies that a smaller particle size may have more toxic effects, validating the previous point to some extent.
Fine NPs often exist as aerosols, increasing the risk of respiratory disease when they enter the respiratory tract. Currently, various antioxidants are widely used in the treatment of diseases [40,41]. Among them, EGCG, the most abundant catechin, has been shown to have ideal antioxidant effects similar to TFs, such as scavenging superoxide anions and inhibiting lipid peroxidation damage [42]. After exposure to ZnO-NPs, the intracellular ROS and MDA levels increased compared with the CK group, indicating that ZnO-NPs caused severe damage to the cells (Figure 1C,D). After treating with TFs or EGCG, the intracellular ROS and MDA levels of RTE cells had significantly decreased compared with those in the ZnO-NP exposure group. Combined with the powerful proton-donating properties conferred by phenolic hydroxyl groups in TFs, active hydrogen can deactivate free radicals and terminate the free radical chain. This reflects the ability of TFs to act as free radical scavengers, and reduce intracellular ROS and MDA levels by scavenging various types of free radicals generated in RTE cells after exposure to ZnO-NPs [27]. The antioxidant activity of EGCG is related to its specific structure. Structurally, EGCG has hydroxyl groups at the 3′, 4′, and 5′ carbon atoms of the B ring, indicating the major antioxidant properties of the epigallocatechin ester fraction, which are esterified at carbon 3 of the C ring [43]. However, it has been suggested that EGCG may produce a certain amount of ROS in cells [44]. Combined with what we found in this study, the mitigating effect of EGCG is mostly due to a certain amount of ROS release which takes place when scavenging ROS in RTE cells.
When ROS and MDA levels constantly increase in RTE cells, the intracellular redox balance is disrupted, resulting in an inflammatory cellular response [45]. We found that based on the analysis of IL-1β, IL-6, and TNF-α, compared with the CK group, RTE cells experienced a severe inflammatory response when exposed to ZnO-NPs. When TFs or EGCG were added, the inflammation was alleviated, and EGCG had a more pronounced alleviating effect than TFs. Figure 2A–C showed that EGCG inhibits the expression of IL-1β, IL-6, and TNF-α. Presumably, TFs or EGCG can eliminate the negative effects of inflammatory responses to some extent, thereby suppressing inflammation.
In addition to inflammatory cytokines, chemokines are also important players in the intracellular inflammatory response. CCL2 plays an important role in inflammatory diseases by binding to the corresponding receptors to induce cytokine synthesis [46]. CXCL8, produced by lung macrophages and airway epithelial cells, is also essential to the development and progression of inflammatory diseases [47]. In Figure 3A,B, after RTE cells were cultured with 1000 μg/L TFs or EGCG, the CCL2 expression significantly decreases by about 56.68% and 60.04% of the ZnO-30 nm-exposed group. Meanwhile the CXCL8 expression showed downregulation by about 47.83% and 65.21% of the ZnO-30 nm-exposed group. These results implied that there is an alleviating effect of TFs and EGCG on cellular inflammation. In addition, EGCG has a better therapeutic effect than that of TFs.
Moreover, the cellular inflammatory response is closely related to the occurrence of aberrant apoptosis. The current study shows that the onset of apoptosis is highly regulated by the caspase cascade [48]. When cells are stimulated by ROS, CytoC in mitochondria is released into the cytoplasm to bind to Caspase 9, and control the mitochondrial apoptotic pathway by activating Caspase 3. In our study, the apoptosis-related gene expression is downregulated significantly in RTE cells treated with TFs or EGCG compared with the ZnO-NP-exposed group (Figure 4B–D). When RTE cells were treated with 1000 μg/L TFs, the expression of Caspase 3, Caspase 8, and Caspase 9 were downregulated by 50.03%, 45.11%, and 51.33%, respectively, compared with the ZnO-90 nm exposure group. After the same concentration of EGCG treatment, the rescue effect is more significant. The expression of Caspase 3, Caspase 8, and Caspase 9 were downregulated by 60.01%, 55.57%, and 66.67%, respectively, compared with the ZnO-90 nm exposure group. These findings imply that TFs or EGCG have a significant inhibitory effect on the ZnO-NPs induced apoptosis in RTE cells.
According to the correlation analysis, the alleviating effect of TFs or EGCG were mainly mediated by rescuing the intracellular redox balance by scavenging peroxyl radicals in RTE cells (Figure 5). Thus, the inflammatory response induced by oxidative stress was alleviated. When the inflammatory response was alleviated, the CytoC-induced mitochondrial apoptotic pathway was not activated at high levels, and abnormal RTE cell apoptosis was alleviated. Details about TFs and EGCG treatment mechanisms in mitigating the apoptosis of RTE cells induced by ZnO-NPs exposure are shown in Figure 6.

5. Conclusions

To conclude, when ZnO-NPs entered RTE cells, cell proliferation was inhibited and oxidative stress was induced, resulting in large amounts of ROS and MDA. With the disruption of the redox balance in RTE cells, cells underwent an inflammatory response, resulting in the expression of inflammation-related cytokines and chemokines. Subsequently, the inflammatory response was triggered in RTE cells, and genes associated with the mitochondrial apoptotic pathway (CytoC, Caspase 3, Caspase 8, and Caspase 9) were activated. When TFs or EGCG were added, the ROS and MDA levels in RTE cells were controlled, and the intracellular redox balance was stabilized. After the intracellular redox system was stabilized, the inflammatory response of the RTE cells was also effectively alleviated. Along with the elimination of intracellular inflammation, the gene expression related to the control of apoptosis in RTE cells were downregulated, and approached normal levels. TFs and EGCG could be novel approaches which could mitigate the emergence of toxic pollutants, such as in nanoparticles in organisms, potentially slowing down the destruction of biodiversity. While in the lungs, perhaps an inhalable drug of TFs and EGCG will mitigate the toxicity of ZnO-NPs; while in the stomach, an oral drug may be more suitable.

Author Contributions

Sample collection and experiments, X.S., F.C. and H.L.; data analysis and processing, X.S. and F.C.; writing—original draft, X.S.; writing—review and editing, Y.Z., Z.L. and Y.L.; project administration, H.Z. and Y.L.; funding acquisition, Y.L. All authors have read and agreed to the published version of the manuscript.

Funding

This work was supported by the Projects of Zhejiang Provincial Public Welfare Technology Application Research (No. LGC22C050001).

Institutional Review Board Statement

Not applicable.

Informed Consent Statement

Not applicable.

Data Availability Statement

The data are not shared due to restrictions, e.g., privacy and regulation.

Conflicts of Interest

The authors declare that there are no conflicts of interest. The authors alone are responsible for the content and writing of the paper.

References

  1. Hu, D.; Shen, M.; Zhang, Y.; Li, H.; Zeng, G. Microplastics and nanoplastics: Would they affect global biodiversity change? Environ. Sci. Pollut. Res. Int. 2019, 26, 19997–20002. [Google Scholar] [CrossRef] [PubMed]
  2. Smii, H.; Khazri, A.; Ben Ali, M.; Mezni, A.; Hedfi, A.; Albogami, B.; Almalki, M.; Pacioglu, O.; Beyrem, H.; Boufahja, F.; et al. Titanium Dioxide Nanoparticles Are Toxic for the Freshwater Mussel Unio ravoisieri: Evidence from a Multimarker Approach. Diversity 2021, 13, 679. [Google Scholar] [CrossRef]
  3. Bringolf, R.B.; Raines, B.K.; Ratajczak, R.E.; Haskins, D.L. Major Ion Toxicity to Glochidia of Common and Imperiled Freshwater Mussel Species. Diversity 2022, 14, 95. [Google Scholar] [CrossRef]
  4. Yildirimer, L.; Thanh, N.T.; Loizidou, M.; Seifalian, A.M. Toxicology and clinical potential of nanoparticles. Nano Today 2011, 6, 585–607. [Google Scholar] [CrossRef]
  5. Zhang, Y.; Nayak, T.R.; Hong, H.; Cai, W. Biomedical Applications of Zinc Oxide Nanomaterials. Curr. Mol. Med. 2013, 13, 1633–1645. [Google Scholar] [CrossRef]
  6. Zuyderduyn, S.; Ninaber, D.K.; Hiemstra, P.S.; Rabe, K.F. The antimicrobial peptide LL-37 enhances IL-8 release by human airway smooth muscle cells. J. Allergy Clin. Immunol. 2006, 117, 1328–1335. [Google Scholar] [CrossRef]
  7. Goma, A.A.; Tohamy, H.G.; El-Kazaz, S.E.; Soliman, M.M.; Shukry, M.; Elgazzar, A.M.; Rashed, R.R. Insight Study on the Comparison between Zinc Oxide Nanoparticles and Its Bulk Impact on Reproductive Performance, Antioxidant Levels, Gene Expression, and Histopathology of Testes in Male Rats. Antioxidants 2020, 10, 41. [Google Scholar] [CrossRef]
  8. Rossner, P.; Vrbova, K.; Strapacova, S.; Rossnerova, A.; Ambroz, A.; Brzicova, T.; Libalova, H.; Javorkova, E.; Kulich, P.; Vecera, Z.; et al. Inhalation of ZnO Nanoparticles: Splice Junction Expression and Alternative Splicing in Mice. Toxicol. Sci. 2019, 168, 190–200. [Google Scholar] [CrossRef]
  9. Arathi, A.; Joseph, X.; Akhil, V.; Mohanan, P.V. L-Cysteine capped zinc oxide nanoparticles induced cellular response on adenocarcinomic human alveolar basal epithelial cells using a conventional and organ-on-a-chip approach. Colloids Surf. B Biointerfaces 2022, 211, 112300. [Google Scholar]
  10. Jung, A.; Kim, S.H.; Yang, J.Y.; Jeong, J.; Lee, J.K.; Oh, J.H.; Lee, J.H. Effect of Pulmonary Inflammation by Surface Functionalization of Zinc Oxide Nanoparticles. Toxics 2021, 9, 336. [Google Scholar] [CrossRef]
  11. Gong, F.; Xu, J.C.; Liu, B.; Yang, N.L.; Cheng, L.; Huang, P.; Wang, C.J.; Chen, Q.; Ni, C.F.; Liu, Z. Nanoscale CaH2 materials for synergistic hydrogen-immune cancer therapy. Chem 2022, 8, 268–286. [Google Scholar] [CrossRef]
  12. Lee, S.R.; Im, K.J.; Suh, S.I.; Jung, J.G. Protective effect of green tea polyphenol (-)-epigallocatechin gallate and other antioxidants on lipid peroxidation in gerbil brain homogenates. Phytother Res. 2003, 17, 206–209. [Google Scholar] [CrossRef] [PubMed]
  13. Manson, M.M.; Gescher, A.; Hudson, E.A.; Plummer, S.M.; Squires, M.S.; Prigent, S.A. Blocking and suppressing mechanisms of chemoprevention by dietary constituents. Toxicol. Lett. 2000, 112–113, 499–505. [Google Scholar] [CrossRef]
  14. Wang, Z.Y.; Huang, M.T.; Lou, Y.R.; Xie, J.G.; Reuhl, K.R.; Newmark, H.L.; Ho, C.T.; Yang, C.S.; Conney, A.H. Inhibitory effects of black tea, green tea, decaffeinated black tea, and decaffeinated green tea on ultraviolet B light-induced skin carcinogenesis in 7,12-dimethylbenz[a]anthracene-initiated SKH-1 mice. Cancer Res. 1994, 54, 3428–3435. [Google Scholar]
  15. Leung, L.K.; Su, Y.; Chen, R.; Zhang, Z.; Huang, Y.; Chen, Z.Y. Theaflavins in Black Tea and Catechins in Green Tea Are Equally Effective Antioxidants. J. Nutr. 2001, 131, 2248–2251. [Google Scholar] [CrossRef]
  16. Henning, S.M.; Choo, J.J.; Heber, D. Nongallated Compared with Gallated Flavan-3-ols in Green and Black Tea Are More Bioavailable. J. Nutr. 2008, 138, 1529S–1534S. [Google Scholar] [CrossRef]
  17. Zhou, R.; Li, X.; Li, L.; Zhang, H. Theaflavins alleviate sevoflurane-induced neurocytotoxicity via Nrf2 signaling pathway. Int. J. Neurosci. 2020, 130, 1–8. [Google Scholar] [CrossRef]
  18. Wang, Z.; Luo, H.; Xia, H. Theaflavins attenuate ethanol-induced oxidative stress and cell apoptosis in gastric mucosa epithelial cells via downregulation of the mitogenactivated protein kinase pathway. Mol. Med. Rep. 2018, 18, 3791–3799. [Google Scholar] [CrossRef]
  19. Hatasa, Y.; Chikazawa, M.; Furuhashi, M.; Nakashima, F.; Shibata, T.; Kondo, T.; Akagawa, M.; Hamagami, H.; Tanaka, H.; Tachibana, H.; et al. Oxidative Deamination of Serum Albumins by (-)-Epigallocatechin-3-O-Gallate: A Potential Mechanism for the Formation of Innate Antigens by Antioxidants. PLoS ONE 2016, 11, e0153002. [Google Scholar] [CrossRef]
  20. Ozgur, E.; Guler, G.; Seyhan, N. Mobile phone radiation-induced free radical damage in the liver is inhibited by the antioxidants n-acetyl cysteine and epigallocatechin-gallate. Int. J. Radiat. Biol. 2010, 86, 935–945. [Google Scholar] [CrossRef]
  21. Nagle, D.G.; Ferreira, D.; Zhou, Y.D. Epigallocatechin-3-gallate (EGCG): Chemical and biomedical perspectives. Phytochemistry 2006, 67, 1849–1855. [Google Scholar] [CrossRef] [PubMed]
  22. Singh, B.N.; Shankar, S.; Srivastava, R.K. Green tea catechin, epigallocatechin-3-gallate (EGCG): Mechanisms, perspectives and clinical applications. Biochem. Pharmacol. 2011, 82, 1807–1821. [Google Scholar] [CrossRef] [PubMed] [Green Version]
  23. Sakagami, H.; Arakawa, H.; Maeda, M.; Satoh, K.; Kadofuku, T.; Fukuchi, K.; Gomi, K. Production of hydrogen peroxide and me-thionine sulfoxide by epigallocatechin gallate and antioxidants. Anticancer Res. 2001, 21, 2633–2641. [Google Scholar]
  24. Na, H.K.; Surh, Y.J. Modulation of Nrf2-mediated antioxidant and detoxifying enzyme induction by the green tea polyphenol EGCG. Food Chem. Toxicol. 2008, 46, 1271–1278. [Google Scholar] [CrossRef] [PubMed]
  25. Yi, J.; Chen, C.; Liu, X.; Kang, Q.; Hao, L.; Huang, J.; Lu, J. Radioprotection of EGCG based on immunoregulatory effect and antioxidant activity against (60)Cogamma radiation-induced injury in mice. Food Chem. Toxicol. 2020, 135, 111051. [Google Scholar] [CrossRef]
  26. Liang, Y.; Ip, M.S.M.; Mak, J.C.W. (-)-Epigallocatechin-3-gallate suppresses cigarette smoke-induced inflammation in human cardiomyocytes via ROS-mediated MAPK and NF-kappaB pathways. Phytomedicine 2019, 58, 152768. [Google Scholar] [CrossRef]
  27. Shi, J.; Zhang, M.; Zhang, L.; Deng, H. Epigallocatechin-3-gallate attenuates microcystin-LR-induced apoptosis in human umbilical vein endothelial cells through activation of the NRF2/HO-1 pathway. Environ. Pollut. 2018, 239, 466–472. [Google Scholar] [CrossRef]
  28. Cao, W.; Gu, M.; Wang, S.; Huang, C.; Xie, Y.; Cao, Y. Effects of epigallocatechin gallate on the stability, dissolution and toxicology of ZnO nanoparticles. Food Chem. 2022, 371, 131383. [Google Scholar] [CrossRef]
  29. Chen, X.; Wang, D.; Guo, X.; Li, X.; Ye, W.; Qi, Y.; Gu, W. Curcumin-Loaded mPEG-PLGA Nanoparticles Attenuates the Apoptosis and Corticosteroid Resistance Induced by Cigarette Smoke Extract. Front. Pharmacol. 2022, 13, 824652. [Google Scholar] [CrossRef]
  30. Ahamed, M.; Akhtar, M.J.; Alaizeri, Z.M.; Alhadlaq, H.A. TiO2 nanoparticles potentiated the cytotoxicity, oxidative stress and apoptosis response of cadmium in two different human cells. Environ. Sci. Pollut. Res. Int. 2020, 27, 10425–10435. [Google Scholar] [CrossRef]
  31. Gao, Y.L.; Yoshida, A.; Liu, J.Y.; Shimizu, T.; Shirota, K.; Shiina, Y.; Osatomi, K. Molecular cloning and expression dynamics of UNC-45B upon heat shock in the muscle of yellowtail. Aquaculture 2021, 541, 736827. [Google Scholar] [CrossRef]
  32. Sedanza, M.G.; Alshaweesh, J.; Gao, Y.-L.; Yoshida, A.; Kim, H.-J.; Yamaguchi, K.; Satuito, C.G. Transcriptome Dynamics of an Oyster Larval Response to a Conspecific Cue-Mediated Settlement Induction in the Pacific Oyster Crassostrea gigas. Diversity 2022, 14, 559. [Google Scholar] [CrossRef]
  33. Herrmann, F.; Romero, M.R.; Blazquez, A.G.; Kaufmann, D.; Ashour, M.L.; Kahl, S.; Marín, J.J.G.; Efferth, T.; Wink, M.; Mohamed, L.A. Diversity of Pharmacological Properties in Chinese and European Medicinal Plants: Cytotoxicity, Antiviral and Antitrypanosomal Screening of 82 Herbal Drugs. Diversity 2011, 3, 547–580. [Google Scholar] [CrossRef] [Green Version]
  34. Wang, B.; Zhang, J.; Chen, C.; Xu, G.; Qin, X.; Hong, Y.; Bose, D.D.; Qiu, F.; Zou, Z. The size of zinc oxide nanoparticles controls its toxicity through impairing autophagic flux in A549 lung epithelial cells. Toxicol. Lett. 2018, 285, 51–59. [Google Scholar] [CrossRef] [PubMed]
  35. Shalini, D.; Senthilkumar, S.; Rajaguru, P. Effect of size and shape on toxicity of zinc oxide (ZnO) nanomaterials in human peripheral blood lymphocytes. Toxicol. Mech. Methods 2018, 28, 87–94. [Google Scholar] [CrossRef]
  36. Elsaesser, A.; Howard, C.V. Toxicology of nanoparticles. Adv. Drug Deliv. Rev. 2012, 64, 129–137. [Google Scholar] [CrossRef]
  37. Durnev, A.D. Toxicology of nanoparticles. Bull. Exp. Biol. Med. 2008, 145, 72–74. [Google Scholar] [CrossRef]
  38. Filippi, C.; Pryde, A.; Cowan, P.; Lee, T.; Hayes, P.; Donaldson, K.; Plevris, J.; Stone, V. Toxicology of ZnO and TiO2nanoparticles on hepatocytes: Impact on metabolism and bioenergetics. Nanotoxicology 2015, 9, 126–134. [Google Scholar] [CrossRef]
  39. Oberdorster, G.; Oberdorster, E.; Oberdorster, J. Nanotoxicology: An emerging discipline evolving from studies of ultrafine particles. Environ. Health Perspect. 2005, 113, 823–839. [Google Scholar] [CrossRef]
  40. Xiong, D.W.; Fang, T.; Yu, L.P.; Sima, X.F.; Zhu, W.T. Effects of nano-scale TiO2, ZnO and their bulk counterparts on zebrafish: Acute toxicity, oxidative stress and oxidative damage. Sci. Total Environ. 2011, 409, 1444–1452. [Google Scholar] [CrossRef]
  41. Kumar, A.; Pandey, A.K.; Singh, S.S.; Shanker, R.; Dhawan, A. Engineered ZnO and TiO2 nanoparticles induce oxidative stress and DNA damage leading to reduced viability of Escherichia coli. Free Radic. Biol. Med. 2011, 51, 1872–1881. [Google Scholar] [CrossRef] [PubMed]
  42. Yang, Z.; Jie, G.; Dong, F.; Xu, Y.; Watanabe, N.; Tu, Y. Radical-scavenging abilities and antioxidant properties of theaflavins and their gallate esters in H2O2-mediated oxidative damage system in the HPF-1 cells. Toxicol. In Vitro 2008, 22, 1250–1256. [Google Scholar] [CrossRef] [PubMed]
  43. Ni, J.; Guo, X.; Wang, H.; Zhou, T.; Wang, X. Differences in the Effects of EGCG on Chromosomal Stability and Cell Growth between Normal and Colon Cancer Cells. Molecules 2018, 23, 788. [Google Scholar] [CrossRef] [PubMed] [Green Version]
  44. Lorenz, M. Cellular targets for the beneficial actions of tea polyphenols. Am. J. Clin. Nutr. 2013, 98, 1642S–1650S. [Google Scholar] [CrossRef]
  45. Shen, Y.J.; Li, W.G.; Zhang, H.; Li, B.; Yuan, H.X.; Zhang, J.J. Effects of (-)-epigallocatechin-3-gallate on interleukin-1beta expression in mouse wound healing. Fen Zi Xi Bao Sheng Wu Xue Bao 2009, 42, 179–185. [Google Scholar]
  46. Yamagata, K.; Xie, Y.; Suzuki, S.; Tagami, M. Epigallocatechin-3-gallate inhibits VCAM-1 expression and apoptosis induction associated with LC3 expressions in TNFalpha-stimulated human endothelial cells. Phytomedicine 2015, 22, 431–437. [Google Scholar] [CrossRef]
  47. Khazali, A.S.; Clark, A.M.; Wells, A. Inflammatory cytokine IL-8/CXCL8 promotes tumour escape from hepatocyte-induced dormancy. Br. J. Cancer 2018, 118, 566–576. [Google Scholar] [CrossRef]
  48. Zhang, W.; Shi, H.Y.; Zhang, M. Maspin overexpression modulates tumor cell apoptosis through the regulation of Bcl-2 family proteins. BMC Cancer 2005, 5, 50. [Google Scholar] [CrossRef] [Green Version]
Figure 1. The detection of the zinc content in RTE cells induced with 30 nm ZnO-NPs and 90 nm ZnO-NPs for 12 h by ICP (A). Effects of 100 μg/L of ZnO-NPs with different sizes (30 nm and 90 nm) and the treatment with different concentrations of TFs and EGCG (10, 100, and 1000 μg/L) on the cell proliferation inhibition efficiency (B), and the generation of ROS (C), MDA (D) in RTE cells for 12 h. CK was blank group (the group with neither sample nor NPs treatment). The data was represented as the means ± standard deviation. The asterisks denoted responses that were significantly different from the 0 μg/L group (* p < 0.05, ** p < 0.01). Hash signs indicate significant differences between two selected groups (## p < 0.01).
Diversity 14 00756 g001
Figure 2. Cellular inflammatory response related gene expression of IL-1β, IL-6, and TNF-α. The effects of different concentrations of TFs and EGCG (10, 100, and 1000 μg/L) treatment after different sizes (30 nm and 90 nm) with 100 μg/L of ZnO-NPs exposure on the relative mRNA expressions of IL-1β (A), IL-6 (B), and TNF-α (C) in RTE cells for 12 h. CK was blank group (the group with neither sample nor NPs treatment). The data was represented as the means ± standard deviation. The asterisks denoted responses that were significantly different from those of the 0 μg/L group (** p < 0.01).
Diversity 14 00756 g002
Figure 3. The relative gene expression of inflammatory cytokines CCL2 (A) and CXCL8 (B). Different concentrations of TFs and EGCG (10, 100, and 1000 μg/L) treatment after different sizes (30 nm and 90 nm) with 100 μg/L of ZnO-NPs exposure in RTE cells for 12 h. CK was blank group (the group with neither sample nor NPs treatment). The data was represented as the means ± standard deviation. The asterisks denoted responses that were significantly different from those of the 0 μg/L group (** p < 0.01).
Diversity 14 00756 g003
Figure 4. Apoptosis-related gene expression of CytoC (A), Caspase 3 (B), Caspase 8 (C), and Caspase 9 (D). Different concentrations of TFs and EGCG (10, 100, and 1000 μg/L) treatment after 100 μg/L of 30 nm or 90 nm ZnO-NPs exposure in RTE cells for 12 h. CK was blank group (the group with neither sample nor NPs treatment). The data was represented as the means ± standard deviation. The asterisks denoted responses that were significantly different from those of the 0 μg/L group (** p < 0.01).
Diversity 14 00756 g004
Figure 5. Correlation between oxidative stress indicators ROS, MDA, and inflammatory factors IL-1β, IL-6, TNF-α, CCL2, CXCL8, and CytoC, and mitochondrial apoptosis-related indicators Caspase 3, Caspase 8, and Caspase 9 in TFs-treated RTE cells exposed to ZnO-NPs-30 nm (A), ZnO-NPs-90 nm (B), EGCG-treated RTE cells exposed to ZnO-NPs-30 nm (C), and ZnO-NPs-90 nm (D).
Diversity 14 00756 g005
Figure 6. TFs and EGCG treatment mechanisms in mitigating the apoptosis of RTE cells induced by ZnO-NPs exposure.
Diversity 14 00756 g006
Table 1. Primer sequences for qRT-PCR.
GeneGenbank AccessionPrimer Sequences (5′ to 3′)
CytoCNM_031543.15′-GACTTTGGCCGACCTGTTCTTT-3′
5′-CATGAGGATCAGGAGCCCATATCT-3′
CCL2M574415′-CACCTGCTGCTACTCATTCACTG-3′
5′-CTTCTTTGGGACACCTGCTGCT-3′
CXCL8NM_0308455′-CACCCAAACCGAAGTCATAGCCA-3′
5′-CTTGGGGACACCCTTTAGCATCT-3′
IL-1βNM_0315125′-CCTAGGAAACAGCAATGGTCGGGAC-3′
5′-CCTAGGAAACAGCAATGGTCGGGAC-3′
IL-6NM_012589.25′-CTTCACAGAGGATACCACCCACA-3′
5′-CAGTGCATCATCGCTGTTCATACA-3′
TNF-αNM_0126755′-GACCCCTTTATCGTCTACTCCTC-3′
5′-GCCACTACTTCAGCGTCTCGT-3′
Caspase3NM_012922.25′-AGAGTTGGAGCACTGTAGCACACA-3′
5′-TCATGTCCACCACTGAAGGATGGT- 3 ‘
Caspase 8NM_022277.15′-GCTGGGGATGGCTACTGTGAAA-3′
5′-GGCTCTGGCAAAGTGACTGGATA-3′
Caspase 9NM_031632.15′-GGTGAAGAACGACCTGACTGCTAA-3′
5′-GAGAGGATGACCACCACGAAG-3′
Rat GAPDHNM_017008.45′-GAAGGTCGGTGTGAACGGATTTG-3′
5′-CATGTAGACCATGTAGTTGAGGTCA-3′
Publisher’s Note: MDPI stays neutral with regard to jurisdictional claims in published maps and institutional affiliations.

