Article

Diversity and Community Structure of Zooplankton in Homestead Ponds of a Tropical Coastal Area

by
Sima Rani Karmakar
1,†,
Mohammad Belal Hossain
1,2,*,
Md. Milon Sarker
1,†,
As-Ad Ujjaman Nur
1,
Ahasan Habib
1,3,*,
Bilal Ahamad Paray
4,
Mohammad Khalid Al-Sadoon
4,
Aneela Gulnaz
5 and
Takaomi Arai
6
1
Department of Fisheries and Marine Science, Noakhali Science and Technology University, Noakhali 3814, Bangladesh
2
School of Engineering and Built Environment, Griffith University, Brisbane, QLD 4111, Australia
3
Faculty of Fisheries and Food Science, Universiti Malaysia Terengganu, Kuala Nerus, Terengganu 21030, Malaysia
4
Department of Zoology, College of Science, King Saud University, P.O. Box 2455, Riyadh 11451, Saudi Arabia
5
College of Pharmacy, Woosuk University, Wanju-gun 55338, Korea
6
Environmental and Life Sciences Programme, Faculty of Science, Universiti Brunei Darussalam, Bandar Seri Begawan BE 1410, Brunei
*
Authors to whom correspondence should be addressed.
These authors contributed equally to this work.
Diversity 2022, 14(9), 755; https://doi.org/10.3390/d14090755
Submission received: 13 March 2022 / Revised: 19 April 2022 / Accepted: 1 May 2022 / Published: 13 September 2022

Abstract

:
As an intermediary connection between primary producers and higher trophic levels, zooplankton are an important component of the aquatic food chain, contributing significantly to aquatic biological productivity. This study describes the zooplankton diversity and community structure, as well as their relationships with ecological factors, in homestead ponds of a coastal district along the northern Bay of Bengal region. Significant differences (p < 0.05) were detected in the mean values of temperature, pH, DO, TDS, transparency, and phosphates from the ponds during December 2020, but no significant differences were found in the nitrate levels. However, no significant variances in the ecological parameters between months were found due to the study taking place in the same season. Sixteen zooplankton species, representing four groups, were found in the study area, with the highest mean abundance of 301.19 ± 40.55 ind./L recorded in February 2021 and the lowest of 293.02 ± 21.13 ind./L recorded in December 2020. The diversity (H’), evenness (e), richness (J), and dominance (D) ranged from 2.49 to 2.12, from 0.93 to 0.84, from 2.05 to 1.56, and from 0.13 to 0.09, respectively. Based on the SIMPER analysis, Diaptomus gracilis and Brachionus calyciflorus were found to be significant contributors (>10%) to the zooplankton community structure in different months. The ANOSIM results revealed that 10 species of zooplankton were significant contributors based on their average dissimilarity. The canonical correspondence analysis (CCA) identified that pH, transparency, nitrates, and phosphates have a significant impact on the abundance of zooplankton species in the homestead ponds in the study area.

1. Introduction

Zooplankton are an important component of any aquatic environment because they form the foundation of food chains and food webs. The intermediary nexus for energy fluxes from primary producers, such as phytoplankton and microorganisms, to consumer levels of the food chain is zooplankton [1,2]. They provide an essential indication of the trophic condition of secondary production in aquatic ecosystems [3,4]. Secondary production in aquatic ecosystems directly or indirectly depends on zooplankton. They also play a significant role in recycling nutrients and cycling energy within their respective environments. Zooplankton are the major mode of energy transfer between phytoplankton and fish [2]. Almost all fish rely on zooplankton for sustenance throughout their larval stages, and some fish eat zooplankton throughout their lives. Plankton have been used to monitor aquatic ecosystems and water quality as a bioindicator.
The occurrence and distribution of zooplankton depend on several factors, such as climate change, habitat types, physico-chemical properties, and biotic factors [5,6,7,8]. Environmental factors play an important role in regulating zooplankton distributions; for example, water temperature impacts organism growth and development and mortality. Different species show various tolerances to increasing or decreasing temperature ranges, with particularly sensitive individuals being eliminated [9,10]. Low pH promotes a decreased zooplankton abundance, decreased biodiversity, and the extinction of some species, whereas alkaline conditions associated with high primary production promote zooplankton development and abundance [11,12,13,14,15]. The availability of light determines the producer’s distribution, which indirectly impacts the diversity and distribution of animals. Oxygen dissolved in water, which is required for the survival of all aquatic organisms, is another important abiotic factor. Oxygen deficiencies can directly influence organism mortality. Heavy metals can significantly alter zooplankton’s community structure and diversity [13,14] and tend to reduce community diversity and the richness of aquatic species under anthropogenic pressure [15,16]. The availability of nutrients, such as nitrates and phosphate, has a significant impact on the structure and abundance of zooplankton in an aquatic environment. A slight modification within the physico-chemical properties affects the diversity of the ecosystem. Nonetheless, any changes in these parameters may affect fish growth, development, and maturity [17,18].
Noakhali is a coastal district at the fringe of the Bay of Bengal. Diverse living resources play an important part in Bangladesh’s economy, food security, and the social well-being of the coastal population [19], which is blessed with a diverse range of aquatic species [20]. There are numerous homestead ponds where extensive fish culture is practiced. The fish production of these homestead ponds mainly depends on natural food. Zooplankton play an important role in these ponds as a food source. The abundance of zooplankton in a fish pond indicates whether or not supplemental feed is required in the associated fish ponds. As a result, the quantity of the zooplankton can lower farming costs. Several studies have been carried out on physico-chemical parameters and zooplankton in Noakhali [21,22,23], but no substantial work has yet been performed on the community structure of zooplankton in homestead ponds in Bangladesh. Thus, by considering the gap in the knowledge and the importance of zooplankton in homestead ponds, the study aims to describe the diversity and community assemblage of zooplankton in homestead fish ponds in the Noakhali coastal area.

2. Materials and Methods
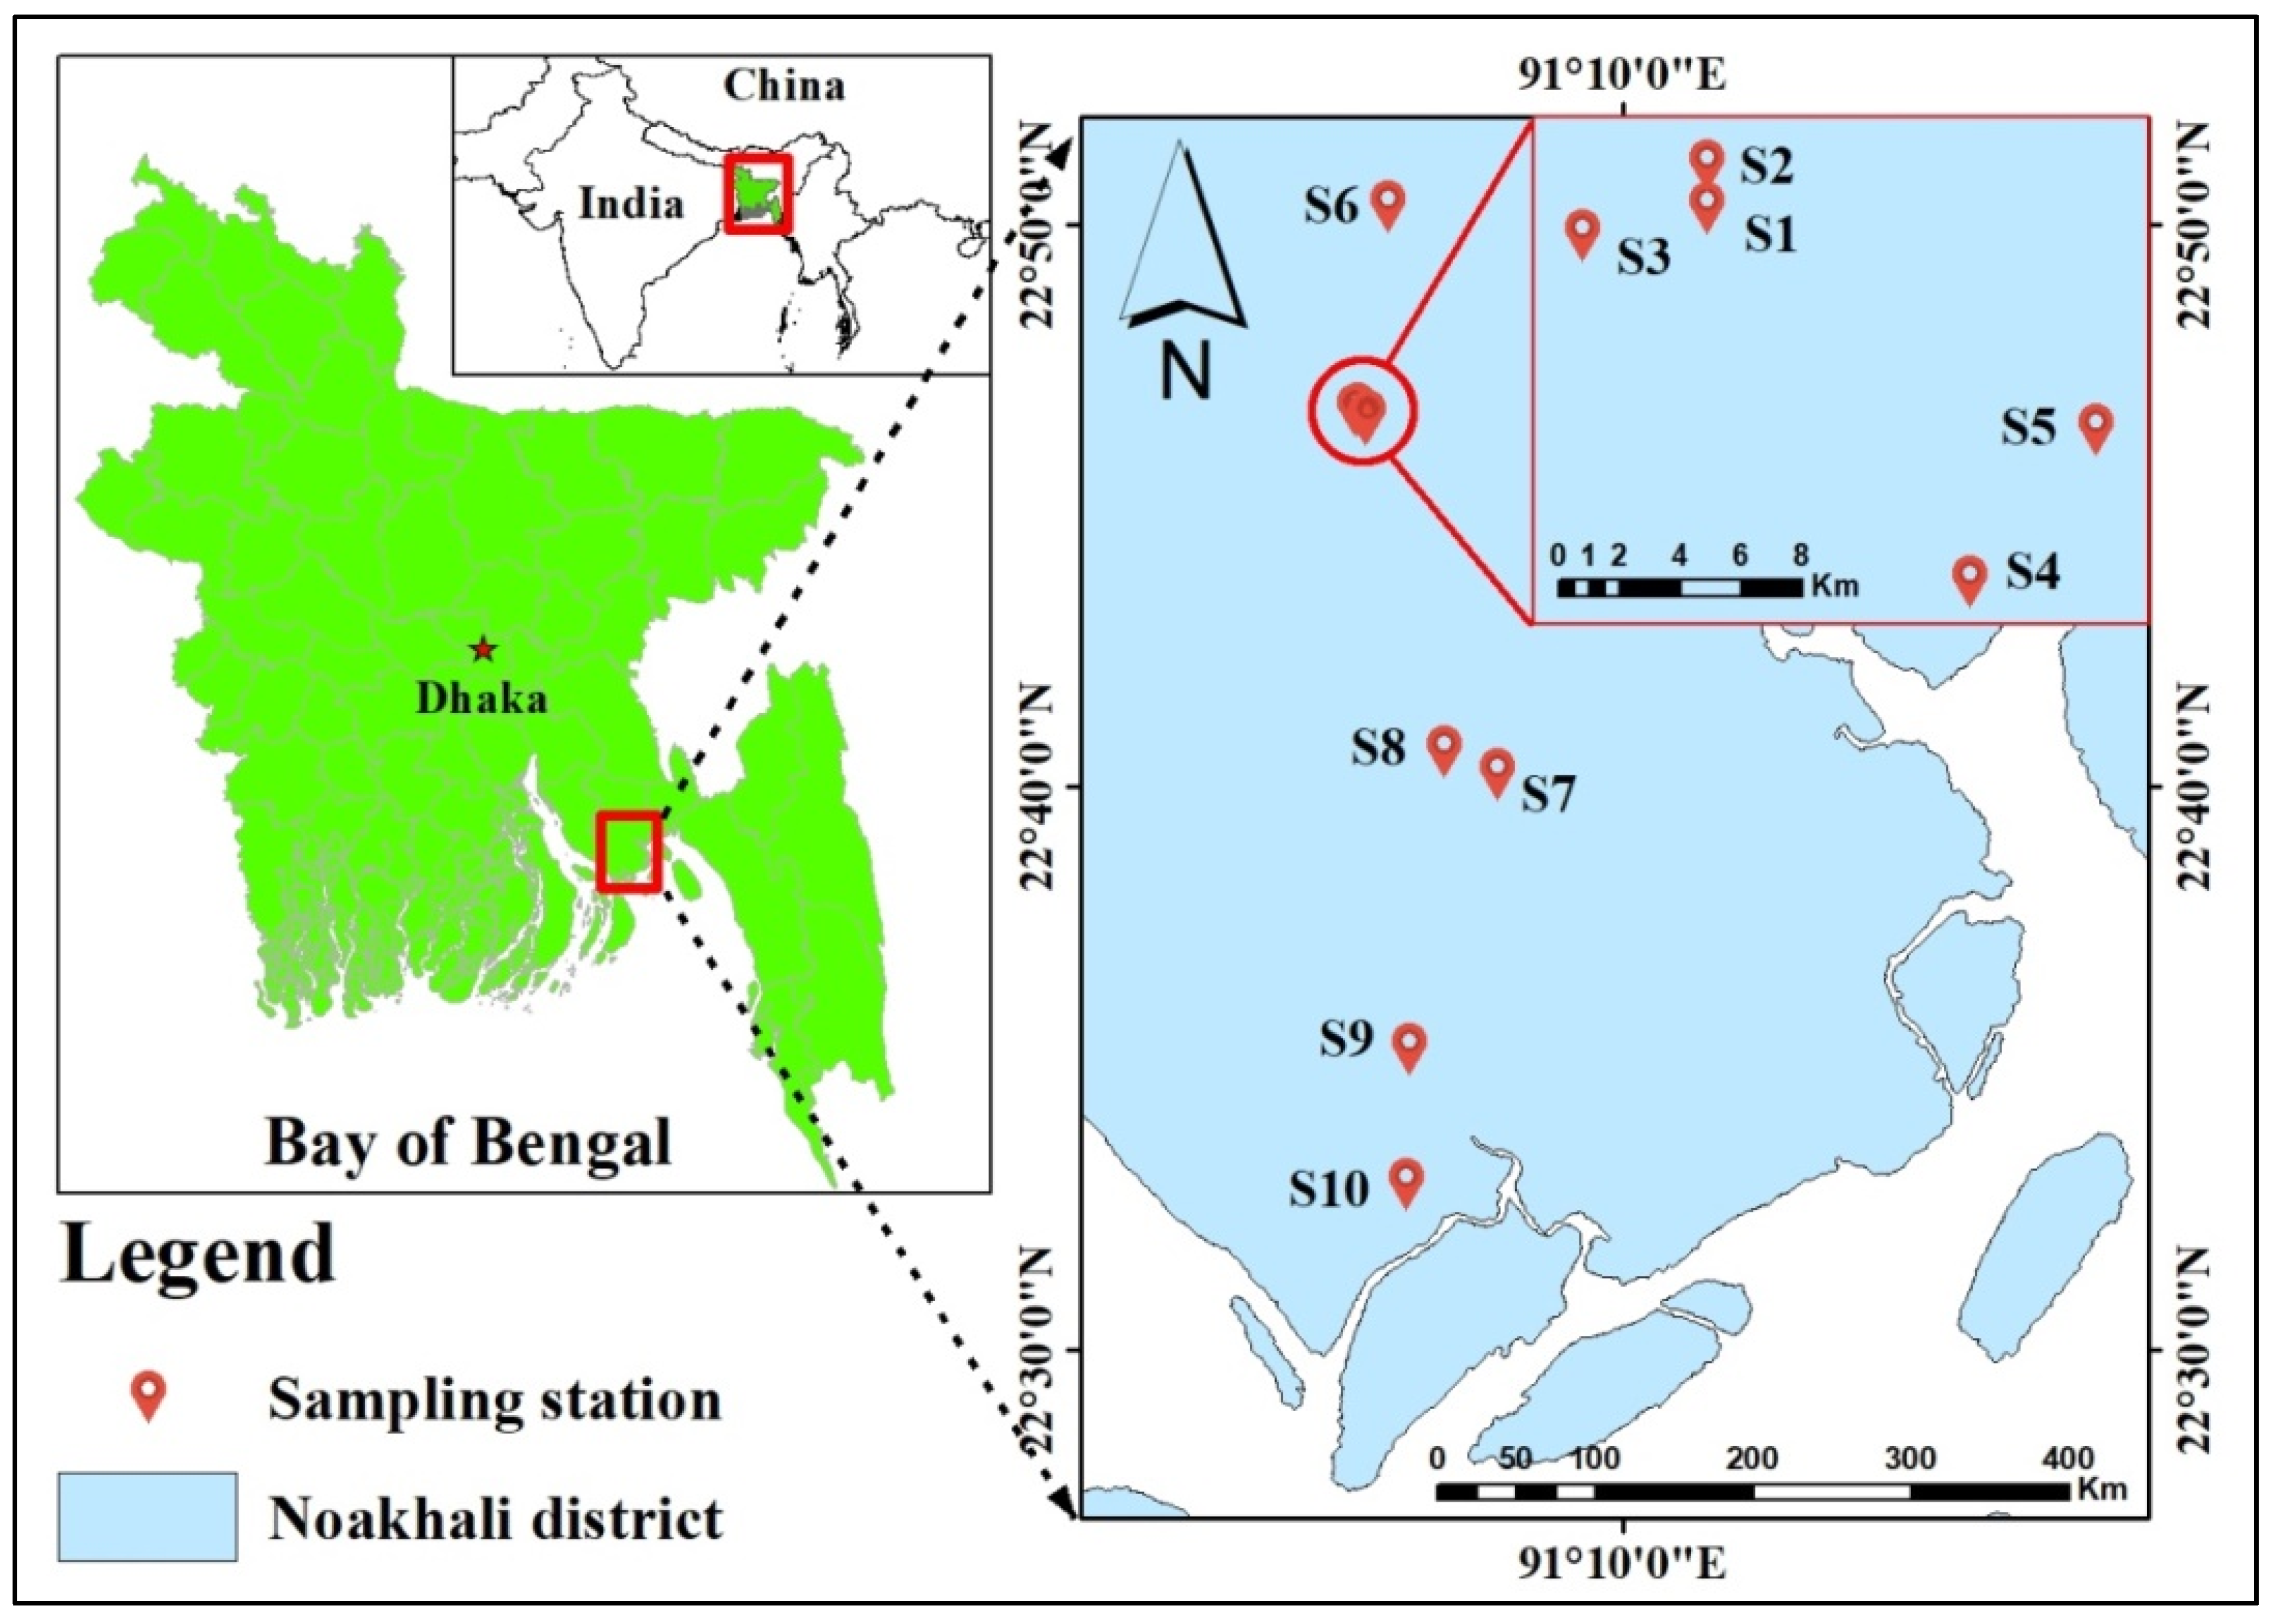
2.1. Study Area

Noakhali is a coastal district at the fringe of the Bay of Bengal, Bangladesh, located between latitudes 22°07′ and 23°08′ N and longitudes 90°53′ and 91°27′ E. It has a tropical climate. Summers have significantly more rainfall than winters. According to the Köppen–Geiger climate classification, this climate is classified as Aw. The average annual temperature in Noakhali is 25.2 °C. The annual precipitation is approximately 2218 mm. In this study, ten homestead ponds (S1–S10) from the study sites were chosen from three Upazilas of Noakhali (Figure 1). These homestead ponds (122–404 square meters in size) are typically seasonal, holding water for 5–6 months beginning in July and used for fish cultivation with extensive management. Three replicated samples were collected for the ecological parameters and the zooplankton communities of the homestead ponds, and their mean values were computed. Sampling was performed during December 2020 and February 2021 from 8:00 am to 11:00 am.

2.2. Study of Ecological Parameters

At every station, the water temperature profiles, pH, DO, and TDS were obtained by Hannah multi-parameters (Model: H198194) and water transparency by Secchi disc. Nitrates (NO3−) and phosphates (PO43−) were determined ex situ using a spectrophotometer (Model: DR 2700). About 250 mL of filtered water was collected, kept in a cooled icebox in the field, and preserved at the laboratory for nutrient analysis following the standard method [24].

2.3. Zooplankton Sample Collection, Identification, and Counting

A zooplankton net (90 µm mesh size) was set in the surface water and towed for 5 min. The volume of water filtered (V) was calculated by V = πr2h, where r = the radius of the net ring and h = the distance towed. After dragging, the concentrates were collected from the plankton net bucket to a plastic container and preserved with 5% formalin. The quantitative estimation of the zooplankton was performed using a Sedgewick-Rafter chamber. A 1-mL sample was poured on a S-R (Sedgwick-Rafter) cell from each sample. Then, we used a luminous stereoscopic microscope (model: XSZ21-05DN, Beijing, China) to identify the different species of the zooplankton. The zooplankton identification was carried out according to the methods described in the monographs, textbooks, and journal articles in [25,26,27,28,29]. The zooplankton densities were calculated as ind./L. The following formula [30] was used to count the zooplankton:
N = ( A × 1000 × C ) / ( V × F × L )
where N = number of plankton cell or units per liter of the original water; A = total number of plankton counted; C = volume of final concentrate of the samples in ml; F = number of fields counted, and L = volume of original water in liters.

2.4. Diversity Indices

The diversity of the zooplankton was expressed by the Shannon–Weiner Diversity Index (H’) [31], the Evenness Index (e) [32], the Margalef Species Richness Index (J) [33], and the Dominance Index (D) [34].

2.5. Statistical Analysis

The Kruskal–Wallis ANOVA test was used for the environmental and biological variables to calculate any significant differences among the studied ponds. The level of significance was set at p < 0.05. Pearson correlations were used to analyze the correlation between environmental variables, biological variables, and the diversity indices of the zooplankton. One-way analysis of similarity (ANOSIM) was used to accomplish the significance in the structure of the zooplankton assemblage based on the Bray–Curtis rank similarity matrix. Similarity percentage (SIMPER) analysis was used to examine the percentage contribution of each species to the average dissimilarity between the pair combination of stations and months and each station and month. Cluster analysis was performed to confirm the similarity among the sites in terms of zooplankton occurrence. Finally, canonical correspondence analysis (CCA) was applied to explore the distribution of the zooplankton communities with the environmental parameters and sampling sites. The computer package Excel 2010, PAST [35], was used for statistical analysis.

3. Results

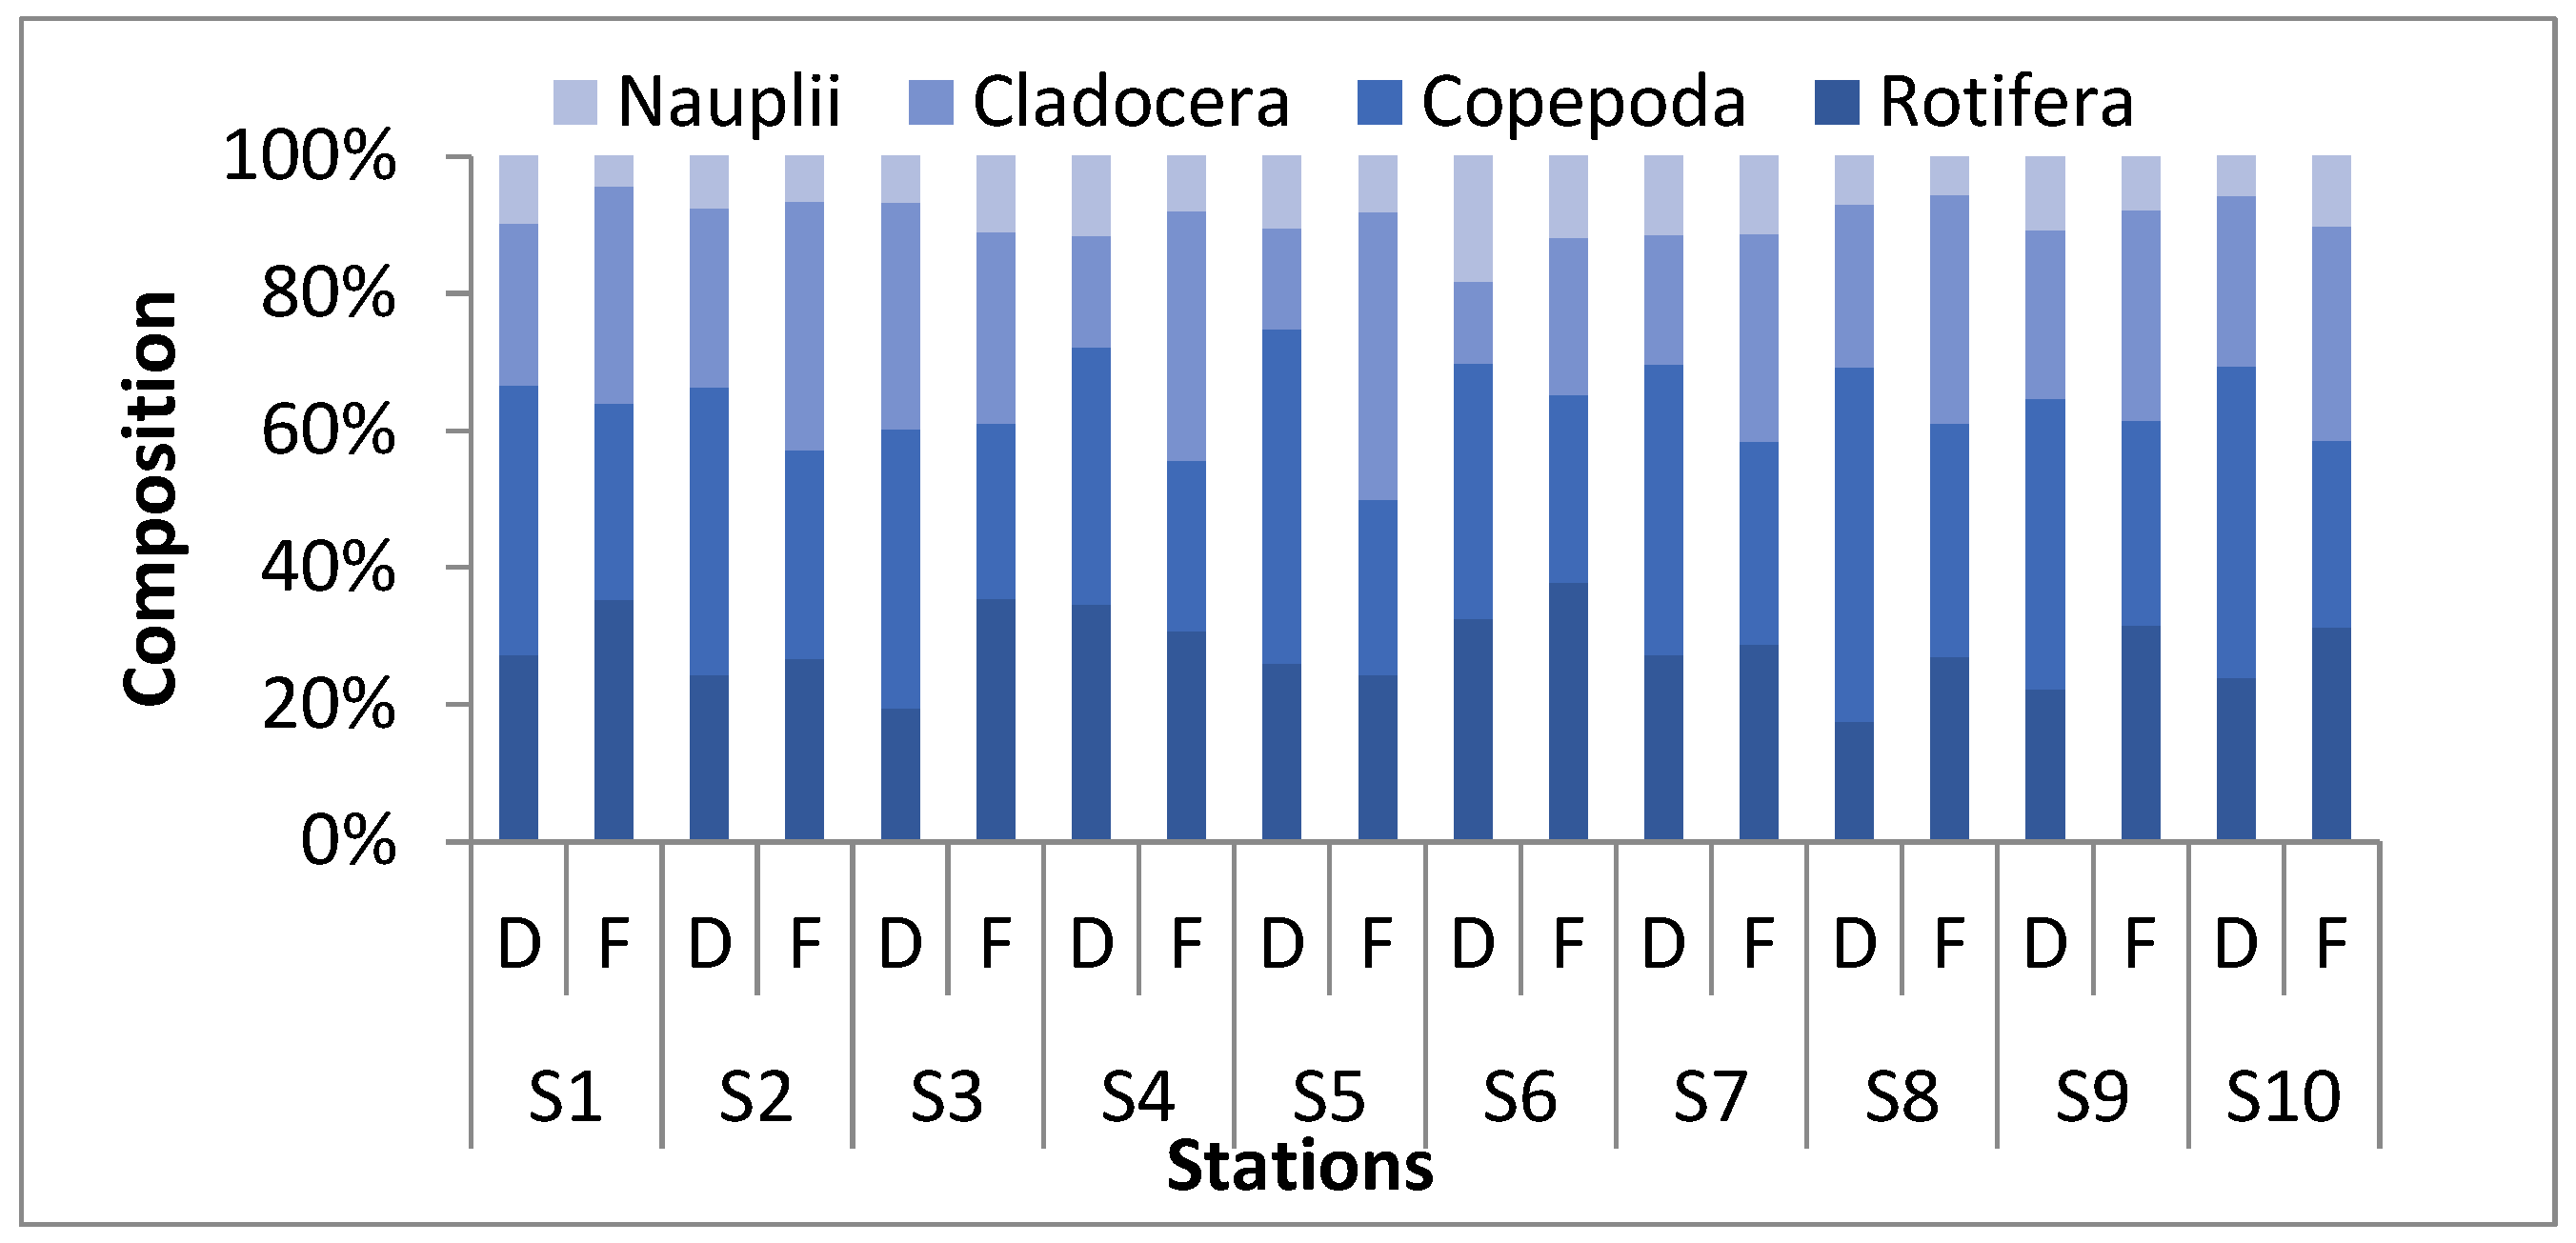
3.1. Zooplankton Community

A total of 16 species of zooplankton, including four groups, namely, Rotifera (seven species), Copepoda (five species), Cladocera (three species), and nauplii (one species), were identified during the study period (Table 1). Out of the 16 species recorded, 14 occurred in December, of which 7 were dominant; 14 occurred in February, of which 10 were dominant; and 12 were common in both months, of which 7 were dominant. The seven dominant species that occurred in both months were Brachionus rubens, Cyclops nanus, Cyclops sp., Diaptomus sp., Diaphanosoma sarsi, Bosmina sp., and nauplii. The composition of the recorded zooplankton groups at different stations during this study period is summarized in Figure 2. The zooplankton community was dominated by Copepoda (35.58%) followed by Rotifera (27.78%), Cladocera (27.37%), and nauplii (9.28%), respectively. The zooplankton groups of Copepoda and nauplii were found at their maximum levels during December (42.74% and 10.01%), while the Rotifera and Cladocera were found at their maximum levels during February (30.04% and 33.01%) in the present study.

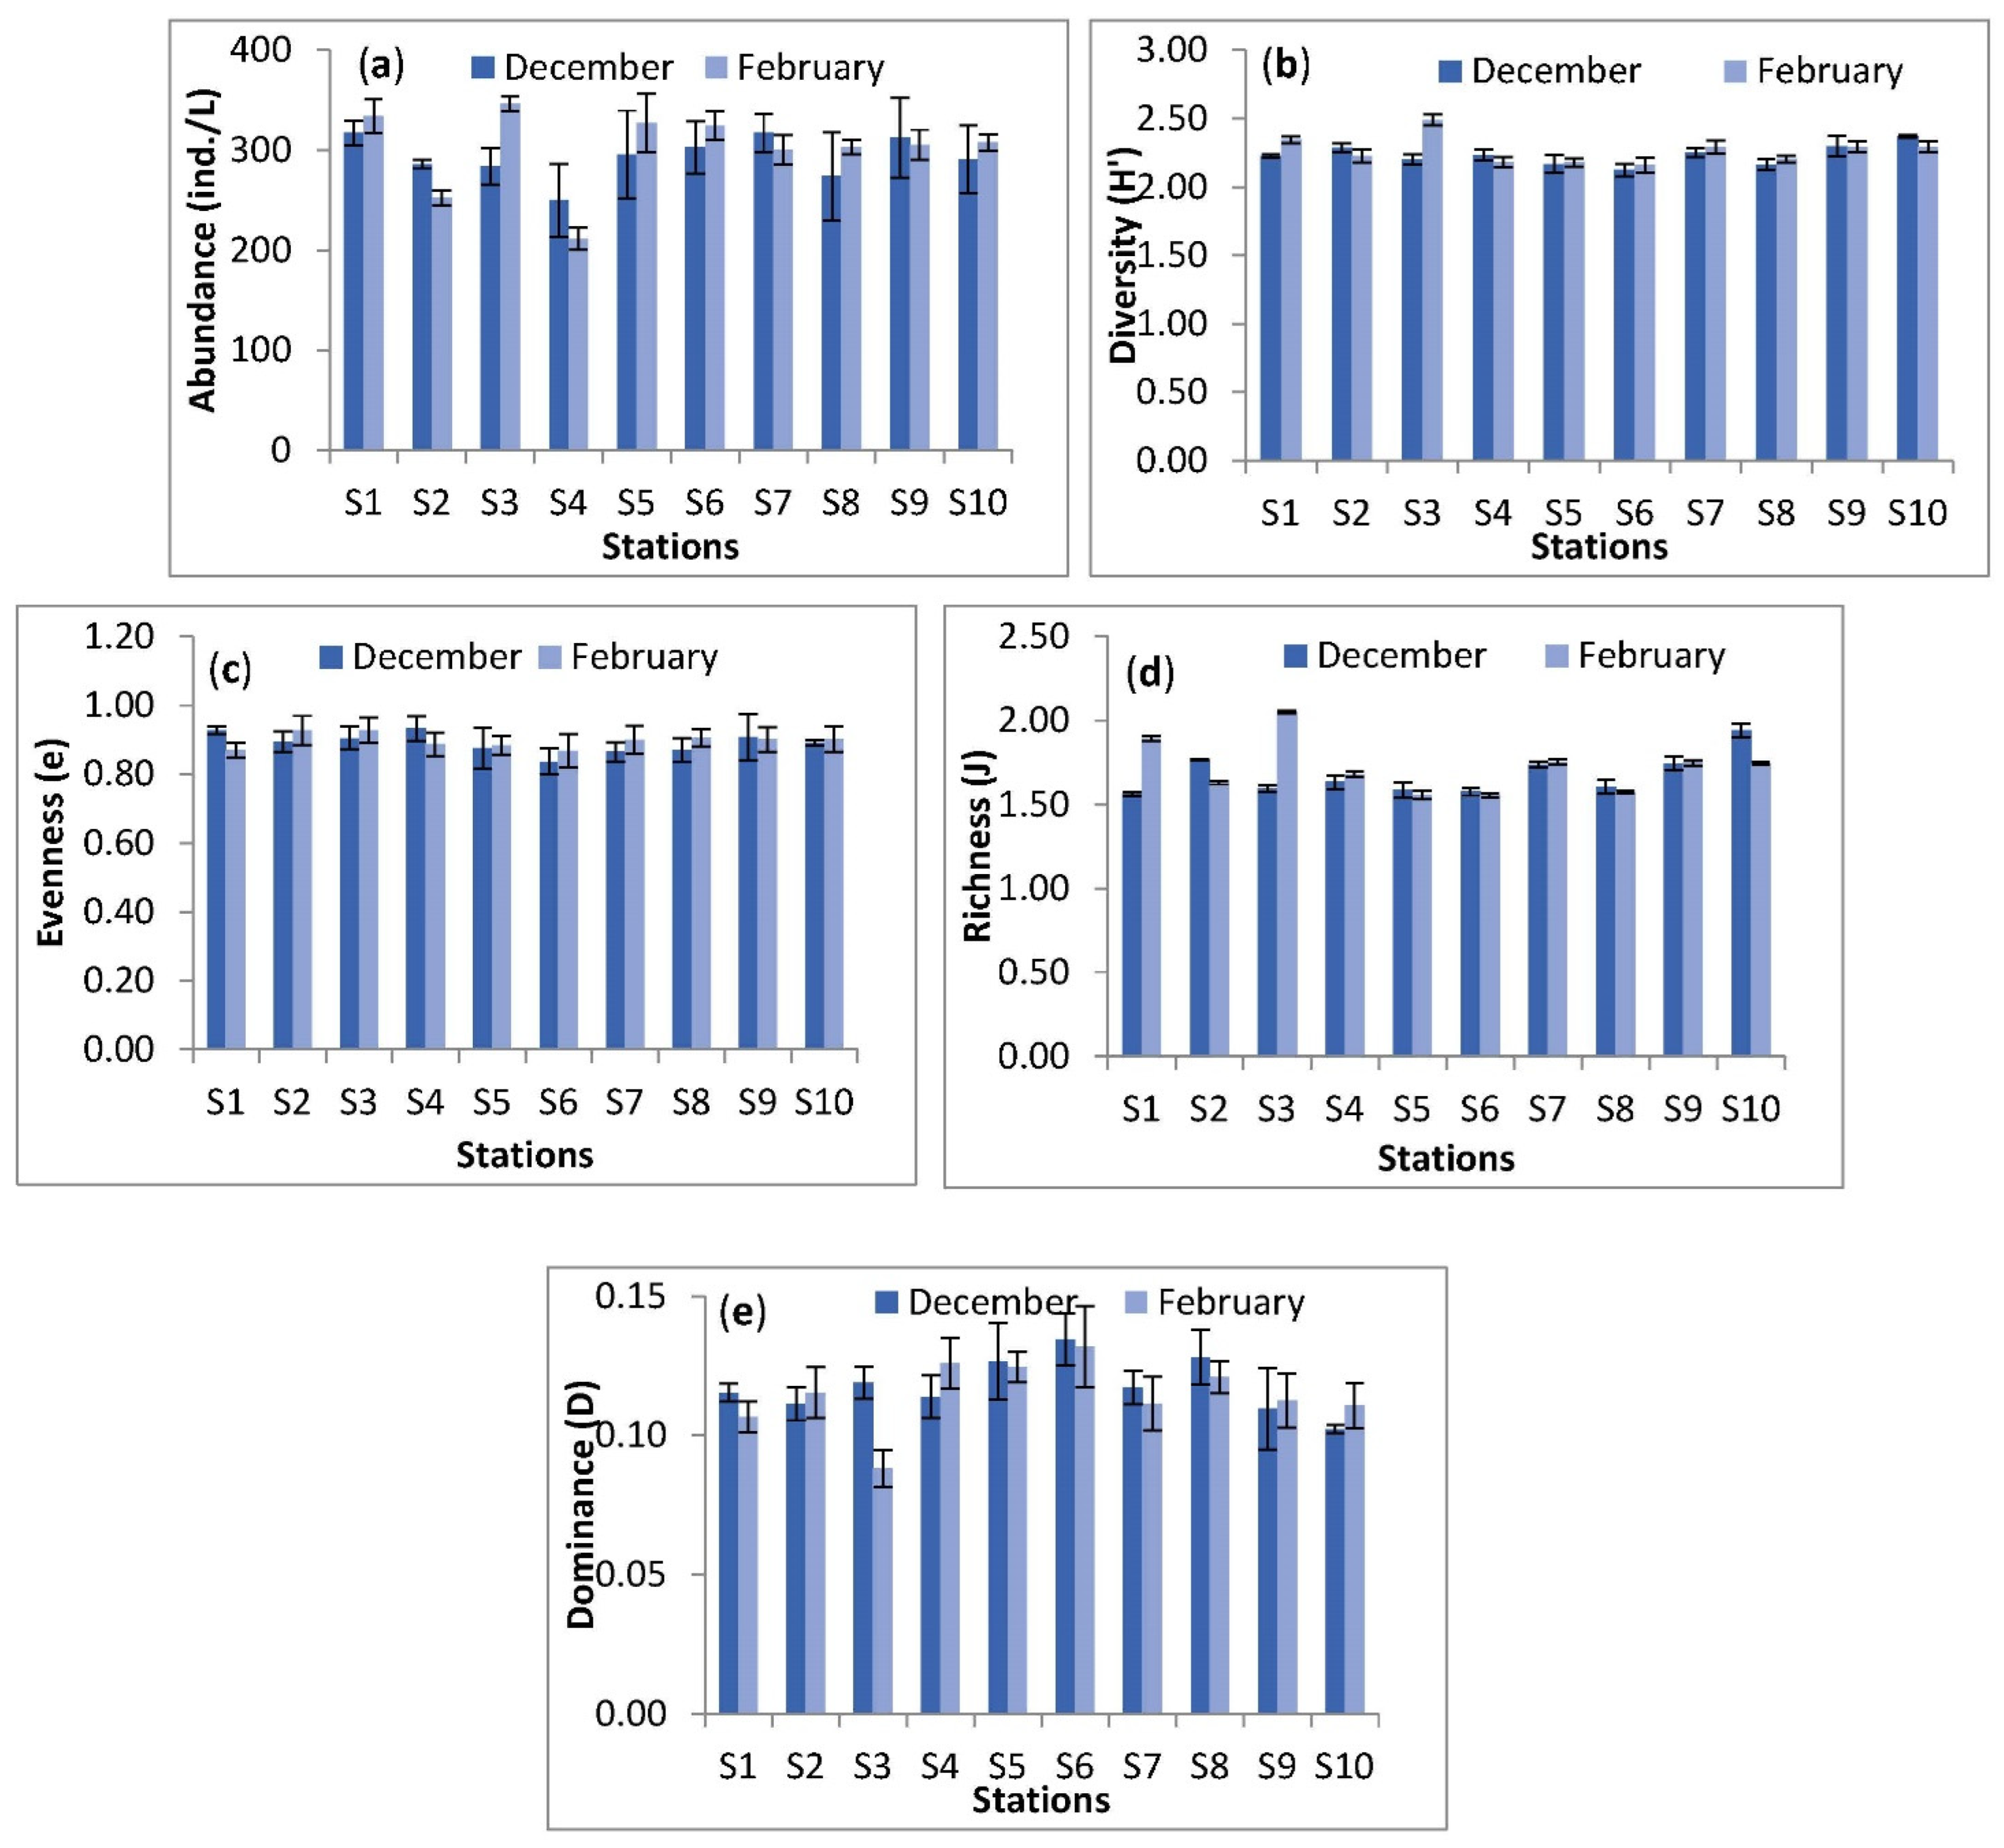
3.2. Zooplankton Abundance and Diversity

The abundance of the zooplankton in the homestead ponds along with the studied diversity indices, namely the Shannon–Weiner Diversity Index (H’), the Evenness Index (e), the Margalef Species Richness Index (J), and the Dominance Index (D) are illustrated in Figure 3. The highest abundance of zooplankton was 317.3 ± 12.5 ind./L at S1, and the lowest was 249.98 ± 36.30 ind./L at S4 with a mean value of 293.02 ± 21.13 ind./L in December. The highest abundance of zooplankton was 346.14 ± 7.22 ind./L at S3, and the lowest was 211.52 ± 11.01 ind./L at S4 with a mean value of 301.19 ± 40.55 ind./L in February. A significant difference between the stations was observed in the total zooplankton abundance in February (H = 19.28, p = 0.02). However, no significant differences between the stations were observed in the total zooplankton abundance in December (H = 11.3, p = 0.25) and between months (H = 1.851, p = 0.17).
The Shannon–Wiener Diversity Index (H) varied from 2.37 ± 0.01 at S10 to 2.12 ± 0.05 at S6 with a mean value of 2.23 ± 0.04 in December and from 2.49 ± 0.04 at S3 to 2.16 ± 0.06 at S6 with a mean value of 2.27 ± 0.04 in February. Significant and highly significant differences between the stations were observed in the Shannon–Wiener Diversity Index (H′) during December (H = 21.63, p = 0.01) and February (H = 24.68, p = 0.003), respectively. However, no significant difference was observed in the Shannon–Wiener Diversity Index (H′) between months (H = 0.32, p = 0.57).
The highest species Evenness Index (e) was 0.93 ± 0.04 at S4, and the lowest was 0.84 ± 0.04 at S6 in December with a mean value of 0.89 ± 0.03; the highest was 0.93 ± 0.04 at S2 and S3, and the lowest was 0.87 ± 0.01 at S1 with a mean value of 0.90 ± 0.03 in February. Highly significant differences between the stations were found in the species Evenness Index (e) during February (H = 27.76, p = 0.001). However, no significant differences were found in the species Evenness Index (e) in December (H = 12.43, p = 0.19) or between months (H = 0.24, p = 0.62).
The Margalef Species Richness Index (J) ranged between 1.94 ± 0.04 at S10 and 1.56 ± 0.01 at S1 with a mean value of 1.67 ± 0.03 in December and varied from 2.05 ± 0.01 at S3 to 1.56 ± 0.02 at S6 with a mean value of 1.72 ± 0.01 in February. Highly significant differences between the stations were observed in the Margalef Species Richness Index (J) in December (H = 24.49, p = 0.003) and February (H = 27.76, p = 0.001). Significant differences were not observed in the Margalef Species Richness Index (J) between months (H = 0.28, p = 0.57).
The Dominance Index (D) ranged from 0.13 ± 0.01 at S5, S6 and S8 to 0.10 ± 0.001 at S10 during December with a mean value of0.12 ± 0.01 and varied from 0.13 ± 0.01 at S6 to 0.09 ± 0.01 at S3 during February with a mean value of 0.11 ± 0.01. Significant differences between the stations were not observed in Dominance Index (D) in December (H = 16.4, p = 0.06), February (H = 19.8, p = 0.19) or between months (H = 0.24, p = 0.61).

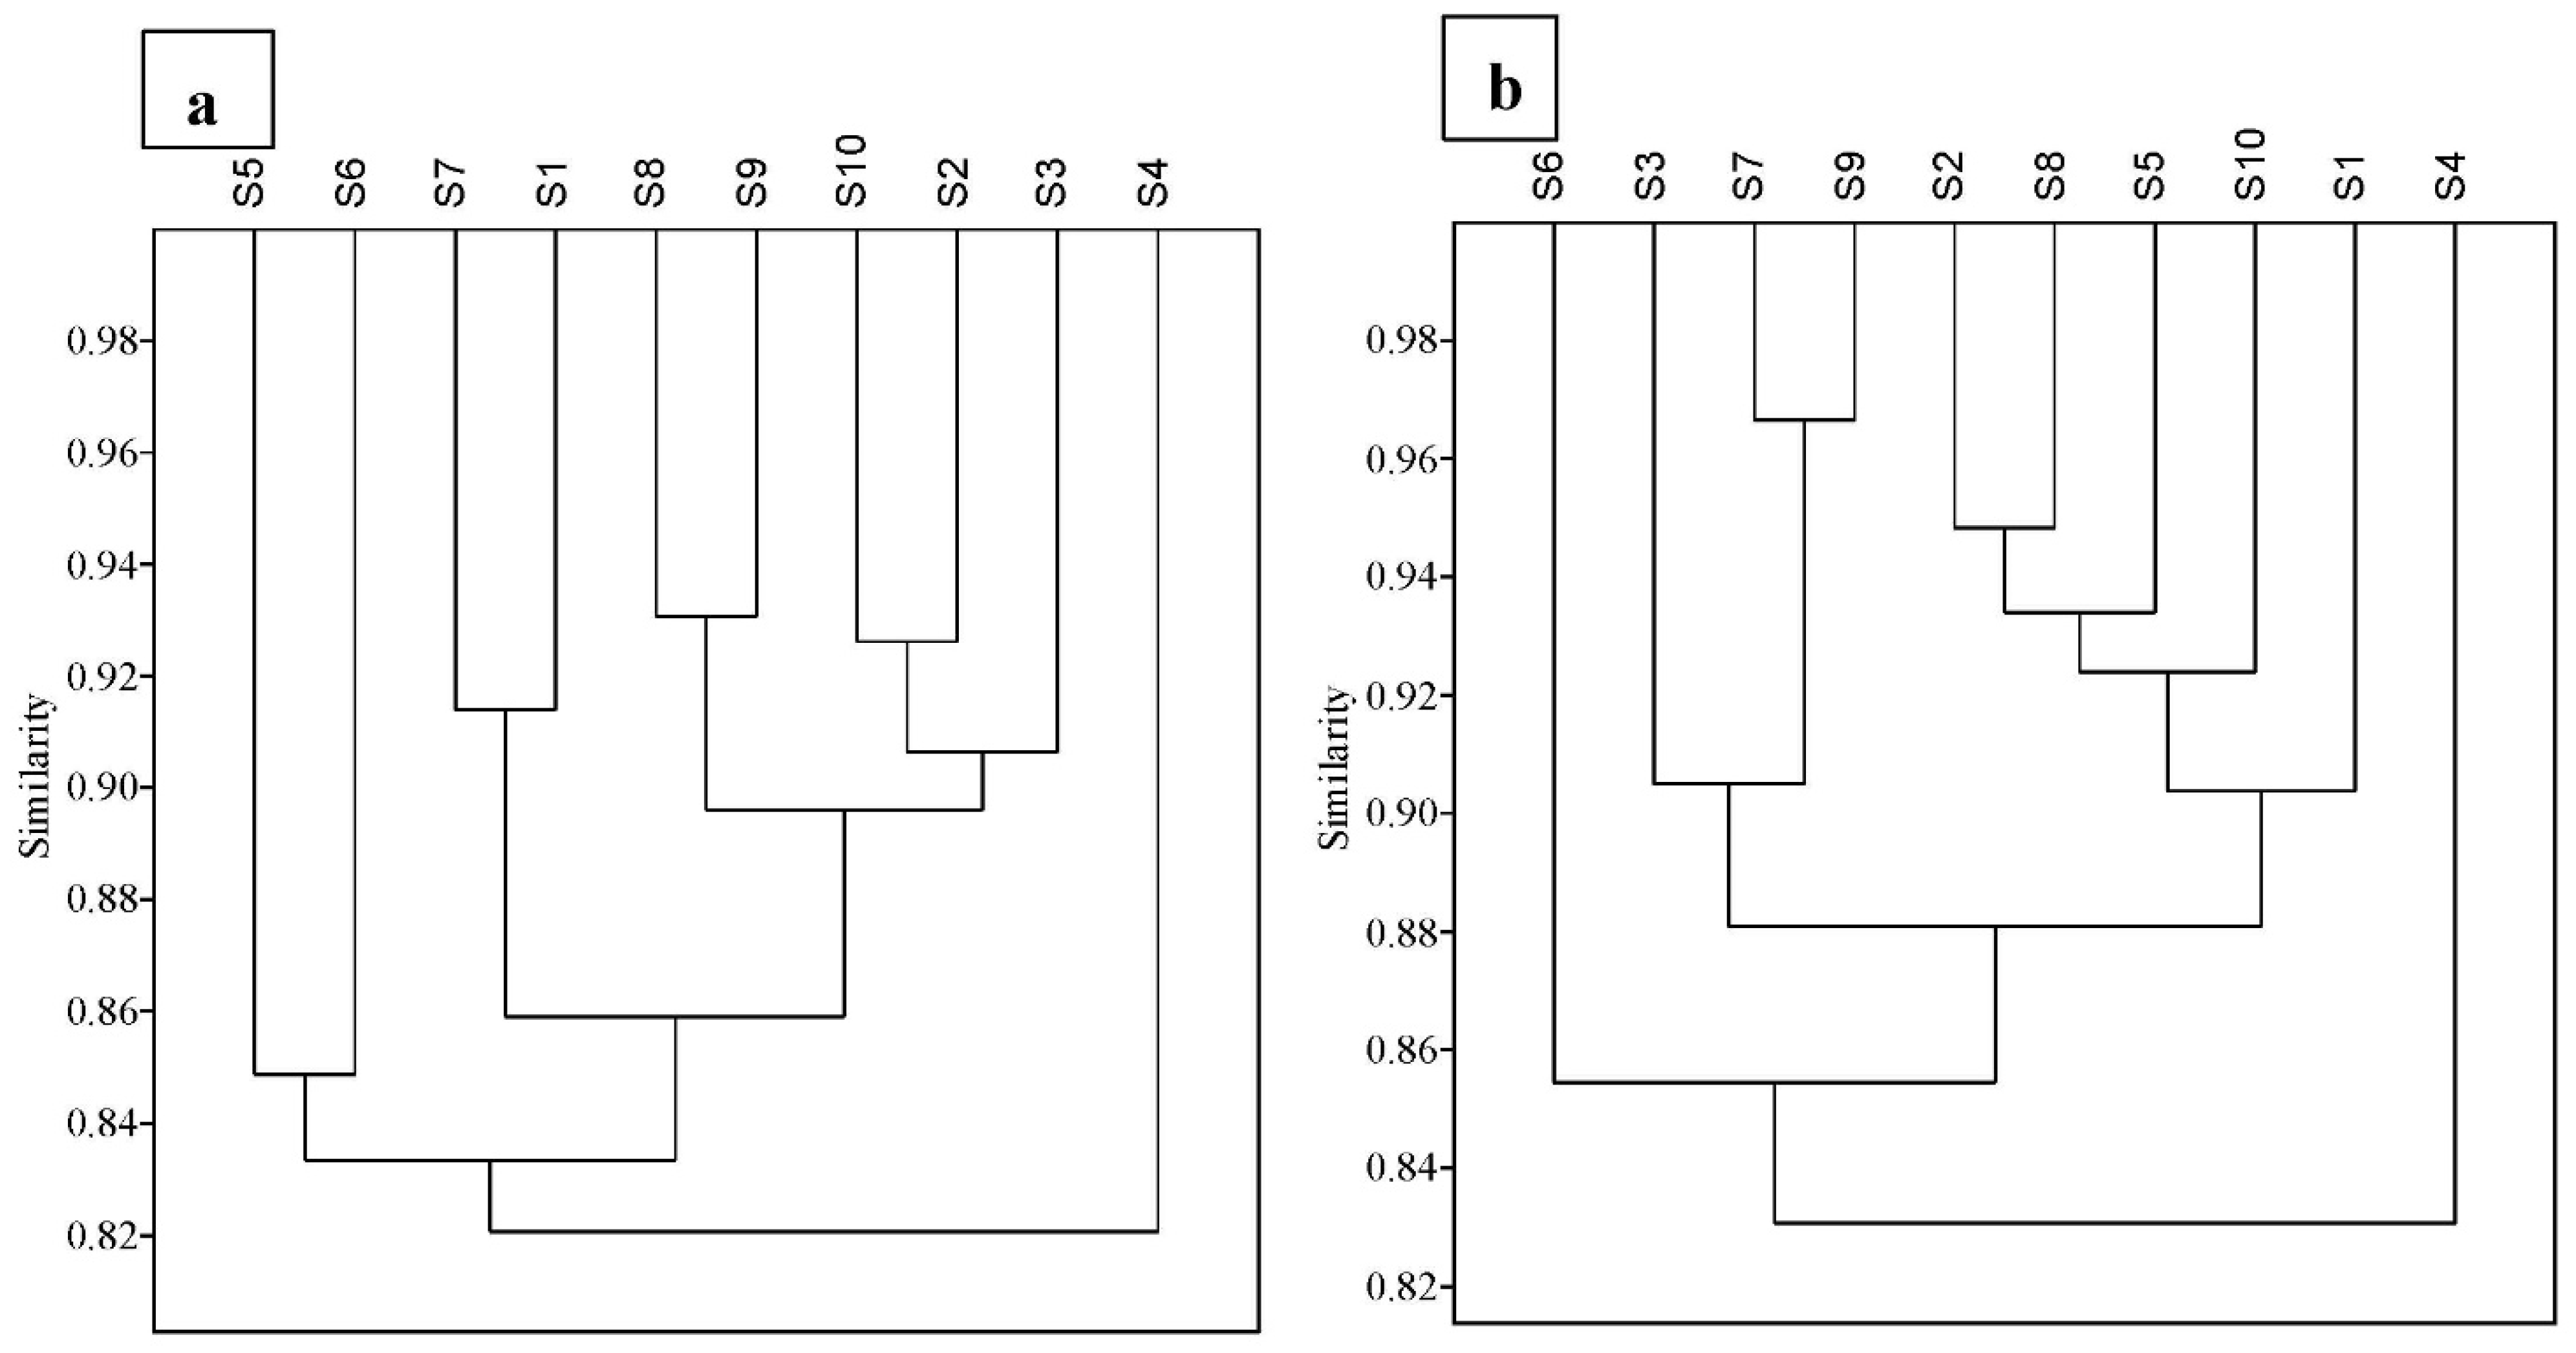
3.3. Zooplankton Assemblage

The analysis of similarity (ANOSIM) revealed significant (p < 0.05) dissimilation of the zooplankton among the different stations (Global R = 0.926; p = 0.0001). However, no significant differences (p > 0.05) were found between pairs of stations (Supplementary Table S1) or between seasons (Global R = 0.03; p = 0.015). The zooplankton assemblage was highly diverse at each station, and the dominant genus varied from station to station. According to the similarity percentage (SIMPER) analysis, zooplankton species such as Cyclops nanus, Brachionus sp., Keratella cochlearis, Mesocyclops leuckarti, nauplii, Brachionus calyciflorus, Diaptomus gracilis, Diaphanosoma sarsi, Brachionus quadridentatus, and Brachionus rubens were significant contributors (>10%) to the dissimilarity of the zooplankton community structure in different stations (Supplementary Table S2). According to the SIMPER results, a highly diverse zooplankton assemblage was observed in both months, and Diaptomus gracilis and Brachionus calyciflorus were significant contributors (>10%) to the zooplankton community structure in different months (Supplementary Table S2).
In order to reveal the similarities and differences among the homestead ponds, cluster analysis was performed based on the total abundance of the zooplankton community. Cluster analysis (CA) was carried out using the square root and Bray–Curtis similarity to show the similarity among the sites in terms of zooplankton occurrence (Figure 4). During December, five major clusters were obtained with a similarity of 88% (Figure 4a), of which three stations remained isolated (S4, S5, and S6) and two stations were contained in one cluster (S1 and S7); the remaining five stations were contained in one cluster. During February, three major clusters were obtained with a similarity of 88% (Figure 4b), of which two stations remained isolated (S4, S6) and the remaining stations were contained in one cluster.

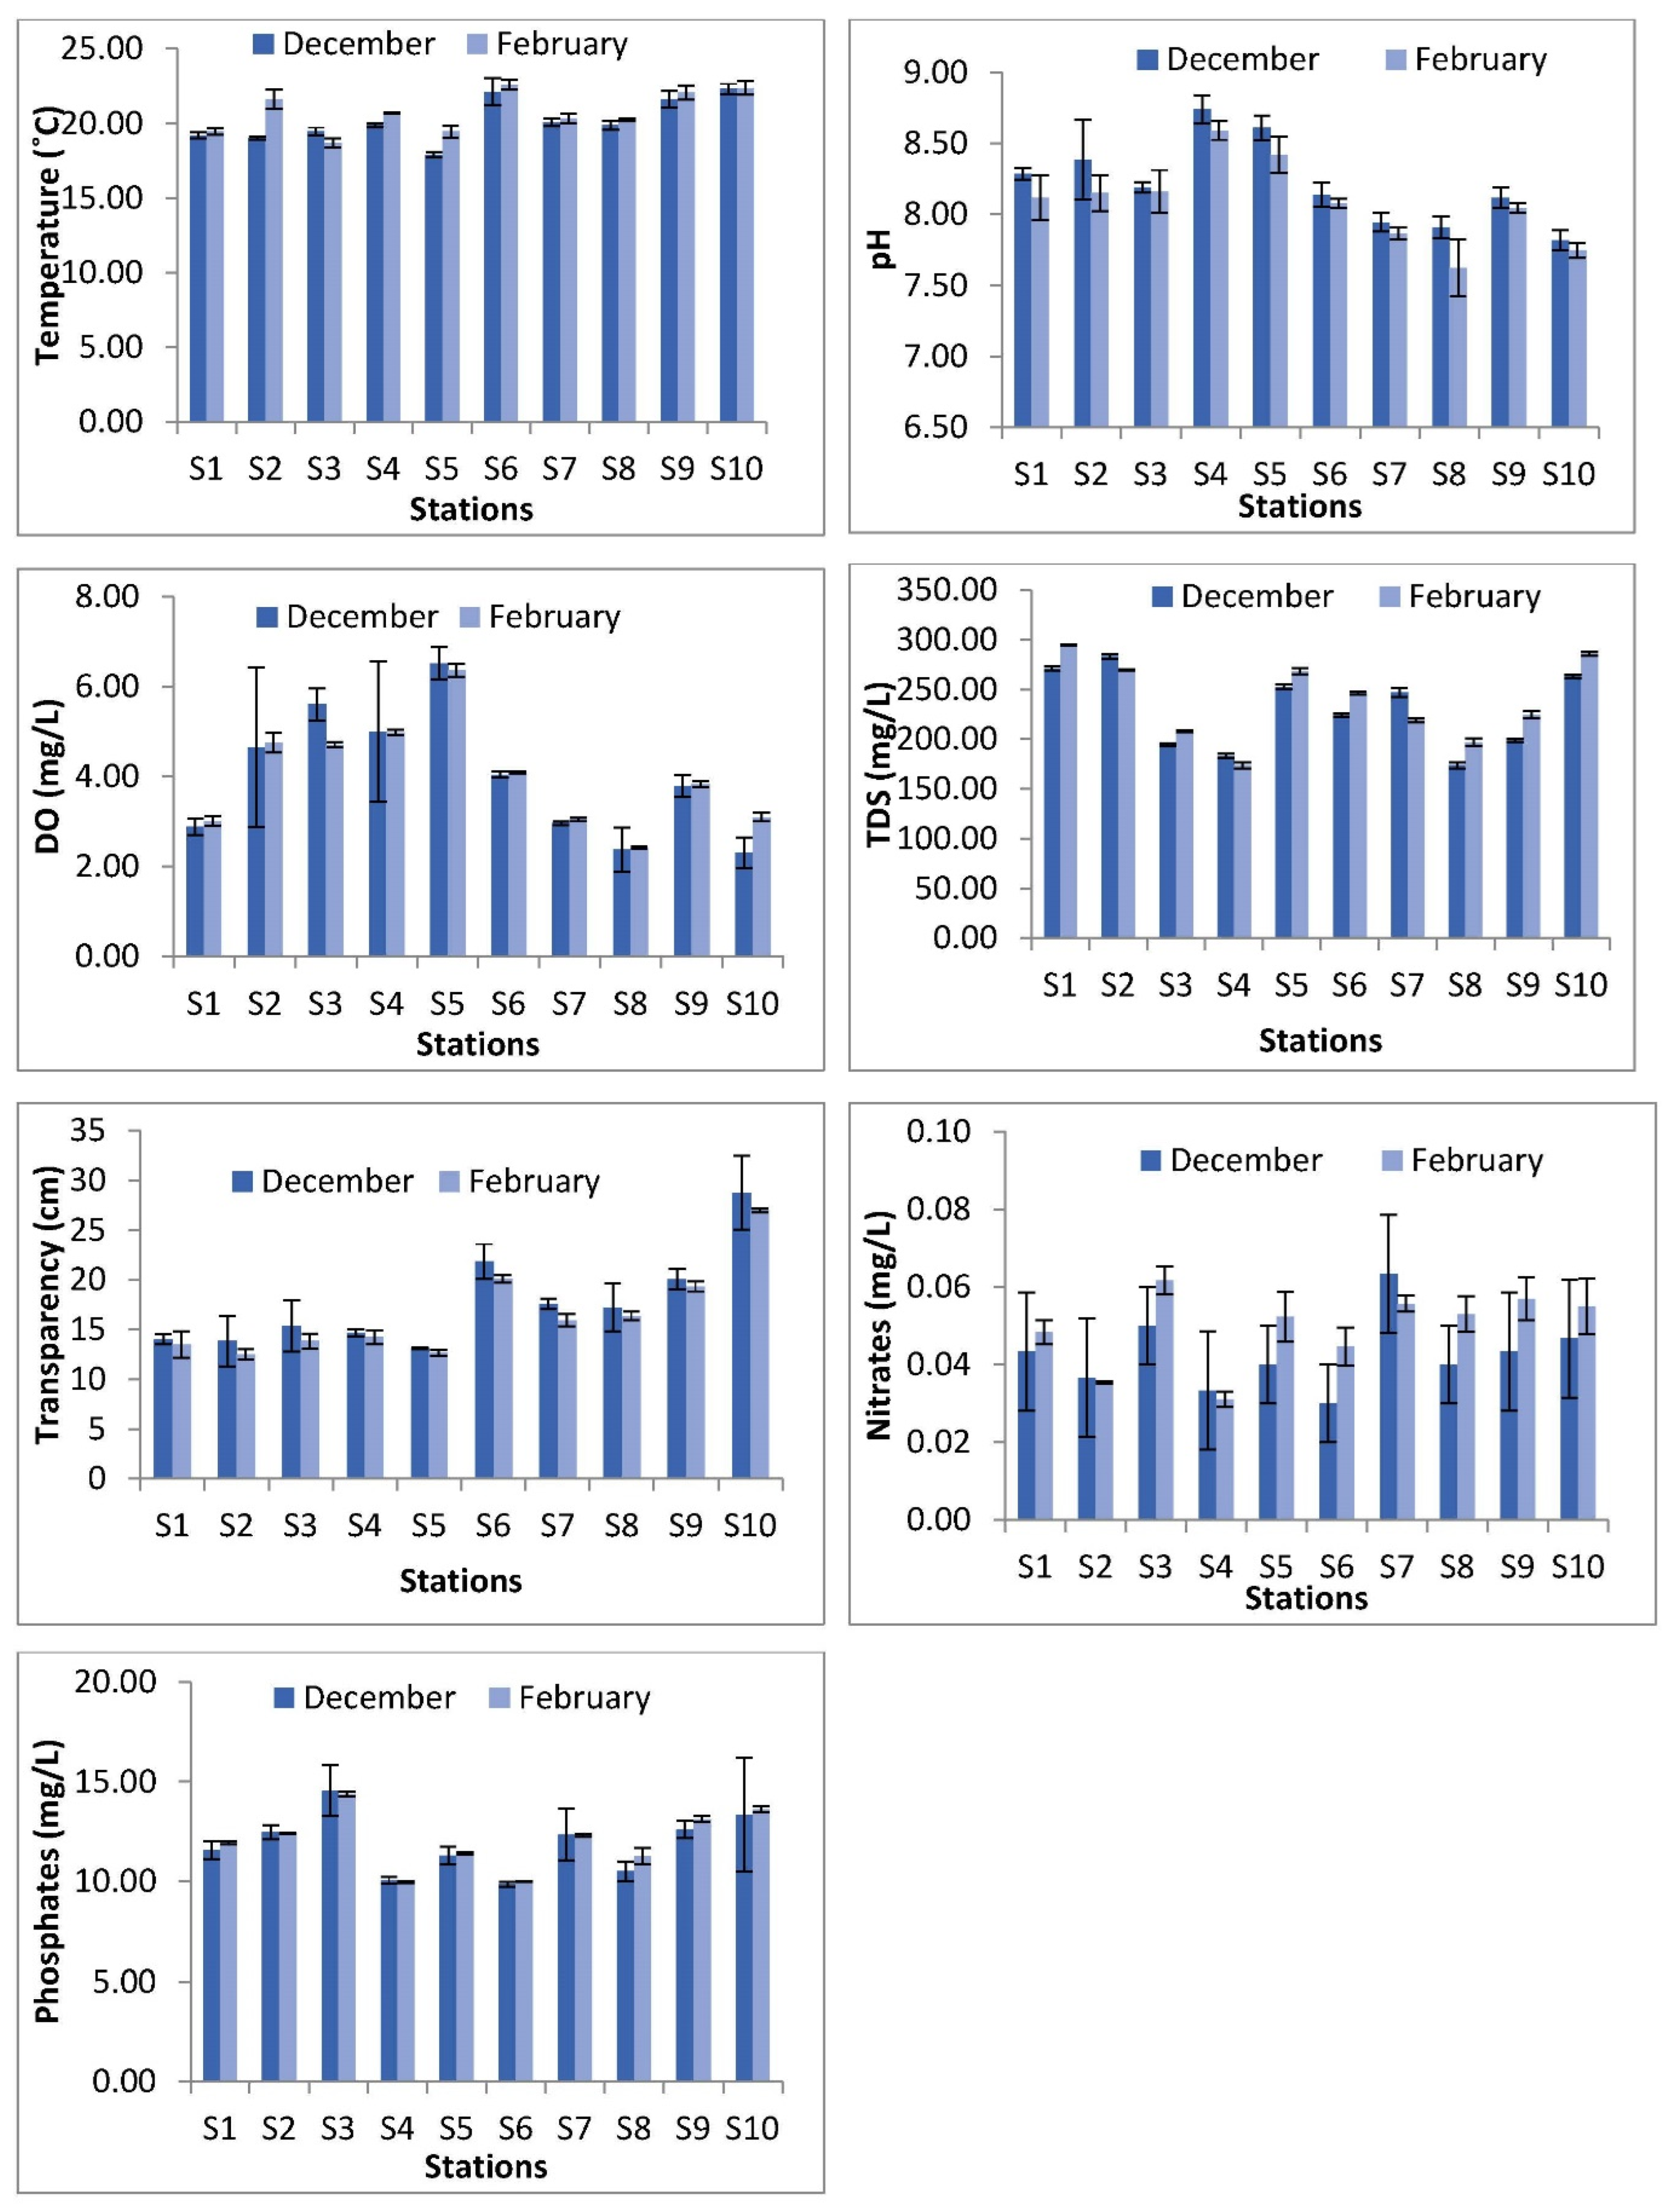
3.4. Ecological Parameters

The recorded ecological parameters of the homestead ponds in Noakhali are illustrated in Figure 5. The water temperature ranged from 22.30 ± 0.35 °C at S10 to 19.00 ± 0.11 °C at S2 during December (mean = 20.14 ± 0.32 °C) and from 22.58 ± 0.34 °C at S6 to 18.68 ± 0.32 °C at S3 during February (mean = 20.76 ± 0.33 °C). Highly significant differences in the temperature of the stations were found during December (H = 27.36, p = 0.002) and February (H = 27.26, p = 0.001). However, no significant differences in the temperature of the stations were found between months (H = 1.29, p = 0.26).
The pH values ranged from 8.74 ± 0.10 at S4 to 7.82 ± 0.07 at S10 in December (mean = 8.21 ± 0.09) and from 8.59 ± 0.07 at S4 to 7.62 ± 0.20 at S8 in February (mean = 8.08 ± 0.10). Highly significant differences in pH of the stations were observed during December (H = 25.75, p = 0.002) and February (H = 25.26, p = 0.003). However, no significant differences in pH were found between months (H = 0.97, p = 0.32).
The dissolved oxygen (DO) concentration varied from 6.52 ± 0.36 mg/L at S5 to 2.30 ± 0.35 mg/L at S10 in December (mean = 4.01 ± 0.54 mg/L) and from 6.36 ± 0.14 mg/L at S5 to 3.01 ± 0.11 mg/L at S1 in February (mean = 4.03 ± 0.08 mg/L). Highly significant differences in the DO of the stations were found during December (H = 25.75, p = 0.002) and February (H = 27.95, p = 0.001). However, no significant differences in the DO were found between months (H = 0.14, p = 0.71).
The total dissolved solid (TDS) concentration ranged from 283.33 ± 2.52 mg/L at S2 to 173.67 ± 3.06 mg/L at S8 in December (mean = 229.10 ± 2.33 mg/L) and from 294.67 ± 0.58 mg/L at S1 to 173.67 ± 3.06 mg/L at S4 in February (mean = 238.73 ± 2.09 mg/L). Highly significant differences in the TDS of the stations were found during December (H = 28.67, p = 0.001) and February (H = 28.54, p = 0.001). However, no significant differences in the TDS of the stations were found between months (H = 0.32, p = 0.57).
The transparency ranged from 28.75 ± 3.73 cm at S10 to 13.10 ± 0.10 cm at S5 in December (mean = 17.64 ± 1.55 cm) and from 26.97 ± 0.21 cm at S10 to 12.5 ± 0.50 cm at S2 in February (mean = 16.54 ± 0.57 cm). Highly significant differences in the transparency of the stations were found during December (H = 26.6, p = 0.003) and February (H = 26.96, p = 0.001). However, no significant differences in the in transparency of the stations were found between months (H = 0.69, p = 0.41).
Nitrates varied from 0.06 ± 0.02 mg/L at S7 to 0.03 ± 0.01 mg/L at S6 and S8 in December (mean = 0.04 ± 0.01 mg/L) and from 0.06 ± 0.01 mg/L at S3 to 0.03 ± 0.002 mg/L at S4 in February (mean = 0.05 ± 0.004 mg/L). Highly significant differences in the nitrates of the stations were found during February (H = 22.96, p = 0.006). Significant differences in the nitrates of the stations were not observed in December (H = 9.74, p = 0.34) or between months (H = 2.77, p = 0.10).
The phosphate concentrations varied from 14.55 ± 1.27 mg/L at S3 to 9.85 ± 0.13 mg/L at S6 in December (mean = 11.86 ± 0.79 mg/L) and from 13.62 ± 0.15 mg/L at S5 to 9.95 ± 0.05 mg/L at S4 in February (mean = 12.04 ± 0.11 mg/L). Highly significant differences in the phosphates of the stations were found during December (H = 26.16, p = 0.003) and February (H = 28.47, p = 0.001). However, no significant differences in the phosphates were found between months (H = 0.006, p = 0.94).

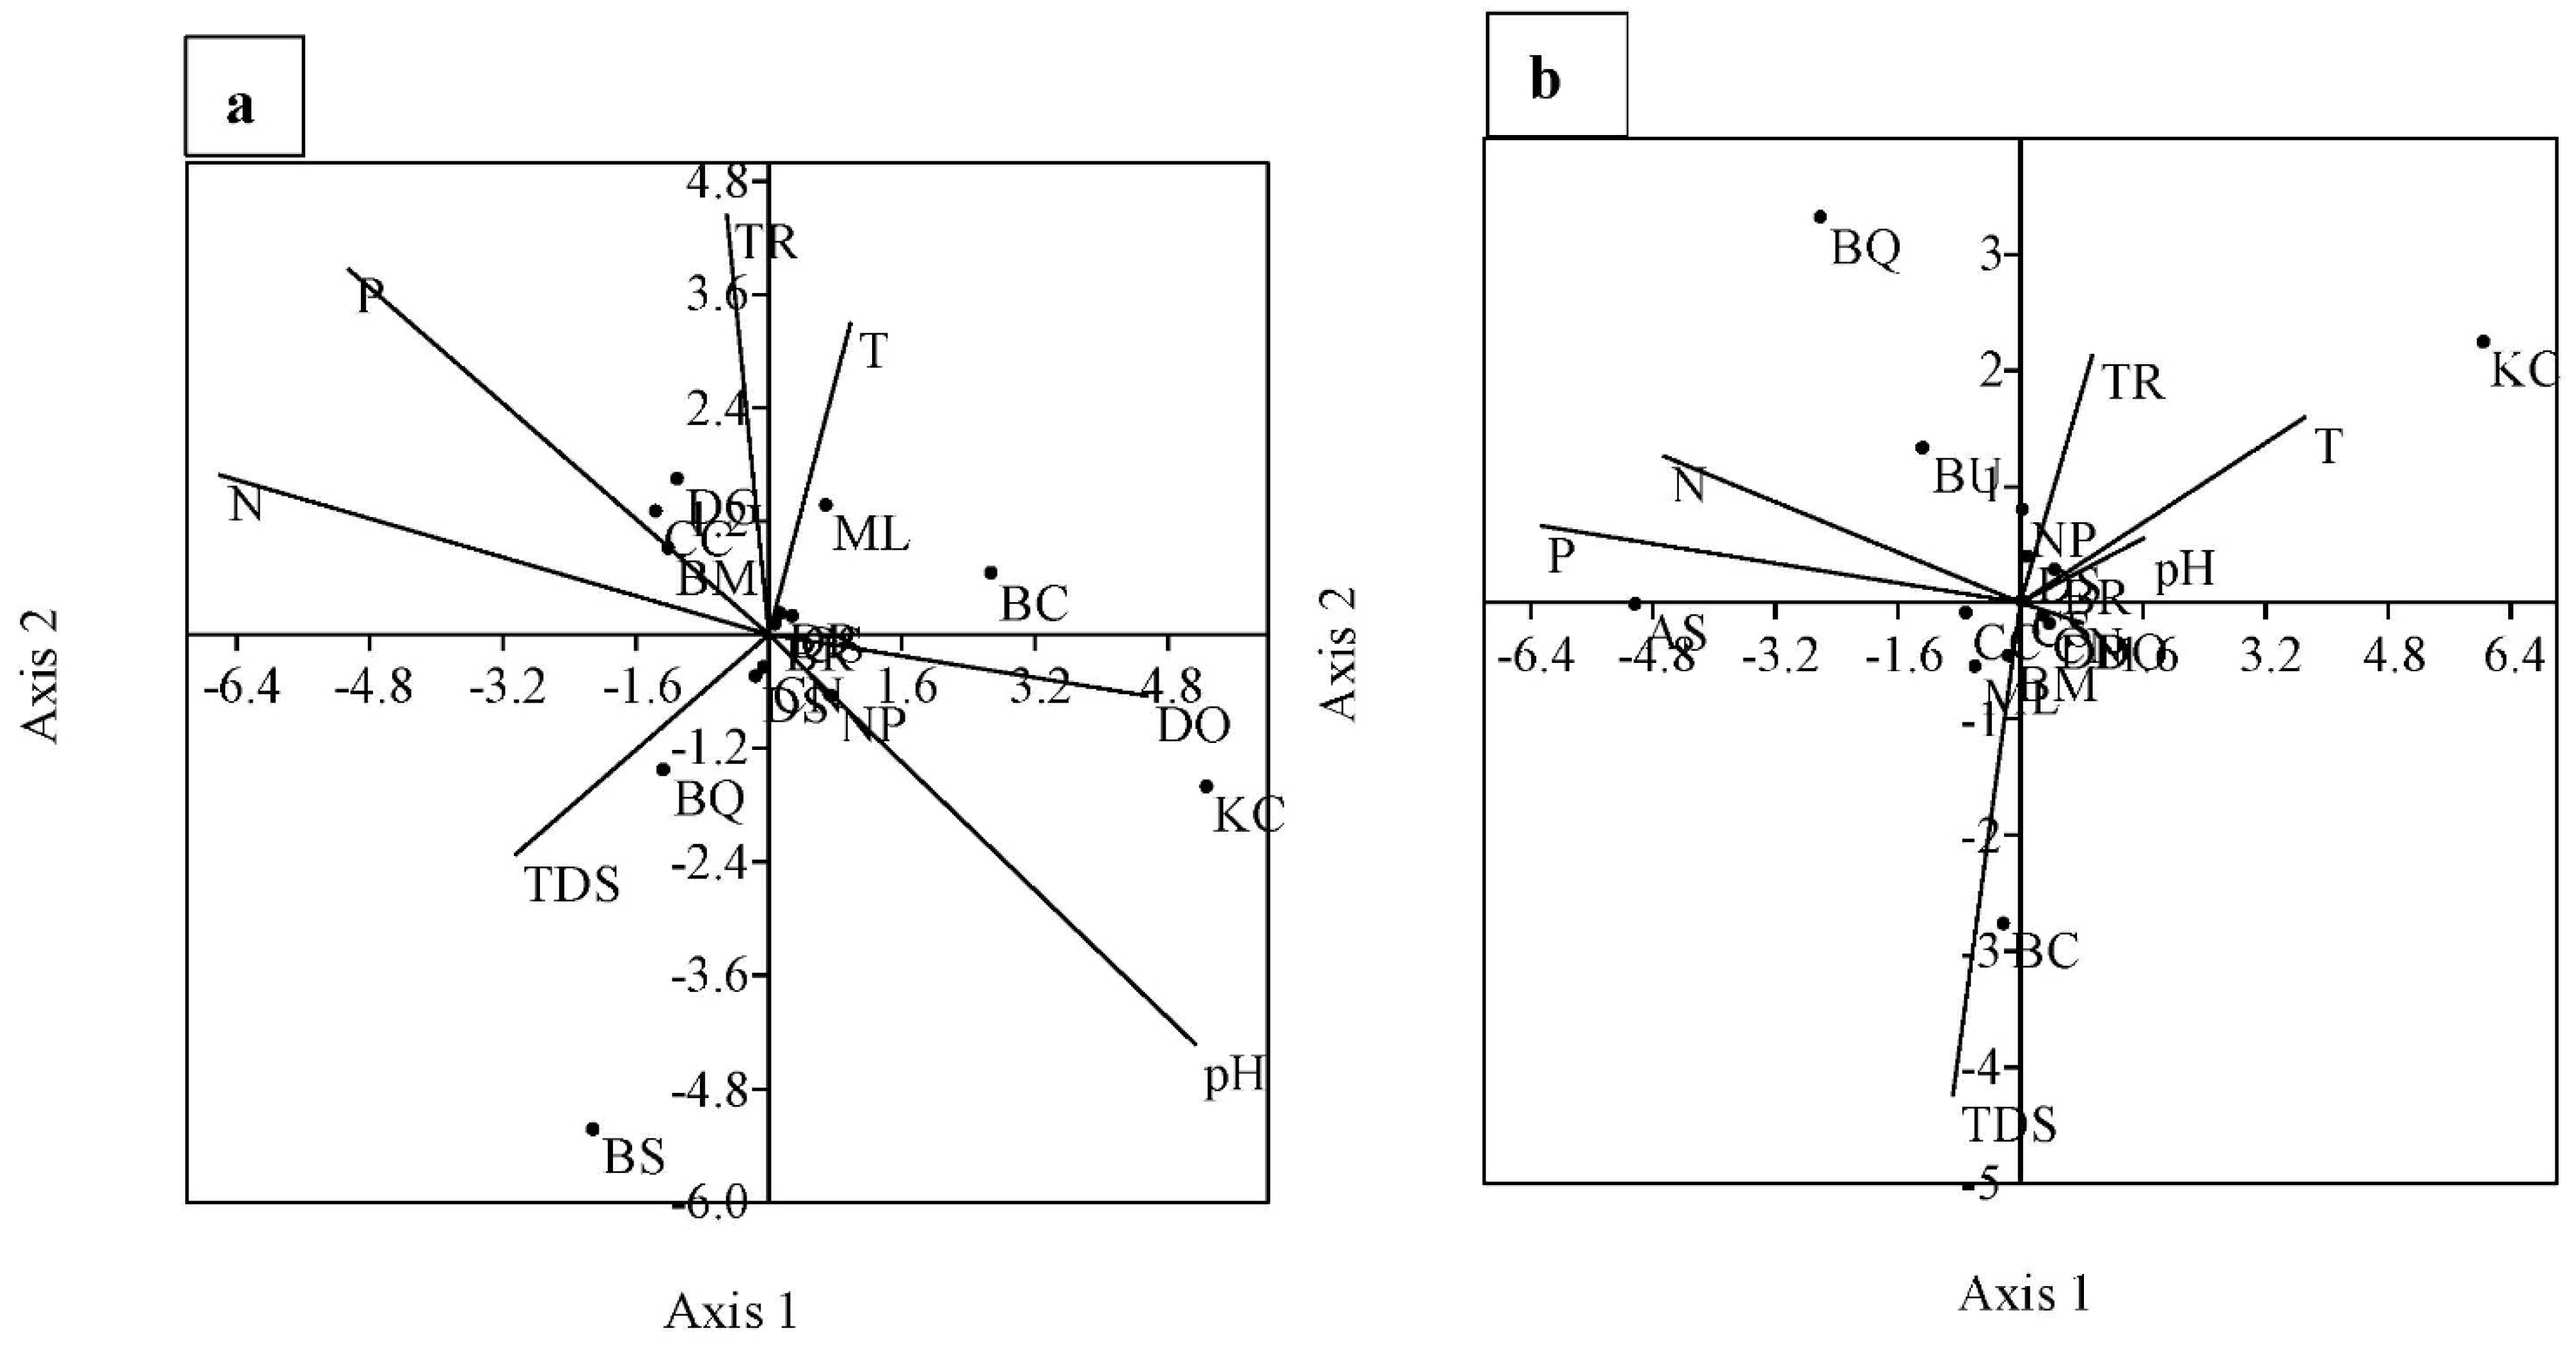
3.5. Relationship between Ecological and Biological Variables

Transparency has a positive correlation with the Richness Index (r = 0.669), and phosphates have a positive correlation with Cladocera (r = 0.847) during December (Supplementary Table S3. Nitrates have a positive correlation with Copepoda (r = 0.719), total zooplankton (r = 0.809), and the Shannon–Weiner Diversity Index (r = 0.602), but a negative correlation with the Dominance Index (r = −0.756) in February (Supplementary Table S3). Phosphates have a positive correlation with the Shannon–Weiner Diversity Index (r = 0.826), the Evenness Index (r = 0.678), and the Richness Index (r = 0.692), but a negative correlation with the Dominance Index (r = −0.910), during February.
Canonical correspondence analysis (CCA) was used to visualize the main patterns of the zooplankton population structure and to evaluate the relationship of the zooplankton population structure with the ecological parameters. Canonical correspondence analysis (CCA) was performed using seven ecological parameters and 14 zooplankton species for December (Figure 6a). The eigenvalue of axis 1 showed a 45.96% correlation, and axis 2 showed a 19.4% correlation between the ecological parameters and zooplankton species. Thus, the first two axes cumulatively explain 65.36% of the variance. The pH, phosphates, nitrates, transparency, and DO have a significant impact on the abundance of zooplankton species. The abundance of Brachionus rubens, Cyclops sp., Diaphanosoma sarsi, Cyclops nanus, Diaptomus sp., and Bosmina sp. was highly correlated with the ecological parameters. Brachionus rubens, Diaphanosoma sarsi, Cyclops sp., and Mesocyclops leuckarti were positively correlated with temperature. Bosmina sp., Ceriodaphnia cornuta, and Diaptomus gracilis showed close affinity to phosphates and transparency. Cyclops nanus, Diaptomus sp., and Brachionus quadridentatus showed close affinity to the TDS, while nauplii showed close affinity to pH.
CCA was also conducted using seven ecological parameters and 14 zooplankton species for February (Figure 6b). The eigenvalue of axis 1 showed a 52.52% correlation, and axis 2 showed a 23.26% correlation between the ecological parameters and zooplankton species. Thus, the first two axes cumulatively explain 75.78% of the variance. The TDS, phosphates, and nitrates have a significant impact on the abundance of zooplankton species. Ceriodaphnia cornuta, Brachionus rubens, Cyclops sp., Cyclops nanus, and Diaphanosoma sarsi were highly correlated with the ecological parameters. Brachionus rubens, Diaptomus sp., and nauplii were positively correlated with transparency, pH, and temperature. Ceriodaphnia cornuta, Mesocyclops leuckarti, Bosmina sp, and Brachionus calyciflorus showed close affinity to the TDS, while Cyclops sp., Cyclops nanus, and Diaphanosoma sarsi showed close affinity to the DO.

4. Discussion

4.1. Zooplankton Communities

The health of aquatic water bodies can be predicted and ascertained by the availability of several planktonic groups [36,37]. Homestead ponds are considered potential aquatic resources for fish culture using natural food [38,39], and thus the diversity and community structure of the zooplankton in the homestead ponds were assessed in the present study. During the present study, only 16 zooplankton species of four groups were identified from the homestead fish ponds, which indicates a ‘low ecological status’. The low number of species may be attributed to eutrophication leading to cyanobacterial blooms, dissolved oxygen lowering, and, therefore, poor water quality in the culture system [8,40]. Again, the presence of certain zooplankton species, such as Brachionus sp. Bosmina sp and Mesocyclops sp, indicates a high amount of suspended material in the water body. The zooplankton communities identified from Lakshadweep Archipelago, India (56 species, 7 groups) [41], from a seagrass habitat (45 species, 13 groups) [42] and a man-made lake (27 species, 3 groups) in Malaysia [43], from the maritime channel systems in the Bay of Bengal (32 species, 11 groups) [1], and from a salt marsh estuary, Cox’s Bazar (33 species, 11 groups), in Bangladesh [44] were far more numerous than those in the present study, which can be attributed to diversified ecosystems. However, several previous studies have recorded a similar number of zooplankton species in brood ponds (11 genera, 6 groups) [45], Kaptai Lake (10 genera, 3 groups) [46], and aquaculture ponds (9 genera, 4 groups) [47]. Among the four groups of zooplankton, Copepoda accounted for the majority (35.58%), and Cladocera and Rotifera accounted for 27.37% and 27.78%, respectively, which is in accordance with several other studies [43,45,46,48]. Among all the groups, Copepoda was found to be dominant during December (42.74%), and Cladocera was found to be dominant in February (33.01%), which can be attributed to the variations in the environmental parameters. The maximum number of zooplankton species (13) was recorded at S3 during February, and the minimum number of species (10) was recorded at many stations during both months as the distributions of the zooplankton depend upon the physico-chemical factors of the environment [49].

4.2. Zooplankton Abundance and Diversity

The highest abundance of zooplankton was 346.14 ± 7.22 ind./L, and the lowest was 211.52 ± 11.01 ind./L in the homestead ponds of the study area. A similar abundance of zooplankton was found by [50], which was relatively lower than that of the other studies [41,42,46,47]; this may be due to differences in the ecosystems as well as lack of feeding and fertilization in the studied homestead ponds [38]. The mean abundance of the zooplankton was found to be higher (301.19 ± 40.55 ind./L) in February and lower (293.02 ± 21.12 ind./L) in December in the present study. One study [46] found a higher abundance of zooplankton in summer and a lower abundance in early summer, while another study [1] found the maximum abundance of zooplankton during winter and the minimum during summer. The zooplankton abundance at different stations and months showed different trends due to variations in the ecological parameters.
The Shannon–Wiener Diversity Index (H’) varied from 2.49 ± 0.04 to 2.12 ± 0.05 in the present study, which indicates a moderate diversity of the zooplankton [34] in the homestead ponds. The species Evenness Index (e) ranged from 0.93 ± 0.04 to 0.84 ± 0.04 in the present study, indicating that the zooplankton community is moderately stable [32]. The higher richness values reflect the suitability of the habitat for the organism and have been reported to be correlated with a longer food chain and a complex food web of the ecosystems, as well as a more stable community [33]. The Margalef Species Richness Index (J) ranged between 2.05 ± 0.01 to 1.56 ± 0.01 in the present study, showing the suitability and stability of the zooplankton community. The Dominance Index (D) ranged from 0.13 ± 0.01 to 0.09 ± 0.001 in the present study, indicating the low dominancy of zooplankton [34] in the homestead ponds. The measured diversity indices of the homestead ponds in the present study were found to be similar to those of other studies [38,41,42]. Significant differences were found in the Shannon–Weiner Diversity Index (H’), the Margalef Species Richness Index (J), and the Dominance Index (D) in December and February, but not in the species Evenness Index (e), and no significant differences were observed between months, except for the Dominance Index (D), which may be due to the study taking place in the same season.

4.3. Zooplankton Assemblage

In the present study, significant differences (p < 0.05) were observed among the different stations, but no significant differences (p > 0.05) were found in the pair combinations of stations or between months for zooplankton assemblage in the homestead ponds. Significant differences among the stations were attributed to household activities, extensive aquaculture practices, and long distances between the homestead ponds [38]. No significant differences in the zooplankton between the months and the pair combinations of the stations were found, which may be due to the study taking place in the same season and the similarity of the physico-chemical parameters [38]. High zooplankton diversity was observed in the homestead ponds with variations in the dominant species between stations for the zooplankton assemblage. Other researchers have also reported a high diversity of zooplankton [39,42].
The cluster analysis (CA) revealed five major clusters in December and three major clusters in February with a similarity of 88% in the present study. The zooplankton clusters generated by combining the stations indicated that stations contained in a cluster have similar habitat conditions and, as a result, more or less the same species composition and abundance, depending on the degree of similarity [42]. On the contrary, the stations that remained isolated in a single cluster showed differences in the zooplankton composition and abundance in these homestead ponds [42], which might be due to variations in the physico-chemical parameters and the different kinds of biological cycles that did not coincide with them [51].

4.4. Ecological Parameters

Different environmental factors play important roles in the development and abundance of zooplankton [52], with limiting factors, such as temperature, pH, dissolved oxygen, and nutrients [53,54,55]. Significant differences were found for the temperature, pH, DO, TDS, transparency, and phosphates in the present study, whereas no significant differences were found for nitrates during December. Significant differences between months were not found for the ecological parameters due to the study taking place in the same season. The water temperature recorded during the study period was relatively low, which might be due to the winter season. The water of the studied homestead ponds was alkaline, which revealed the suitability of the homestead ponds for fish production. Similar values of temperature and pH have been found by other studies [39,53,54]. The DO level in natural water depends on the atmospheric air pressure, photosynthetic activity, temperature, salinity, and turbulence [56]. The DO concentration in the present study was relatively low, which can be attributed to lower temperatures and shorter sunlight periods, which affect photosynthesis and is similar to the findings of other studies [39,41,50,57]. Variations in water transparency are responsible for various factors, such as silting, phytoplankton density, suspended organic matter, latitude, season, and the angle and intensity of incident light. The water transparency in the present study was similar to that of other studies [39,47], and the TDS values in the studied homestead ponds were higher than those in other studies [38,39]. Aquatic nitrogenous and phosphorus nutrients control the distribution and diversity of zooplankton [58]. The relatively low nitrate concentration is inconsistent with some other previous investigations [39,47,51], which might be due to low or no fertilization and supplementary feed in the homestead ponds [38]. The relatively high concentration of phosphates may be due to household activities that use detergents and washing powders [38,59]. Higher values for the ecological parameters were found in February, except for pH, TDS, and transparency, which is compatible with the findings of other studies [39,50].

4.5. Relationship between Ecological and Biological Variables

The physico-chemical parameters and the quantity of nutrients in the water play a significant role in the plankton distribution patterns and species composition [60,61]. In the present study, Pearson’s correlation revealed that phosphates have a positive correlation with Cladocera (r = 0.847) during December, and nitrates have a positive correlation with copepoda (r = 0.719) and total zooplankton (r = 0.809). The lack of a strong relationship between most of the ecological parameters, and zooplankton abundance was revealed by the correlation analysis, which may be attributed to the limited size of the homestead ponds [38].
However, a clear relationship between the zooplankton species and ecological parameters was demonstrated by the canonical correspondence analysis (CCA). The CCA identified that pH, dissolved oxygen, transparency, nitrates, and phosphates have a significant impact on the abundance of zooplankton species in homestead ponds in the study area. The abundance of Bosmina sp., Brachionus rubens, Cyclops sp., Cyclops nanus, Diaptomus sp., and Diaphanosoma sarsi was highly correlated with the ecological parameters. Several previous studies have also shown that zooplankton communities are controlled by different ecological variables [39,41,50,54,62,63].

5. Conclusions

This study presents preliminary information regarding zooplankton diversity, abundance, community structure, ecological parameters, and the influence of ecological variables on zooplankton in the homestead fish ponds of a tropical coastal district. Although a low number of zooplankton species (16 species) was recorded, the high abundance (293.02 ± 21.13 ind./L) of the zooplankton confirms the suitability of the homestead ponds for aquaculture. The low number of species might be attributed to frequent eutrophication phenomena, commonly occurring in small-scale tropical fish ponds. Copepoda, Rotifera, and Cladocera dominated in the zooplankton communities, which is usual for fish ponds. Among the studied ecological variables, TDS, phosphates, and nitrates were found to have a significant impact on the abundance of the zooplankton species as revealed by the CCA. The presence of certain zooplankton species, such as Brachionus sp., Bosmina sp., and Mesocyclops sp. indicates a high amount of suspended material in the water body, which may lead to eutrophication of the water body. The suspended material comes from bathing and washing, animals, clothes, and households, making the environment unsuitable for fish and other organisms. The findings of the present study are useful for the maintenance of a healthy ecosystem for fish culture in these studied ponds. In addition, they provide basic knowledge for further research on zooplankton diversity, abundance, ecological parameters, and the influence of ecological variables on zooplankton in homestead ponds.

Supplementary Materials

The following supporting information can be downloaded at: https://www.mdpi.com/article/10.3390/d14090755/s1, Table S1: Results of one-way ANOSIM and SIMPER analysis on the zooplankton abundance between different stations. Table S2: Average dissimilarity and discriminating species in each station and season using SIMPER analysis. Table S3: Pearson’s correlation coefficient among ecological parameters, zooplankton abundance and diversity indices (a) December (b) February.

Author Contributions

Conceptualization, M.B.H. and A.H.; methodology, M.B.H., S.R.K., M.M.S. and A.-A.U.N.; software, S.R.K., M.M.S. and A.-A.U.N.; validation, M.B.H., T.A. and A.H.; investigation, M.B.H., T.A. and A.H.; writing—original draft preparation, S.R.K., M.M.S. and A.-A.U.N.; draft review, B.A.P., M.K.A.-S., T.A. and A.G. All authors have read and agreed to the published version of the manuscript.

Funding

This study was financially supported by Universiti Brunei Darussalam under the Faculty/Institute/Center Research Grant (No. UBD/RSCH/1.4/FICBF(b)/2020/029) and (No. UBD/RSCH/1.4/FICBF(b)/2021/037). It was also supported by Researchers Supporting Project Number (RSP2022R410), King Saud University, Riyadh, Saudi Arabia.

Institutional Review Board Statement

Not applicable.

Informed Consent Statement

Not applicable.

Acknowledgments

The authors would like to thank the National Agriculture Technology Program (Project ID011), BARC, for their financial support to continue the research properly. The authors would also like to extend their sincere appreciation to the Researchers Supporting Project Number (RSP2022R410), King Saud University, Riyadh, Saudi Arabia.

Conflicts of Interest

The authors declare no conflict of interest.

References

  1. Al, M.A.; Alam, D.; Akhtar, A.; Xu, H.; Islam, S.; Kamal, A.H.M.; Uddin, M.M.; Alam, W. Annual pattern of zooplankton communities and their environmental response in a subtropical maritime channel system in the northern Bay of Bengal, Bangladesh. Acta Oceanol. Sin. 2018, 37, 65–73. [Google Scholar]
  2. Howick, G.L. Zooplankton and benthic microinvertebrates in lake Carl Blackwell. Proc. Okla. Acad. Sci. 1984, 64, 63–65. [Google Scholar]
  3. Vincent, K.; Mwebaza-Ndawula, L.; Makanga, B.; Nachuha, S. Variations in zooplankton community structure and water quality conditions in three habitat types in northern lake Victoria. Lakes Reserv. Res. Manag. 2012, 17, 83–95. [Google Scholar] [CrossRef]
  4. Arruda, G.D.A.; Diniz, L.P.; Almeida, V.L.D.S.; Neumann-Leitão, S.; de Melo Junior, M. Rotifer community structure in fish-farming systems associated with a Neotropical semiarid reservoir in north-eastern Brazil. Aquac. Res. 2017, 48, 4910–4922. [Google Scholar] [CrossRef]
  5. Ahmad, U.; Parveen, S.; Khan, A.; Kabir, H.; Mola, H.; Ganai, A. Zooplankton population in relation to physico-chemical factors of a sewage fed pond of Aligarh (UP), India. Biol. Med. 2011, 3, 336–341. [Google Scholar]
  6. Alexander, R.J. Interactions of Zoo Plankton and Phytoplankton with Cyanobacteria. Master’s Thesis, University of Nebraska-Lincoln, Lincoln, NE, USA, 2012. [Google Scholar]
  7. Richardson, A.J. In hot water: Zooplankton and climate change. ICES J. Mar. Sci. 2008, 65, 279–295. [Google Scholar] [CrossRef]
  8. Cottenie, K.; Nuytten, N.; Michels, E.; De Meester, L. Zooplankton community structure and environmental conditions in a set of interconnected ponds. Hydrobiologia 2001, 442, 339–350. [Google Scholar] [CrossRef]
  9. Andrulewicz, E.; Szymelfenig, M.; Urbański, J.; Węsławski, J.; Węsławski, S. Baltic Sea—It is worth knowing about it. Noteb. Green Acad. 2008, 7, 1–113. [Google Scholar]
  10. Tunowski, J. Zooplankton structure in heated lakes with differing thermal regimes and water retention. Fish. Aquat. Life 2009, 17, 291–303. [Google Scholar] [CrossRef]
  11. Bednarz, T.; Starzecka, A.; Mazuriewicz-Boron, G. Microbiological processes accompanying the blooming of algae and cyanobacteria. Wiadomości Bot. 2002, 46, 45–55. [Google Scholar]
  12. Mustapha, M.K. Zooplankton assemblage of Oyun Reservoir, Offa, Nigeria. Rev. Biol. Trop. 2009, 57, 1027–1047. [Google Scholar] [CrossRef] [PubMed]
  13. Bai, X.; Jiang, Y.; Jiang, Z.; Zhu, L.; Feng, J. Nutrient potentiate the responses of plankton community structure and metabolites to cadmium: A microcosm study. J. Hazard. Mater. 2022, 430, 128506. [Google Scholar] [CrossRef]
  14. Griboff, J.; Horacek, M.; Wunderlin, D.A.; Monferran, M.V. Bioaccumulation and trophic transfer of metals, As and Se through a freshwater food web affected by antrophic pollution in Córdoba, Argentina. Ecotoxicol. Environ. Saf. 2018, 148, 275–284. [Google Scholar] [CrossRef]
  15. Hoang, T.C.; Brausch, J.M.; Cichra, M.F.; Phlips, E.J.; Van Genderen, E.; Rand, G.M. Effects of zinc in an outdoor freshwater microcosm system. Environ. Toxicol. Chem. 2021, 40, 2051–2070. [Google Scholar] [CrossRef] [PubMed]
  16. Sathicq, M.B.; Gómez, N. Effects of hexavalent chromium on phytoplankton and bacterioplankton of the Río de la Plata estuary: An ex-situ assay. Environ. Monit. Assess. 2018, 190, 1–9. [Google Scholar] [CrossRef]
  17. Nikolsky, G.V.; Birkett, L. The Ecology of Fishes; Academic Press: London, UK, 1963; Volume 352. [Google Scholar]
  18. Jhingran, V.G. Fish and Fisheries of India; Hindustan Publishing Corporation: Delhi, India, 1985. [Google Scholar]
  19. Abu Hena, M.; Japar Sidik, B.; Aysha, A.; Ahasan, H.; Short, F.T. Estuarine macrophytes at Bakkhali, Cox’s Bazar, Bangladesh with reference to mangrove diversity. Chiang Mai J. Sci. 2013, 40, 556–563. [Google Scholar]
  20. Ali, M.; Hossain, M.; Rahman, M.; Habib, A. Diversity of fish fauna in the Chitra river of Southwestern Bangladesh: Present status, threats and recommendations for conservation. Asian J. Appl. Sci. 2014, 7, 635–643. [Google Scholar] [CrossRef]
  21. Hossain, S.; Rahman, M.M.; Akter, M.; Bhowmik, S. Species composition and abundance of zooplankton population in freshwater pond of Noakhali district, Bangladesh. World J. Fish Mar. Sci. 2015, 7, 387–393. [Google Scholar]
  22. Khan, N.S.; Bari, J.B.A. The effects of physico-chemical parameters on plankton distribution in poultry manure and artificial formulated feed treated fish ponds, Noakhali, Bangladesh. Int. J. Fish. Aquat. Stud. 2019, 7, 1–7. [Google Scholar]
  23. Khan, N.S.; Islam, S.; Bari, J.B.A.; Tisha, N.A. Water quality evaluation by monitoring zooplankton distribution in Wild Ponds, Noakhali, Bangladesh. Nat. Environ. Pollut. Technol. 2020, 19, 1767–1770. [Google Scholar] [CrossRef]
  24. APHA. Standard Methods for the Examination of Water and Wastewater, 18th ed.; American Public Health Association (APHA); American Water Works Association (AWWA); Water Pollution Control Federation (WPCF): Washington, DC, USA, 1992. [Google Scholar]
  25. Ali, S.; Chakrabarty, T. Bangladesher mitha panir amerudandi prani. In A Book of Freshwater Invertebrates of Bangladesh; Bangla Academy: Dhaka, Bangladesh, 1992; p. 207. [Google Scholar]
  26. Battish, S. Freshwater Zooplankton of India; Oxford & IBH Publishing: New Delhi, India, 1992. [Google Scholar]
  27. Witty, L.M. Practical guide to identifying freshwater crustacean zooplankton. In Cooperative Freshwater Ecology Unit; Laurentian University: Sudbury, ON, Canada, 2004. [Google Scholar]
  28. Doan Dang, P.; Van Khoi, N.; Nguyet Nga, L.T.; Thanh, D.N.; Ho Thanh, H. Identification Handbook of Freshwater Zooplankton of the Mekong River and Its Tributaries; Mekong River Commission: Vientiane, Laos, 2015. [Google Scholar]
  29. Newell, G.E.; Newell, R.C. Marine plankton: A practical guide (No. 592 NEWm). J. Anim. Ecol. 1963, 33, 377. [Google Scholar]
  30. Stirling, H.P. Chemical and Biological Methods of Water Analysis for Aquaculturalists; Institute of Aquaculture, University of Stirling: Stirling, UK, 1985. [Google Scholar]
  31. Shannon, C.E.; Weaver, W. The Mathematical Theory of Communication; University of Illinois Press: Urbana, IL, USA, 1949. [Google Scholar]
  32. Pielou, E.C. The measurement of diversity in different types of biological collections. J. Theor. Biol. 1966, 13, 131–144. [Google Scholar] [CrossRef]
  33. Margalef, R. Information and Diversity Specifies the Communities of Organisms. Invest. Pesg. 1956, 3, 99–106. [Google Scholar]
  34. Odum, E.P.; Barrett, G.W. Fundamentals of Ecology; Saunders: Philadelphia, PA, USA, 1971; Volume 3. [Google Scholar]
  35. Hammer, Ø.; Harper, D.A.; Ryan, P.D. PAST: Paleontological statistics software package for education and data analysis. Palaeontol. Electron. 2001, 4, 9. [Google Scholar]
  36. Papa, R.D.S.; Zafaralla, M.T.; Eckmann, R. Spatio-temporal variation of the zooplankton community in a tropical caldera lake with intensive aquaculture (Lake Taal, Philippines). Hydrobiologia 2011, 664, 119–133. [Google Scholar] [CrossRef]
  37. Tulsankar, S.S.; Cole, A.J.; Gagnon, M.M.; Fotedar, R. Temporal variations and pond age effect on plankton communities in semi-intensive freshwater marron (Cherax cainii, Austin and Ryan, 2002) earthen aquaculture ponds in Western Australia. Saudi J. Biol. Sci. 2021, 28, 1392–1400. [Google Scholar] [CrossRef]
  38. Sarker, M.M.; Hossain, M.B.; Islam, M.M.; Mustafa Kamal, A.H.; Idris, M.H. Unravelling the diversity and assemblage of phytoplankton in homestead ponds of central coastal belt, Bangladesh. Aquac. Res. 2021, 52, 167–184. [Google Scholar] [CrossRef]
  39. Nandy, T.; Mandal, S. Unravelling the spatio-temporal variation of zooplankton community from the river Matla in the sundarbans estuarine system, India. Oceanologia 2020, 62, 326–346. [Google Scholar] [CrossRef]
  40. Sun, D.; Liu, Z.; Wang, C. Scale-dependent environmental control of mesozooplankton community structure in three aquaculture subtropical bays of China. Oceanologia 2016, 58, 124–134. [Google Scholar] [CrossRef]
  41. Antony, S.; Ajayan, A.; Dev, V.V.; Mahadevan, H.; Kaliraj, S.; Krishnan, K.A. Environmental influences on zooplankton diversity in the Kavaratti lagoon and offshore, Lakshadweep Archipelago, India. Reg. Stud. Mar. Sci. 2020, 37, 101330. [Google Scholar] [CrossRef]
  42. Ismail, J.; Kamal, A.H.M.; Idris, M.H.; Amin, S.N.; Hamli, H.; Sien, L.S.; Al-Asif, A.; Abualreesh, M.H. Zooplankton species composition and diversity in the seagrass habitat of Lawas, Sarawak, Malaysia. Biodivers. Data J. 2021, 9, e67449. [Google Scholar] [CrossRef] [PubMed]
  43. Ismail, A.H.; Adnan, A.A.M. Zooplankton composition and abundance as indicators of eutrophication in two small man-made lakes. Trop. Life Sci. Res. 2016, 27, 31. [Google Scholar] [CrossRef] [PubMed]
  44. MK, A.H.; Idris, M.; Johan, I.; Nesarul, N.; Aysha, A.; Islam, M. Seasonal distribution of zooplankton composition and abundance in a sub-tropical mangrove and salt marsh estuary. Malays. J. Sci. 2016, 35, 275–289. [Google Scholar]
  45. Roy, U.; Shaha, B.; Mazhabuddin, K.; Haque, M.; Sarower, M. Study on the diversity and seasonal variation of zooplankton in a brood pond, Bangladesh. Mar. Resour. Aquac. 2010, 1, 30–37. [Google Scholar]
  46. Bashar, M.A.; Basak, S.S.; Uddin, K.B.; Islam, A.S.; Mahmud, Y. Seasonal variation of zooplankton population with reference to water quality of Kaptai Lake, Bangladesh. Bangladesh Res. Publ. J. 2015, 11, 127–133. [Google Scholar]
  47. Siddika, F.; Shahjahan, M.; Rahman, M. Abundance of plankton population densities in relation to bottom soil textural types in aquaculture ponds. Int. J. Agric. Res. Innov. Technol. 2012, 2, 56–61. [Google Scholar] [CrossRef]
  48. Rahman, S.; Hussain, M.A. A study on the abundance of zooplankton of a culture and a non-culture pond of the Rajshahi University campus. Univ. J. Zool. Rajshahi Univ. 2008, 27, 35–41. [Google Scholar] [CrossRef]
  49. Hulyal, S.; Kaliwal, B. Water quality assessment of Almatti Reservoir of Bijapur (Karnataka State, India) with special reference to zooplankton. Environ. Monit. Assess. 2008, 139, 299–306. [Google Scholar] [CrossRef]
  50. Akter, S.; Bhouyain, A.M.; Azad, S.; Nasrin, D. Influence of physico-chemical factors on the zooplankton population of Bostami pond of Chittagong. Bangladesh J. Zool. 2016, 44, 73–87. [Google Scholar] [CrossRef]
  51. Naik, S.; Mahapatro, D.; Behera, D.P.; Kumar, M.; Panda, C.; Mishra, R. Spatio-temporal study of zooplankton community in Mahanadi Estuary, Bay of Bengal. Int. J. Ecosyst. 2013, 3, 185–195. [Google Scholar]
  52. Suresh, S.; Thirumala, S.; Ravind, H.B. Zooplankton diversity and its relationship with physico-chemical parameters in Kundavada Lake, of Davangere District, Karnataka, India. ProEnviron. Promediu 2011, 4, 56–59. [Google Scholar]
  53. El-Otify, A.M. Evaluation of the physicochemical and chlorophyll-a conditions of a subtropical aquaculture in lake Nasser area, Egypt. Beni-Suef Univ. J. Basic Appl. Sci. 2015, 4, 327–337. [Google Scholar] [CrossRef]
  54. Paturej, E.; Gutkowska, A.; Koszałka, J.; Bowszys, M. Effect of physicochemical parameters on zooplankton in the brackish, coastal Vistula Lagoon. Oceanologia 2017, 59, 49–56. [Google Scholar] [CrossRef]
  55. Zhao, K.; Wang, L.; Riseng, C.; Wehrly, K.; Pan, Y.; Song, K.; Da, L.; Pang, W.; You, Q.; Tian, H.; et al. Factors determining zooplankton assemblage difference among a man-made lake, connecting canals, and the water-origin river. Ecol. Indic. 2018, 84, 488–496. [Google Scholar] [CrossRef]
  56. Singh, C.; Sharma, A.; Deorani, B. Limnological studies for bioenergetics transformation in a Tarai reservoir, Nanak Sagar (UP). In Advances in Limnology; Singh, H.R., Ed.; Schweizerbart Science Publishers: Stuttgart, Germany, 1990; pp. 356–362. [Google Scholar]
  57. Sharif, A.S.M.; Islam, M.S.; Bhuyan, M.S. Spatio-temporal occurrence and distribution of copepod in the Karnaphuli river estuary, Bangladesh. J. Biodivers. Environ. Sci. 2017, 10, 271–282. [Google Scholar]
  58. Rajkumar, M.; Sun, J.; Jenkinson, I.; Rahman, M. Seasonal variations in the structure of copepod assemblages in tropical marine and estuarine waters, Coleroon, south-east India. J. Mar. Biol. Assoc. UK 2014, 94, 521–535. [Google Scholar] [CrossRef]
  59. Gambhir, R.S.; Kapoor, V.; Nirola, A.; Sohi, R.; Bansal, V. Water pollution: Impact of pollutants and new promising techniques in purification process. J. Hum. Ecol. 2012, 37, 103–109. [Google Scholar] [CrossRef]
  60. Hossain, M.Y.; Jasmine, S.; Ibrahim, A.H.; Ahmed, Z.F.; Ohtomi, J.; Fulanda, B.; Begum, M.; Mamun, A.; El-Kady, M.A.; Wahab, M.A. A preliminary observation on water quality and plankton of an earthen fish pond in Bangladesh: Recommendations for future studies. Pak. J. Biol. Sci. PJBS 2007, 10, 868–873. [Google Scholar] [CrossRef] [Green Version]
  61. Hamilton, D. Limnology; McGraw-Hill: New York, NY, USA, 1994; Volume 2. [Google Scholar]
  62. Dhanasekaran, M.; Bhavan, P.S.; Manickam, N.; Kalpana, R. Physico-chemical characteristics and zooplankton diversity in a perennial lake at Dharmapuri (Tamil Nadu, India). J. Entomol. Zool. Stud. 2017, 5, 285–292. [Google Scholar]
  63. Iqbal, M.M.; Islam, M.S.; Haider, M.N. Heterogeneity of zooplankton of the Rezukhal Estuary, Cox’s Bazar, Bangladesh with seasonal environmental effects. Int. J. Fish. Aquat. Stud. 2014, 2, 275–282. [Google Scholar]
Figure 1. Map showing the location of the study area.
Diversity 14 00755 g001
Figure 2. Composition (%) of zooplankton classes in two seasons at different stations (D = December, F = February).
Diversity 14 00755 g002
Figure 3. Spatial variation (mean ± SD) of (a) total zooplankton abundance, (b) Shannon–Wiener Diversity Index (H′), (c) Evenness Index (e), (d) Margalef Species Richness Index (J), and (e) Dominance Index (D).
Diversity 14 00755 g003
Figure 4. Dendrogram showing clusters based on the Bray–Curtis similarity matrix for (a) December and (b) February.
Diversity 14 00755 g004
Figure 5. Ecological parameters (mean ± SD) at different stations of the homestead ponds.
Diversity 14 00755 g005
Figure 6. CCA biplot between zooplankton species and ecological parameters (a) December and (b) February. (T: Temperature, TR: Transparency, N: Nitrates. P: Phosphates, AS: Asplanchna sieboldi, BR: Brachionus rubens, BC: Brachionus calyciflorus, BQ: Brachionus quadridentatus, BU: Brachionus urceolaris, BS: Brachionus sp., KC: Keratella cochlearis, CN: Cyclops nanus, CS: Cyclops sp., ML: Mesocyclops leuckarti, DG: Diaptomus gracilis, DS: Diaptomus sp., BM: Bosmina sp., CC: Ceriodaphnia cornuta, DP: Diaphanosoma sarsi, NP: nauplii).
Diversity 14 00755 g006
Table 1. Zooplankton species recorded from the homestead ponds of Noakhali coast.
DecemberFebruary
Rotifera
Asplanchna sieboldi-+
Brachionus rubensa++
Brachionus calyciflorusb++
Brachionus quadridentatus++
Brachionus urceolaris-+
Brachionus sp.+-
Keratella cochlearis++
Copepoda
Cyclops nanusa++
Cyclops sp. a++
Mesocyclops leuckartib++
Diaptomus gracilis+-
Diaptomus sp. a++
Cladocera
Bosmina sp. a++
Ceriodaphnia cornutab++
Diaphanosoma sarsia++
Nauplii
Nauplii a++
Note: ‘a’, dominant in both months; ‘b’, dominant only in February.
Publisher’s Note: MDPI stays neutral with regard to jurisdictional claims in published maps and institutional affiliations.

