
Amphibian Taxonomic and Functional Diversity in a Heterogeneous Landscape of West-Central Mexico

 ,
,  ,
,  , and
, and 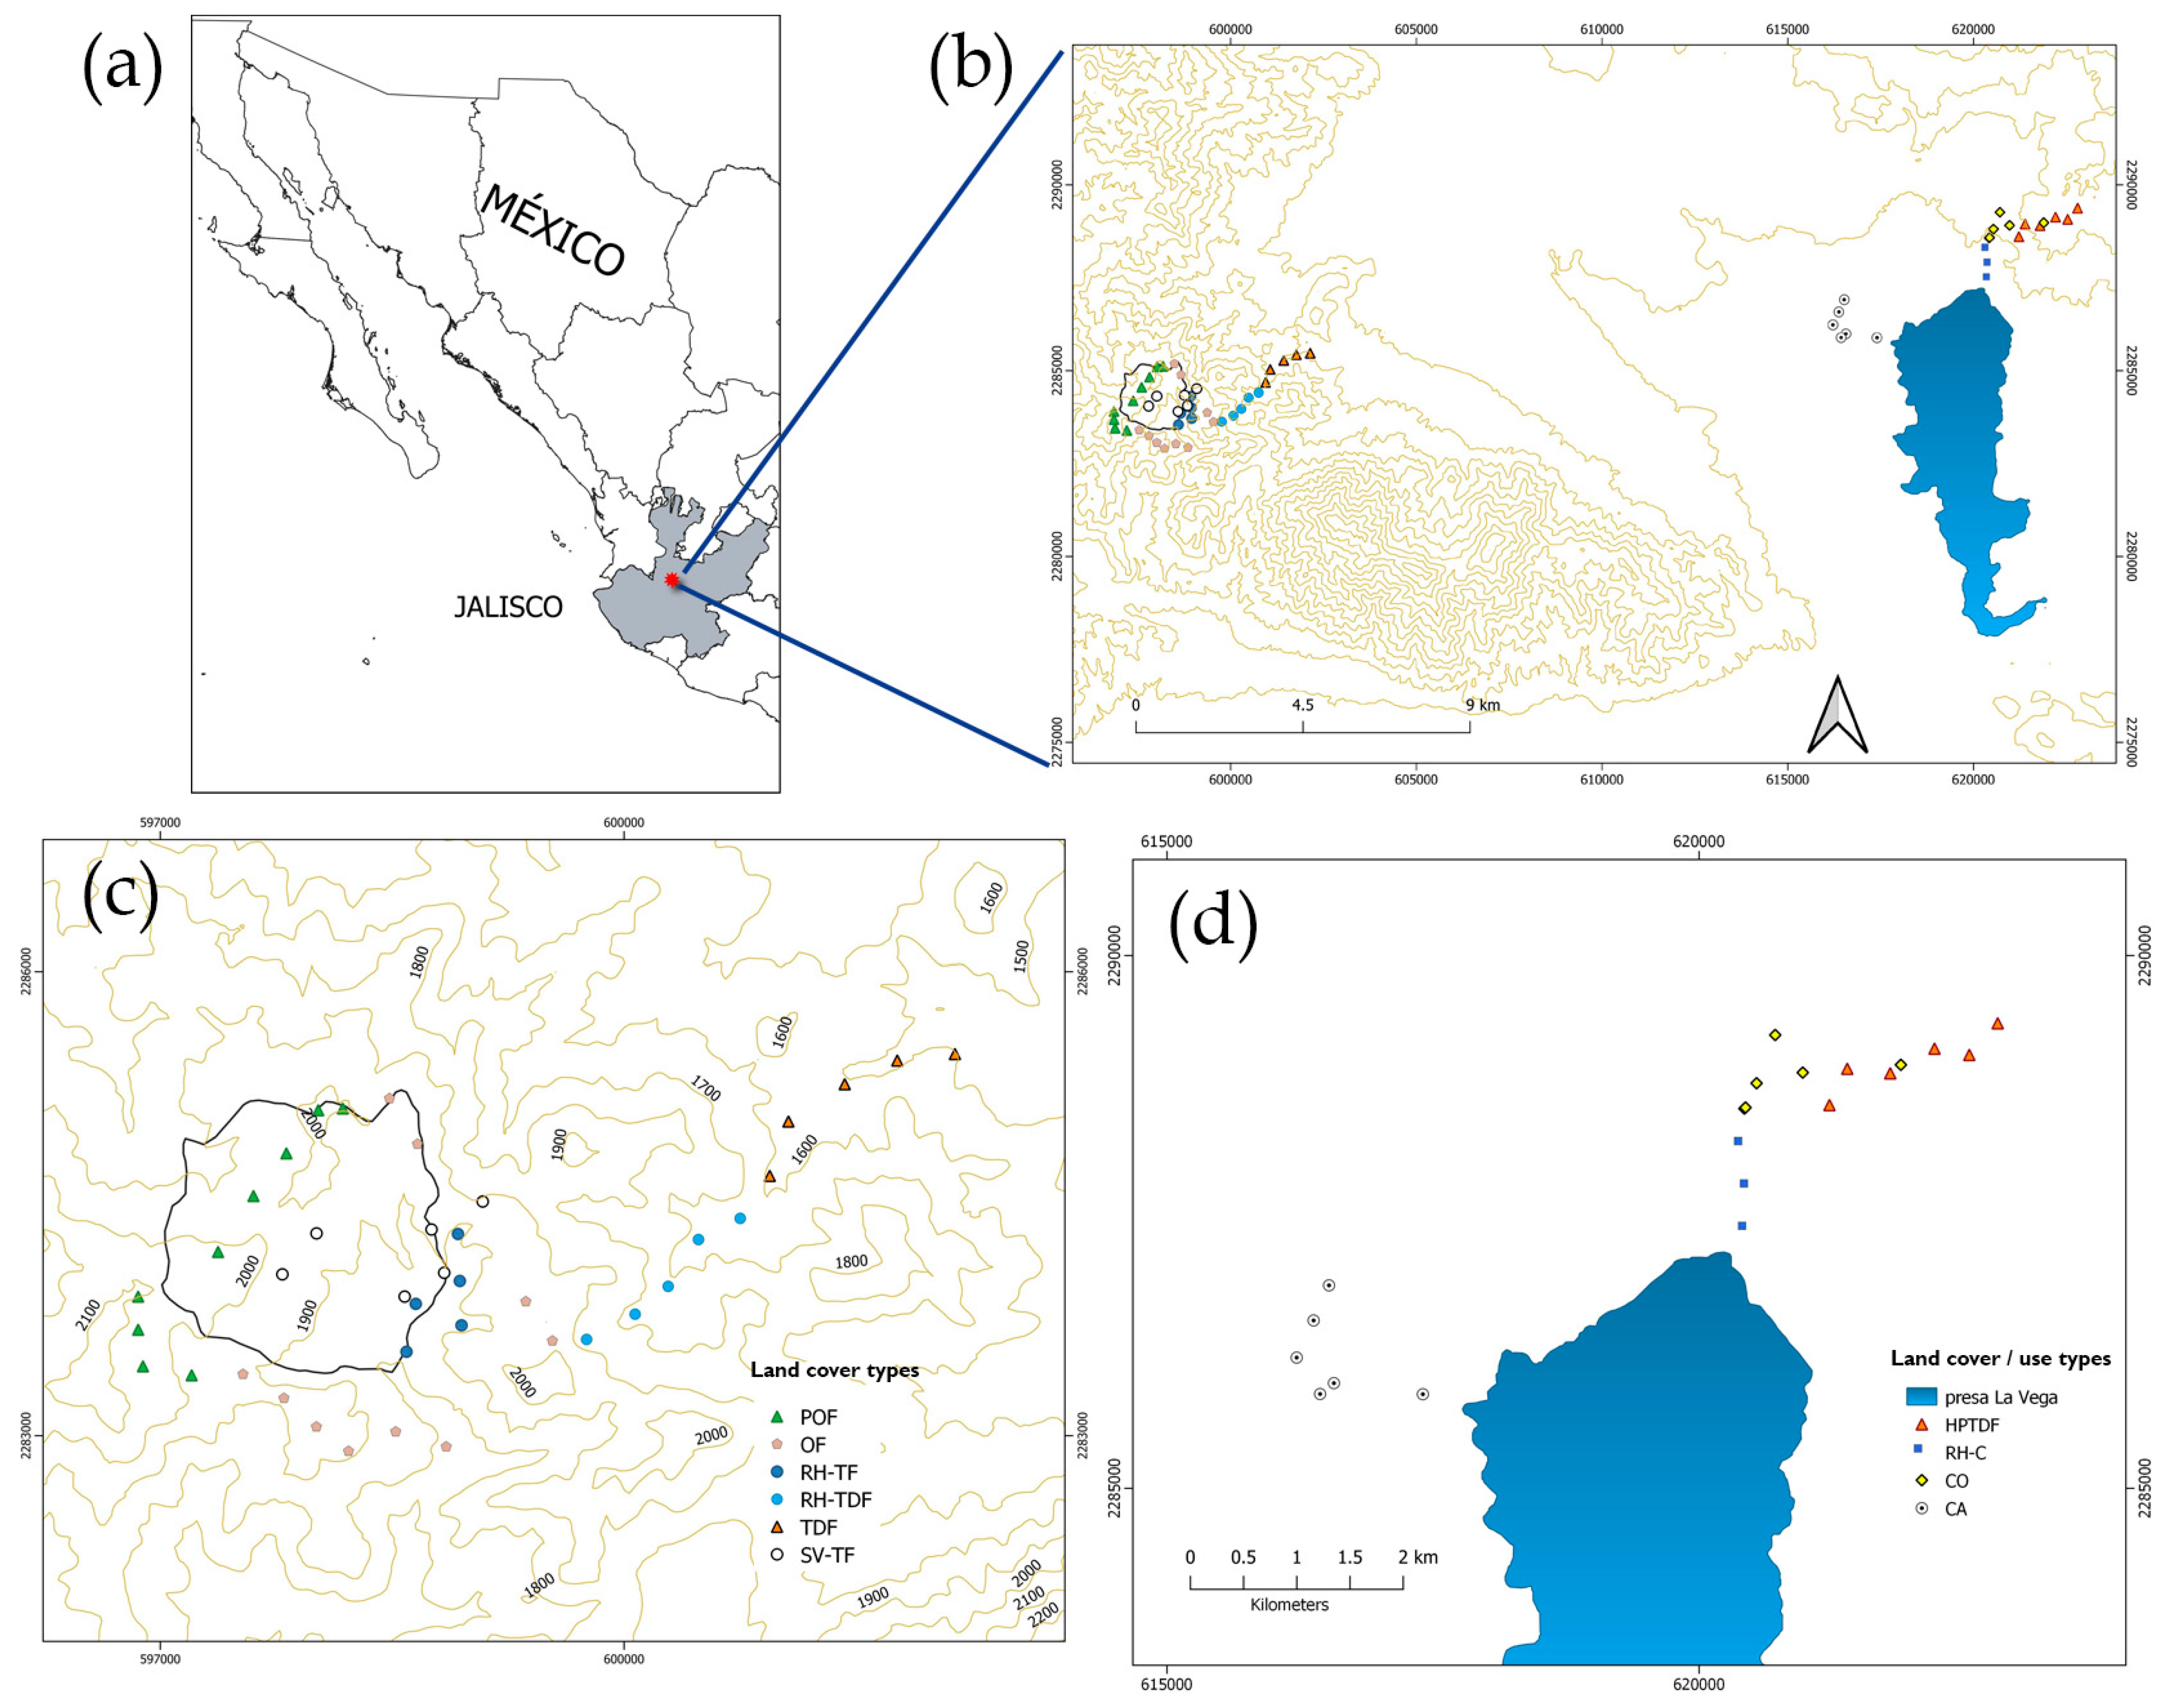
Abstract
:1. Introduction
2. Materials and Methods
2.1. Study Area
2.2. Field Survey
2.3. Data Analysis
2.3.1. Taxonomic Diversity
2.3.2. Functional Diversity
2.3.3. Amphibian Diversity vs. Habitat Characteristics
3. Results
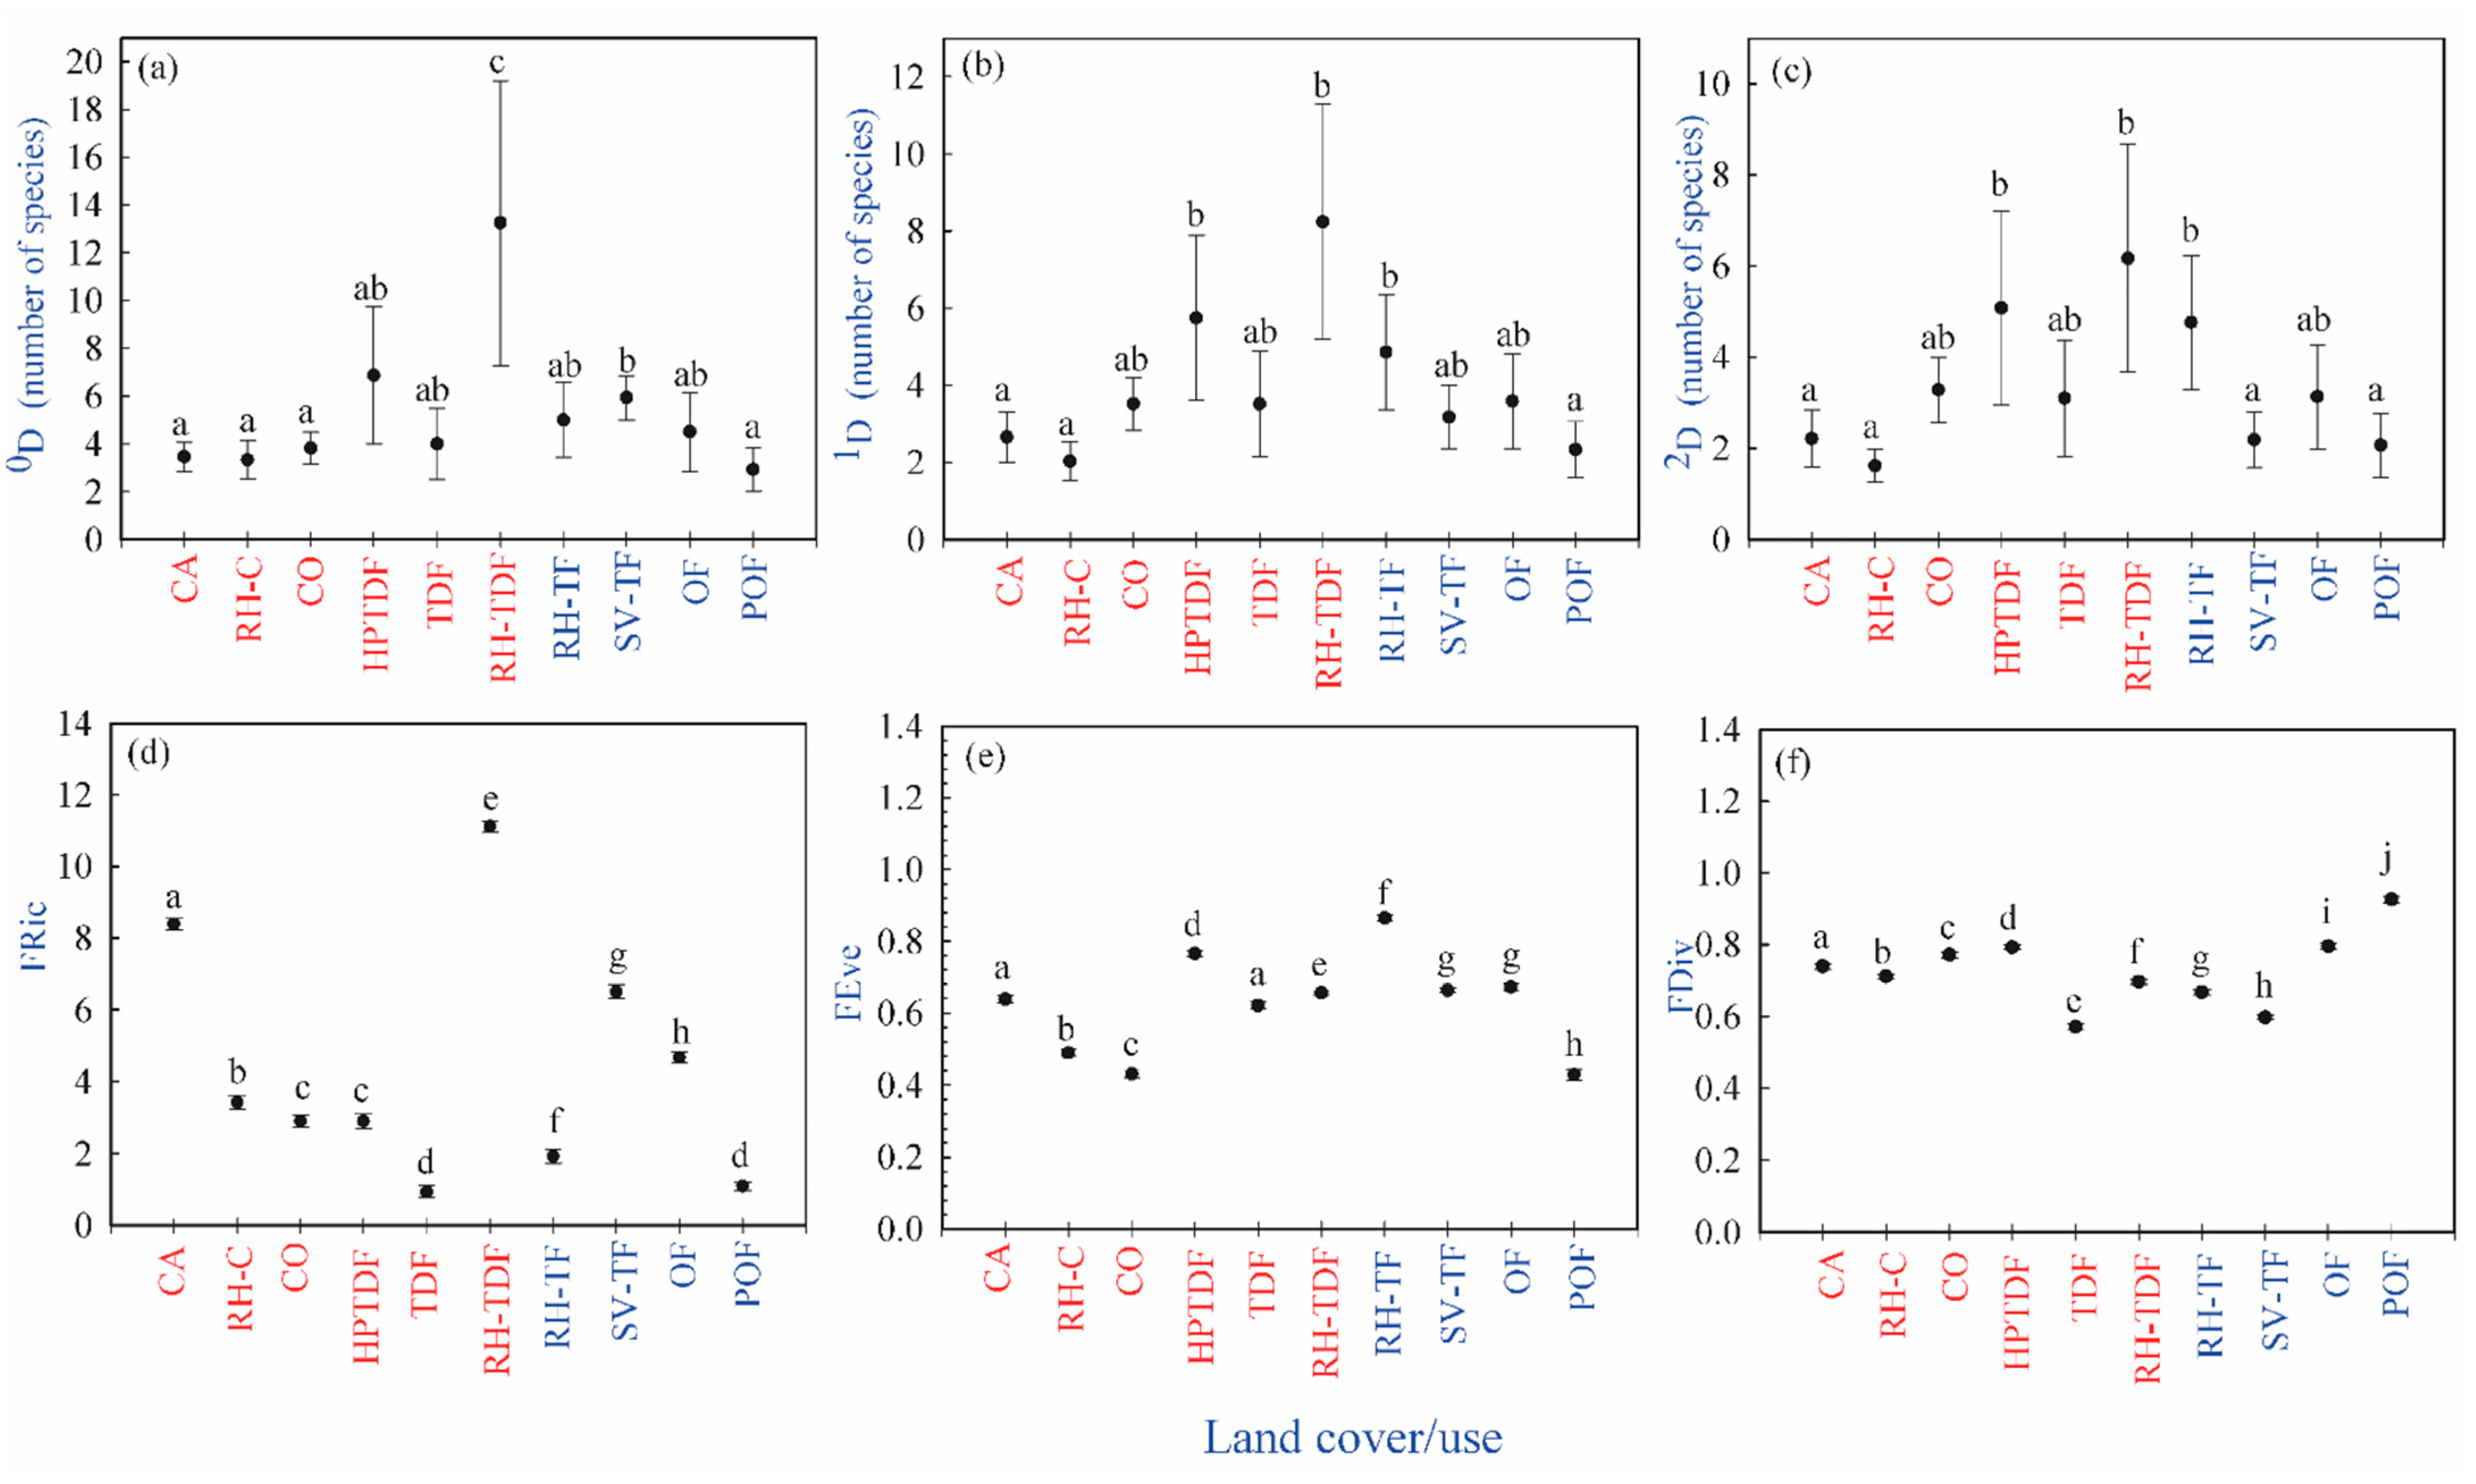
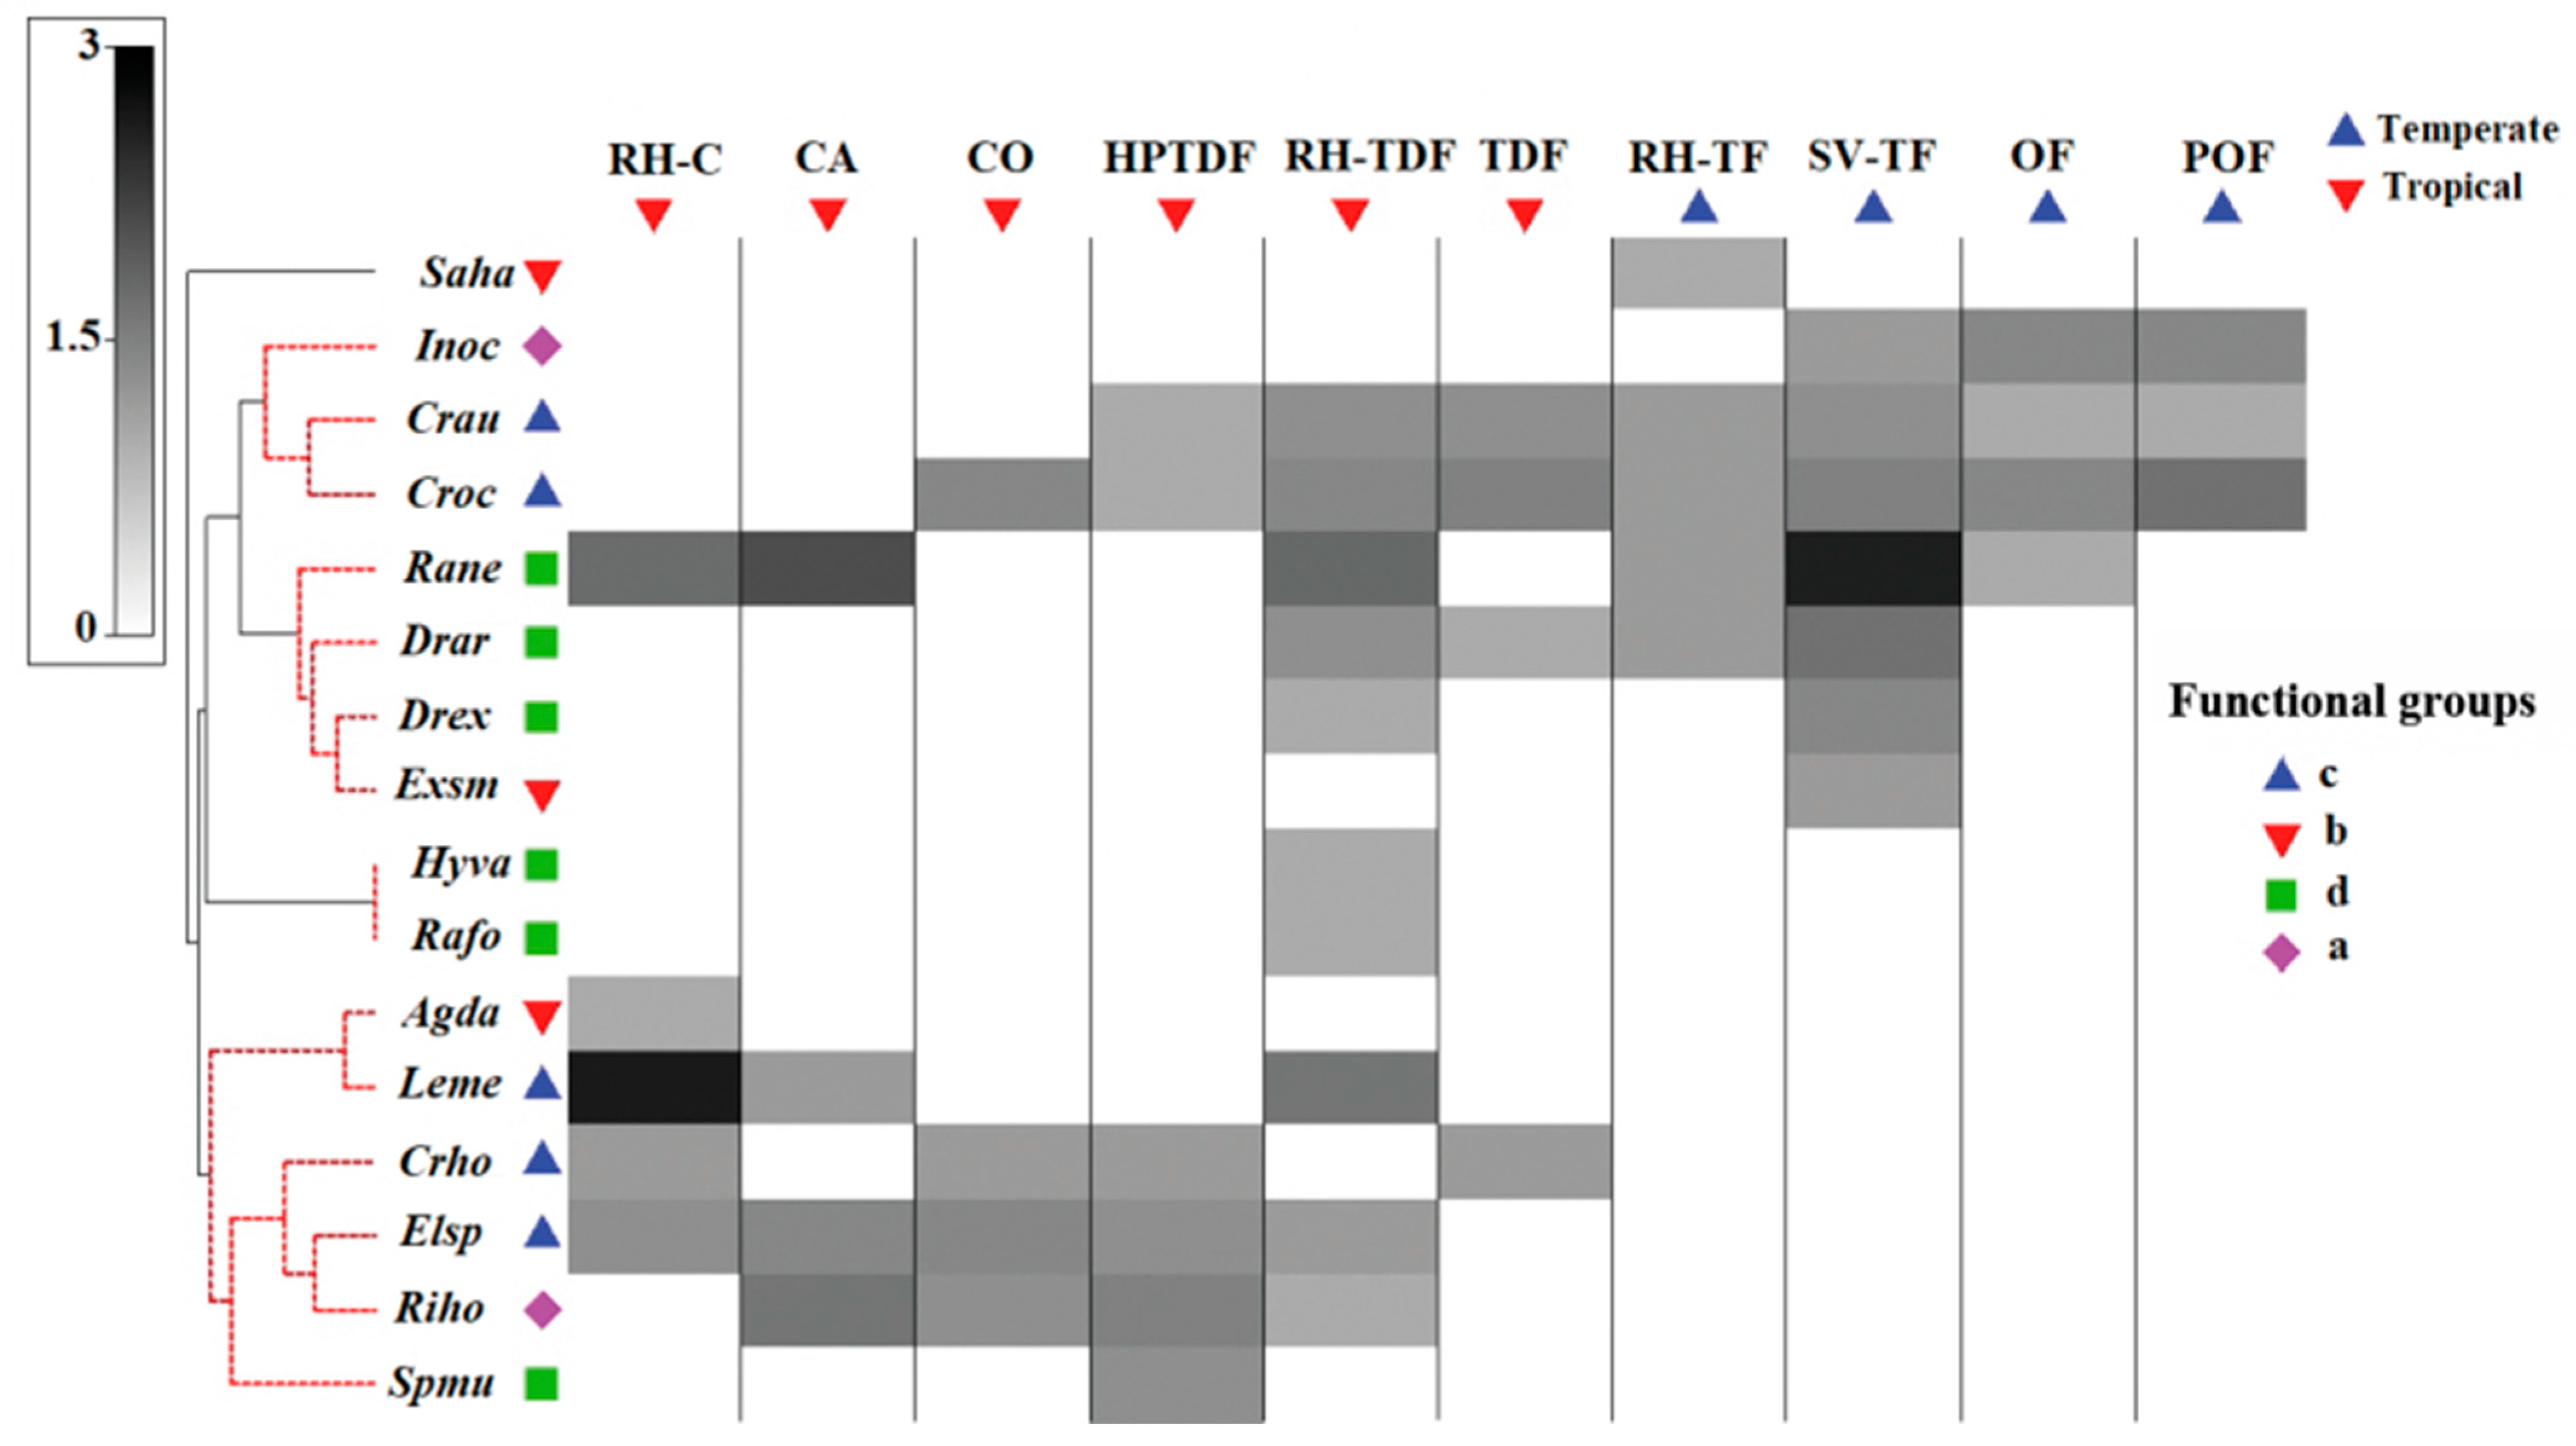
3.1. Taxonomic Diversity
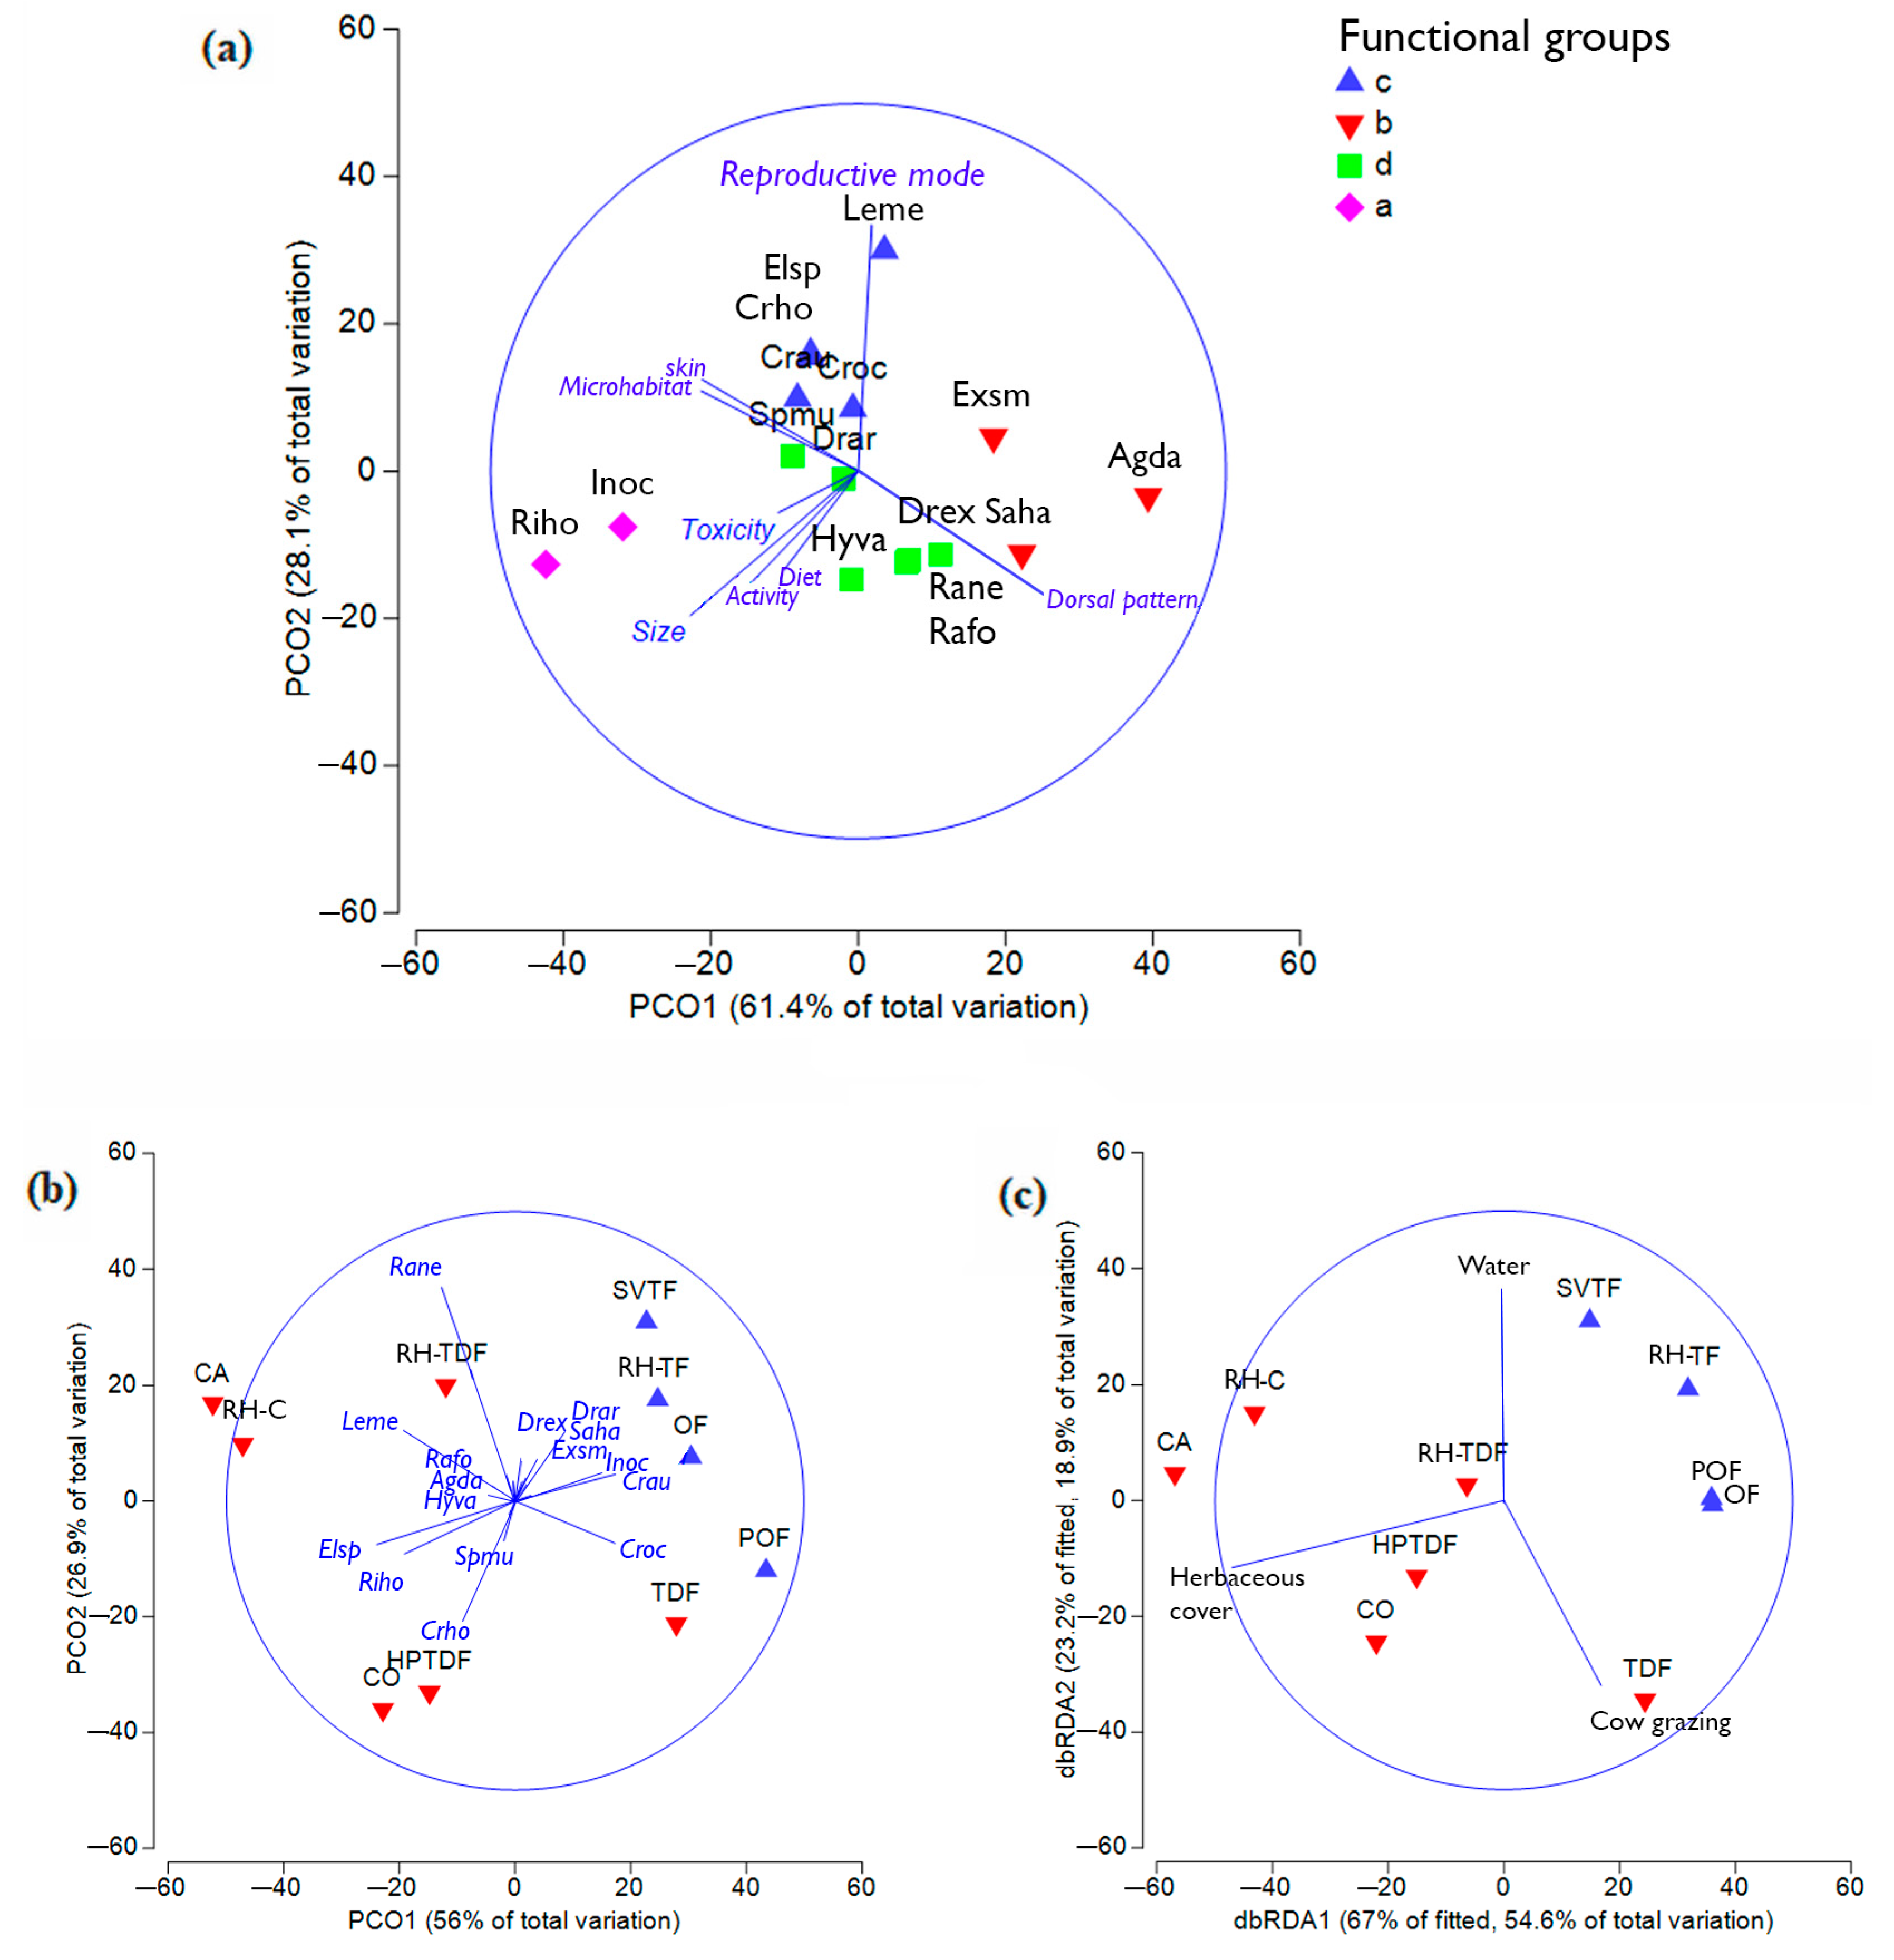
3.2. Functional Diversity
3.3. Amphibian Diversity vs. Habitat Characteristics
4. Discussion
Supplementary Materials
Author Contributions
Funding
Institutional Review Board Statement
Data Availability Statement
Acknowledgments
Conflicts of Interest
References
- Keenan, R.J.; Reams, G.A.; Achard, F.; de Freitas, J.V.; Grainger, A.; Lindquistf, E. Dynamics of global forest area: Results from the FAO Global Forest Resources Assessment. For. Ecol. Manag. 2015, 352, 9–20. [Google Scholar] [CrossRef]
- Rosete-Vergés, F.A.; Pérez-Damián, J.L.; Villalobos-Delgado, M.; Navarro-Salas, E.N.; Salinas-Chávez, E.; Remond-Noa, R. El avance de la deforestación en México 1976–2007. Madera y Bosques 2014, 20, 21–35. [Google Scholar] [CrossRef]
- Bonilla-Moheno, M.; Aide, T.M. Beyond deforestation: Land cover transitions in Mexico. Agric. Syst. 2020, 178, 102734. [Google Scholar] [CrossRef]
- INEGI. 2022. Available online: www.inegi.org.mx/temas/agricultura/#Informacion_general (accessed on 9 January 2022).
- Turner, W.R.; Brandon, K.; Brooks, T.M.; Costanza, R.; da Fonseca, G.A.B.; Portela, R. Global conservation of biodiversity and ecosystem services. BioScience 2007, 57, 868–873. [Google Scholar] [CrossRef]
- Suazo-Ortuño, I.; Alvarado-Díaz, J.; Martínez-Ramos, M. Effects of conversion of dry tropical forest to agricultural mosaic on herpetofaunal assemblage. Conserv. Biol. 2008, 22, 362–374. [Google Scholar] [CrossRef]
- Martínez, M.L.; Pérez-Maqueo, O.; Vázquez, G.; Castillo-Campos, G.; García, F.J.; Mehltreter, K.; Equihua, M.; Landgrave, R. Effects of land use change on biodiversity and ecosystem services in tropical montane cloud forests of Mexico. For. Ecol. Manag. 2009, 258, 1856–1863. [Google Scholar] [CrossRef]
- Vesely, D.G.; McComb, W.C. Salamander abundance and amphibian species richness in riparian buffer strips in the Oregon Coast Range. For. Sci. 2002, 48, 291–297. [Google Scholar] [CrossRef]
- Loehle, C.; Wigley, T.B.; Shipman, P.A.; Fox, S.F.; Rutzmoser, S.; Thill, R.E.; Melchiors, M.A. Herpetofaunal species richness responses to forest landscape structure in Arkansas. For. Ecol. Manag. 2005, 209, 193–308. [Google Scholar] [CrossRef]
- Luja, V.H.; López, J.A.; Cruz-Elizalde, R.; Ramírez-Bautista, A. Herpetofauna inside and outside from a natural protected area: The case of Reserva Estatal de la Biósfera Sierra San Juan, Nayarit, Mexico. Nat. Conserv. 2017, 21, 15–38. [Google Scholar] [CrossRef]
- Suazo-Ortuño, I.; Mendoza, E.; Meléndez-Herrera, E. Resiliencia de los vertebrados a la antropización del hábitat. Ecología y conservación de fauna en ambientes antropizados. In Ecología y Conservación de Fauna; Ramírez-Bautista, A., Pineda-Lopez, R., Eds.; Red Temática Biología, Manejo y Conservación de Fauna Nativa en Ambientes Antropizados, Consejo Nacional de Ciencia y Tecnología, Universidad Autónoma de Querétaro: México, Mexico, 2018; pp. 5–16. [Google Scholar]
- Moreno, C.E.; Barragán, F.; Pineda, E.; Pavón, N.P. Reanálisis de la diversidad alfa: Alternativas para interpretar y comparar información sobre comunidades ecológicas. Rev. Mex. Biodivers. 2011, 82, 1249–1261. [Google Scholar] [CrossRef] [Green Version]
- Hooper, D.U.; Chapin, F.S., III; Ewel, J.J.; Hector, A.; Inchausti, P.; Lavorel, S.; Lawton, J.H.; Lodge, D.M.; Loreau, M.; Naeem, S.; et al. Effects of biodiversity on ecosystem functioning: A consensus of current knowledge. Ecol. Monogr. 2005, 75, 3–36. [Google Scholar] [CrossRef]
- Mason, N.W.H.; de Bello, F. Functional diversity: A tool for answering challenging ecological questions. J. Veg. Sci. 2013, 24, 777–780. [Google Scholar] [CrossRef]
- Tilman, D.; Isbell, F.; Cowles, J.M. Biodiversity and ecosystem functioning. Annu. Rev. Ecol. Evol. Syst. 2014, 45, 471–493. [Google Scholar] [CrossRef]
- Orlandi, L.M.; Vinicius, M.; Menezes, D.S. Functional diversity: An overview of its history and applicability. Nat. Conserv. 2015, 13, 112–116. [Google Scholar] [CrossRef]
- Tsianou, M.A.; Kallimanis, A. Geographical patterns and environmental drivers of functional diversity and trait space of amphibians of Europe. Ecol. Res. 2019, 1–16. [Google Scholar] [CrossRef]
- Tsianou, M.A.; Lazarina, M.; Andrikou-Charitidou, A.; Michailidou, D.; Kallimanis, A.S. The Effect of Climate and Human Pressures on Functional Diversity and Species Richness Patterns of Amphibians, Reptiles and Mammals in Europe. Diversity 2021, 13, 275. [Google Scholar] [CrossRef]
- Pough, F.H. Amphibians biology and husbandry. ILAR J. 2007, 48, 203–213. [Google Scholar] [CrossRef]
- Lips, K.R.; Reeve, J.D.; Witters, L.R. Ecological traits predicting amphibian population declines in Central America. Conserv. Biol. 2003, 17, 1078–1088. [Google Scholar] [CrossRef]
- Atauri, J.A.; de Lucio, J.V. The role of landscape structure in species richness distribution of birds, amphibians, reptiles, and lepidopterans in Mediterranean landscapes. Landsc. Ecol. 2001, 16, 147–159. [Google Scholar] [CrossRef]
- Brodman, R.; Parrish, M.; Kraus, H.; Cortwright, S. Amphibian biodiversity recovery in a large-scale ecosystem restoration. Herpetol. Conserv. Biol. 2006, 1, 101–108. [Google Scholar]
- Cortés-Gómez, A.M.; Ruiz-Agudelo, C.A.; Valencia-Aguilar, A.; Ladle, R.J. Ecological functions of neotropical amphibians and reptiles: A review. Univ. Sci. 2015, 2, 229–245. [Google Scholar] [CrossRef] [Green Version]
- Wells, K.D. The Ecology and Behavior of Amphibians; The University of Chicago Press: Chicago, IL, USA, 2007. [Google Scholar]
- Romero, G.Q.; Nomura, F.; Goncalves, A.Z.; Dias, N.Y.N.; Mercier, H.; Conforto, E.D.C.; Rossa-Feres, D.C. Nitrogen fluxes from treefrogs to tank epiphytic bromeliads: An isotopic and physiological approach. Oecologia 2010, 162, 941–949. [Google Scholar] [CrossRef]
- Ranvestel, A.W.; Lips, K.R.; Pringle, C.M.; Whiles, M.R.; Bixby, R.J. Neotropical tadpoles influence stream benthos: Evidence for the ecological consequences of decline in amphibian populations. Freshw. Biol. 2004, 49, 274–285. [Google Scholar] [CrossRef]
- Whiles, M.R.; Lips, K.R.; Pringle, C.M.; Kilham, S.S.; Bixby, R.J.; Brenes, R.; Connelly, S.; Colon-Gaud, J.C.; Hunte-Brown, M.; Huryn, A.D.; et al. The effects of amphibian population decline on the structure and function of Neotropical stream ecosystems. Front. Ecol. Environ. 2006, 4, 27–34. [Google Scholar] [CrossRef]
- Campos, F.S.; Lourenço-de-Moraes, R.; Llorente, G.A.; Solé, M. Cost-effective conservation of amphibian ecology and evolution. Sci. Adv. 2017, 3, e1602929. [Google Scholar] [CrossRef]
- Morelli, F.; Benedetti, Y.; Perna, P.; Santolini, R. Associations among taxonomic diversity, functional diversity, and evolutionary distinctiveness vary among environments. Ecol. Indic. 2018, 88, 8–16. [Google Scholar] [CrossRef]
- McKinney, M.L.; Lockwood, J.L. Biotic homogenization: A few winners replacing many losers in the next mass extinction. Trends Ecol. Evol. 1999, 14, 450–453. [Google Scholar] [CrossRef]
- Ernst, R.; Linsenmair, K.E.; Rodel, M.O. Diversity erosion beyond the species level: Dramatic loss of functional diversity after selective logging in two tropical amphibian communities. Biol. Conserv. 2006, 133, 143–155. [Google Scholar] [CrossRef]
- AmphibiaWeb. Available online: https://amphibiaweb.org (accessed on 10 August 2022).
- Berriozabal-Islas, C.; Badillo-Saldaña, L.M.; Ramírez-Bautista, A.; Moreno, C.E. Effects of habitat disturbance on lizard functional diversity in a tropical dry forest of the Pacific Coast of Mexico. Trop. Conserv. Sci. 2017, 10, 1940082917704972. [Google Scholar] [CrossRef]
- Díaz-García, J.M.; Pineda, E.; López-Barrera, F.; Moreno, C.E. Amphibian species and functional diversity as indicators of restoration success in tropical montane forest. Biodivers. Conserv. 2017, 26, 2569–2589. [Google Scholar] [CrossRef]
- Álvarez-Grzybowska, E.; Urbina-Cardona, N.; Córdova-Tapia, F.; García, A. Amphibian communities in two contrasting ecosystems: Functional diversity and environmental filters. Biodivers. Conserv. 2020, 29, 2457–2485. [Google Scholar] [CrossRef]
- INEGI. Instituto Nacional de Estadística y Geografía. Conjunto de Datos Vectoriales Climatología, Escala 1:250,000, Serie VI. 2019. Available online: www.inegi.org.mx/temas/climatologia/ (accessed on 9 January 2022).
- Castillo-Girón, V.M.; Aceves-Ávila, C.D. Gestión Para la Sustentabilidad del Área Natural Piedras Bola, Ahualulco de Mercado, Jalisco; Universidad de Guadalajara: Jalisco, Mexico, 2007. [Google Scholar]
- INEGI. Instituto Nacional de Estadística y Geografía. Conjunto de Datos Vectoriales de Uso Del Suelo y Vegetación, Escala 1:250,000, Serie VI. 2016. Available online: www.inegi.org.mx/temas/usosuelo/default.html#Descargas/ (accessed on 9 January 2022).
- Rzedowski, J. Vegetación de México; Comisión Nacional para el Conocimiento y Uso de la Biodiversidad: México City, Mexico, 2006; p. 504. Available online: https://www.biodiversidad.gob.mx/publicaciones/librosDig/pdf/VegetacionMxPort.pdf (accessed on 7 September 2022).
- García-Martínez, M.A.; Rodríguez, A. Vegetación y flora fanerogámica del área natural protegida Piedras Bola, Jalisco, México. Polibotánica 2018, 46, 71–90. [Google Scholar]
- Schneider-Maunoury, L.; Lefebvre, V.; Ewers, R.M.; Medina-Rangel, G.F.; Peres, C.A.; Somarriba, E.; Urbina-Cardona, N.; Pfeifer, M. Abundance signals of amphibians and reptiles indicate strong edge effects in Neotropical fragmented forest landscapes. Biol. Conserv. 2016, 200, 207–215. [Google Scholar] [CrossRef]
- Lips, K.R.; Reaser, J.K.; Young, B.E.; Ibáñez, R. Amphibian Monitoring in Latin America: A Protocol Manual; Society for the Study of Amphibians and Reptiles, Herpetological Circular No. 30: Shoreview, MN, USA, 2001; p. 115. [Google Scholar]
- Rendón, S.F.J.; Cedano, M.M. Guía de excursión botánica: Los Guachimontones y humedales de Teuchitlán. In Guía de las Excursiones Botánicas en Jalisco. XVIII Congreso Mexicano; Ramírez, D.R., Reynoso, D.J.J., Rodríguez, C.A., Eds.; Universidad de Guadalajara: Guadalajara, Mexico, 2010; pp. 88–106. [Google Scholar]
- Jost, L. Entropy and diversity. Oikos 2006, 113, 363–375. [Google Scholar] [CrossRef]
- Chao, A.; Kubota, Y.; Zeleny, D.; Chiu, C.; Li, C.; Kusumoto, B.; Yasuhara, M.; Thorn, S.; Wei, C.; Costello, M.J.; et al. Quantifying sample completeness and comparing diversities among assemblages. Ecol. Res. 2020, 35, 292–314. [Google Scholar] [CrossRef]
- Chao, A.; Ma, K.H.; Hsieh, T.C. iNEXT (iNterpolation and EXTrapolation) Online: Software for Interpolation and Extrapolation of Species Diversity. Available online: http://chao.stat.nthu.edu.tw/wordpress/wp-content/uploads/software/iNEXTOnline_UserGuide.pdf (accessed on 9 January 2022).
- Laliberte, E.; Legendre, P. A distance-based framework for measuring functional diversity from multiple traits. Ecology 2010, 9, 299–305. [Google Scholar] [CrossRef]
- Laliberte, E.; Legendre, P.; Shipley, B. FD Measuring Functional Diversity from Multiple Traits, and Other Tools for Functional Ecology. R Package Version 1.0–12. 2014. Available online: https://cran.r-project.org/web/packages/FD/FD.pdf (accessed on 9 January 2022).
- RStudio Team. RStudio: Integrated Development for R. Computer Software v0.98.1074. Available online: www.rstudio.com/ (accessed on 9 January 2022).
- Kembel, S.W.; Cowan, P.D.; Helmus, M.R.; Cornwell, W.K.; Morlon, H.; Ackerly, D.D.; Blomberg, S.P.; Webb, C.O. Picante: R tools for integrating phylogenies and ecology. Bioinformatics 2010, 26, 1463–1464. [Google Scholar] [CrossRef]
- Gotelli, N.J.; Entsminger, G.L. Swap algorithms in null model analysis. Ecology 2003, 84, 532–535. [Google Scholar] [CrossRef]
- Anderson, M.J.; Gorley, R.N.; Clarke, K.R. PERMANOVA+ for PRIMER: Guide to Software and Statistical Methods; PRIMER-E: Plymouth, UK, 2008. [Google Scholar]
- Clarke, K.R.; Gorley, R.N.; Somerfield, P.J.; Warwick, R.M. Change in Marine Communities: An Approach to Statistical Analysis and Interpretation, 3rd ed.; PRIMER-E Ltd.: Plymouth, UK, 2014. [Google Scholar]
- Marroquín-Páramo, J.A.; Suazo-Ortuño, I.; Mendoza, E.; Alvarado-Díaz, J.; Siliceo-Cantero, H.H. Herpetofaunal diversity in avocado orchards and in conserved habitats in Michoacán, Mexico. Rev. Mex. Biodivers. 2017, 88, 234–240. [Google Scholar] [CrossRef]
- Bellard, C.; Bertelsmeier, C.; Leadley, P.; Thuiller, W.; Courchamp, F. Impacts of climate change on the future of biodiversity. Ecol. Lett. 2012, 15, 365–377. [Google Scholar] [CrossRef]
- Mason, N.W.H.; Mouillot, D.; Lee, W.G.; Wilson, J.B. Functional richness, functional evenness and functional divergence: The primary components of functional diversity. Oikos 2005, 111, 112–118. [Google Scholar] [CrossRef]
- Luna-Gómez, M.I.; García, A.; Santos-Barrera, G. Spatial and temporal distribution and microhabitat use of aquatic breeding amphibians (Anura) in a seasonally dry tropical forest in Chamela, Mexico. Rev. Biol. Trop. 2017, 65, 1082–1094. [Google Scholar] [CrossRef] [Green Version]
- Villéger, S.; Ramos, M.J.; Flores, H.D.; Mouillot, D. Contrasting changes in taxonomic vs. functional diversity of tropical fish communities after habitat degradation. Ecol. Appl. 2010, 20, 1512–1522. [Google Scholar] [CrossRef]
- Córdova-Tapia, F.; Zambrano, L. La diversidad funcional en la ecología de comunidades. Ecosistemas 2015, 24, 78–87. [Google Scholar] [CrossRef]
- Mouchet, M.A.; Villéger, S.; Mason, N.W.H.; Mouillot, D. Functional diversity measures: An overview of their redundancy and their ability to discriminate community assembly rules. Funct. Ecol. 2010, 24, 867–876. [Google Scholar] [CrossRef]
- Sun, Z.; Zhao, C.; Zhu, W.; Zhu, W.; Feng, J.; Su, S.; Zhao, T. Microhabitat features determine the tadpole diversity in mountainous streams. Ecol. Indic. 2021, 126, 107647. [Google Scholar] [CrossRef]
- Villacampa, J.; Whitworth, A.; Allen, L.; Malo, J.E. Altitudinal differences in Alpha, beta and functional diversity of an amphibian community in a biodiversity hotspot. Neotrop. Biodivers. 2019, 5, 60–68. [Google Scholar] [CrossRef]
- Fisher, J.; Lindenmayer, D.B. Landscape modification and habitat fragmentation: A synthesis. Glob. Ecol. Biogeogr. 2007, 16, 265–280. [Google Scholar] [CrossRef]
- Cortés-Gómez, A.M.; Castro-Herrera, F.; Urbina-Cardona, J.N. Small changes in vegetation structure create great changes in amphibian ensembles in the Colombian Pacific rainforest. Trop. Conserv. Sci. 2013, 6, 749–769. [Google Scholar] [CrossRef]
- Tuff, K.T.; Tuff, T.; Davies, K.F. A framework for integrating thermal biology into fragmentation research. Ecol. Lett. 2016, 19, 361–374. [Google Scholar] [CrossRef]
- Thompson, M.E.; Donnelly, M.A. Effects of Secondary Forest Succession on Amphibians and Reptiles: A Review and Meta-analysis. Copeia 2018, 106, 10–19. [Google Scholar] [CrossRef]
- Kanowski, J.J.; Reis, T.M.; Catterall, C.P.; Piper, S.D. Factors affecting the use of reforested sites by reptiles in cleared rainforest landscapes in tropical and subtropical Australia. Restor. Ecol. 2006, 14, 67–76. [Google Scholar] [CrossRef] [Green Version]
- Brain, R.A.; Solomon, K.R. Comparison of the hazards posed to amphibians by glyphosate spray control program versus the chemical and physical activities of coca production in Colombia. J. Toxicol. Environ. Health 2009, 72, 937–948. [Google Scholar] [CrossRef]
- Suazo-Ortuño, I.; Alvarado-Díaz, J.; Mendoza, E.; López-Toledo, L.; Lara-Uribe, N.; Márquez-Camargo, C.; Paz-Gutiérrez, J.G.; Rangel-Orozco, J.D. High resilience of herpetofaunal communities in a human-modified tropical dry forest landscape in western Mexico. Trop. Conserv. Sci. 2015, 8, 396–423. [Google Scholar] [CrossRef]
- Ochoa-Ochoa, L.M.; Flores-Villela, O.A. Áreas de Diversidad y Endemismo de la Herpetofauna Mexicana; Universidad Nacional Autónoma de México-CONABIO: México City, Mexico, 2006. [Google Scholar]
- Haddad, C.F.B.; Prado, C.P.A. Reproductive modes in frogs and their unexpected diversity in the Atlantic Forest of Brazil. BioScience 2005, 55, 207–217. [Google Scholar] [CrossRef]
- Richards-Zawacki, C.L. Effects of slope and riparian habitat connectivity on gene flow in an endangered Panamanian frog, Atelopus varius. Divers. Distrib. 2009, 15, 796–806. [Google Scholar] [CrossRef]
- Ficelota, G.F.; Padoa-Schioppa, E.; Bernardi, F. Influence of landscape elements in riparian buffers on the conservation of semiaquatic amphibians. Conserv. Biol. 2009, 23, 114–123. [Google Scholar] [CrossRef]
- IUCN. IUCN SSC Amphibian Specialist Group. 2021. Available online: www.iucn-amphibians.org/ (accessed on 13 December 2021).
- Suazo-Ortuño, I.; Alvarado-Díaz, J.; Martínez-Ramos, M. Riparian areas and conservation of herpetofauna in a tropical dry forest in western Mexico. Biotropica 2011, 43, 237–245. [Google Scholar] [CrossRef]
- Roach, N.S.; Urbina-Cardona, N.; Lacher, T., Jr. Land cover drives amphibian diversity across steep elevational gradients in an isolated neotropical mountain range: Implications for community conservation. Glob. Ecol. Conserv. 2020, 22, e00968. [Google Scholar] [CrossRef]
- Gardner, T.; Barlow, J.; Peres, C.A. Paradox, presumption, and pitfalls in conservation biology: The importance of habitat change for amphibians and reptiles. Biol. Conserv. 2007, 138, 166–179. [Google Scholar] [CrossRef]
- Melo, F.P.L.; Arroyo-Rodríguez, V.; Fahrig, L.; Martínez-Ramos, M.; Tabarelli, M. On the hope for biodiversity-friendly tropical landscapes. Trends Ecol. Evol. 2013, 28, 462–468. [Google Scholar] [CrossRef]
- Cortés-Gómez, A.M.; Ramírez, P.M.P.; Urbina, C.N. Protocolo para la medición de rasgos funcionales en anfibios. In La Ecología Funcional Como Aproximación al Estudio, Manejo y Conservación de la Biodiversidad: Protocolos y Aplicaciones; Salgado-Negret, B., Ed.; Instituto de Investigación de Recursos Biológicos Alexander von Humboldt: Bogotá, DC, Colombia, 2015; pp. 127–179. [Google Scholar]


Publisher’s Note: MDPI stays neutral with regard to jurisdictional claims in published maps and institutional affiliations. |
© 2022 by the authors. Licensee MDPI, Basel, Switzerland. This article is an open access article distributed under the terms and conditions of the Creative Commons Attribution (CC BY) license (https://creativecommons.org/licenses/by/4.0/).
Share and Cite
Rosas-Espinoza, V.C.; Peña-Joya, K.E.; Álvarez-Grzybowska, E.; Godoy-González, A.A.; Santiago-Pérez, A.L.; Rodríguez-Zaragoza, F.A. Amphibian Taxonomic and Functional Diversity in a Heterogeneous Landscape of West-Central Mexico. Diversity 2022, 14, 738. https://doi.org/10.3390/d14090738
Rosas-Espinoza VC, Peña-Joya KE, Álvarez-Grzybowska E, Godoy-González AA, Santiago-Pérez AL, Rodríguez-Zaragoza FA. Amphibian Taxonomic and Functional Diversity in a Heterogeneous Landscape of West-Central Mexico. Diversity. 2022; 14(9):738. https://doi.org/10.3390/d14090738
Chicago/Turabian StyleRosas-Espinoza, Verónica Carolina, Karen Elizabeth Peña-Joya, Eliza Álvarez-Grzybowska, Arquímedes Alfredo Godoy-González, Ana Luisa Santiago-Pérez, and Fabián Alejandro Rodríguez-Zaragoza. 2022. "Amphibian Taxonomic and Functional Diversity in a Heterogeneous Landscape of West-Central Mexico" Diversity 14, no. 9: 738. https://doi.org/10.3390/d14090738