Article

Phylogeography of Mesophotic Coral Ecosystems: Squirrelfish and Soldierfish (Holocentriformes: Holocentridae)

1
Hawai‘i Institute of Marine Biology, University of Hawai‘i, Kaneohe, HI 96744, USA
2
Center for the Exploration of Coral Reef Ecosystems (XCoRE), Bernice P. Bishop Museum, Honolulu, HI 96817, USA
3
Hawai‘i Biological Survey, Bernice P. Bishop Museum, Box 19000-A, Honolulu, HI 96817, USA
4
Papahānaumokuākea Marine National Monument, National Oceanic and Atmospheric Administration, Honolulu, HI 96818, USA
*
Author to whom correspondence should be addressed.
These authors share first authorship.
Deceased.
Diversity 2022, 14(8), 691; https://doi.org/10.3390/d14080691
Submission received: 15 July 2022 / Revised: 11 August 2022 / Accepted: 15 August 2022 / Published: 21 August 2022
(This article belongs to the Special Issue Biodiversity of Mesophotic Ecosystems)

Abstract

:
Mesophotic coral ecosystems (MCEs: ~30 to 100+ m depth) may be older and more stable than shallow coral ecosystems that are more prone to disturbances in both the long term (glacial sea level cycles) and short term (heavy weather and anthropogenic activities). Here, we assess the phylogeography of two MCE fishes, the soldierfish Myripristis chryseres (N = 85) and the squirrelfish Neoniphon aurolineatus (N = 74), with mtDNA cytochrome oxidase C subunit I. Our goal is to resolve population genetic diversity across the Central and West Pacific and compare these patterns to three shallow-reef species in the same taxonomic family (Holocentridae). Significant population structure (ΦST = 0.148, p = 0.01) was observed in N. aurolineatus, while no structure was detected in M. chryseresST = −0.031, p = 0.83), a finding that matches the shallow-water congener M. berndtiST = −0.007, p = 0.63) across the same range. Nucleotide diversity in the MCE fishes was low (π = 0.0024–0.0028) compared to shallow counterparts (π = 0.003–0.006). Coalescence times calculated for M. chryseres (~272,000 years) and N. aurolineatus (~284,000 years) are more recent or comparable to the shallow-water holocentrids (~220,000–916,000 years). We conclude that the shallow genetic coalescence characteristic of shallow-water marine fishes cannot be attributed to frequent disturbance. We see no evidence from holocentrid species that MCEs are older or more stable habitats.

1. Introduction

Evaluating how marine biodiversity is shaped by geography, oceanography, climate, and natural history requires an understanding of the distribution of genetic diversity [1,2]. While every case is unique, documenting genetic partitions can reveal common drivers of biodiversity across various geographic scales. For example, Toonen et al. [3] documented concordant genetic breaks based on 27 invertebrate and vertebrate species in the Hawaiian Archipelago (see also [4]). Timm et al. [5], Barber et al. [6], Carpenter et al. [7], and Gaither & Rocha [8] discerned shared genetic breaks in the Coral Triangle and the wider Indo-Pacific, shedding light on factors that generate and maintain species diversity (see [9]).
Phylogeographic patterns of tropical marine organisms are extensively documented. However, most of this work is focused on the shallowest zones of the oceans, either in coastal waters or among the commercially valuable epipelagic fishes e.g., [10]. In particular, almost all genetic surveys of coral reef fishes are restricted to shallow habitats (<30 m). Yet, light-dependent coral ecosystems extend past 30 m, even down to 150 m. These mesophotic coral ecosystems (MCEs) [11] share some fishes and invertebrates with the shallow zone, but also have a unique fauna restricted to the deeper reefs [12,13,14,15,16,17]. Very little is known about the phylogeography of organisms that inhabit MCEs, primarily due to the logistical and physiological constraints (time and depth limits) of sampling with scuba diving [18]. Indeed, those phylogeographic studies that have been accomplished below 30 m have been largely restricted to fishes that can be collected with hook and line, e.g., [19,20,21].
There are several reasons to suspect that MCE organisms may have phylogeographic patterns that are fundamentally different from their shallow-water counterparts. MCEs could provide refugia from the impacts of storms and anthropogenic stressors [22,23]—but see [24]—and MCEs may be more stable over both ecological and evolutionary timeframes [25,26]. In particular, MCEs reside largely below the zone extirpated by glacial cycles of sea level rise and fall, which encompass up to 120 m of the water column [27]. Stabler habitats would be expected to have older communities, relative to the shallow coalescence observed in most shallow-water organisms [28].
One group of fishes suited to comparing phylogeographic trends in shallow-water and mesophotic reef organisms are the Holocentridae (Beryciformes). This group of nocturnal fishes are characteristically red or silvery in color, with large eyes, large mouths, and coarse ctenoid scales [29]. Two circumtropical sub-families—Holocentrinae (squirrelfishes) and Myripristinae (soldierfishes)—comprise well-supported evolutionary lineages that diverged approximately 55 million years before the present day (BP) [30,31]. There are both shallow and mesophotic specialists in each sub-family, but as with most fish taxa, studies are restricted to shallow species. Phylogeographic studies of Myripristis berndti [32], a shallow water soldierfish, reveal a population structure on the broad scale of the Indian Ocean versus Central-West Pacific versus East Pacific. In the tropical Atlantic, the squirrelfish Holocentrus adscensionis has a low but significant population structure on the scale of ocean basins (Caribbean Sea versus Brazil, mid-Atlantic ridge, and Gulf of Guinea (East Atlantic)), while the soldierfish Myripristis jacobus has no population structure across the same range [33]. The three holocentrids surveyed to date show little population structure, indicating extensive larval dispersal, possibly facilitated by a post-larval stage that remains in the water column [34]. The mtDNA networks for all three species reveal many closely related haplotypes and low nucleotide diversity (π = 0.003–0.006), indicating late Pleistocene coalescence of mtDNA lineages.
In the present study, we compare phylogeographic patterns between mesophotic and shallow-water fishes. We collected two species of MCE holocentrids, the Yellowfin Soldierfish Myripristis chryseres (Jordan and Evermann 1903) and the Yellowstriped Squirrelfish Neoniphon aurolineatus (Liénard 1839), across the Hawaiian Archipelago and elsewhere in the Pacific. The nocturnal Yellowfin Soldierfish is occasionally found in shallow water, but typically inhabits depths of 30–235 m in tropical waters from Africa to Hawai‘i [35]. This has been observed with coelacanths in caves of the western Indian Ocean at depths > 180 m [36]. The Yellowstriped Squirrelfish is also nocturnal, with a similar distribution across the Indo-Pacific at depths of 30–190 m [37]. Both species sampled in this study were found only in the lowest mesophotic zone (>90–150 m), while the three species we compare them to (M. berndti, M. jacobus, and H. adscensionis) were found exclusively in shallower strata, based on 317 transects conducted from 0–150 m in the Pacific and Western Atlantic [24]. By comparing phylogeographic patterns among these species, we hope to provide the first steps towards a true comparative assessment of mesophotic phylogeography.

2. Materials and Methods

2.1. Specimen Collection and DNA Extraction

Tissue samples were collected throughout the Hawaiian Archipelago, Johnston Atoll, Pohnpei, and the Philippines (Figure 1) for M. chryseres (N = 85) and N. aurolineatus (N = 74). Fish were collected with a pole spear on a closed-circuit rebreather from 2012 to 2018 at 50–80 m depth. Tissue samples were stored in saturated salt-dimethylsufoxide (DMSO) buffer [38]. Total genomic DNA was extracted from all specimens using the “HotSHOT” protocol [39] and stored at −20 °C for later amplification.

2.2. PCR and Sequencing

A segment of the mitochondrial DNA (mtDNA) cytochrome oxidase C subunit 1 (COI) was resolved using fish-specific primers, FishF2 and FishR2 [40]. When these primers did not amplify, overlapping FISH BCL and FISH BCH primers [41] were used instead.
Polymerase chain reaction (PCR) was performed in a 15 μL reaction containing 7.5 μL BioMixTM Red (Bioline Inc., Springfield, NJ, USA), 0.2 μM of each primer, 5–50 ng template DNA, and nanopure water (Thermo Scientific, Barnstead, Dubuque, IA, USA) to volume. PCR cycling parameters were as follows: initial 95 °C denaturation for 10 min, followed by 35 cycles of 94 °C for 30 s, annealing temperature 55 °C in all cases for 30 s, and 72 °C for 30 s, followed by a final extension of 72 °C for 10 min. PCR products were visualized using a 1.5% agarose gel with GelRedTM (Biotium®, Freemont, CA, USA) and then cleaned by incubating with 0.75 units of Exonuclease and 0.5 units of Shrimp Alkaline Phosphatase (ExoSAP; USB®, Cleveland, OH, USA) per 7.5 μL of PCR product for 30 min. at 37 °C, followed by 85 °C for 15 min. Sequencing was conducted in the forward and reverse direction using a genetic analyzer (ABI 3730XL, Applied Biosystems, Foster City, CA, USA) at the ASGPB Genomics Sequencing Facility at the University of Hawai‘i at Mānoa. The sequences were aligned, edited, and trimmed to a common length using Geneious Pro v.10.2.6 DNA analysis software (Biomatters Ltd., Auckland, New Zealand).

2.3. Data Analysis

Sequence alignment data were imported into the R [42] environment using the ‘Biostrings’ [43] and ‘ape’ [44] packages. The number of segregating sites and unique haplotypes, as well as haplotype diversity (h), nucleotide diversity (π) and Tajima’s D, were calculated at all sampling locations for each species using the ‘ape’ and ‘pegas’ [45] packages, while Fu’s F was calculated using the ‘hfufs’ package [46]. To assess the level of geographic structure across our sampling locations, analyses of molecular variance (AMOVA) were performed using ‘pegas’. If the AMOVA determined there was significant structure among sampling locations, pairwise ΦST values were calculated for populations with a minimum of five samples using the ‘haplotypes’ package [47]. The p-values for pairwise ΦST comparisons were adjusted using the Benjamini and Yekutieli [48] modified false discovery rate (B-Y FDR), as discussed by Narum [49], using the function p.adjust in R.
To infer the population histories and coalescence times of each species, we performed Bayesian skyline analyses in BEAST v2.6.0 [50]. We allowed BEAST to iterate over all possible molecular evolution models and choose the model with the highest likelihood given the data, as implemented in the bModelTest package [51]. We performed 120–170 million simulations using a strict clock model for each species, discarding the first 10% of results as burn-in. Our present data are mtDNA COI sequences, and the rate of 2% per million years estimated in previous studies was based on the mtDNA cytochrome b (cytb) gene. Comparisons between the two loci indicate similar mutation rates, albeit slightly higher (but not significantly different) in cytb [52,53]. Both are non-recombining protein-coding regions in the same metabolic pathway that are linked and inherited as a unit. Thus, we used the same molecular clock rate (2%/Ma) as that applied in previous studies of holocentrids [32,33], and, in addition, we ran analyses using a clock rate of 1.6% per million years, an estimate for COI derived from geminate species pairs separated by the Isthmus of Panama [54]. As those previous studies based divergence time estimates on values of τ and θ from Arlequin analyses, we reanalyzed the respective datasets in BEAST to ensure equivalence when making comparisons. We confirmed convergence of MCMC runs and model parameters in BEAST analyses using TRACER v1.7.2 [55].
Haplotype networks were constructed for our two study species to visualize the relationship between sampled haplotypes and their prevalence by location. These were also plotted on a composite plot containing reproduced haplotype networks from the three previously studied species to compare the topologies by depth zone and sub-family. Data from previous studies [32,33] were extracted from the original Arlequin [56] files, converted into FASTA format using PGDSpider [57], and imported into R as described above. All haplotype networks were created using ‘pegas’ and plotted using the ‘ggplot2′ [58], ‘colorRamps’ [59], ‘patchwork’ [60], and ‘magick’ [61] R packages.
New sequences generated for this study were deposited in GenBank (accession numbers ON998515–ON998673). GenBank accession numbers for previously published sequencing data are available in the original publications.

3. Results

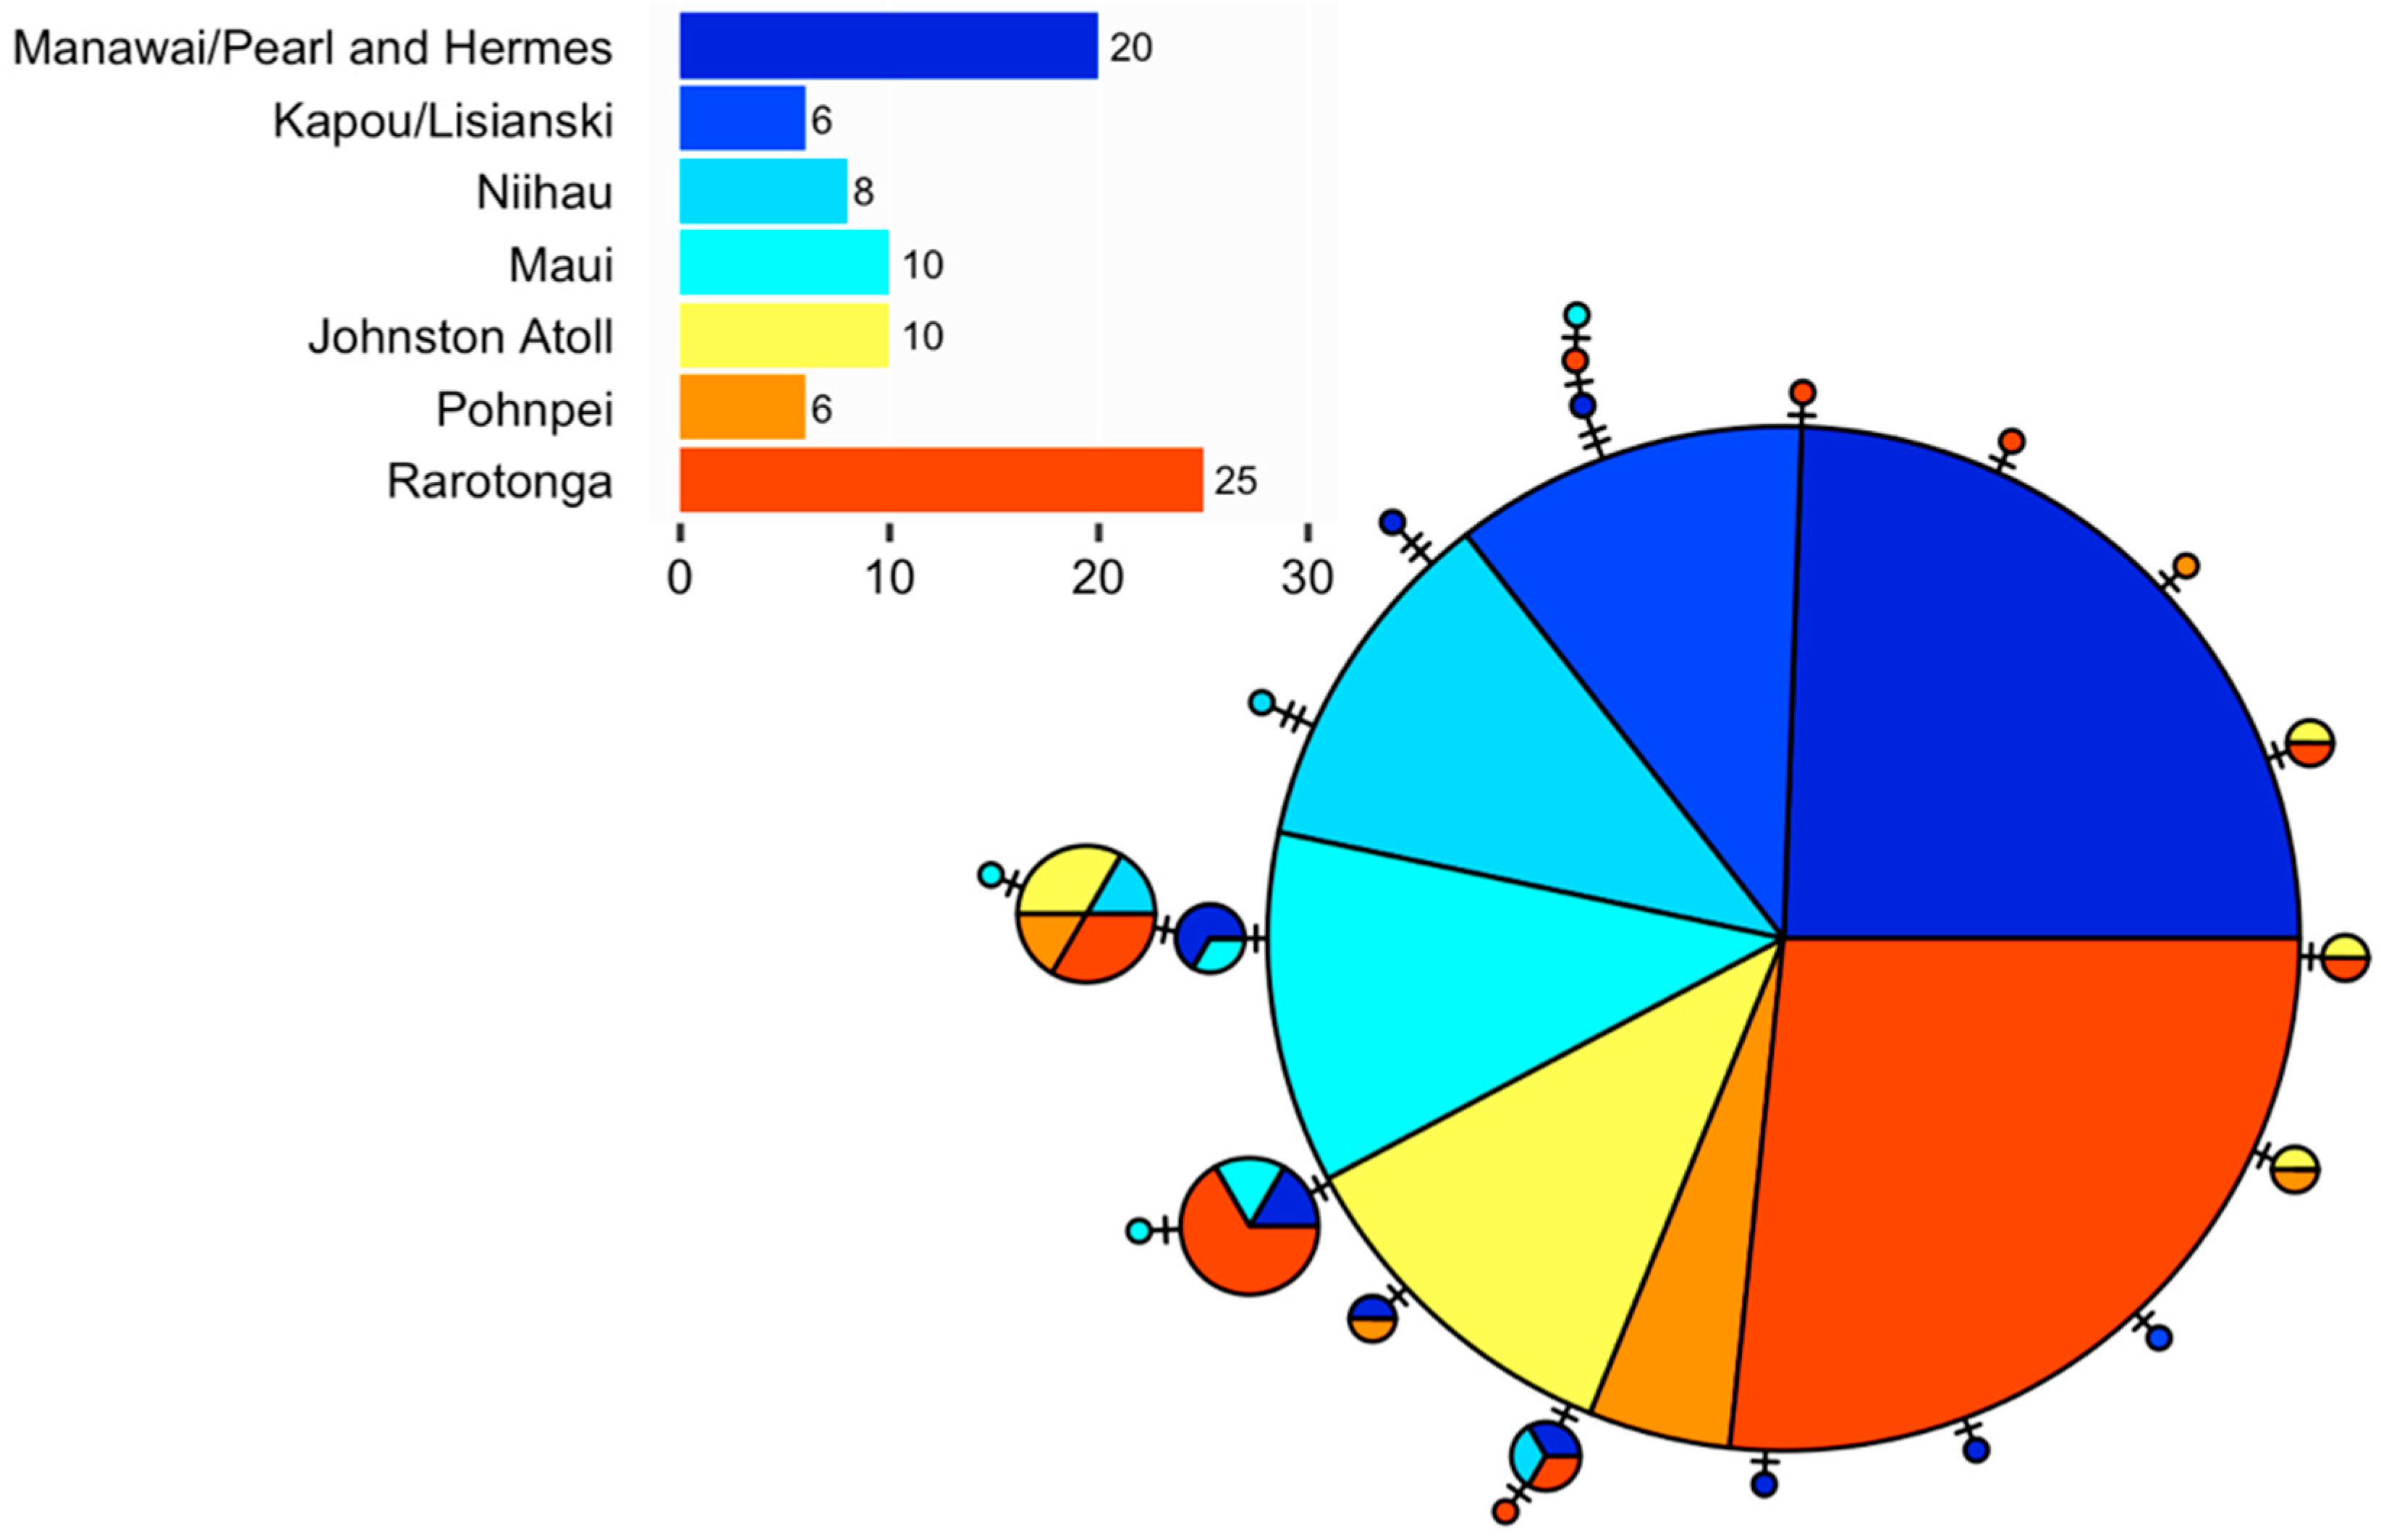
3.1. Myripristis Chryseres

We resolved 530 bp of mtDNA COI containing 20 polymorphic sites and 23 unique haplotypes (Table 1). The most common haplotype was found at every location (Figure 2). Overall haplotype diversity (h) was 0.712 and nucleotide diversity (π) was 0.0024. Haplotype diversity was greatest in Pohnpei, nucleotide diversity was greatest in Maui, and both measures of diversity were lowest at Kapou/Lisianski. Tajima’s D and Fu’s F were negative at each individual location and overall. There was no geographic structure detected across sampling locations (AMOVA: global ΦST = −0.031, p = 0.830). A continuous expansion was inferred for this species based on Bayesian skyline analysis (Supplemental Figure S1), and the lineages sampled in this study coalesced at ~272,000 years BP (95% HPD: 87,000–537,000 years) (Figure 3). BEAST runs were fully converged and all model parameters had ESS values > 200. Here and below, we report coalescence results based on the 1.6%/Ma mutation rate, but they do not differ substantially from those based on 2.0%/Ma. For complete coalescence results, see Supplemental Table S1.

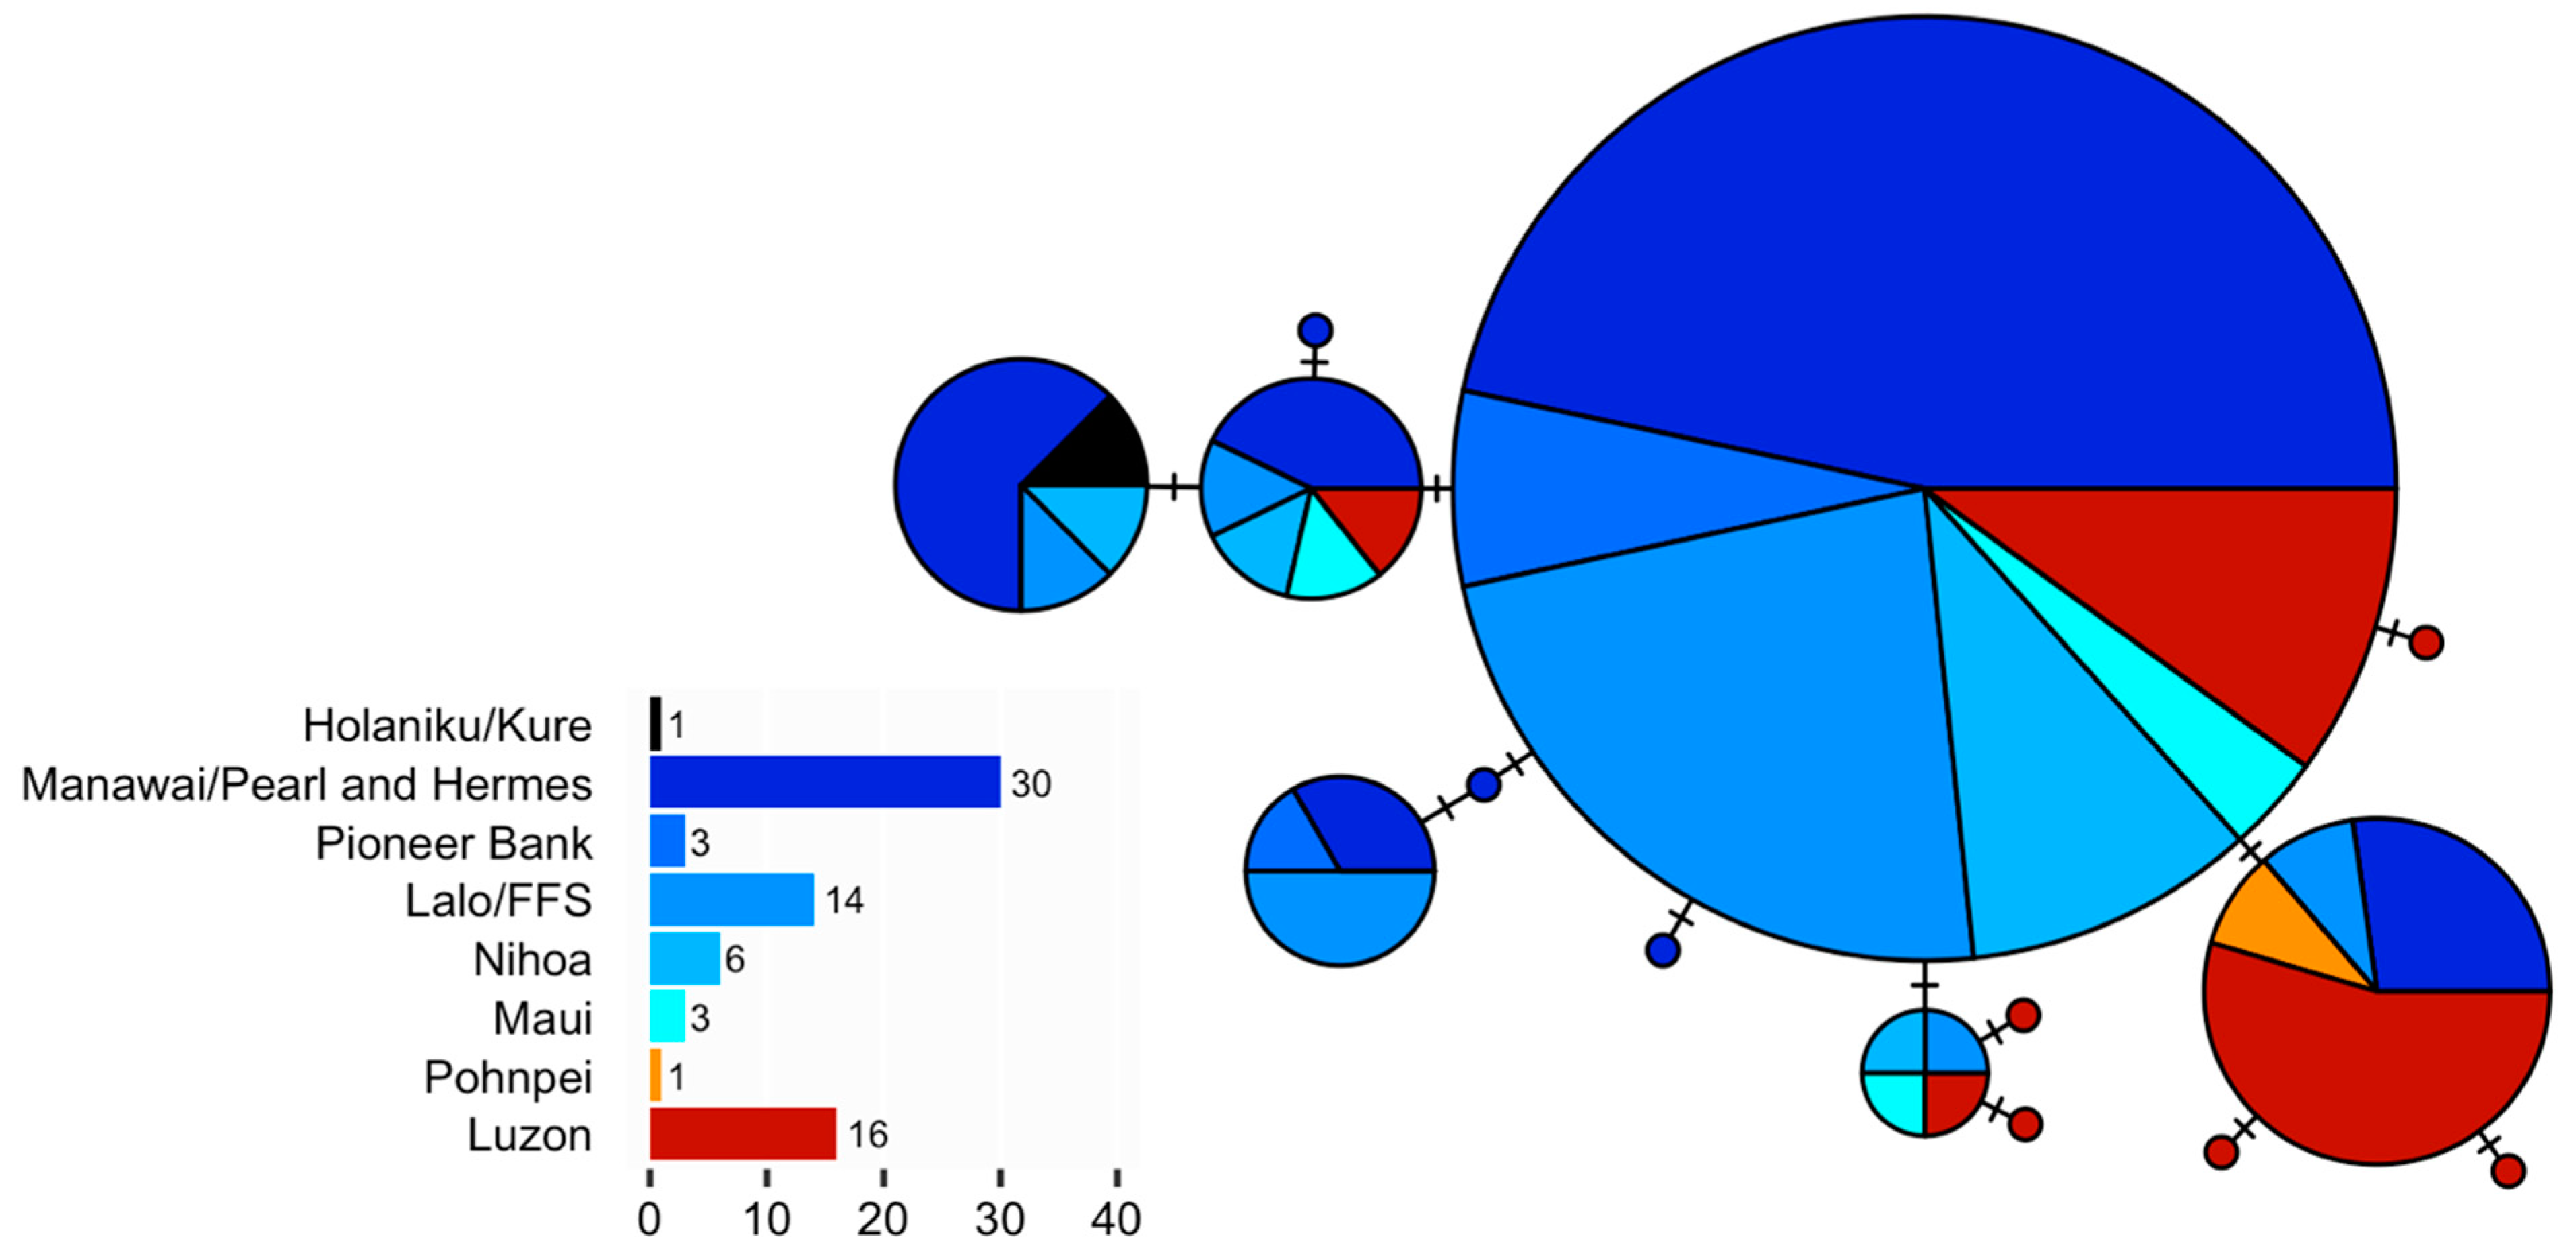
3.2. Neoniphon Aurolineatus

We resolved 539 bp of COI for Neoniphon aurolineatus. The 77 sequences contained 12 polymorphic sites and 14 haplotypes (Table 2). The most common haplotype was observed at every location where at least two individuals were sampled (Figure 4). Overall haplotype diversity (h) was 0.793 and nucleotide diversity (π) was 0.0028. All three specimens in Maui had different haplotypes, while Luzon had the next highest haplotype and highest nucleotide diversity. Tajima’s D and Fu’s F were negative overall and at every location where more than four individuals were sampled.
Significant overall geographic population structure was detected (AMOVA: global ΦST = 0.148, p = 0.009). Pairwise ΦST was only significant between Luzon and both Lalo/French Frigate Shoals (ΦST = 0.131, p = 0.005) and Manawai/Pearl and Hermes (ΦST = 0.151, p = 0.001) after B-Y FDR correction (6 comparisons: p < 0.008). ΦST was similarly high between Luzon and less-sampled (n = 6) Nihoa (ΦST = 0.123), and was nearly significant (p = 0.05). Values of ΦST were less than 0.005 between Hawaiian locations. A continuous expansion was inferred for this species based on Bayesian skyline analysis (Supplemental Figure S1), and the lineages sampled in this study coalesce at ~284,000 years BP (95% HPD: 77,000–546,000 years) (Figure 3). BEAST runs were fully converged and all model parameters had ESS values > 200.

3.3. Multi-Species Haplotype Network Comparison

Both mesophotic species have similar haplotype network topologies, haplotype diversity, and nucleotide diversity (Figure 5). Two of three Myripristinae species (Myripristis chryseres and M. jacobus) also have similar network topologies: one central haplotype comprising most individuals and sampling areas, with many closely related, less frequent haplotypes. Myripristis berndti had two haplotypes found at almost all locations (but this network was built with nearly three times more samples than collected for any species in the present study). Holocentrus adscensionis has at least twice as much nucleotide diversity and considerably greater haplotype diversity than Neoniphon aurolineatus or the Myripristinae species.

4. Discussion

Specimens of the deep-reef holocentrids M. chryseres and N. aurolineatus were collected across the Hawaiian Archipelago and elsewhere in the Pacific to resolve phylogeographic patterns in mesophotic fishes and to compare genetic architecture between deep- and shallow-water holocentrids. Data from congeneric surrogates indicate that these two species may have similar dispersal patterns. Tyler et al. [34] estimated a pelagic larval duration (PLD) of 40–58 d for the Atlantic species M. jacobus. Lefèvre and Lecomte-Finiger [63] estimated a PLD of 38–59 d for the Pacific species Neoniphon sammara. Despite putative similarity in larval duration, the two species have distinctly different population structures across the Central and West Pacific: ΦST = 0.151 (p = 0.009) for N. aurolineatus, while no structure was detected in M. chryseresST = 0.000, p = 0.830). In both this study and previous studies, species in the Myripristinae sub-family appear to be more dispersive than members of the Holocentrinae sub-family.
The comparative phylogeography of MCE fishes can address several issues pertinent to these understudied ecosystems. Reefs of the Indo-Pacific are subject to glacio-eustatic sea level changes up to 120 m below contemporary levels, so that shallow reefs may be displaced on a cycle of 105–106 years [64,65,66]. Fauvelot et al. [67] were among the first to suggest that low mtDNA diversity in marine fishes might be due to these sea level fluctuations. Ludt et al. [68] hypothesized that lagoon species have shallower genetic histories than fore-reef species for similar reasons, although they were unable to show such differences between Halichoeres wrasses. Delrieu-Trottin et al. [69] reported that shallow coalescences dominated the endemic reef fish fauna of Rapa Nui (Easter Island). Ludt and Rocha [27] documented that up to 92% of shallow habitat is lost in some regions of the world during sea level lows. Based on these observations, Pyle and Copus [25] and Copus et al. [26] suggested that populations in MCEs may be older and more stable than those of shallow-water congenerics. If correct, the stability of MCE populations should be apparent in genetic signatures such as coalescence times, as older, more stable populations would have higher levels of genetic diversity [70]. There is also a tendency for deep-water organisms to be highly dispersive, having little to no population structure across ocean basins [20,21,71,72]. Here, we tested both predictions (older and more dispersive populations) against the existing body of population genetic literature on the Holocentridae family.
The only other genetic survey of MCE fishes is Tenggardjaja et al. [73]. They examined the phylogeographic patterns of Chromis verater across the Hawaiian Archipelago, a species that occupies upper MCEs, as well as shallow reefs. No genetic structure was observed between deep and shallow populations, or among locations across the archipelago.

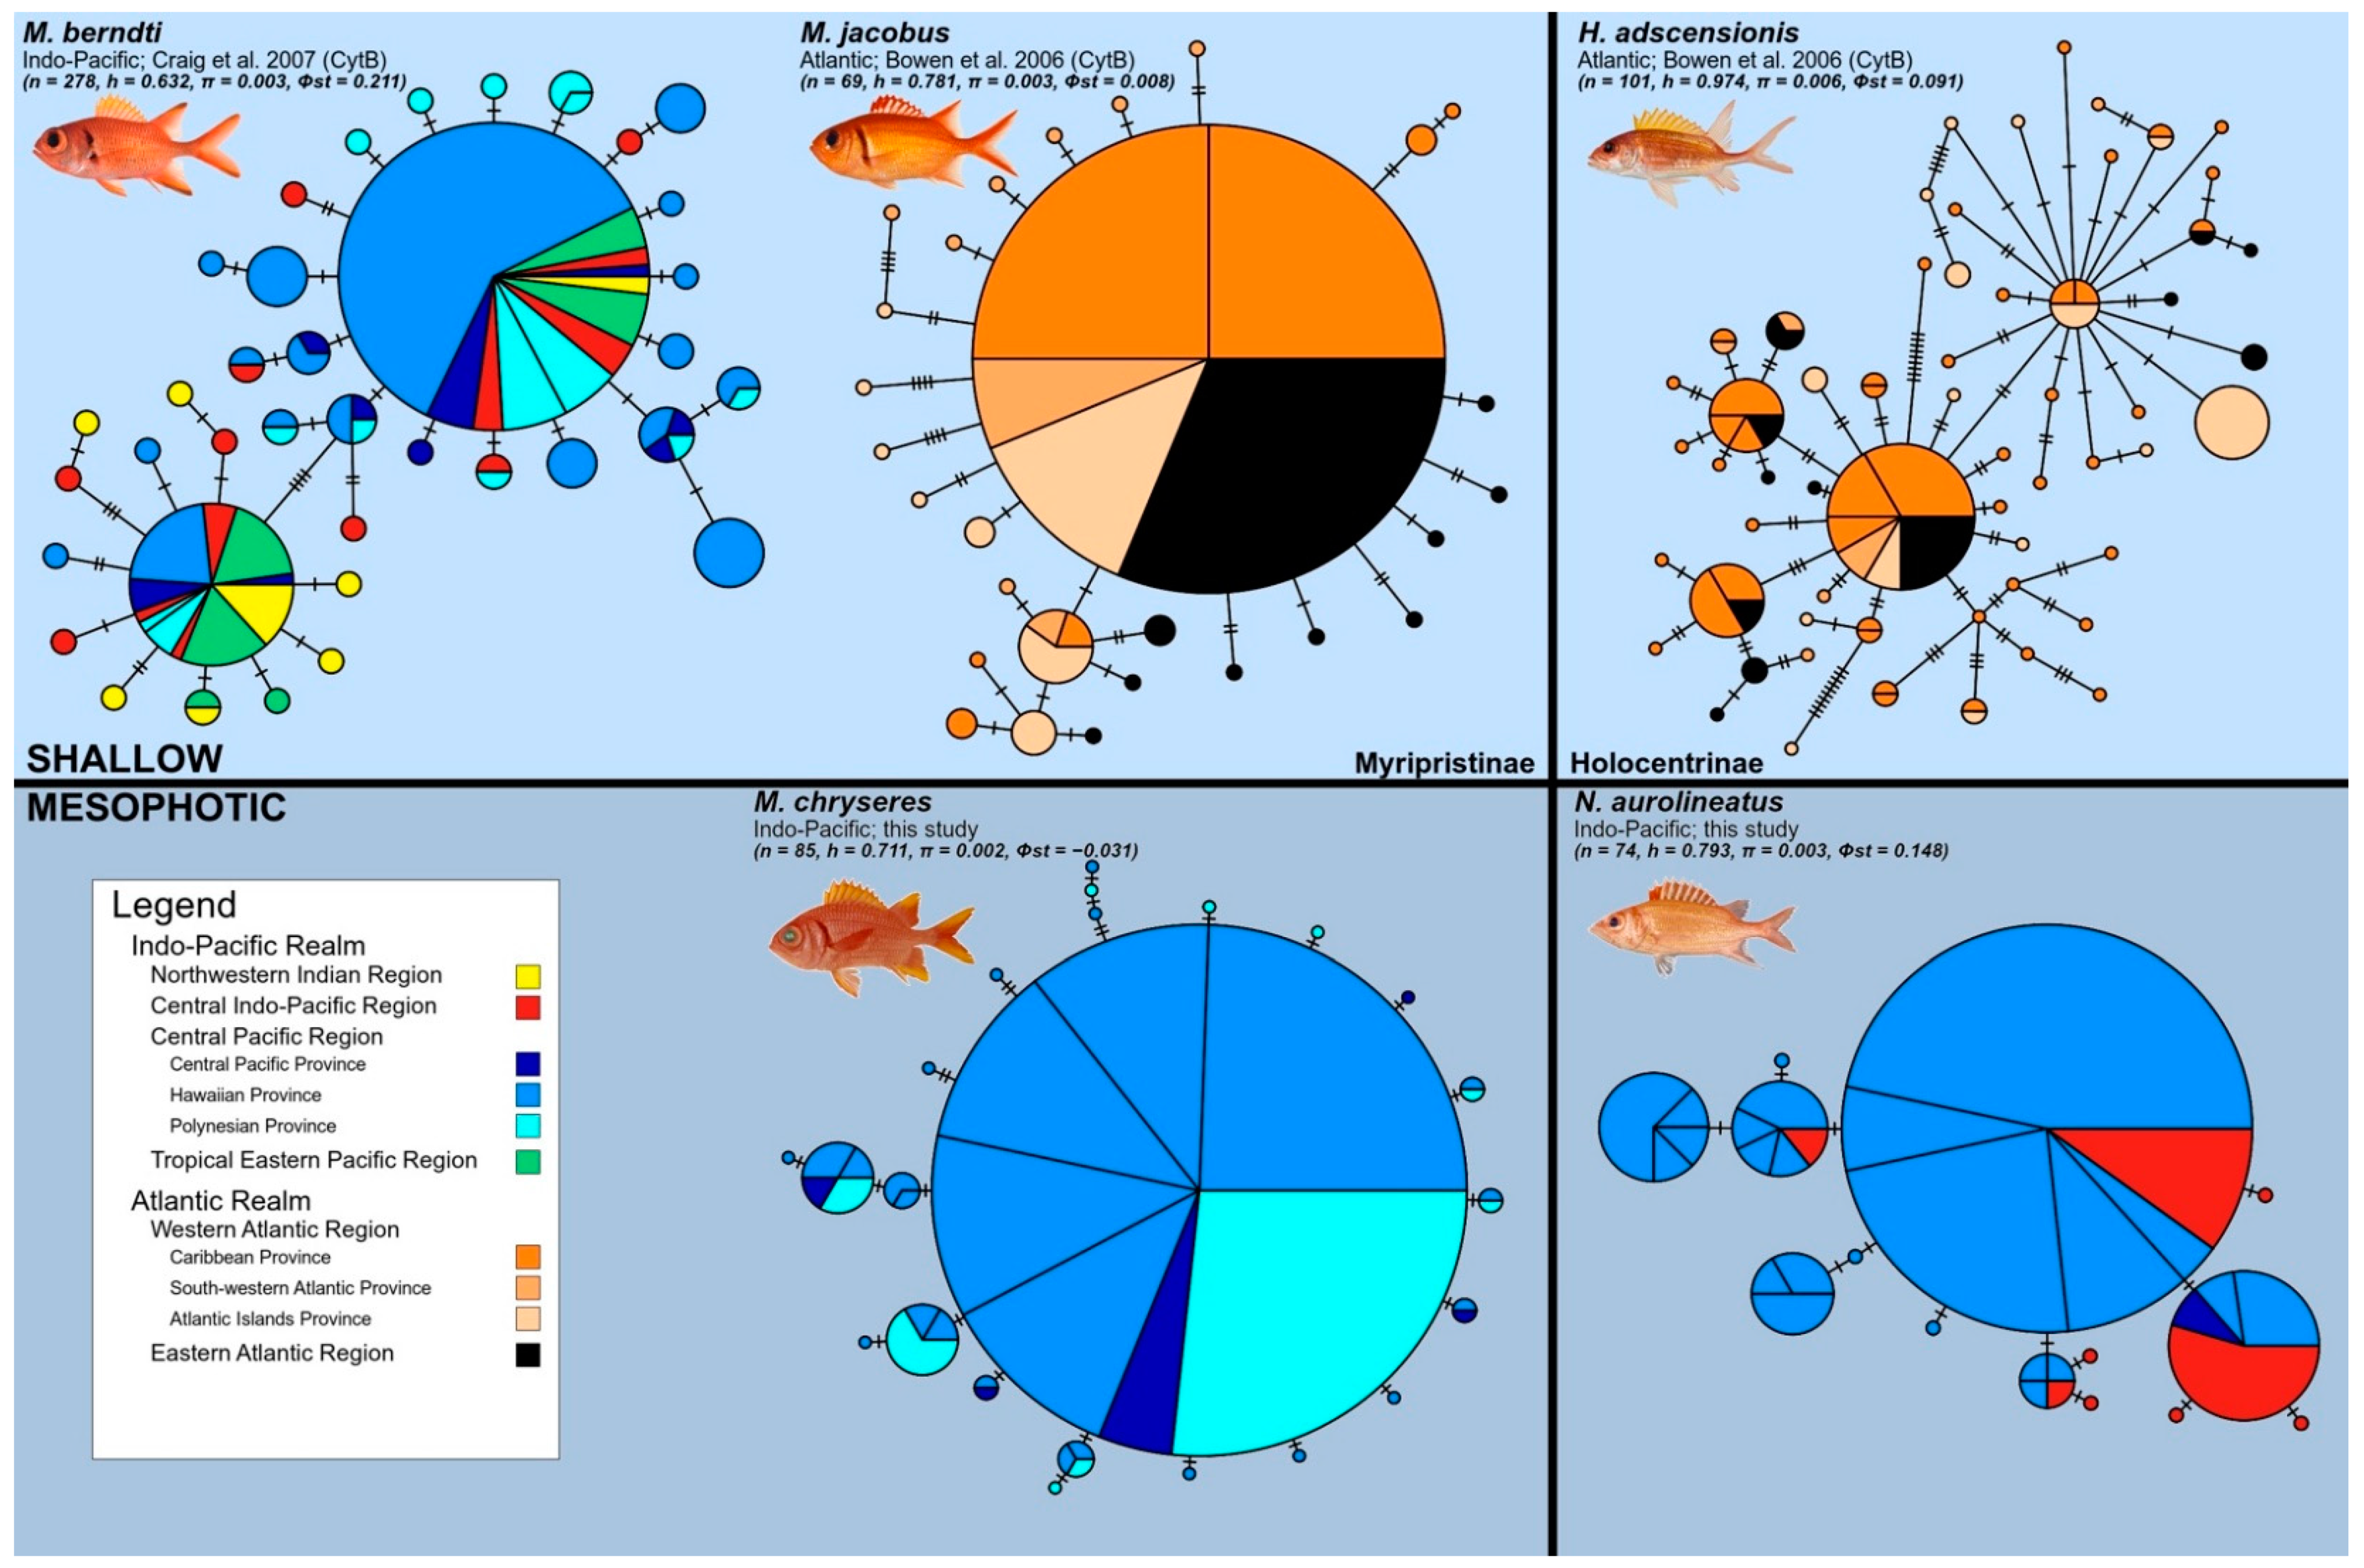
4.1. Comparisons to Shallow Holocentrids

Prior to comparing our results with those of the shallow holocentrids, three caveats must be addressed. First, we are comparing conclusions based on COI sequences to previous studies using cytb sequences. We ran our analyses using both the same mutation rate as previous studies, as well as one estimated for COI based on transisthmian geminate species pairs, with no substantial difference in results. Thus, we feel that qualitative comparisons are justified. A second concern is that range sizes vary among the five holocentrids, and this could affect estimates of genetic diversity and coalescence times. Both are expected to increase with range size if that equates to increased population size. We partially correct for this by reporting values for M. berndti over both the entire range and the restricted Pacific range we surveyed for the mesophotic holocentrids in this study. Third, we lacked the resources to survey M. chryseres and N. aurolineatus through the Indian Ocean, so these are not range-wide surveys. However, the comparison of coalescence values for the entire range of M. berndti (448,000 years) versus the restricted Pacific range (441,000 years) indicates that conclusions about recent coalescence are robust.
Members of the Holocentridae family comprise about 83 species, most with depth ranges in the upper 100 m [74]. Pelagic larval duration is generally 40–60 days, however PLD can be a poor predictor of dispersal [4,75]. Forecasts of dispersal capability are further confounded because this family may have a post-larval pelagic phase, a unique ‘rhynchichthys’ juvenile stage that is characterized by extreme cranial supination [34]. This post-larval stage has potential to considerably extend the pelagic duration and dispersal capability of holocentrid fishes. Furthermore, holocentrid larvae are much larger than those of other reef fishes, and size may be a good predictor of swimming ability [76]. Overall, squirrelfishes and soldierfishes seem well equipped for extensive dispersal, but we caution that the two sub-families, Myripristinae and Holocentrinae, diverged early in the history of the family, at about 55 million years BP [31,77,78]. Certainly, sufficient time has passed to evolve alternative life histories and dispersal strategies, although if the larvae of both shallow and deep-specialist species (within their respective sub-families) behave similarly, they may be found in the same parts of the water column and therefore experience similar dispersal outcomes. Here, we show that the deep soldierfish M. chryseres and the deep squirrelfish N. aurolineatus have phylogeographic patterns that are fundamentally the same as shallow members of their sub-families.
Myripristis berndti occurs throughout the tropical Indo-Pacific basin from Africa to the Americas [79]. While this species may occur to at least 160 m depth, it is primarily a shallow-water reef fish [80]. Preliminary examination of M. berndti otoliths indicates a PLD of about 55 days (B. Victor unpubl. data). A range-wide mtDNA survey revealed population structure at the largest scale, between the Indian Ocean and the West Pacific (ΦST = 0.583, p < 0.001) and between the Central and East Pacific (ΦST = 0.278, p < 0.001) [32]. Each of these ocean basins is separated by substantial but semi-permeable biogeographic barriers [54,81].
Myripristis jacobus inhabits all major biogeographic provinces of the tropical Atlantic, including the Caribbean, Brazil, mid-Atlantic ridge, and the Gulf of Guinea. The PLD for this species is estimated at 40–58 days [34]. This species may occur to depths of 210 m, but is primarily found at 2–35 m [82]. A range-wide survey of mtDNA cytb revealed no detectable population structure across the tropical Atlantic (ΦST = 0.008, p = 0.228) [33].
Holocentrus adscensionis inhabits a tropical Atlantic range similar to M. jacobus, with a reported PLD of 43–56 days, approximately the same as the other squirrelfish [34]. However, members of the Holocentrus genus have an additional ‘‘meeki’’ stage after the rhynchichthys stage, extending the pelagic duration to about 71 days, the longest of the holocentrids examined here. It is reported to depths of 180 m, but primarily occurs in the shallow range of 8–30 m [83]. Despite a pelagic duration about 22% longer than the co-distributed M. jacobus, this species had significant population partitions between the eastern, central (mid-Atlantic ridge), and western Atlantic (ΦST = 0.091, p < 0.001) based on cytb sequences [33].
How do these five species compare in mtDNA diversity and coalescence times (Table 3)?
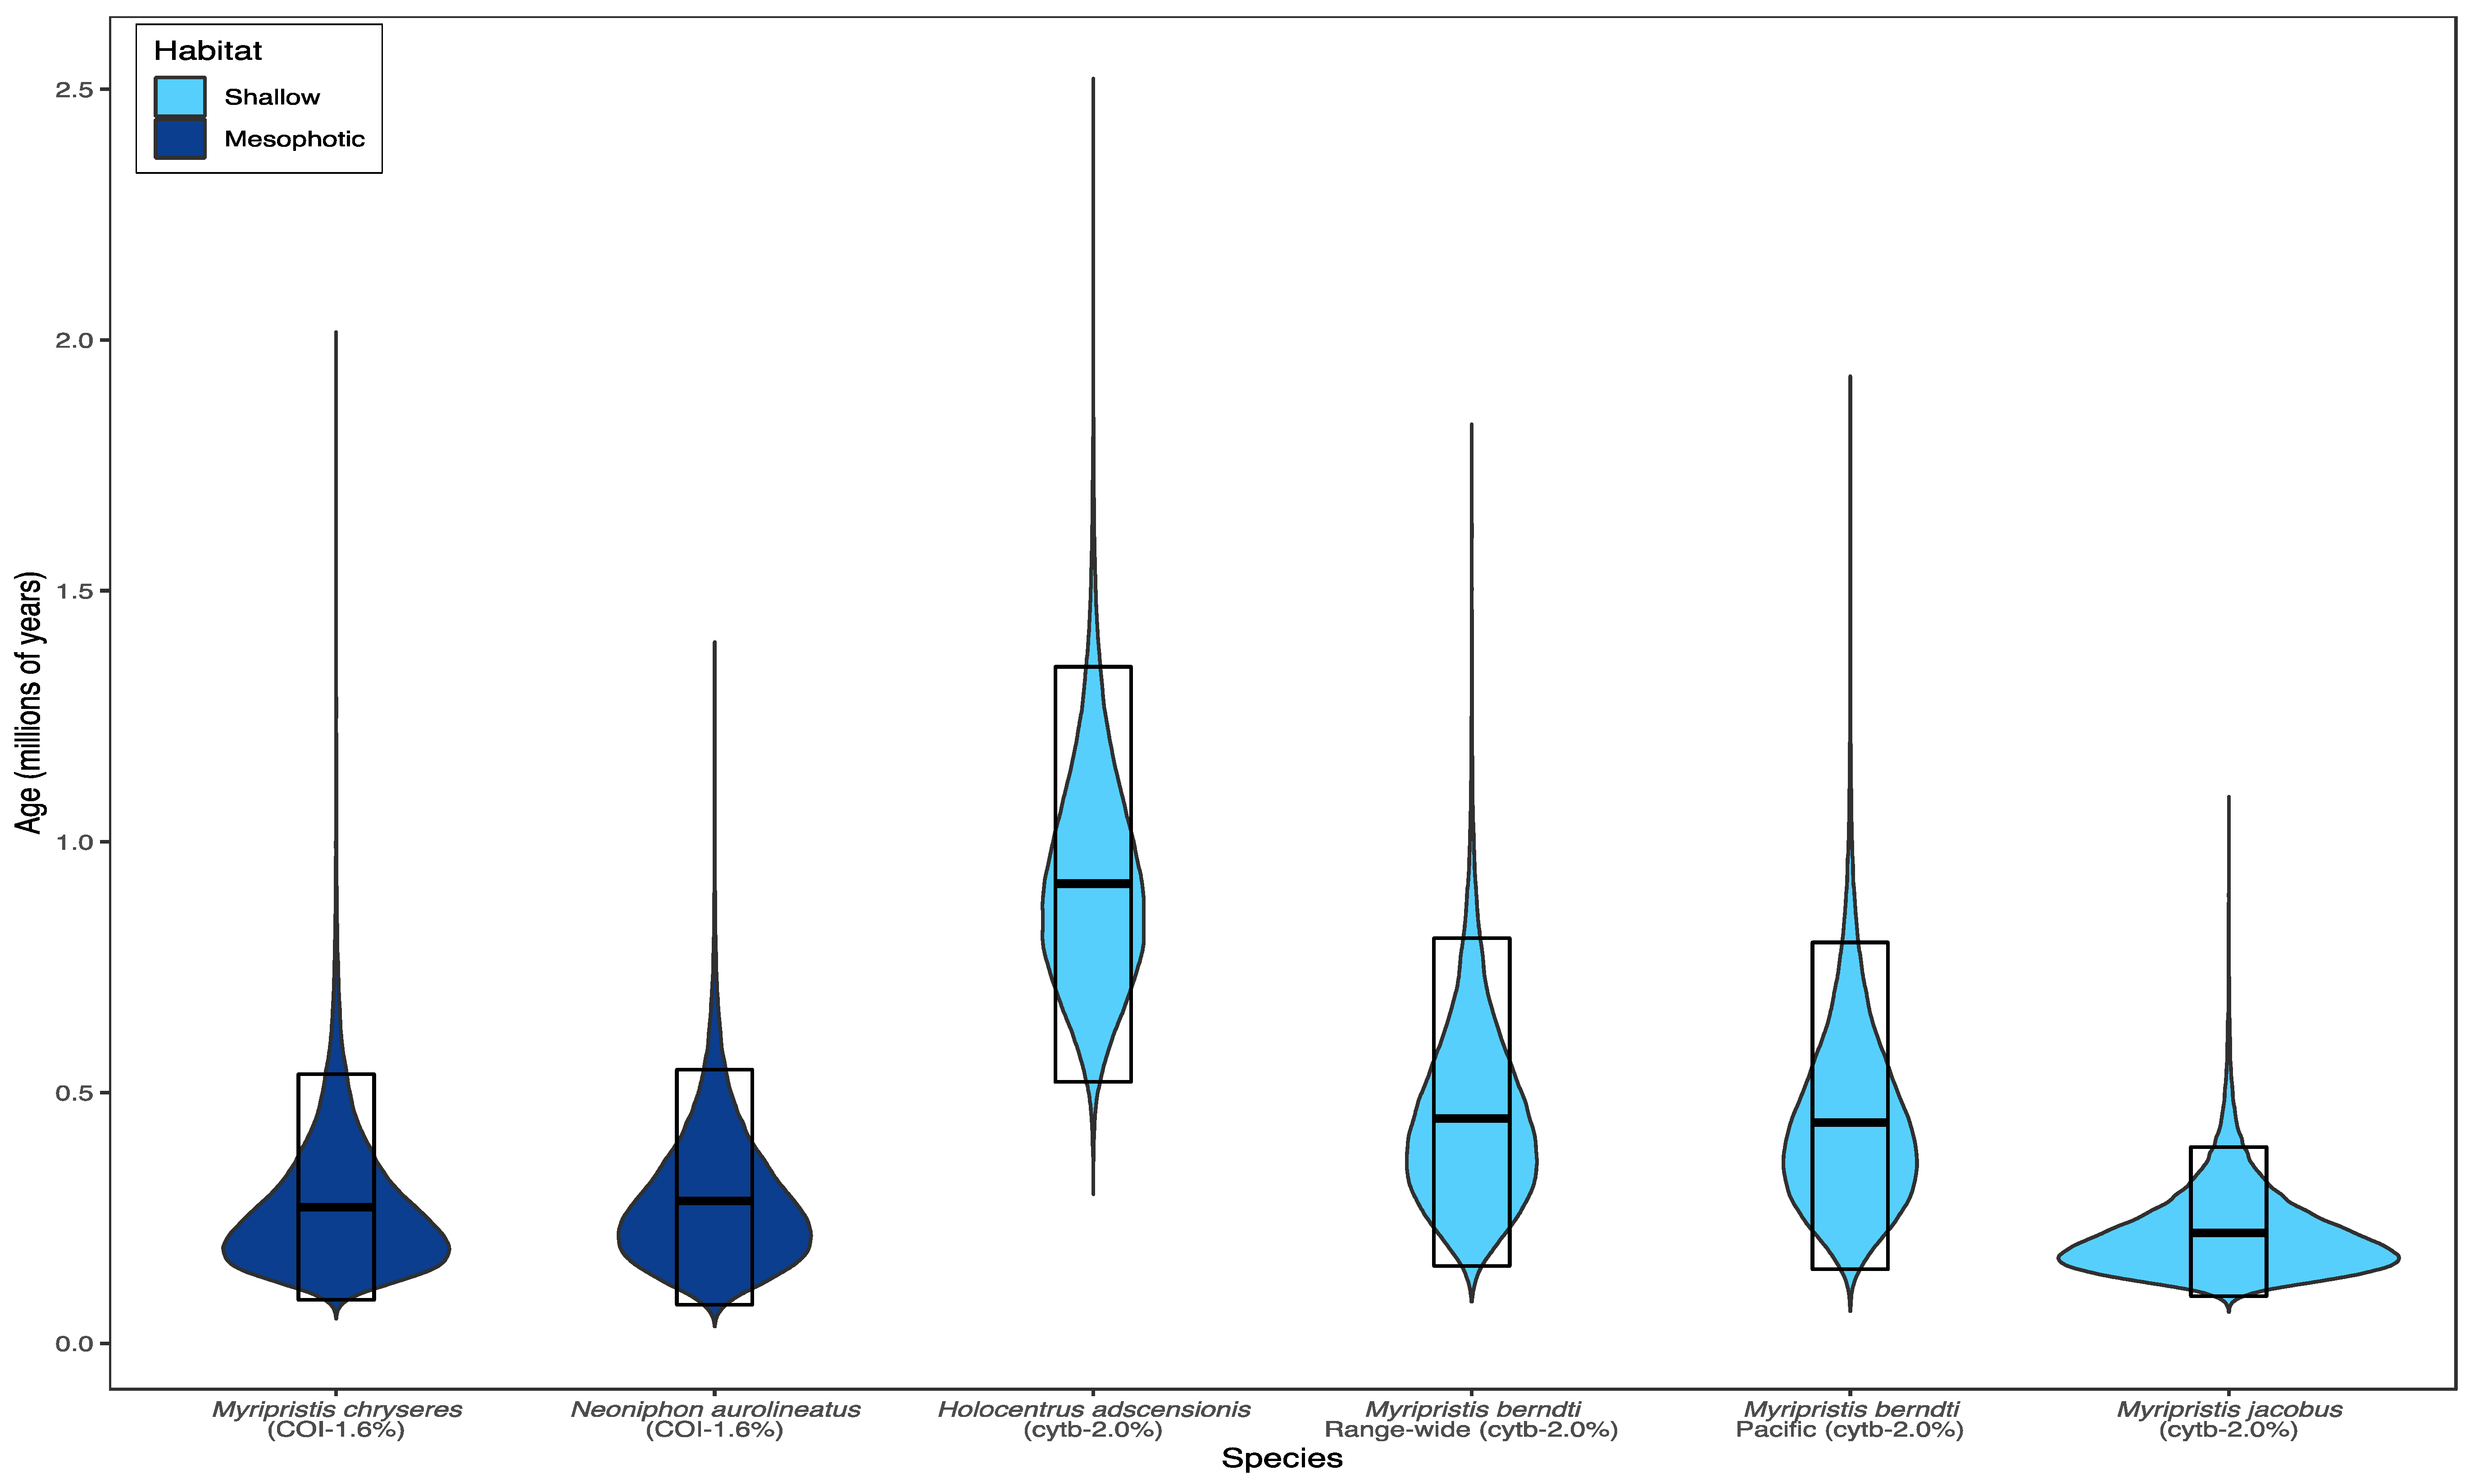
  • M. berndti in the Indo-Pacific has haplotype diversity h = 0.632, nucleotide diversity π = 0.003, a range-wide coalescence at ~448,000 years (95% HPD: 154,000–807,000 years), and a restricted Pacific coalescence of ~441,000 years (95% HPD: 144,000–799,000 years), based on cytb sequences [32].
  • M. jacobus in the Atlantic has h = 0.781, π = 0.003, and a coalescence at ~220,000 years (95% HPD: 94,000–391,000 years), based on cytb sequences [33].
  • M. chryseres in the mesophotic Pacific has h = 0.712, π = 0.0024, and a coalescence at 272,000 years (95% HPD: 87,000–537,000 years), based on COI sequences (present study)
  • H. adscensionis in the Atlantic has h = 0.974, π = 0.006, and a coalescence at ~917,000 years (95% HPD: 521,000–1.3 M years), based on cytb sequences [33].
  • N. aurolineatus in the mesophotic Pacific has h = 0.793, π = 0.0028, and a coalescence at 284,000 years (95% HPD: 77,000–546,000 years), based on COI sequences (present study).
In four out of five cases, the mtDNA haplotype networks included one or two abundant haplotypes that occur at most or all locations, centrally located in a network of low-frequency haplotypes that differ by one or two mutations from the common haplotype (the exception is H. adscensionis, see below). The commonality of this outcome across deep and shallow lineages contradicts predictions of older, stabler habitats in the mesophotic realm.
The squirrelfish H. adscensionis is the only species in our study to have a more complex mtDNA network, with more than two high-frequency haplotypes (Figure 5). While explanations could include differences in mutation rate or effective population size (Ne), we note that this fish had the highest population structure observed in the Atlantic. Less dispersive fishes usually have more complex networks, a trend that reaches an apex in freshwater fishes, e.g., [84,85]. Coalescence analysis also recovered an older origin for this species in comparison to the other four (~917,000 vs. 219,000–434,000 years), which could lead to greater haplotype diversity over time. Thus, we propose that despite longer PLD, lower dispersal and greater age may be at least part of the explanation for the more complex network in H. adscensionis.
Across the other shallow species we compared, population structure is low, and, in one case (M. jacobus in the tropical Atlantic), non-existent across their surveyed ranges. Myripristis berndti has population structure on the scale of the Indian versus the Pacific Ocean, but not on the scale of the Central-West Pacific (as for the mesophotic M. chryseres of this study). We provisionally conclude that mesophotic fishes are neither more nor less dispersive than shallow-water species, a finding that requires additional studies to verify or reject.

4.2. Age and Stability of Mesophotic Populations

The mesophotic squirrelfish and soldierfish we surveyed have population characteristics that are similar to their shallow-water counterparts. Copus et al. [26] formally proposed the habitat persistence hypothesis, which posits that reef communities below the depths affected by glacio-eustatic sea level fluctuations, and perhaps beyond the reach of storm surges, may have older, more stable populations. Our data do not support the prediction of older and more stable populations on mesophotic reefs. To the contrary, coalescence times in the MCE fishes are shorter than or comparable to their shallow-water counterparts. Part of the explanation may be that mesophotic reefs are still within the grasp of shallow-water perturbations. Rocha et al. [24] observed evidence of storm disturbance down to 135 m on mesophotic reefs in the Bahamas (see also [86]). However, we discount the ‘not deep enough’ explanation for shallow coalescence, because the same shallow coalescence was observed in four snappers (Lutjanidae family) that dwell below the mesophotic zone > 200 m; [20,21]. Therefore, recent coalescence seems to be a nearly ubiquitous feature of marine fishes. Previous explanations focused on the possibility of unstable and bottlenecked populations through time [28]. However, shallow coalescence and unstable Ne through time can result from several different processes that may not be easily distinguishable (or mutually exclusive) using single locus markers (e.g., mtDNA) over evolutionary time. Thus, the finding that shallow and MCE squirrelfish species have similar population histories prompts us to search for alternate explanations.
Strong selection can cause a decrease in genetic diversity that may erase the signature of previous demographic stability, but this process operates at the population genetic level [87] and is therefore unlikely to be the primary cause of shallow coalescence across diverse groups of marine fishes and invertebrates [88] on its own. On the other hand, reproductive strategies that are shared across diverse taxa tend to influence levels of Ne and genetic diversity in similar ways. The r-selected strategy of most marine organisms (fishes included), wherein hundreds or thousands of eggs and larvae are produced, but very few survive to reproductive maturity, yields a small Ne relative to the actual number of spawning adults. Ne is based on the harmonic means of reproducing individuals [89], and is strongly affected by occasional ‘drought’ periods of low reproductive success [90,91]. The r-selected strategy, combined with high variance in reproductive success, in which a few individuals produce most of the next generation [92], could explain the shallow mtDNA coalescence in marine fishes, without having to invoke demographic changes (bottlenecks) and selective forces caused by glacial sea level changes.

5. Conclusions

Based on one of the first phylogeographic surveys of fish species in MCE habitats, these communities have population histories that are concordant with shallow-water species in the same taxonomic family. Results do not support the habitat persistence hypothesis for MCEs. However, this finding must be regarded as preliminary until more species and more loci are surveyed. Every holocentrid species surveyed to date shows extensive dispersal capacity (with population structure being relevant at the scale of ocean basins) and coalescence in recent evolutionary history. The data from fishes in coastal habitats [28], pelagic denizens [10], mesophotic fishes (current study), and submesophotic snappers [20,21] all indicate that shallow population histories are a ubiquitous feature of marine fishes.

Supplementary Materials

The following supporting information can be downloaded at: https://www.mdpi.com/article/10.3390/d14080691/s1. Table S1. Coalescence estimates for all species examined in this study, including Myripristis berndti, M. jacobus, Neoniphon adscensionis (shallow reefs), and M. chryseres and N. aurolineatus (deep reefs). For specimens where COI was sequenced, results are presented for both 1.6% and 2.0% mutation rates. Figure S1. Baysian skyline plots for five species of holocentrid fishes, including Myripristis berndti, M. jacobus, Neoniphon adscensionis (shallow reefs), and M. chryseres and N. aurolineatus (deep reefs).

Author Contributions

Conceived and designed the project, J.M.C., R.L.P., R.K.K. and B.W.B.; performed field work, J.M.C., R.L.P. and R.K.K.; performed lab work, J.M.C. and A.M.L.; analyzed and interpreted data, J.M.C., C.A.J.W., M.L.H., R.J.T. and B.W.B.; constructed figures and tables, C.A.J.W. and M.L.H.; wrote the paper, J.M.C., C.A.J.W., M.L.H., R.J.T. and B.W.B. All authors have read and agreed to the published version of the manuscript.

Funding

This project was funded by the NOAA National Marine Sanctuaries Program (http://sanctuaries.noaa.gov accessed on 14 July 2022) MOA grant 2005-008/66882 (R.J.T.), Hawai‘i Sea Grant (http://seagrant.soest.hawaii.edu/ accessed on 14 July 2022) NA05OAR4171048 (B.W.B.), National Science Foundation Grant OCE-1558852 (B.W.B.), National Geographic Pristine Seas Program (B.W.B. and R.J.T.). C.A.J.W. was funded by a doctoral postgraduate scholarship (PGSD3-545810-2020) from the Natural Sciences and Engineering Research Council of Canada (NSERC).

Institutional Review Board Statement

All specimens were collected under permits of the host state or country, as required. Collections in the state of Hawai‘i were made under special activities permits issued by the State of Hawai‘i Division of Aquatic Resources, and permits PMNM-2012-045, PMNM-2014-031, PMNM-2015-030, and PMNM-2018-031 from Papahānaumokuākea Marine National Monument. Specimen collections followed University of Hawai‘i IACUC protocols 09-753-6 and 15–2271-3.

Data Availability Statement

Sequence data for the mesophotic species, Yellowfin Soldierfish Myripristis chryseres and the Yellowstriped Squirrelfish Neoniphon aurolineatus, are available in GenBank under accession numbers ON998515–ON998673. GenBank accession numbers for previously published sequence data are available in the original papers.

Acknowledgments

Mahalo to Richard Coleman, Brian Greene, Corinne Kane, Jason Leonard, Ken Longenecker, Keolohilani Lopes, Anthony Montgomery, Yannis Papastamatiou, David Pence, Kim Tenggardjaja, Wesley Toller, Daniel Wagner, Rob Whitton, and the crew of the R.V. Hi‘ialakai for assistance with specimen collections and field work. We thank Matthew Craig, D. Ross Robertson, Jeff Eble, and the Papahānaumokuākea Marine National Monument for logistical support. Mahalo to the ToBo Lab at the Hawai’i Institute of Marine Biology for discussion and support. Thanks to two anonymous reviewers for helpful comments that improved the clarity of this manuscript. This is contribution #1900 from the Hawai’i Institute of Marine Biology, UNIHISEAGRANT JC-18-28 from the University of Hawai’i Sea Grant Program, and #11555 from the School of Ocean and Earth Science and Technology. This paper is funded in part by a grant/cooperative agreement from the National Oceanic and Atmospheric Administration, Project R/HE-31, which is sponsored by the University of Hawaii Sea Grant College Program, SOEST, under Institutional Grant No. NA18OAR4170076 from NOAA Office of Sea Grant, Department of Commerce. The views expressed herein are those of the authors and do not necessarily reflect the views of NOAA or any of its subagencies.

Conflicts of Interest

The authors declare no conflict of interest.

References

  1. Riginos, C.; Douglas, K.E.; Jin, Y.; Shanahan, D.F.; Treml, E.A. Effects of Geography and Life History Traits on Genetic Differentiation in Benthic Marine Fishes. Ecography 2011, 34, 566–575. [Google Scholar] [CrossRef]
  2. White, C.; Selkoe, K.A.; Watson, J.; Siegel, D.A.; Zacherl, D.C.; Toonen, R.J. Ocean Currents Help Explain Population Genetic Structure. Proc. R. Soc. B Biol. Sci. 2010, 277, 1685–1694. [Google Scholar] [CrossRef] [PubMed] [Green Version]
  3. Toonen, R.J.; Andrews, K.R.; Baums, I.B.; Bird, C.E.; Concepcion, G.T.; Daly-Engel, T.S.; Eble, J.A.; Faucci, A.; Gaither, M.R.; Iacchei, M.; et al. Defining Boundaries for Ecosystem-Based Management: A Multispecies Case Study of Marine Connectivity across the Hawaiian Archipelago. J. Mar. Biol. 2011, 2011, e460173. [Google Scholar] [CrossRef] [PubMed]
  4. Selkoe, K.A.; Gaggiotti, O.E.; Laboratory, T.; Bowen, B.W.; Toonen, R.J. Emergent Patterns of Population Genetic Structure for a Coral Reef Community. Mol. Ecol. 2014, 23, 3064–3079. [Google Scholar] [CrossRef] [Green Version]
  5. Timm, J.; Figiel, M.; Kochzius, M. Contrasting Patterns in Species Boundaries and Evolution of Anemonefishes (Amphiprioninae, Pomacentridae) in the Centre of Marine Biodiversity. Mol. Phylogenetics Evol. 2008, 49, 268–276. [Google Scholar] [CrossRef]
  6. Barber, P.H.; Cheng, S.H.; Erdmann, M.V.; Tenggardjaja, K. Ambariyanto Evolution and Conservation of Marine Biodiversity in the Coral Triangle: Insights from Stomatopod Crustacea. In Phylogeography and Population Genetics in Crustacea; CRC Press: Boca Raton, FL, USA, 2011; ISBN 9780429064067. [Google Scholar]
  7. Carpenter, K.E.; Barber, P.H.; Crandall, E.D.; Ablan-Lagman, M.A.; Carmen, A.; Mahardika, G.N.; Manjaji-Matsumoto, B.M.; Juinio-Meñez, M.A.; Santos, M.D.; Starger, C.J.; et al. Comparative Phylogeography of the Coral Triangle and Implications for Marine Management. J. Mar. Biol. 2010, 2011, e396982. [Google Scholar] [CrossRef]
  8. Gaither, M.R.; Rocha, L.A. Origins of Species Richness in the Indo-Malay-Philippine Biodiversity Hotspot: Evidence for the Centre of Overlap Hypothesis. J. Biogeogr. 2013, 40, 1638–1648. [Google Scholar] [CrossRef]
  9. Bowen, B.W.; Gaither, M.R.; DiBattista, J.D.; Iacchei, M.; Andrews, K.R.; Grant, W.S.; Toonen, R.J.; Briggs, J.C. Comparative Phylogeography of the Ocean Planet. Proc. Natl. Acad. Sci. USA 2016, 113, 7962–7969. [Google Scholar] [CrossRef] [Green Version]
  10. Graves, J.E.; McDowell, J.R. Population Structure of Istiophorid Billfishes. Fish. Res. 2015, 166, 21–28. [Google Scholar] [CrossRef]
  11. Hinderstein, L.M.; Marr, J.C.A.; Martinez, F.A.; Dowgiallo, M.J.; Puglise, K.A.; Pyle, R.L.; Zawada, D.G.; Appeldoorn, R. Theme Section on “Mesophotic Coral Ecosystems: Characterization, Ecology, and Management”. Coral Reefs 2010, 29, 247–251. [Google Scholar] [CrossRef] [Green Version]
  12. Pochon, X.; Forsman, Z.H.; Spalding, H.L.; Padilla-Gamiño, J.L.; Smith, C.M.; Gates, R.D. Depth Specialization in Mesophotic Corals (Leptoseris spp.) and Associated Algal Symbionts in Hawai’i. R. Soc. Open Sci. 2015, 2, 140351. [Google Scholar] [CrossRef] [Green Version]
  13. Hurley, K.K.C.; Timmers, M.A.; Godwin, L.S.; Copus, J.M.; Skillings, D.J.; Toonen, R.J. An Assessment of Shallow and Mesophotic Reef Brachyuran Crab Assemblages on the South Shore of O’ahu, Hawai’i. Coral Reefs 2016, 35, 103–112. [Google Scholar] [CrossRef]
  14. Pinheiro, H.T.; Shepherd, B.; Castillo, C.; Abesamis, R.A.; Copus, J.M.; Pyle, R.L.; Greene, B.D.; Coleman, R.R.; Whitton, R.K.; Thillainath, E.; et al. Deep Reef Fishes in the World’s Epicenter of Marine Biodiversity. Coral Reefs 2019, 38, 985–995. [Google Scholar] [CrossRef]
  15. Pyle, R.L.; Kosaki, R.K.; Pinheiro, H.T.; Rocha, L.A.; Whitton, R.K.; Copus, J.M. Fishes: Biodiversity. In Mesophotic Coral Ecosystems; Loya, Y., Puglise, K.A., Bridge, T.C.L., Eds.; Springer International Publishing: Cham, Switzerland, 2019; pp. 749–777. ISBN 9783319927350. [Google Scholar]
  16. Tamir, R.; Eyal, G.; Kramer, N.; Laverick, J.H.; Loya, Y. Light Environment Drives the Shallow-to-Mesophotic Coral Community Transition. Ecosphere 2019, 10, e02839. [Google Scholar] [CrossRef] [Green Version]
  17. Kahng, S.E.; Copus, J.M.; Wagner, D. Mesophotic Coral Ecosystems. In Marine Animal Forests; Springer International Publishing: Cham, Switzerland, 2017; pp. 1–22. ISBN 9783319170015. [Google Scholar]
  18. Pyle, R.L. Advanced Technical Diving. In Mesophotic Coral Ecosystems; Loya, Y., Puglise, K.A., Bridge, T.C.L., Eds.; Coral Reefs of the World; Springer International Publishing: Cham, Switzerland, 2019; pp. 959–972. ISBN 9783319927350. [Google Scholar]
  19. Ovenden, J.R.; Salini, J.; O’connor, S.; Street, R. Pronounced Genetic Population Structure in a Potentially Vagile Fish Species (Pristipomoides Multidens, Teleostei; Perciformes; Lutjanidae) from the East Indies Triangle. Mol. Ecol. 2004, 13, 1991–1999. [Google Scholar] [CrossRef]
  20. Gaither, M.R.; Jones, S.A.; Kelley, C.; Newman, S.J.; Sorenson, L.; Bowen, B.W. High Connectivity in the Deepwater Snapper Pristipomoides Filamentosus (Lutjanidae) across the Indo-Pacific with Isolation of the Hawaiian Archipelago. PLoS ONE 2011, 6, e28913. [Google Scholar] [CrossRef] [Green Version]
  21. Andrews, K.R.; Copus, J.M.; Wilcox, C.; Williams, A.J.; Newman, S.J.; Wakefield, C.B.; Bowen, B.W. Range-Wide Population Structure of 3 Deepwater Eteline Snappers across the Indo-Pacific Basin. J. Hered. 2020, 111, 471–485. [Google Scholar] [CrossRef]
  22. Baker, E.K.; Puglise, K.A.; Harris, P.T. (Eds.) Mesophotic Coral Ecosystem-A Lifeboat for Coral Reefs? The United Nations Environment Programme and GRID-Arendal: Nairobi, Kenya; Arendal, Norway, 2016; ISBN 9788277011509. [Google Scholar]
  23. Semmler, R.F.; Hoot, W.C.; Reaka, M.L. Are Mesophotic Coral Ecosystems Distinct Communities and Can They Serve as Refugia for Shallow Reefs? Coral Reefs 2017, 36, 433–444. [Google Scholar] [CrossRef]
  24. Rocha, L.A.; Pinheiro, H.T.; Shepherd, B.; Papastamatiou, Y.P.; Luiz, O.J.; Pyle, R.L.; Bongaerts, P. Mesophotic Coral Ecosystems Are Threatened and Ecologically Distinct from Shallow Water Reefs. Science 2018, 361, 281–284. [Google Scholar] [CrossRef] [Green Version]
  25. Pyle, R.L.; Copus, J.M. Mesophotic Coral Ecosystems: Introduction and Overview. In Mesophotic Coral Ecosystems; Loya, Y., Puglise, K.A., Bridge, T.C.L., Eds.; Springer International Publishing: Cham, Switzerland, 2019; pp. 3–27. ISBN 9783319927350. [Google Scholar]
  26. Copus, J.M.; Bowen, B.W.; Kosaki, R.K.; Webster, J.M. The Habitat Persistence Hypothesis: A New Perspective on the Distribution of Coral-Reef Organisms. J. Biogeogr. 2022; in review. [Google Scholar]
  27. Ludt, W.B.; Rocha, L.A. Shifting Seas: The Impacts of Pleistocene Sea-Level Fluctuations on the Evolution of Tropical Marine Taxa. J. Biogeogr. 2015, 42, 25–38. [Google Scholar] [CrossRef] [Green Version]
  28. Grant, W.; Bowen, B. Shallow Population Histories in Deep Evolutionary Lineages of Marine Fishes: Insights from Sardines and Anchovies and Lessons for Conservation. J. Hered. 1998, 89, 415–426. [Google Scholar] [CrossRef]
  29. Randall, J.E. Reef and Shore Fishes of the Hawaiian Islands; Sea Grant College Program; University of Hawai’i: Honolulu, HI, USA, 2007; ISBN 9780824826987. [Google Scholar]
  30. Dornburg, A.; Moore, J.A.; Webster, R.; Warren, D.L.; Brandley, M.C.; Iglesias, T.L.; Wainwright, P.C.; Near, T.J. Molecular Phylogenetics of Squirrelfishes and Soldierfishes (Teleostei: Beryciformes: Holocentridae): Reconciling More than 100 Years of Taxonomic Confusion. Mol. Phylogenetics Evol. 2012, 65, 727–738. [Google Scholar] [CrossRef]
  31. Dornburg, A.; Moore, J.; Beaulieu, J.M.; Eytan, R.I.; Near, T.J. The Impact of Shifts in Marine Biodiversity Hotspots on Patterns of Range Evolution: Evidence from the Holocentridae (Squirrelfishes and Soldierfishes). Evolution 2015, 69, 146–161. [Google Scholar] [CrossRef]
  32. Craig, M.T.; Eble, J.A.; Bowen, B.W.; Robertson, D.R. High Genetic Connectivity across the Indian and Pacific Oceans in the Reef Fish Myripristis Berndti (Holocentridae). Mar. Ecol. Prog. Ser. 2007, 334, 245–254. [Google Scholar] [CrossRef] [Green Version]
  33. Bowen, B.W.; Bass, A.; Muss, A.; Carlin, J.; Robertson, D. Phylogeography of Two Atlantic Squirrelfishes (Family Holocentridae): Exploring Links between Pelagic Larval Duration and Population Connectivity. Mar. Biol. 2006, 149, 899–913. [Google Scholar] [CrossRef]
  34. Tyler, J.C.; Johnson, D.G.; Brothers, E.B.; Tyler, D.M.; Smith, L.C. Comparative Early Life Histories of Western Atlantic Squirrelfishes (Holocentridae): Age and Settlement of Rhynchichthys, Meeki, and Juvenile Stages. Bull. Mar. Sci. 1993, 53, 1126–1150. [Google Scholar]
  35. Lieske, E.; Myers, R. Coral Reef Fishes: Caribbean, Indian Ocean and Pacific Ocean Including the Red Sea; Collins Pocket Guide; HarperCollins: New York, NY, USA, 1994; ISBN 9780002199742. [Google Scholar]
  36. Heemstra, P.C.; Hissmann, K.; Fricke, H.; Smale, M.J.; Schauer, J. Fishes of the Deep Demersal Habitat at Ngazidja (Grand Comoro) Island, Western Indian Ocean: Coelacanth Research. S. Afr. J. Sci. 2006, 102, 444–460. [Google Scholar] [CrossRef]
  37. Kuiter, R.H.; Tonozuka, T. Pictorial Guide to Indonesian Reef Fishes; Zoonetics: Bali, Indonesia, 2001; ISBN 9789799818805. [Google Scholar]
  38. Seutin, G.; White, B.N.; Boag, P.T. Preservation of Avian Blood and Tissue Samples for DNA Analyses. Can. J. Zool. 1991, 69, 82–90. [Google Scholar] [CrossRef]
  39. Meeker, N.D.; Hutchinson, S.A.; Ho, L.; Trede, N.S. Method for Isolation of PCR-Ready Genomic DNA from Zebrafish Tissues. BioTechniques 2007, 43, 610–614. [Google Scholar] [CrossRef]
  40. Ward, R.D.; Zemlak, T.S.; Innes, B.H.; Last, P.R.; Hebert, P.D.N. DNA Barcoding Australia’s Fish Species. Philos. Trans. R. Soc. B Biol. Sci. 2005, 360, 1847–1857. [Google Scholar] [CrossRef]
  41. Baldwin, C.C.; Mounts, J.H.; Smith, D.G.; Weigt, L.A. Genetic Identification and Color Descriptions of Early Life-History Stages of Belizean Phaeoptyx and Astrapogon (Teleostei: Apogonidae) with Comments on Identification of Adult Phaeoptyx. Zootaxa 2009, 2008, 1–22. [Google Scholar] [CrossRef]
  42. R Core Team. R: A Language and Environment for Statistical Computing; R Core Team: Vienna, Austria, 2021. [Google Scholar]
  43. Pagès, H.; Aboyoun, P.; Gentleman, R.; DebRoy, S. Biostrings: Efficient Manipulation of Biological Strings; 2021. R package version 2.64.0. Available online: https://bioconductor.org/packages/Biostrings (accessed on 14 July 2022).
  44. Paradis, E.; Schliep, K. Ape 5.0: An Environment for Modern Phylogenetics and Evolutionary Analyses in R. Bioinformatics 2019, 35, 526–528. [Google Scholar] [CrossRef]
  45. Paradis, E. Pegas: An R Package for Population Genetics with an Integrated–Modular Approach. Bioinformatics 2010, 26, 419–420. [Google Scholar] [CrossRef] [Green Version]
  46. Chen, S. Hfufs: Fu’s Fs and Strobeck’s S Calculators for Arbitrary Parameters; 2020. R package version 0.1. Available online: https://github.com/swainechen/hfufs (accessed on 14 July 2022).
  47. Aktas, C. Haplotypes: Manipulating DNA Sequences and Estimating Unambiguous Haplotype Network with Statistical Parsimony; 2020. R package version 1.1.2. Available online: https://cran.r-project.org/package=haplotypes (accessed on 14 July 2022).
  48. Benjamini, Y.; Yekutieli, D. The Control of the False Discovery Rate in Multiple Testing under Dependency. Ann. Stat. 2001, 29, 1165–1188. [Google Scholar] [CrossRef]
  49. Narum, S.R. Beyond Bonferroni: Less Conservative Analyses for Conservation Genetics. Conserv. Genet. 2006, 7, 783–787. [Google Scholar] [CrossRef]
  50. Bouckaert, R.; Heled, J.; Kühnert, D.; Vaughan, T.; Wu, C.-H.; Xie, D.; Suchard, M.A.; Rambaut, A.; Drummond, A.J. BEAST 2: A Software Platform for Bayesian Evolutionary Analysis. PLoS Comput. Biol. 2014, 10, e1003537. [Google Scholar] [CrossRef] [Green Version]
  51. Bouckaert, R.R.; Drummond, A.J. BModelTest: Bayesian Phylogenetic Site Model Averaging and Model Comparison. BMC Evol. Biol. 2017, 17, 42. [Google Scholar] [CrossRef] [Green Version]
  52. Kartavtsev, Y.P.; Lee, J.-S. Analysis of Nucleotide Diversity at the Cytochrome b and Cytochrome Oxidase 1 Genes at the Population, Species, and Genus Levels. Russ. J. Genet. 2006, 42, 341–362. [Google Scholar] [CrossRef]
  53. Tobe, S.S.; Kitchener, A.C.; Linacre, A.M.T. Reconstructing Mammalian Phylogenies: A Detailed Comparison of the Cytochrome b and Cytochrome Oxidase Subunit I Mitochondrial Genes. PLoS ONE 2010, 5, e14156. [Google Scholar] [CrossRef] [Green Version]
  54. Lessios, H.A. The Great American Schism: Divergence of Marine Organisms after the Rise of the Central American Isthmus. Annu. Rev. Ecol. Evol. Syst. 2008, 39, 63–91. [Google Scholar] [CrossRef] [Green Version]
  55. Rambaut, A.; Drummond, A.J.; Xie, D.; Baele, G.; Suchard, M.A. Posterior Summarization in Bayesian Phylogenetics Using Tracer 1.7. Syst. Biol. 2018, 67, 901–904. [Google Scholar] [CrossRef] [Green Version]
  56. Excoffier, L.; Lischer, H.E.L. Arlequin Suite Ver 3.5: A New Series of Programs to Perform Population Genetics Analyses under Linux and Windows. Mol. Ecol. Resour. 2010, 10, 564–567. [Google Scholar] [CrossRef]
  57. Lischer, H.E.L.; Excoffier, L. PGDSpider: An Automated Data Conversion Tool for Connecting Population Genetics and Genomics Programs. Bioinformatics 2012, 28, 298–299. [Google Scholar] [CrossRef] [Green Version]
  58. Wickham, H. Ggplot2: Elegant Graphics for Data Analysis; Springer: New York, NY, USA, 2016; ISBN 9783319242774. [Google Scholar]
  59. Keitt, T. ColorRamps: Builds Color Tables; 2022. R package version 2.3.1. Available online: https://cran.r-project.org/package=colorRamps (accessed on 14 July 2022).
  60. Pedersen, T.L. Patchwork: The Composer of Plots; 2020. R package version 1.1.1. Available online: https://cran.r-project.org/package=patchwork (accessed on 14 July 2022).
  61. Ooms, J. Magick: Advanced Graphics and Image-Processing in R; 2021. R package version 2.7.3. Available online: https://cran.r-project.org/package=magick (accessed on 14 July 2022).
  62. Kulbicki, M.; Parravicini, V.; Bellwood, D.R.; Arias-Gonzàlez, E.; Chabanet, P.; Floeter, S.R.; Friedlander, A.; McPherson, J.; Myers, R.E.; Vigliola, L.; et al. Global Biogeography of Reef Fishes: A Hierarchical Quantitative Delineation of Regions. PLoS ONE 2013, 8, e81847. [Google Scholar] [CrossRef]
  63. Lefèvre, A.; Lecomte-Finiger, R. Durée de La Vie Larvaire Pélagique de Deux Espèces Récifales, Stegastes Nigricans (Pomacenridae) et Neoniphon Sammara (Holocentridae) de l’île de Moorea (Polynésie Française). Cybium 1995, 19, 401–409. [Google Scholar]
  64. Voris, H.K. Maps of Pleistocene Sea Levels in Southeast Asia: Shorelines, River Systems and Time Durations. J. Biogeogr. 2000, 27, 1153–1167. [Google Scholar] [CrossRef] [Green Version]
  65. Myers, R.F. Micronesian Reef Fishes: A Comprehensive Guide to the Coral Reef Fishes of Micronesia; Coral Graphics: New York, NY, USA, 1999; ISBN 978-0-9621564-5-8. [Google Scholar]
  66. Kosaki, R.K.; Pyle, R.L.; Randall, J.E.; Irons, D.K. New Records of Fishes from Johnston Atoll, with Notes on Biogeography. Ph.D. Thesis, University of Hawai‘i at Mānoa, Honolulu, HI, USA, 1991. [Google Scholar]
  67. Fauvelot, C.; Bernardi, G.; Planes, S. Reductions in the Mitochondrial DNA Diversity of Coral Reef Fish Provide Evidence of Population Bottlenecks Resulting from Holocene Sea-Level Change. Evolution 2003, 57, 1571–1583. [Google Scholar] [CrossRef]
  68. Ludt, W.B.; Bernal, M.A.; Bowen, B.W.; Rocha, L.A. Living in the Past: Phylogeography and Population Histories of Indo-Pacific Wrasses (Genus Halichoeres) in Shallow Lagoons versus Outer Reef Slopes. PLoS ONE 2012, 7, e38042. [Google Scholar] [CrossRef] [Green Version]
  69. Delrieu-Trottin, E.; Brosseau-Acquaviva, L.; Mona, S.; Neglia, V.; Giles, E.C.; Rapu-Edmunds, C.; Saenz-Agudelo, P. Understanding the Origin of the Most Isolated Endemic Reef Fish Fauna of the Indo-Pacific: Coral Reef Fishes of Rapa Nui. J. Biogeogr. 2019, 46, 723–733. [Google Scholar] [CrossRef]
  70. Kimura, M. The Neutral Theory of Molecular Evolution; Cambridge University Press: Cambridge, MA, USA, 1983; ISBN 9780521317931. [Google Scholar]
  71. McDowell, J.R.; Brightman, H.L. High Level of Genetic Connectivity in a Deep-Water Reef Fish, Caulolatilus Microps. J. Fish Biol. 2018, 93, 766–777. [Google Scholar] [CrossRef] [PubMed]
  72. Baco, A.R.; Etter, R.J.; Ribeiro, P.A.; von der Heyden, S.; Beerli, P.; Kinlan, B.P. A Synthesis of Genetic Connectivity in Deep-Sea Fauna and Implications for Marine Reserve Design. Mol. Ecol. 2016, 25, 3276–3298. [Google Scholar] [CrossRef] [PubMed]
  73. Tenggardjaja, K.A.; Bowen, B.W.; Bernardi, G. Vertical and Horizontal Genetic Connectivity in Chromis Verater, an Endemic Damselfish Found on Shallow and Mesophotic Reefs in the Hawaiian Archipelago and Adjacent Johnston Atoll. PLoS ONE 2014, 9, e115493. [Google Scholar] [CrossRef] [Green Version]
  74. Nelson, J.S.; Grande, T.C.; Wilson, M.V.H. Fishes of the World; Wiley: Hoboken, NJ, USA, 2016; ISBN 9781119220824. [Google Scholar]
  75. Weersing, K.; Toonen, R.J. Population Genetics, Larval Dispersal, and Connectivity in Marine Systems. Mar. Ecol. Prog. Ser. 2009, 393, 1–12. [Google Scholar] [CrossRef] [Green Version]
  76. Bellwood, D.R.; Fisher, R. Relative Swimming Speeds in Reef Fish Larvae. Mar. Ecol. Prog. Ser. 2001, 211, 299–303. [Google Scholar] [CrossRef]
  77. Greenfield, D.W. Revision of the Squirrelfish Genus Myripristis Cuvier (Pisces: Holocentridae). Sci. Bull. Nat. Hist. Mus. Los Angeles Co. 1974, 19, 1–54. [Google Scholar]
  78. Rabosky, D.L.; Chang, J.; Title, P.O.; Cowman, P.F.; Sallan, L.; Friedman, M.; Kaschner, K.; Garilao, C.; Near, T.J.; Coll, M.; et al. An Inverse Latitudinal Gradient in Speciation Rate for Marine Fishes. Nature 2018, 559, 392–395. [Google Scholar] [CrossRef]
  79. Randall, J.E.; Greenfield, D.W. Revision of the Indo-Pacific Holocentrid Fishes of the Genus Myripristis, with Descriptions of Three New Species. Indo-Pac. Fish. 1996, 25, 1–61. [Google Scholar]
  80. Chave, E.H.; Mundy, B.C. Deep-Sea Benthic Fish of the Hawaiian Archipelago, Cross Seamount, and Johnston Atoll. Oceanogr. Lit. Rev. 1995, 6, 486. [Google Scholar]
  81. Briggs, J.C.; Bowen, B.W. A Realignment of Marine Biogeographic Provinces with Particular Reference to Fish Distributions. J. Biogeogr. 2012, 39, 12–30. [Google Scholar] [CrossRef]
  82. Gasparini, J.L.; Floeter, S.R. The Shore Fishes of Trindade Island, Western South Atlantic. J. Nat. Hist. 2001, 35, 1639–1656. [Google Scholar] [CrossRef]
  83. Wyatt, J. The Biology, Ecology and Bionomics of the Squirrelfishes, Holocentridae. In Caribbean Coral Reef Fishery Resources; Munro, J.L., Ed.; ICLARM Stud. Rev; International Center for Living Aquatic Resources Management: Pulau Pinang, Malaysia, 1983; Volume 7, pp. 50–58. [Google Scholar]
  84. Copus, J.M.; Montgomery, W.L.; Forsman, Z.H.; Bowen, B.W.; Toonen, R.J. Geopolitical Species Revisited: Genomic and Morphological Data Indicate That the Roundtail Chub Gila Robusta Species Complex (Teleostei, Cyprinidae) Is a Single Species. PeerJ 2018, 6, e5605. [Google Scholar] [CrossRef] [PubMed]
  85. Ray, J.M.; Wood, R.M.; Simons, A.M. Phylogeography and Post-Glacial Colonization Patterns of the Rainbow Darter, Etheostoma Caeruleum (Teleostei: Percidae). J. Biogeogr. 2006, 33, 1550–1558. [Google Scholar] [CrossRef]
  86. White, K.N.; Ohara, T.; Fujii, T.; Kawamura, I.; Mizuyama, M.; Montenegro, J.; Shikiba, H.; Naruse, T.; McClelland, T.Y.; Denis, V.; et al. Typhoon Damage on a Shallow Mesophotic Reef in Okinawa, Japan. PeerJ 2013, 1, e151. [Google Scholar] [CrossRef] [PubMed]
  87. Millstein, R.L. Natural Selection as a Population-Level Causal Process. Br. J. Philos. Sci. 2006, 57, 627–653. [Google Scholar] [CrossRef] [Green Version]
  88. Taylor, M.L.; Roterman, C.N. Invertebrate Population Genetics across Earth’s Largest Habitat: The Deep-Sea Floor. Mol. Ecol. 2017, 26, 4872–4896. [Google Scholar] [CrossRef] [PubMed] [Green Version]
  89. Wright, S. Evolution in Mendelian Populations. Genetics 1931, 16, 97–159. [Google Scholar] [CrossRef]
  90. Avise, J.C. Molecular Markers, Natural History and Evolution, 2nd ed.; Sinauer Associates: Sunderland, MA, USA, 2004; ISBN 9781461523819. [Google Scholar]
  91. Hartl, D.L.; Clark, A.G. Principles of Population Genetics, 4th ed.; Sinauer and Associates: Sunderland, MA, USA, 2006; ISBN 9780878933082. [Google Scholar]
  92. Hedgecock, D.; Pudovkin, A.I. Sweepstakes Reproductive Success in Highly Fecund Marine Fish and Shellfish: A Review and Commentary. Bull. Mar. Sci. 2011, 87, 971–1002. [Google Scholar] [CrossRef]
Figure 1. Bathymetric map of sampling locations and number of specimens taken per site for Myripristis chryseres and Neoniphon aurolineatus (M. chryseres/N. aurolineatus). Main map indicates sampling sites in the Hawaiian Archipelago, inset indicates additional sample sites in the Central and West Pacific.
Diversity 14 00691 g001
Figure 2. Myripristis chryseres haplotype network. Circle sizes correspond to the frequency of each sampled haplotype. Cool colors represent samples from locations in the Hawaiian Archipelago, while warm colors represent samples from locations across the wider Indo-Pacific. Sample sizes indicated by bar graph.
Diversity 14 00691 g002
Figure 3. Violin plot comparing coalescence ages of species examined in this study, including Myripristis berndti, M. jacobus, Holocentrus adscensionis (shallow reefs), and M. chryseres and Neoniphon aurolineatus (deep reefs). Boxes indicate mean age (central bar) and 95% highest posterior density (upper and lower box borders). These include two plots for M. berndti: one for the entire Indo-Pacific range of the species, and one for the Pacific range that is comparable to the surveys for the deep-reef species, M. chryseres and N. aurolineatus.
Diversity 14 00691 g003
Figure 4. Neoniphon aurolineatus haplotype network. Circle sizes correspond to the frequency of each sampled haplotype. Cool colors represent samples from locations in the Hawaiian Archipelago, while warm colors represent samples from locations across the wider Indo-Pacific and correspond with those in Figure 2. Sample sizes indicated by bar graph.
Diversity 14 00691 g004
Figure 5. Haplotype networks for five reef-associated holocentrids organized by sub-family and depth strata, including Myripristis berndti, Myripristis jacobus, Neoniphon adscensionis (shallow), and M. chryseres and N. aurolineatus (mesophotic). Circle sizes correspond to the frequency of each sampled haplotype. Plots include ocean basin, data source, sample size, and global population genetic statistics for each sampled species. Colors correspond to biogeographic regions and provinces, as discussed in Kulbicki et al. [62], while circle segments correspond to individual sampling locations. For the M. berndti network (adapted from data in Craig et al. [32]), all Hawaiian sampling locations are grouped into the same segment and all circle sizes are square root-standardized (due to the higher sample size). Photo credits: Jeffrey Williams (M. berndti, M. jacobus, M. adscensionis), Barry Hutchins (M. chryseres), John Randall (N. aurolineatus).
Diversity 14 00691 g005
Table 1. Population genetic diversity summary statistics for Myripristis chryseres across all sampling locations (n = number of samples sequenced, S = number of segregating sites, H = number of unique haplotypes, h = haplotype diversity, π = nucleotide diversity, D = Tajima’s D, F = Fu’s F). Bold numbers indicate summary values.
LocationnSHhπDF
Manawai/Pearl and Hermes20990.7050.0020−1.969−6.279
Kapou/Lisianski6120.3330.0006−0.933−0.023
Ni‘ihau8440.6430.0022−1.030−0.914
Maui10860.7780.0039−1.161−1.756
Johnston Atoll10550.7560.0025−1.035−1.596
Pohnpei6550.9330.0031−1.337−2.526
Rarotonga2511100.7570.0026−1.781−5.732
Overall8520230.7120.0024−2.002−22.942
Table 2. Population genetic diversity summary statistics for Neoniphon aurolineatus across all sampling locations (n = number of samples sequenced, S = number of segregating sites, H = number of unique haplotypes, h = haplotype diversity, π = nucleotide diversity, D = Tajima’s D, F = Fu’s F). Bold numbers indicate summary values.
LocationnSHhπDF
Hōlanikū/Kure1-1----
Manawai/Pearl and Hermes30780.7520.0025−0.687−2.708
Pioneer Bank3220.6670.00250.0001.032
Lalo/French Frigate Shoals14660.7360.0026−0.893−1.921
Nihoa6340.8000.0022−0.447−1.466
Maui3231.0000.00250.000−1.216
Pohnpei1-1----
Luzon16790.8500.0030−0.865−5.256
Overall7412140.7930.0028−1.088−6.681
Table 3. Overview of phylogeographic comparisons among holocentrid species (h = haplotype diversity, π = nucleotide diversity).
SpeciesHabitatΦSThπAge
(Ma)
LocusRef.
M. chryseresdeep−0.0310.7120.00240.272COI-
N. aurolineatusdeep0.148 a0.7930.00280.284COI-
M. berndtishallow−0.007 b0.632 c0.003 c0.448cytb[32]
M. jacobusshallow0.0080.7810.0030.220cytb[33]
H. adscensionisshallow0.091a0.9740.0060.917cytb[33]
a Statistically significant. b Value for Central-West Pacific range only. c Values for the entire range including the East Pacific.
Publisher’s Note: MDPI stays neutral with regard to jurisdictional claims in published maps and institutional affiliations.

